Abstract
This article analyzes and compares the integration of two different maximum power point tracking (MPPT) control methods, which are tested under partial shading and fast ramp conditions. These MPPT methods are designed by Improved Particle Swarm Optimization (IPSO) and a combination technique between a Neural Network and the Perturb and Observe method (NN-P&O). These two methods are implemented and simulated for photovoltaic systems (PV), where various system responses, such as voltage and power, are obtained. The MPPT techniques were simulated using the MATLAB/Simulink environment. A comparison of the performance of the IPSO and NN-P&O algorithms is carried out to confirm the best accomplishment of the two methods in terms of speed, accuracy, and simplicity.
1. Introduction
Regarding the profitable economic benefits of a clean environment and sustainable solar energy, power generation across photovoltaic (PV) systems has recently gained great importance. However, the main disadvantage of PV systems is the low efficiency of converting sunlight into electricity [1]. In addition, the power generated by the PV module depends on environmental factors, namely solar radiation and the atmospheric temperature. These factors affect the current–voltage (I-V) and power–voltage (P-V) characteristics of the photovoltaic system. Under uniform irradiation, the P-V curve of the PV array has a maximum power point (MPP) [2]. However, in the case of uneven irradiance, such as the partial shading of certain photovoltaic modules or even certain photovoltaic cells, the PV characteristics become more complicated, showing multiple peaks, of which only one peak is the global peak (GMPP), whereas the others are local peaks (LMPP) [3].
Therefore, a control technique called “Maximum Power Point Tracking” (MPPT) must be applied to make the best use of the available power under all operating conditions [4]. So far, many MPPT controllers have been proposed and implemented in the literature [5,6]. These controllers have some common requirements, such as low complexity, low cost, minimum output power fluctuation, and the ability to quickly track when the working conditions change [7]. The most widely used algorithms are Perturbation and Observation (P&O) and Incremental Conductance (InC) [8]. These conventional methods achieve moderate performance with easy implementation and low cost. In order to obtain better transient and steady-state performance, artificial intelligence-based MPPT technologies have been proposed, such as fuzzy logic and artificial neural network controllers (ANN) [9]. ANN controllers have good performance under rapidly changing irradiance and partial shading, especially in terms of efficiency and response time [10]. The combination of two methods—ANN and fuzzy logic, which can be found in [11,12]—is used to track the MPP of PV systems. After collecting experimental data, the ANN is trained offline to define a reference voltage, that is, the absciss of the MPP. Then, the reference voltage and the instantaneous voltage are compared to refine the signal error. The signal and the change in the error are used as the FLC inputs. The FLC generates a duty cycle value for the pulse width modulation (PWM). The latter is applied for switching the boost converter, which connects the PV panels to the load. The main drawback of this method is that it needs a lot of data for training.
The Improved Particle Swarm Optimization (IPSO) method, introduced in [13], has the capacity to locate the MPP, where the positions of the PSO particles correspond to duty cycles. IPSO has high potential for MPPT due to the fast computation capability, regardless of partial shading.
The emphasis of this paper will be on theoretical comparisons between two techniques, namely the improved PSO and NN-P&O, taking partial shading conditions into account. As a result, the aim of this research is to compare two MPPT algorithms in order to determine which technique performs better. The efficiency of the algorithms is assessed using power calculation that values the total energy generated by the panel during a time interval. In the simulations, the MPPT techniques under consideration were implemented exactly as described in the references. It should be noted that a standalone photovoltaic system built by connecting the boost converter between the photovoltaic panel and a dc load is considered in this study.
2. Photovoltaic Modeling and Features
2.1. PV Panel Model
Solar cells can be illustrated using a variety of models. The single diode shown in Figure 1 is one of the most well-known circuits [14,15,16,17].
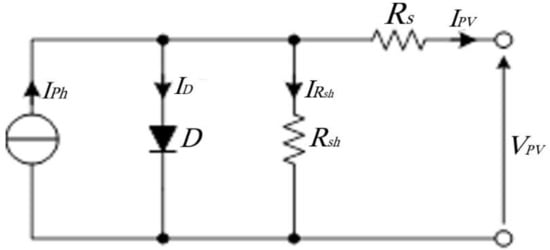
Figure 1.
PV cell model.
Equation (1) describes the relationship between the module’s output current Ipv and its voltage Vpv:
Vt is the thermal voltage:
where Iph is the light-generated current, which depends on the irradiance, G, and the cell temperature Tc; Rs is the series resistance; Rsh the shunt resistance; q is the charge of the electron; k is the Boltzmann’s constant; T is the PN junction temperature; and ns is the number of series cells in the module.
2.2. PV Characteristics
The PV module considered in this work is the polycrystalline BP Solar MSX 120, whose parameters are provided in Table 1.

Table 1.
Parameters of the BP MSX-120 panel.
This PV module comprises 72 polycrystalline silicon sunlight-based cells electrically orchestrated into four arrangement strings of 18 cells. In this work, a 72-cell arrangement setup with four bypass diodes is considered [18].
2.3. Influence of Uniform Irradiance
Under an ordinary condition, when the PV panel receives different values of uniform irradiance, the P-V curves show one MPP each, as presented in Figure 2.
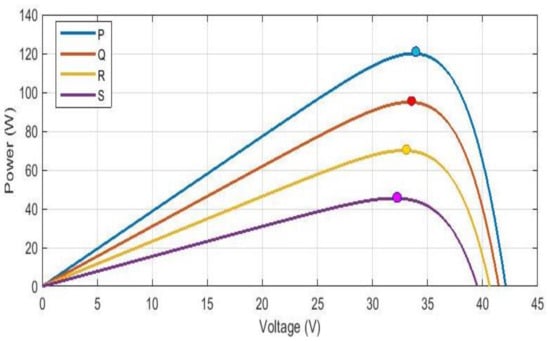
Figure 2.
P-V curves under different uniform irradiance conditions.
The MPPs composed of maximum power (Pmpp) and the optimal voltage (Vmpp) are provided in Table 2.

Table 2.
Pmpp and Vmpp values extracted under different uniform irradiances and Tc = 25 °C.
2.4. Influence of Partial Shading Condition
When partial shading happens, the shaded string of the panel will not create as much current as the unshaded strings. This downside is defeated by utilizing a bypass diode that permits the current of the unshaded cells to bypass the shaded cell. The changes in the irradiance of shading panel area (GS), which affects 25% of the panel area, and non-shading panel area (G) were established in four sets, as shown in Figure 3a,b and Table 3. Figure 3b shows that each P-V curve was characterized by two peaks designed by global MPP (GMPP) and local MPP (LMPP) [19,20,21].
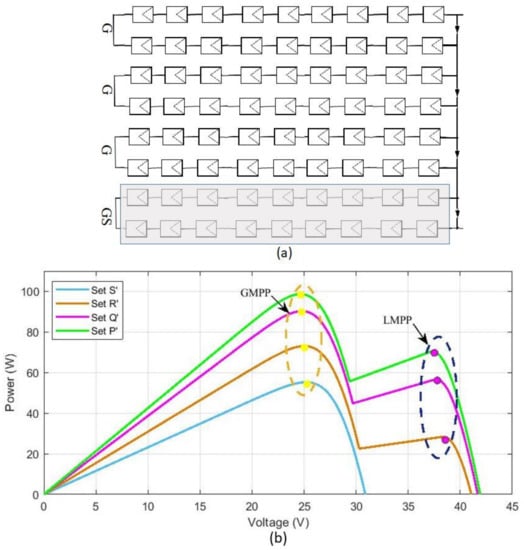
Figure 3.
(a) Partial shading affects 25% of the panel area and (b) P-V curves under different partial shading conditions.

Table 3.
MPP values extracted under different uniform irradiances.
3. MPPT Control Techniques
The output power characteristics of PV systems vary with irradiance, temperature, and partial shading conditions in a non-linear manner [22]. In this case, the MPP of the PV array will change continuously. Therefore, the operating point of the photovoltaic system must be changed to the maximum energy produced [23]. Thus, the MPPT technology was used to maintain the operating point of the PV array at its MPP [24]. There are many MPPT techniques available in the literature; the methods considered in this work are described in the following sections.
3.1. IPSO Method
The Improved PSO (IPSO) algorithm, called cooperative particles, consists of solving the problem of nonlinear system optimization using a group of Np particles (Pi)2≤i≤Np. This technique is based on six steps [25,26,27,28].
- Step 1:
- Initialize the Np, w, α, and β parameters, which are integrated in Equation (3).
- Step 2:
- Initialize the k-th iteration and the index of the i-th particle at 1.
- Step 3:
- If k Np, the command that will be generated by i-th particle is determined by applying Equation (4).
If k > Np, the algorithm selects the i-th particle, which satisfies the following condition: the division remainder of (k-i) by Np is equal to 0, in order to complete the step and the new duty cycle Di using the following equation.
where is the new position and is the actual position.
- Step 4:
- Send the command U = Di to the boost converter. Measure the voltage Vpv and current Ipv to calculate the output power that corresponds to the i-th particle.
- Step 5:
- The i-th particle must update its own best duty cycle, which is designated DPBesti. Moreover, it is necessary to compare the best powers generated by Np particles during k iteration in order to update DGbest generated by the leader particle.
- Step 6:
- If the convergence of each duty cycle produced by particle i to DGbest is not reached yet, k is increased by 1, and return to step 3. If DGbest is reached by all the particles, that is to say (DPbesti)1≤i≤Np = DGbest, then the converter must be operating in a regular way with this optimal duty cycle until a change in the environmental conditions occurs, which causes the return to step 2 for tracking the new MPP.
These steps are summarized in the following flowchart (Figure 4):
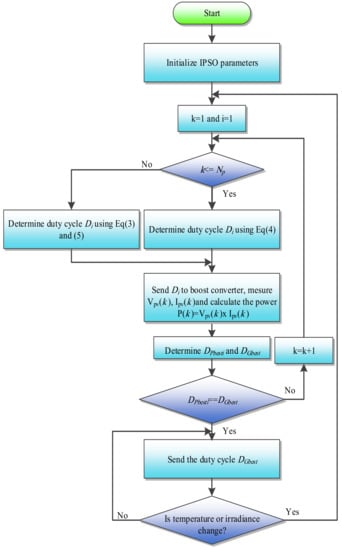
Figure 4.
Flowchart of the IPSO-based MPPT algorithm.
3.2. NN-P&O Method under Partial Shading Conditions
In order to keep the power level at the peak state and improve the energy efficiency, no matter how the environment changes, the NN-P&O technique based on the two controllers, the Neural Network (NN) and Perturb and Observe (P&O) methods, was simulated. The selected structure of the NN-P&O includes three simple layers: input, hidden, and output layers. The input layer has two nodes, the hidden layer has eight nodes, and the output layer has one node, as illustrated in Figure 5.
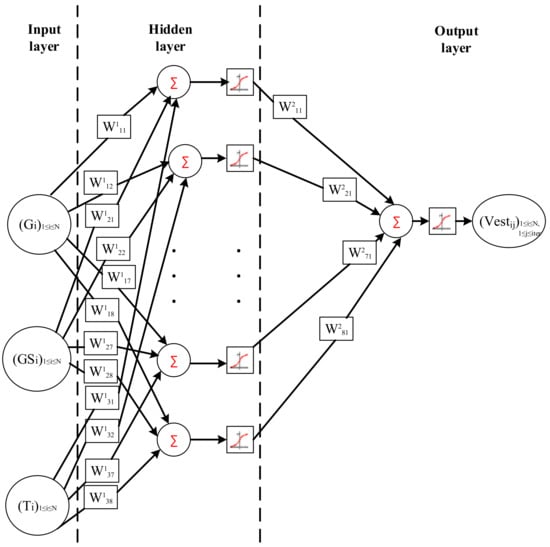
Figure 5.
Configuration of the utilized NN under partial shading.
The main idea of the NN-P&O algorithm is using the NN controller to predict the voltage value during the variation in irradiation in the shaded and non-shaded areas, respectively; and are different to zero. Otherwise, the P&O method involves a very small step size to reach the MPP. This algorithm is presented in a flowchart (Figure 6).
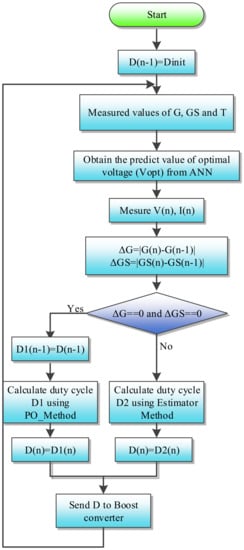
Figure 6.
Flowchart of the NN-P&O method.
4. Simulation Results under Various Atmospheric Conditions
In order to reveal the characteristics of the NN-P&O and the IPSO methods, different environmental conditions were adopted and applied to the PV system.
4.1. Results and Discussion under Shading
To check the success of the NN-P&O and IPSO techniques, the two algorithms were tested in the MATLAB/Simulink environment under shading, as exhibited in Figure 3 and Table 3. The simulation results are presented in Figure 7.
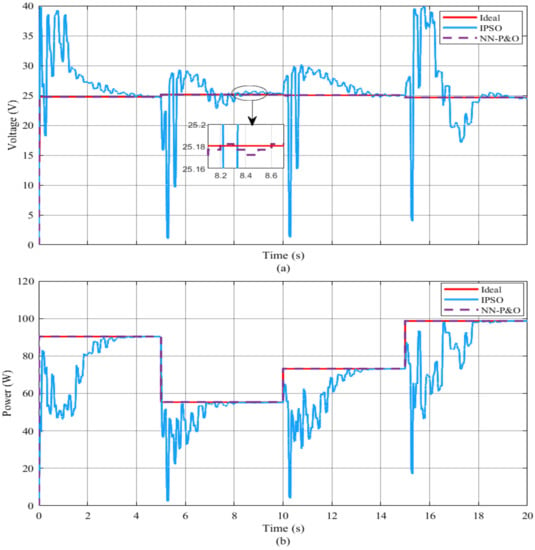
Figure 7.
Simulation results under shading by the NN-P&O and IPSO algorithms: (a) voltage under shading, and (b) power under shading.
Figure 7 shows not only the ability of the NN-P&O and the IPSO algorithms to follow the GMPP, but also the decrease in the transient response (Tr) when the NN-P&O was applied. Indeed, it indicates that the IPSO method is able to follow GMPP without oscillations around the ideal point. To compare the efficiency and effectiveness of the two techniques, the average efficiency in every irradiance status (Ess) was calculated using Equation (6):
where Pss indicates the power under every irradiance status.
Table 4 confirms that the response time when applying NN-P&O was shorter than that when applying IPSO. Moreover, [29] showed that, when the duty cycle was small, the response time increased, so the precision increased and the value of Ass was almost the same as that under IPSO. An observation that can highlight the benefits of IPSO is that, if the irradiation level remains constant for a long time, Ass can reach 100%, while the PV system can never reach this value when using NN-P&O.

Table 4.
Performances comparison between NN-P&O and IPSO under shading.
4.2. Results and Discussion under Various Irradiation Slopes
Different algorithms, i.e., P&O, NN, and NN-P&O, were incorporated in MATLAB/Simulink under ramp irradiation, as shown in Figure 8 and Figure 9.
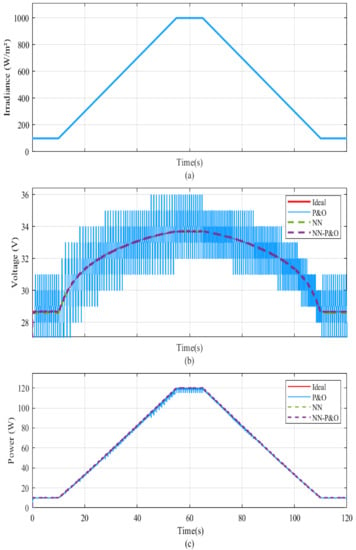
Figure 8.
Simulation results under a slope of 20 W/m2/s: (a) irradiance, (b) voltage, and (c) power.
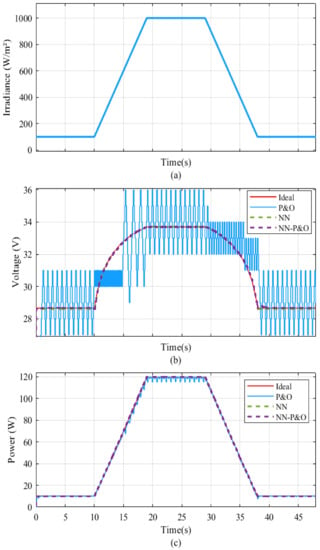
Figure 9.
Simulation results under a slope of 100 W/m2/s: (a) irradiance, (b) voltage, and (c) power.
Figure 8a and Figure 9a present two trapezoidal irradiation profiles: the first starts at 10 s, with a positive slope from 100 W/m2 to 1000 W/m2 in 45 s, followed by a 10 s steady state period, and finally returns to 100 W/m² irradiation in 45 s. The second trapezoid starts at 10 s from 100 W/m², reaches its maximum (1000 W/m²) at 9 s, maintains a steady state for 10 s, and arrives back at its initial value at 38 s. This profile was used to compare the NN-P&O technique with P&O and NN.
Figure 8b and Figure 9b show that the P&O method cannot track correctly the MPP exactly under fast ramp irradiance, where the PV voltage is largely oscillating around the MPP one. This has caused the harvested power to be less than the maximum available one. However, the MPP was tracked properly when the NN method was applied but with small error around the MPP voltage, causing smaller power loss, as shown in Figure 8c and Figure 9c. To enhance the precision at steady state, a combination of the two methods: P&O with a small duty cycle, which is used when the irradiation is constant, and an NN technique, which is integrated under fast ramp irradiation. The results of this hybrid method show that the obtained V-P are almost similar to MPP values. In order to determine the precision of P&O, NN, and NN-P&O techniques, the efficiencies (Essi)1≤i≤n were measured under the trapezoidal irradiation exhibited previously, showing the efficiencies presented in Figure 10 and Figure 11 below.
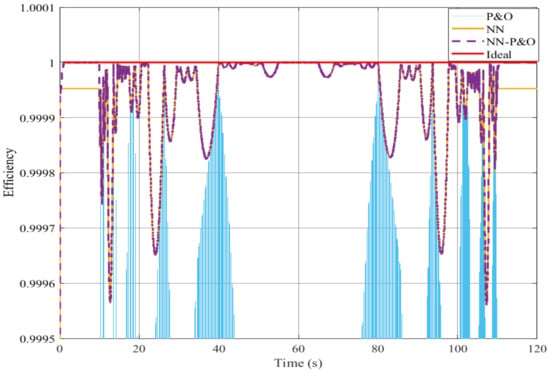
Figure 10.
Efficiency of three MPPT methods under a slope of 20 W/m2/s.
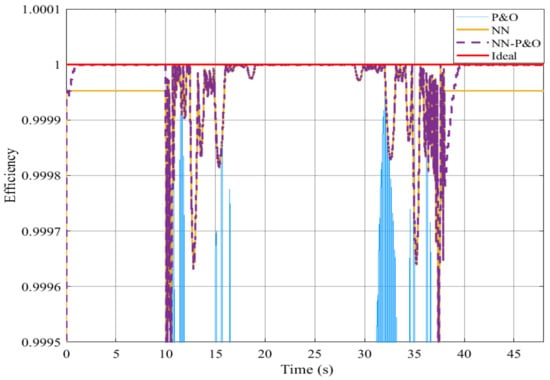
Figure 11.
Efficiency of three MPPT methods under a slope of 100 W/m2/s.
Figure 10 and Figure 11 confirm that the integration of NN to obtain NN-P&O to control the PV system clearly enhanced the efficiency compared with the classical P&O algorithm. Moreover, if the slope value increased, the P&O efficiency decreased, resulting in the inaccuracy of the P&O algorithm. These figures indicate that the NN-P&O error at steady state was negligible relative to the NN error.
To prove this interpretation, the average error (Er) of every technique, i.e., P&O, modified InCond, NN, dP-P&O, LI-PSO, and NN-P&O, was evaluated by Equation (7).
where n is the iteration number.
Table 5 shows that the NN-P&O error was inferior to those of the other techniques. It was equivalent to 0.005% under a slope of 20 W/m2/s and equal to 0.003% under a slope of 100 W/m2/s. This proves the better performance of the NN-P&O method in MPP tracking.

Table 5.
Errors Values.
5. Conclusions
The aim of this work was to highlight the performance of NN-P&O by comparing this method with the IPSO technique under shading and with other methods under a fast ramp. NN-P&O is the association of two interesting methods: P&O and NN, which were incorporated to command the PV system output power through a dc–dc converter. This hybrid method greatly affected the response time duration required to reach the operating point, as well as the stability around the MPP. The obtained results confirm that NN-P&O was able to track the MPP very quickly, regardless of the environmental conditions. However, this tracking was accompanied by error, which occurred in the training step of the neural networks. This error became negligible when the P&O method was integrated with a very small duty cycle, resulting in very small oscillations around the MPP. However, the IPSO method was characterized by stability and a very long response time. In future work, a developed PSO is required to track MPP under fast ramp environmental conditions.
Author Contributions
Conceptualization, W.H., D.S. and E.O.; methodology, W.H., D.S. and E.O.; software, W.H., D.S., E.O. and A.L.; validation, W.H., D.S., E.O. and A.L.; formal analysis, D.S., E.O. and A.L.; investigation, W.H.; data curation, D.S., E.O. and A.L.; original draft preparation, review, and editing, W.H., D.S., E.O. and A.L.; supervision, D.S., E.O. and A.L. All authors have read and agreed to the published version of the manuscript.
Funding
This research received no external funding.
Data Availability Statement
All data used in this contribution are available from the corresponding author upon request.
Acknowledgments
The authors would like to thank Sergiu Spataru—Department of Photonics Engineering, Aalborg University, Denmark—for his support.
Conflicts of Interest
The authors declare no conflict of interest.
References
- Lewis, R.S. Antartic research and relevant of science. Bull. At. Sci. 1970, 26, 2. [Google Scholar] [CrossRef]
- Soon, T.K.; Mekhilef, S. A Fast-Converging MPPT Technique for Photovoltaic System under Fast-Varying Solar Irradiation and Load Resistance. Ind. Inform. 2015, 11, 176–186. [Google Scholar] [CrossRef]
- Mohanty, S.; Subudhi, B.; Ray, P.K. A New MPPT Design Using Grey Wolf Optimization Technique for Photovoltaic System Under Partial Shading Conditions. Sustain. Energy 2016, 7, 181–188. [Google Scholar] [CrossRef]
- Eshram, T.; Chapman, P.L. Comparison of photovoltaic array maximum power point tracking techniques. Energy Convers. 2007, 22, 439–450. [Google Scholar] [CrossRef]
- Lashab, A.; Sera, D.; Guerrero, J.M. A Dual-Discrete Model Predictive Control-Based MPPT for PV Systems. IEEE Trans. Power Electron. 2019, 34, 9686–9697. [Google Scholar] [CrossRef]
- Sera, D.; Kerekes, T.; Teodorescu, R.; Blaabjerg, F. Improved MPPT method for rapidly changing environmental conditions. In Proceedings of the IEEE International Symposium on Industrial Electronics, Montreal, QC, Canada, 9–13 July 2006. [Google Scholar] [CrossRef]
- Zegaoui, A.; Aillerie, M.; Petit, P.; Sawicki, J.P.; Charles, J.P.; Belarbi, A.W. Dynamic behaviour of PV generator trackers under irradiation and temperature changes. Sol. Energy 2011, 85, 2953–2964. [Google Scholar] [CrossRef]
- Safari, A.; Mekhilef, S. Simulation and hardware Mekhilef. implementation of incremental conductance MPPT with direct control method using cuk converter. IEEE Trans. Ind. Electron. 2011, 58, 1154–1161. [Google Scholar] [CrossRef]
- Premrudeepreechacham, S.; Patanapirom, N. Solar-array modelling and maximum power point tracking using neural networks. In Proceedings of the International Power Tech Conference, Bologna, Italy, 23–26 June 2003; Volume 2, pp. 5–9. [Google Scholar]
- D’Souza, N.S.; Lopes, L.A.C.; Liu, X. An intelligent maximum power point tracker using peak current control. In Proceedings of the 36th Power Electronics Specialists Conference, Recife, Brazil, 16 June 2005; pp. 172–177. [Google Scholar]
- Mellit, A.; Kalogirou, S.A. Artificial intelligence techniques for photovoltaic applications: A review. Prog. Energy Combust. Sci. 2008, 34, 574–632. [Google Scholar] [CrossRef]
- Veerachary, M.; Senjyu, T.; Uezato, K. Neural-network based maximum-power-point tracking of coupled-inductor interleaved-boost-converter-supplied PV system using fuzzy controller. IEEE Trans. Ind. Electron. 2003, 50, 749–758. [Google Scholar] [CrossRef]
- Hayder, W.; Abid, A.; Hamed, M.; Sbita, L. Improved PSO Algorithms in PV System Optimisation. Eur. J. Electr. Eng. Comput. Sci. 2020, 4, 1. [Google Scholar] [CrossRef][Green Version]
- Villalva, M.G.; Gazolii, J.R.; Ruppert, F.E. Modeling and circuit-based simulation of photovoltaic arrays. Braz. J. Power Electron. 2009, 14, 35–41. [Google Scholar]
- Huan-Liang, T.; Ci-Siang, T.; Yijie, S. Development of Generalized Photovoltaic Model Using MATLAB/SIMULIN. In Proceedings of the Congress on Engineering and Computer Science, San Francisco, CA, USA, 22–24 October 2008. [Google Scholar]
- Huan-Liang, T. Insolation-oriented model of photovoltaic module using MATLAB/SIMULINK. Sol. Energy 2010, 84, 1318–1326. [Google Scholar]
- Villallva, M.G.; Jonas Rafael Gazali, J.R.; Filho, E.R. Comprehensive approach to modeling and simulation of photovoltaic array. IEEE Trans. Power Electron. 2009, 24, 1198–1208. [Google Scholar] [CrossRef]
- Hayder, W.; Abid, A.; Hamed, M.; Sbita, L. Intelligent MPPT algorithm for PV system based on fuzzy logic. In Proceedings of the 17th IEEE International Multi-Conference on Systems, Signals & Devices 2020, Monastir, Tunisia, 20–23 July 2020. [Google Scholar]
- Hayder, W.; Abid, A.; Hamed, M.; Sbita, L. MPPT based on P&O method under partially shading. In Proceedings of the 17th IEEE International Multi-Conference on Systems, Signals & Devices 2020, Monastir, Tunisia, 20–23 July 2020. [Google Scholar]
- Winston, D.P.; Kumar, B.P.; Christabel, S.C.; Chamkha, A.J.; Sathyamurthy, R. Maximum power extraction in solar renewable power system–A bypass diode scanning approach. Comput. Electr. Eng. 2018, 70, 122–136. [Google Scholar] [CrossRef]
- Sarwar, S.; Javed, M.Y.; Jaffery, M.H.; Arshad, J.; Ur Rehman, A.; Shafiq, M.; Choi, J.-G. A Novel Hybrid MPPT Technique to Maximize Power Harvesting from PV System under Partial and Complex Partial Shading. Appl. Sci. 2022, 12, 587. [Google Scholar] [CrossRef]
- Patel, H.; Agarwal, V. Maximum power point tracking scheme for PV systems operating under partially shaded conditions. Ind. Electron. 2008, 55, 1689–1698. [Google Scholar] [CrossRef]
- Seyedmahmoudian, M. Analytical Modeling of Partially Shaded Photovoltaic Systems. Energies 2013, 6, 128. [Google Scholar] [CrossRef]
- Belkaid, A.; Colak, I.; Isik, O. Photovoltaic maximum power point tracking under fast varying of solar radiation. Applied Energy 2016, 179, 523–530. [Google Scholar] [CrossRef]
- Hayder, W.; Ogliari, E.; Dolara, A.; Abid, A.; Ben Hamed, M.; Sbita, L. Improved PSO: A Comparative Study in MPPT Algorithm for PV System Control under Partial Shading Conditions. Energies 2020, 13, 2035. [Google Scholar] [CrossRef]
- Miyatake, M.; Toriumi, F.; Endo, T.; Fujii, N. A novel MPPT controlling several converters connected to PV arrays with PSO technique. In Proceedings of the Power Electronics Application European Conference, Aalborg, Denmark, 2–5 September 2007; pp. 1–10. [Google Scholar]
- Hayder, W.; Abid, A.; Hamed, M. P&O and PSO algorithms in PV system optimization: A comparative study. In Proceedings of the 1st National Conference on Green Energy and Application Systems (GEAS), Hammamet, Tunisia, 31 October–2 November 2018. [Google Scholar]
- Koad, R.B.A.; Zobaa, A.F.; El-Shahat, A. A Novel MPPT Algorithm Based on Particle Swarm Optimization for Photovoltaic Systems. IEEE Trans. Sustain. Energy 2017, 8, 468–476. [Google Scholar] [CrossRef]
- Hayder, W.; Abid, A.; Hamed, M. Steps of duty cycle effects in P&O MPPT algorithm for PV system. In Proceedings of the 1st International Conference on Green Energy Conversion Systems (GECS), Hammamet, Tunisia, 23–25 March 2017. [Google Scholar]
Publisher’s Note: MDPI stays neutral with regard to jurisdictional claims in published maps and institutional affiliations. |
© 2022 by the authors. Licensee MDPI, Basel, Switzerland. This article is an open access article distributed under the terms and conditions of the Creative Commons Attribution (CC BY) license (https://creativecommons.org/licenses/by/4.0/).