Abstract
Darcy’s law has long been used to describe the flow in porous media. Despite the progress that took place in oil production industry research, it became clear that there is a loss of pressure, especially in the area near the wellbore region, where Darcy’s law is not applicable. For this reason, Forchheimer presented his equation in 1910, where he added a new term to Darcy’s law dealing with pressure loss due to inertial forces by introducing a new term, the coefficient, into the equation. This paper presents a study of fluid flow through porous media, where water was used as a working fluid. Furthermore, the characteristics of the non-Darcy flow were analyzed by presenting the corresponding pressure and velocity gradient curves for each pressure. Extensive analysis indicates that many of the correlations available in the literature either have defective units or are the product of a small number of experiments. In this study, we benefit from relatively large samples, the radial flow, and the perforation in the middle of the samples. The properties of the samples were measured using mercury intrusion porosimetry. It was found that there is a direct relationship between the porosity and the grain’s size; the greater the size of the grains, the greater the porosity, and vice versa. The non-Darcy coefficient term, β, is found to be inversely proportional to the porosity and permeability. In a previous study, the β was investigated for compressible flow scenarios; however, this study calculated it for an incompressible flow. Finally, by analyzing the β values of both studies, we could deduce new novelty correlations for the β coefficient term, where the permeability, porosity, and tortuosity are included.
1. Introduction
Fluid particles passing through a porous bed are subject to accelerations and decelerations as they are alternately pass-through constrictions and enlargement tortuous [1]. The particle’s kinetic energy is interchanged with the pressure energy during the acceleration and deceleration processes. This interchange includes significant irreversibility at the velocity where the pressure drop becomes more than proportional to the velocity [2]. Some investigators refer to this phenomenon as kinetic effects, and the researchers agree that the extra fluid motion is caused primarily by the inertial effects in the deceleration process and quiet in the absence of turbulent eddies. Some investigators have referred to this phenomenon as “non-Darcy” flow. If one assigns the extra motion of the fluid as the cause of the additional pressure loss, then the term “turbulent flow” is justified because, in actual turbulent flow in pipes, it is the extra ammunition of energy that is significant to the engineer [3]. Hence, many investigators in the field use the term “turbulent flow” to designate a condition of velocity such that increases in pressure drop for liquids or differences of squares of pressures for gases are more than proportional to increases in flow rates [4]. That is the procedure followed here; flow in porous media is present in many applications and engineering industries. The flow in porous media is essential in agricultural engineering as it helps make the most of irrigation water. In hydrology, it is critical to the process of extracting groundwater [5]. In civil engineering, studying porous media is fundamental to building design and safety and is becoming increasingly crucial in oil and gas production [6]. Flow in porous media is a complex phenomenon because of many factors, such as the nature of fluid and porous media nature. So, there are many differences in understanding and characterizing the flow [7]. In the case of low flow velocity, Darcy’s law can describe the flow in the porous media as follows.
Q is the flow rate, k is the media permeability, A is the flow rate cross-section, μ is the viscosity and sample length (L), and ΔP is the pressure drop. The non-Darcy flow is the flow that has a nonlinear relationship between flow rate and pressure difference and cannot be described by Darcy’s law. The Forchheimer equation was introduced that included an extra term to address the additional pressure losses due to the inertia forces; thus, for one-dimensional flow, the Forchheimer has the following form [8]:
pressure drop, flow distance, viscosity, permeability, flow velocity, non-Darcy coefficient, and the density. Even though the flow velocity is low, some researchers still argue that the non-Darcy flow excites even in the low flow velocities. Previously, the nonlinearity between the pressure gradient and the flow rate was attributed to turbulence. Nowadays, many researchers agree that the nonlinearity is not due to turbulence only but to inertial effects too [9]. The inertia term of the Forchheimer equation included the coefficient β, which measures the deviation from the linearity. It has been concluded that the non-Darcy effect occurs because the microscopic inertial effects alter the velocity and pressure fields. The above example implies that tortuosity should be one of the critical factors determining the non-Darcy coefficient [10]. The non-Darcy coefficient in wells is usually determined by analysis of many correlations in the literature [11]. Both empirical correlations and theoretical equations of the non-Darcy coefficient will be reviewed. For the empirical correlations, reviews will be done on one-phase and two-phase bases [12]. So far, no theoretical equations in two or more phases have been found, so the study will be limited to a one-phase case for theoretical equations [13].
The critical parameter in β correlations that predicts the non-Darcy is the permeability. Ergun developed a theoretical equation by analyzing lab data collected from his experiments and data from the literature and came up with an empirical equation, which included spheres of different sizes, sand, and the following gases: carbon dioxide, nitrogen, methane, and hydrogen [14]. Comparing the Ergun empirical flow equation with the Forchheimer equation leads to [15]:
where a = 1.75, b = 150 constants, k is the permeability expressed in Darcy, β is 1/cm, and is the porosity. Equation (3) analyzed for particles of different roughness and found that b = 180; while “a” ranges from 1.8 to 4 [16]. Another equation proposed by Janicek et al. [17] related the permeability and the porosity in order to predict the non-Darcy coefficient for real porous media, as shown below:
K is expressed in mD, and β in 1/cm.
However, Geertsma [18] developed an empirical relationship between the skin coefficient, permeability, porosity, and the skin factor. The dimensionally consistent equation is of the form:
Additionally, he presented another correlation based on 180 β data labs from different experiments. Although the points were collected from experiments on many types of porous media and tests of liquids and gases, these laboratory data did not include data on tortuosity:
Jones [19] conducted experiments on 355 sandstone and 29 limestone cores in different core types. By analyzing the data from his experiments, he came up with a correlation to estimate the non-Darcy coefficient,
where K is expressed in mD, and β in 1/ft.
Thauvin and Mohanty [20] entered the pore size distributions and network coordination numbers into the mathematical model; the analysis resulted in the following correlation,
It can be noted that the β units are not correct. From the initial assessment, we have observed that the existing correlations show a significant deviation. The first reason is the relativity of the flow direction to the porous channels (i.e., tortuosity) can affect the correlation of the non-Darcy coefficient. The second reason is that different parameters are considered when developing the correlations and the fluid used in the experiments. Umair Khan [21] presented a study on the effects of velocity and thermal slip conditions on the stagnation-point mixed convective flow of cross liquid moving over a vertical plate entrenched in a Darcy–Forchheimer porous medium. The study concluded that the permeability parameter decelerates the drag forces and declines the heat transfer rate. Jamshaid ul Rahman [22] investigated the Darcy–Forchheimer effects on the 3D nanofluid flow with engine oil as a base fluid containing suspended carbon nanotubes mathematically. The outcome of his study indicated that a higher slip parameter boosts the axial velocity, whereas the fluid temperature lowers for a sturdier relaxation parameter. Metib Alghamdi [23] numerically examined the dynamical behavior and thermal transportation feature of an enhanced MHD convective Casson bi-phasic flow of sodium alginate-based nanofluids in a Darcy–Brinkman medium bounded by a vertical elongating slender concave-shaped surface, and the results showed that the wall heat transfer rate and the frictional effect are strengthened with the loading of nanoparticles and weakened with the mounting values of the heat source parameters. Previous studies on single-phase flow using modeling and experiments were conducted in a near wellbore and perforation tunnel [24,25,26,27]. In addition, multiphase flow studies in perforation tunnels and porous media were also conducted [11,12,13,14,15,16,17,28,29,30,31,32]. In the current study, we will examine the validity of the existing correlations reported in the literature. This study will propose a novel correlation considering sample permeability, porosity, and tortuosity. These are the essential correlation factors in developing a reliable model for β.
2. Experimental Methodology
The experimental method begins with the preparation of samples from sand collected from local sources. The sample preparation passes through several stages, the first of which is sifting the sand and classifying it into sizes. Then mixing each of these sizes with an adhesive substance takes place to obtain the required hardness sample, which helps to stabilize the properties during the experiment; more details will be provided in the next section. The flow experiment is carried out on seven samples that have been prepared, where the sample is placed in the chamber (Figure 1); the fluid is then injected radially into the sample as depicted in Figure 2, and the pressure is measured.
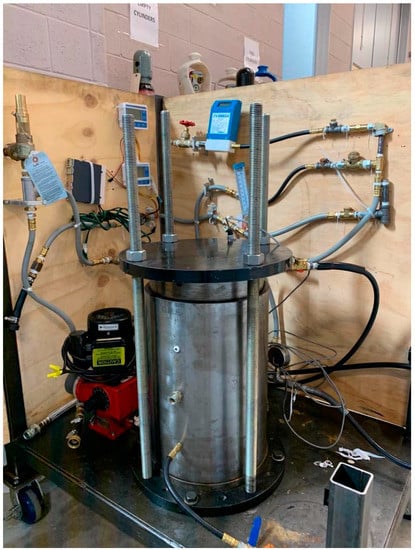
Figure 1.
Experiment Setup, Radial Flow Facility.
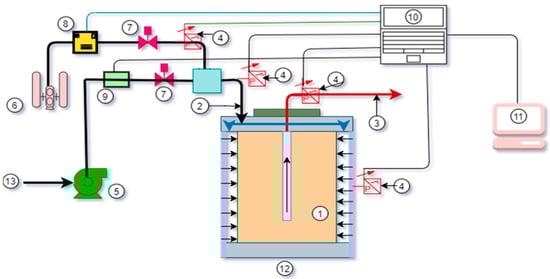
Figure 2.
Schematic diagram of the experiment R.F.C. facility: 1. Sample, 2. Inlet, 3. Outlet, 4. Pressure Sensors, 5. Water pump, 6. Air compressor, 7. non-Return valves, 8. Airflow meter, 9. Water flowmeter, 10. Data Acquisition, 11. Computer, 12. Samples Chamber, 13. Waterline.
2.1. Experimental Setup
In the Memorial University of Newfoundland Laboratories, the experimental setup was developed to conduct experiments [33,34]. It comprises four functional units: water supply, experimentation, measurement, and data acquisition. A schematic diagram of the experimental setup is depicted in Figure 2.
As a result of the difficulties faced by non-Darcy flow tests, such as providing samples and various working fluids as well as high speeds and pressures, many researchers resort to measurements of individual cores or sand-packed models. Therefore, the resulting equations are not general. The current laboratory experiment begins with placing the sample in the sample chamber, as shown in Figure 1 and Figure 2, and connecting all pressure sensors that are able to measure up to 300 psi; and the flow rate meters connected to the data acquisition. The flow test was repeated several times to ensure that the collected data were correct. The experiment was designed to start with a water flow rate of 0.333 LPM, and the flow increased by 0.333 LPM each time to 6 LPM. The pressure drop data were recorded for each run, and the fluid temperature was observed and kept constant at 20 °C.
2.2. Porous Media Selection
This type of experiment in which the non-Darcy flow is investigated requires high fluid flow velocity. Under laboratory conditions, high pressures that can push fluids at a high flow velocity through porous media with low permeability may not be available. Therefore, the production of porous media with high permeability was resorted to in the laboratory because it is not easy to obtain real porous media with high permeability.
2.3. Core Preparation
Since the setup was designed to be suitable for cylindrical samples, the samples were manufactured in a cylindrical shape (Figure 3). It was taken into account that the outer surfaces of the samples are free from defects such as cracks or corroded holes; the outer surface of the samples is considered to be the inlet to the fluid flow. The appropriate outer diameter of the samples in this experiment is 15.54 cm and has a height of 31 cm. The samples have a perforated hole in the middle, 25 cm deep and 2.54 cm in diameter, and it is considered the outlet of the flow, as shown in the above Figure 2. The samples manufactured in the Memorial University Laboratories consisted of sand collected from local sources; the sand was dried and then sieved and classified according to the size of the sand grains, from the smallest to the largest. Each of these sizes was used to create the samples after mixing the sand with an adhesive liquid and placing it in specific molds to dry within 24 h. The samples are cylindrical in shape, as well as perforated. Table 1 shows the properties of the samples that were measured in the laboratories.
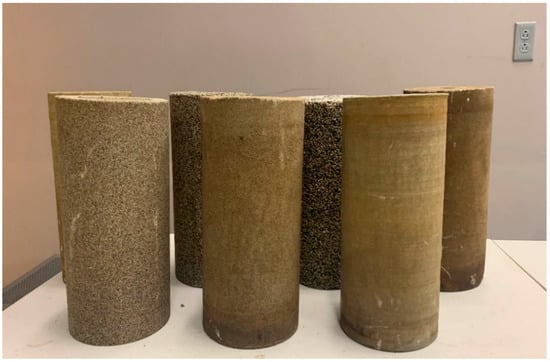
Figure 3.
Porous medial samples.

Table 1.
The porous media properties.
3. The Determination of a Non-Darcy Flow
From the literature, it can be noticed that a significant discrepancy exists in determining the point at which the Darcy flow turns into a transitional phase and a non-Darcy flow, which is attributed to the unique nature of the porous media. The results were different when comparing two samples with the same permeability and porosity and when tested with the same fluid for the same flow rate. However, a Reynolds number and a Forchheimer number can be used in determining the flow type in porous media.
Hydraulic Gradient-Velocity
The non-Darcy flow results from increased fluid velocity and excessive momentum as well as irregularities. The following formula can be used to describe the non-Darcy flow, which is known as the Izbash form [35]:
In which a and b are constants that can be determined from the conducted experiments, V is average bulk flow velocity (m/s), and i is hydraulic gradient. The previous formula showed shortcomings in calculating all pressure values, so another side was added to Equation (9) to become a quadratic equation. The Forchheimer equation is presented as follows:
A is a Darcy flow coefficient that depends on the properties of the porous medium, and B is a coefficient that depends on the characteristics of the porous media. Sedghi-Asl and Rahimi [36] conducted experiments on porous media with particle sizes between 55 and 79 mm as well as using six different sizes of coarse materials (2.83–56.8 mm); the experiment was carried out on a wide range of Reynolds numbers, and they obtained a quadratic relationship as follows:
In which a, b are constants, n (-) is the porosity, f (-) is the friction factor, υ (L2 T−1) is the kinematic viscosity, Re (-) is the Reynolds number, d (L) is the grain diameter of aggregates, V(LT−1) is the bulk flow velocity, and g(LT−2) is the gravity acceleration. Additionally, Salehi et al. [37] investigated experimentally with a non-Darcy flow through a packed column test for rounded aggregates with domains between 2.83- and 56.8-mm. Ergun [14] suggested the following quadratic equation for both Darcy and non-Darcy flow regimes:
Mc Corquodale et al. [38] presented the following relationship by means of 1,250 experimental data as
where R is the hydraulic mean radius, which is defined as
In which () is the shape factor efficiency, which for spherical grains is equal to 1, and which represented the following relationship by means of 300 experimental data:
Kadlec and Knight [39] also suggested the following equations:
4. Experimental Results and Analysis
In this section, the results and analysis of data obtained from laboratory experiments will be presented. The flow results will be analyzed, and the non-Darcy flow will be verified, as well as the interaction between the velocity and the hydraulic gradient, to arrive at a proper formula for non-Darcy’s coefficient.
4.1. Hydraulic Gradient-Velocity Equations
One of the methods used to determine whether the flow is Darcy or non-Darcy is the relationship between hydraulic gradient (i) and flow velocity (V); Figure 4, Figure 5, Figure 6 and Figure 7. The flow can be considered a Darcy flow if the relationship is linear, but if the relationship is nonlinear, this indicates the presence of a non-Darcy flow. The following figures show the nonlinear relationship between the flow velocity and the hydraulic gradient.
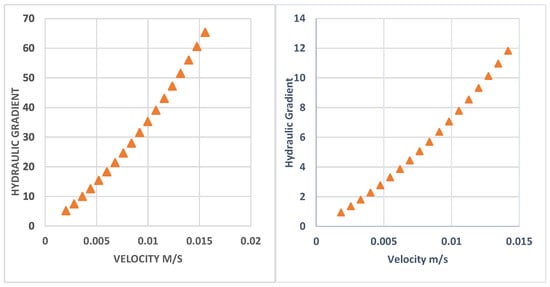
Figure 4.
Hydraulic Gradient vs. Velocity for samples 1 and 2 respectively.
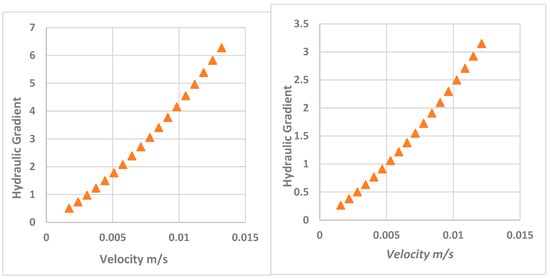
Figure 5.
Hydraulic Gradient vs. Velocity for samples 3 and 4 respectively.
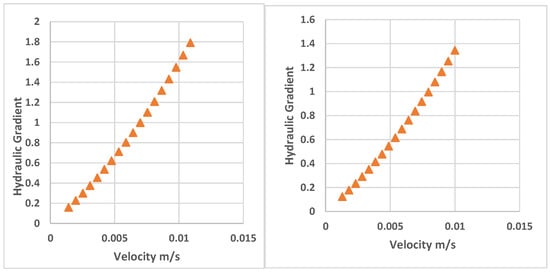
Figure 6.
Hydraulic Gradient vs. Velocity for samples 5 and 6.
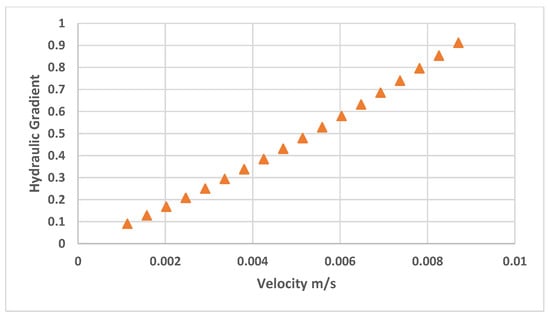
Figure 7.
Hydraulic Gradient vs. Velocity for samples 7.
Testing and plotting the relationship between the velocity and the hydraulic gradient makes it easy to observe whether the relationship is linear or nonlinear. It can be noted that all samples have a nonlinear relationship, even though in varying proportions, as the samples with high permeability and porosity have less resistance and fewer pressure losses, and therefore the flow behavior is close to that of the Darcy flow.
The figures of all flow samples clearly show the relationship between the velocity and the hydraulic gradient. It is easy to see that all samples’ relationships are nonlinear, although the variance varies from sample to sample. Samples with low porosity and permeability have more curved lines, indicating that the flow is moving away from the Darcy flow performance compared to samples with high porosity and permeability.
4.2. The Flow Rate and Pressure Gradient
Seven large cylindrical cores were experimentally tested; the results are displayed in Figure 8 where the flow rate and pressure gradients are the abscissa and ordinate, respectively. The Figure shows that the pressure gradient and flow rate have a better linear relationship when the flow rate is low. As the flow rate increases, the curve proves a departure from linearity and tilts towards the pressure gradient axis, i.e., there is an obvious non-Darcy flow when the flow rate is higher.
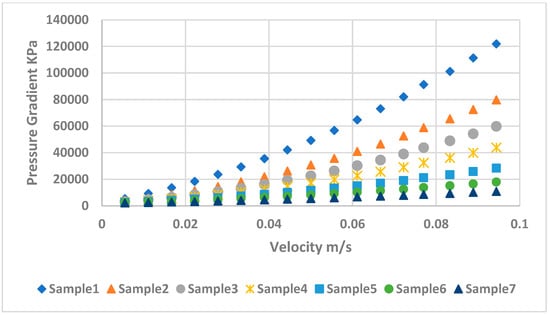
Figure 8.
Pressure Gradients vs. Velocity.
5. Porosity Effect
The porous media porosity plays a significant role in determining the non-Darcy coefficient. The non-Darcy coefficient as a function of the porosity derived from the Mercury Intrusion Porosimeter (M.I.P.) test as illustrated in Figure 9. The graph indicated that the coefficient is inversely proportional to the porosity. Significantly, the coefficient decreases sharply with the increase in the mean pore diameter and seems to be conversing at a lower limit.
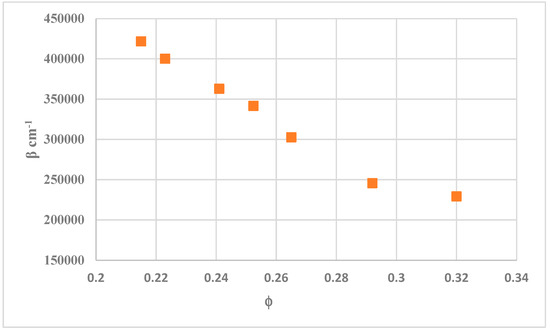
Figure 9.
Non-Darcy coefficient vs. porosity.
Porosity is one characteristic that determines whether the flow is Darcy or non-Darcy. Therefore, it found that most coefficients of Darcy’s empirical equations are based mainly on porosity and permeability. In general, it can be said that there is a direct relationship between the porosity and the grain’s size; the greater the size of the grains, the greater the porosity, and vice versa. Synthetic sample porous media may deviate from this rule, as using pistons to compress samples or mixing more than one size of grains may make the relationship between grain size and porosity inverse. The relationship between porosity and grain size is presented in Figure 10, as each sample used a one-grain size, and no pressing tools were used during the manufacturing stages.
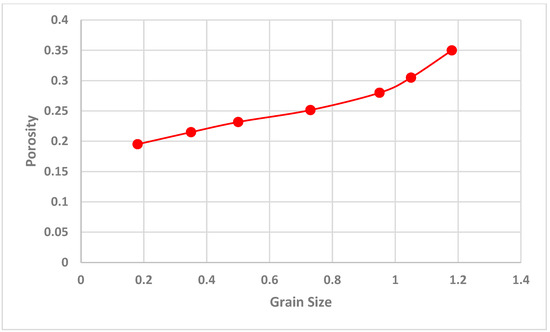
Figure 10.
Relationship between the porosity of the samples and the grain size.
6. Correlation of Non-Darcy Coefficient
The non-Darcy coefficient β can be expressed with the hydraulic conductivity and porosity in another form and shown as follows by Yuedong [40]:
This paper used water as a working fluid, and non-Darcy’s coefficient was calculated in the seven artificial samples. In a previous work, the air was used [41], and the non-Darcy flow was characterized, as well as the calculation of the non-Darcy coefficient. In general, the non-Darcy coefficient β is determined based on the following expression:
The unit β of this expression is important as the porosity is dimensionless, so to be consistent, the permeability exponent “c” should be 0.5.
If both sides logarithm taking, drawing the relationship between and () as in Figure 11. It is possible to put the relationship as follows, converting the natural logarithm to the base ten logarithms.
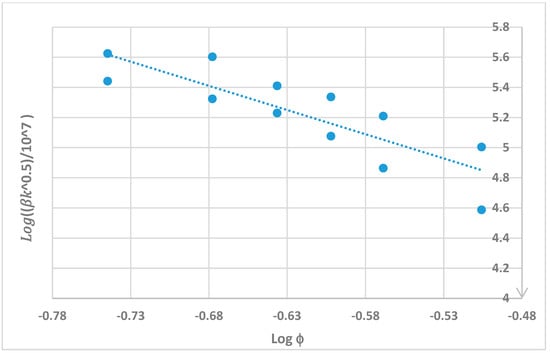
Figure 11.
The non-Darcy coefficient for the seven samples resulted from two different air and water experiments.
With further simplifications, the final form is:
Although it is considered a preliminary study, it produced reliable correlations for calculating the non-Darcy flow coefficient. The units in this equation are identical to the non-Darcy coefficient unit.
7. Tortuosity
Tortuosity is an important parameter in the field of the oil and gas industry. The concept of tortuosity is used to characterize the structure of porous media, estimate their hydraulic conductivity, and study the travel time and length for tracer dispersion. Therefore, it is important to include tortuosity within the correlation. The general expression for the non-Darcy coefficient with respect to tortuosity is:
where τ is the tortuosity.
The tortuosity of the samples was obtained from the mercury intrusion porosimetry (M.I.P.) as given in Table 1; using the data of β, φ, k and τ Figure 12 can be generated, and the obtained correlation is as follows:
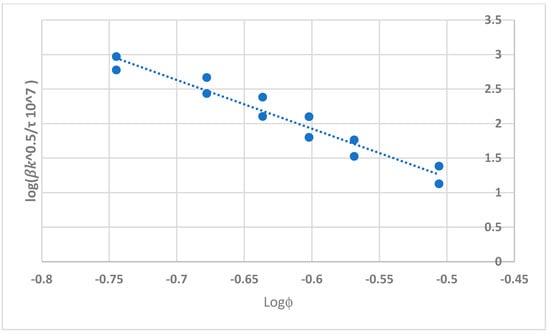
Figure 12.
The non-Darcy coefficient with the effect of tortuosity for the seven samples resulted from two different air and water experiments.
Finally, both obtained novelty correlations as illustrated in Equations (23) and (25) not only distinguished that they are consistent in terms of units; but in addition, they are correct compared to many correlations found in the literature. It was noted that many of them are incorrect in terms of units. However, our reliable experimental results as shown in Figure 13 and Figure 14 were obtained based on radial flow experiments and large samples.
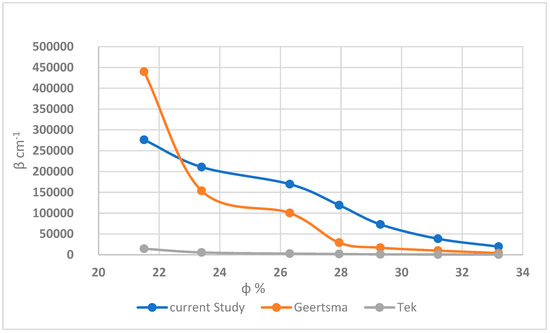
Figure 13.
Comparison of correlation Equation (23) with Geertsma and Tek correlations.
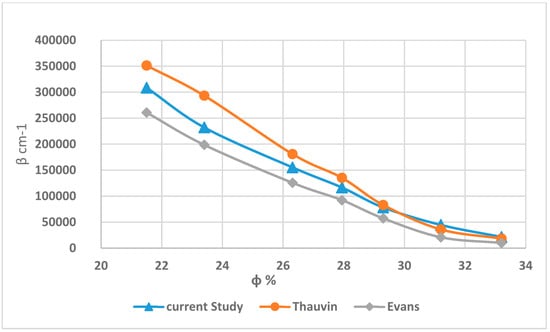
Figure 14.
Comparison of correlation Equation (25) including tortuosity effect with Thauvin and Evans correlations.
8. Conclusions
In this study, the non-Darcy flow was characterized by the means of the hydraulic gradient using seven large artificial porous media prototypes. In addition, non-Darcy coefficient data were collected from our experiment. As a result, imperative correlations were generated with respect to unit consistency and the influence of porosity and tortuosity.
- There are many methods for calculating the non-Darcy coefficient in the literature using flow velocity and the combined action of the displacement medium (liquid) and the porous media. This includes using the Reynolds number, the Forchheimer number, or analyzing pressure and flow data.
- The data were collected using seven large samples in this paper, and the flow was radially considered uncommon in the literature. In total, 358 experiments were conducted. Water and air were used as operating fluids.
- This study produced two reliable equations, one of which considered tortuosity an important parameter. Many researchers have recently argued that it should be included in the correlations. This work can be extended by experimenting with other fluids such as oil, CO2, etc. Additionally, more samples with different porosity and permeabilities will produce more β points.
Author Contributions
Conceptualization, A.E.; Investigation, A.E.; Methodology, A.E., E.A., M.A.R., A.A. and S.D.B.; Supervision, F.K.; Writing—original draft, A.E.; Writing—review & editing, F.K. and M.A.R. All authors have read and agreed to the published version of the manuscript.
Funding
This research received no external funding.
Data Availability Statement
All the data is available in this text.
Conflicts of Interest
The authors declare no conflict of interest.
Nomenclature
| β | non-Darcy coefficient |
| φ | Porosity |
| k | Permeability |
| kr | Relative permeability |
| τ | Tortuosity |
| ρ | Density |
| ʋ | Viscosity |
| v | Fluid velocity |
| P | Pressure |
| g | Gravity |
| i | Hydraulic gradient |
| f | Friction factor |
| re | Shape factor efficiency |
| R | Hydraulic mean radius |
| Re | Reynolds number |
| Sw | Water saturation |
| a, b | Are constants calculated experimentally |
| M.P.D. | Mean pour diameter |
| M.I.P. | Mercury intrusion porosimetry |
References
- Andrade, J.S.; Costa, U.M.; Almeida, M.P.; Makse, H.A.; Stanley, H.E. Inertial Effects on Fluid Flow through Disordered Porous Media. Phys. Rev. Lett. 1999, 82, 5249–5252. [Google Scholar] [CrossRef]
- Hill, R.J.; Koch, D.L.; Ladd, A.J.C. The First Effect of the Fluid Inertia on Flows in Ordered and Random Arrays of Sphers. J. Fluid Mech. 2001, 448, 213–241. [Google Scholar] [CrossRef]
- Cheng, H.; Papanicolaou, G. Flow past periodic arrays of spheres at low Reynolds number. J. Fluid Mech. 1997, 335, 189–212. [Google Scholar] [CrossRef]
- Wu, Y.-S.; Lai, B.; Miskimins, J.L.; Fakcharoenphol, P.; Di, Y. Analysis of Multiphase Non-Darcy Flow in Porous Media. Transp. Porous Media 2011, 88, 205–223. [Google Scholar] [CrossRef]
- Cattaneo, L.; Comunian, A.; De Filippis, G.; Giudici, M.; Vassena, C. Modeling Groundwater Flow in Heterogeneous Porous Media with YAGMod. Computation 2016, 4, 2–19. [Google Scholar] [CrossRef]
- Ghahri, P.; Jamiolahmady, M. A new, accurate and simple model for calculation of productivity of deviatedand highly deviated well – Part I: Single-phase incompressibleand compressible fluid. Fuel 2012, 97, 24–37. [Google Scholar] [CrossRef]
- Ni, X.; Kulatilake, P.; Chen, Z.; Gong, P.; Kong, H. Experimental Investigation of Non-Darcy Flow in Sandstone. Geotech. Geol. Eng. 2016, 34, 1835–1846. [Google Scholar] [CrossRef]
- Akihiro, T.; Xiaopeng, Z.; Taku, T.; Mitsuru, K. Topology optimisation of a porous unit cell in a fluid flow considering Forchheimer drag. Int. J. Comput. Fluid Dyn. 2020, 34, 50–60. [Google Scholar]
- Ovalle-Villamil, W.; Sasanakul, I. Investigation of Non-Darcy Flow for Fine Grained Materials. Geotech. Geol. Eng. 2019, 37, 413–429. [Google Scholar] [CrossRef]
- Partha, K.; Vimal, K.; Lausanne, M. Experimental and numerical investigation of fluid flow hydrodynamics in porous media: Characterization of pre-Darcy, Darcy and non-Darcy flow regimes. Powder Technol. 2016, 303, 278–291. [Google Scholar]
- Yang, Y.; Huiqing, L.; Ling, X.; Meng, Z. Experimental study of non-darcy two-phase flow in a fractured—Vuggy medium. Chem. Technol. Fuels Oils 2016, 52, 36–40. [Google Scholar] [CrossRef]
- Wheeler, M.; Balhoff, M. A Predictive Pore-Scale Model for Non-Darcy Flow in Porous Media. SPE J. 2009, 14, 579–587. [Google Scholar]
- Hassanizadeh, S.M.; Gray, W.G. High Velocity Flow in Porous Media. Transp. Porous Media 1987, 2, 521–531. [Google Scholar] [CrossRef]
- Ergun, S.; Orning, A. Fluid Flow through Randomly Packed Columns and Fluidized Beds. Ind. Eng. Chem. 1949, 41, 1179–1184. [Google Scholar] [CrossRef]
- Dacun, L.; Robert, S.; Tom, E.; Reid, G. Modeling and Simulation of the Wafer Non-Darcy Flow Experiments. In Proceedings of the SPE Western Regional Meeting, Bakersfield, CA, USA, 26–30 March 2001. [Google Scholar]
- Macdonald, F.; Mow, E.S.K.; Dullien, L. Flow through Porous Media-the Ergun Equation Revisited. Ind. Eng. Chem. Fundam. 1979, 18, 199–208. [Google Scholar] [CrossRef]
- Janicek, J.; Katz, D. Applications of Unsteady State Gas Flow Calculations; University of Michigan: Ann Arbor, MI, USA, 1955. [Google Scholar]
- Geertsma, J. Estimating the Coefficient of Inertial Resistance in Fluid Flow Through Porous Media. Soc. Pet. Eng. J. 1974, 14, 445–450. [Google Scholar] [CrossRef]
- Jones, S.C. Using the Inertial Coefficient, B, To Characterize Heterogeneity in Reservoir Rock. In Proceedings of the SPE Annual Technical Conference and Exhibition, Dallas, TX, USA, 27–30 September 1987. [Google Scholar]
- Wang, X.; Thauvin, F.; Mohanty, K.K. Non-Darcy flow through anisotropic porous media. Chem. Eng. Sci. 1999, 54, 1859–1869. [Google Scholar] [CrossRef]
- Khan, U.; Zaib, A.; Khan, I.; Nisar, K.S.; Baleanu, D. Insights into the Stability of Mixed Convective Darcy–Forchheimer Flows of Cross Liquids from a Vertical Plate with Consideration of the Significant Impact of Velocity and Thermal Slip Conditions. Mathematics 2020, 1, 8. [Google Scholar] [CrossRef]
- Rahman, J.U.; Khan, U.; Ahmad, S.; Ramzan, M.; Suleman, M.; Lu, D.; Inam, S. Numerical Simulation of Darcy–Forchheimer 3D Unsteady Nanofluid Flow Comprising Carbon Nanotubes with Cattaneo–Christov Heat Flux and Velocity and Thermal Slip Conditions. Processes 2019, 7, 687. [Google Scholar] [CrossRef]
- Alghamdi, M.; Wakifc, A.; Thumma, T.; Khan, U.; Baleanu, D.; Rasool, G. Significance of variability in magnetic field strength and heat source on the radiative-convective motion of sodium alginate-based nanofluid within a Darcy-Brinkman porous structure bounded vertically by an irregular slender surface. Case Stud. Therm. Eng. 2021, 28, 101428. [Google Scholar] [CrossRef]
- Rahman, M.A.; Mustafiz, S.; Koksal, M.; Islam, M.R. Quantifying the skin factor for estimating the completion efficiency of perforation tunnels in petroleum wells. J. Pet. Sci. Eng. 2007, 58, 99–100. [Google Scholar] [CrossRef]
- Rahman, M.A.; Mustafiz, S.; Biazar, J.; Koksal, M.; Islam, M.R. Investigation of a novel perforation technique in petroleum wells—perforation by drilling. J. Frankl. Inst. 2007, 344, 777–789. [Google Scholar] [CrossRef]
- Zheng, L.; Rahman, M.A.; Ahammad, M.J.; Butt, S.D.; Alam, J.M. Experimental and Numerical Investigation of a Novel Technique for Perforation in Petroleum Reservoir. In Proceedings of the SPE International Conference and Exhibition on Formation Damage Control, Lafayette, LA, USA, 24–26 February 2016. [Google Scholar]
- Abobaker, E.; Elsanoose, A.; Khan, F.; Rahman, M.A.; Aborig, A.; Noah, K. Quantifying the partial penetration skin factor for evaluating the completion efficiency of vertical oil wells. J. Pet. Explor. Prod. Technol. 2021, 11, 3031–3043. [Google Scholar] [CrossRef]
- Rabbani, H.; Khan, M.; Qureshi, M.F.; Rahman, M.A.; Seers, T.; Lal, B. Analytical Modelling of Gas Hydrates in Porous Media. In Proceedings of the Offshore Technology Conference Asia, Kuala Lumpur, Malaysia, 22–25 March 2022. [Google Scholar]
- Ahammad, M.J.; Alam, M.J.; Rahman, M.A.; Butt, S.D. Numerical simulation of two-phase flow in porous media using a wavelet based phase-field method. Chem. Eng. Sci. 2017, 17, 230–241. [Google Scholar] [CrossRef]
- Rabbani, S.; Osman, H.; Almaghrabi, Y.; Rahman, A.; Seers, M. The Control of Apparent Wettability on the Efficiency of Surfactant Flooding in Tight Carbonate Rocks. Processes 2019, 7, 684–694. [Google Scholar] [CrossRef]
- Ding, L.; Cui, L.; Jouenne, S.; Gharbi, O.; Pal, M.; Bertin, H.; Rahman, M.A.; Romero, C.; Guérillot, D. Estimation of Local Equilibrium Model Parameters for Simulation of the Laboratory Foam-Enhanced Oil Recovery Process Using a Commercial Reservoir. ACS Omega 2020, 5, 23437–23449. [Google Scholar] [CrossRef] [PubMed]
- Shachi; Yadav, B.K.; Rahman, M.A.; Pal, M. Migration of CO2 through Carbonate Cores: Effect of Salinity, Pressure, and Cyclic Brine-CO2 Injection. J. Environ. Eng. 2020, 146, 04019114. [Google Scholar] [CrossRef]
- Ahammad, J.; Rahman, M.A.; Butt, S.D.; Alam, J.M. An Experimental Development to Characterise the Flow Phenomena at the Near-Wellbore Region. In Proceedings of the ASME 2019 38th International Conference on Ocean, Offshore and Arctic Engineering, Glasgow, Scotland, UK, 9–14 June 2019. [Google Scholar]
- Elsanoose, A.; Abobaker, E.; Khan, F.; Rahman, M.A.; Aborig, A.; Butt, S.D. Experimental Investigation of Single Flow through Porous Media Around Perforation Tunnel. In Proceedings of the 7th Thermal and Fluids Engineering Conference, Las Vegas, NV, USA, 15–18 May 2022. [Google Scholar]
- Wen, Z.; Huang, G.; Zhan, H. Non-Darcian flow to a well in an aquifer–aquitard system. Adv. Water Resour. 2008, 31, 1754–1763. [Google Scholar] [CrossRef]
- Sedghi-As, M.; Rahimi, H. Adoption of Manning’s equation to 1D non-Darcy flow problems. J. Hydraul. Res. 2011, 49, 814–817. [Google Scholar] [CrossRef]
- Salahi, M.-B.; Sedghi-Asl, M.; Parvizi, M. Nonlinear Flow through a Packed-Column Experiment. J. Hydrol. Eng. 2014, 9, 04015003-1–04015003-9. [Google Scholar] [CrossRef]
- Mccorquodale, J.A.; Hannoura, A.-A.A.; Nasser, M.S. Hydraulic Conductivity Of Rockfill. J. Hydraul. Res. 2010, 16, 123–137. [Google Scholar] [CrossRef]
- Kadlec, R.; Knight, R. Treatment Wetlands; Lewis Publishers: Boca Raton, FL, USA, 1996. [Google Scholar]
- Yao, Y.; Li, G.; Qin, P. Seepage features of high-velocity non-Darcy flow in highly productive reservoirs. J. Nat. Gas Sci. Eng. 2015, 24, 1732–1738. [Google Scholar] [CrossRef]
- Elsanoose, A.; Abobaker, E.; Khan, F.; Rahman, M.A.; Aborig, A.; Butt, S.D. Estimating of Non-Darcy Flow Coefficient in Artificial Porous Media. Energies 2022, 15, 1197. [Google Scholar] [CrossRef]
Publisher’s Note: MDPI stays neutral with regard to jurisdictional claims in published maps and institutional affiliations. |
© 2022 by the authors. Licensee MDPI, Basel, Switzerland. This article is an open access article distributed under the terms and conditions of the Creative Commons Attribution (CC BY) license (https://creativecommons.org/licenses/by/4.0/).