Article

Simulation Research on Thermal Deviation in 700 °C Ultra-Supercritical Boiler

College of Energy and Mechanical Engineering, Shanghai University of Electric Power, Shanghai 201306, China
*
Author to whom correspondence should be addressed.
Energies 2022, 15(20), 7596; https://doi.org/10.3390/en15207596
Submission received: 28 August 2022 / Revised: 29 September 2022 / Accepted: 9 October 2022 / Published: 14 October 2022

Abstract

:
Based on commercial CFD software, a 700 °C ultra-supercritical tangential boiler was simulated by the orthogonal test method, and the thermal deviation of flue gas at the furnace outlet section was used as the optimization index. Three horizontal optimization treatments are designed respectively for the air distribution mode of secondary air (factor A), the reverse tangent angle of the separate over-fire air (factor B), and the upper swing angle of the burner (factor C). The range analysis method, variance analysis method, and weight matrix analysis method are used to determine the factor and level combination of the best optimization effect and the weight of each factor. The research results show that the significance of the influence of each factor on the optimization index is: B > C > A (reverse tangent angle of the separate over-fire air > the upper swing angle of the burner > the secondary air distribution mode); the weight ratios of the three factors are: factor A is 0.080, factor B is 0.543, and factor C is 0.241; based on the three analysis methods, it is concluded that factor B has a highly significant impact on the optimization index, factor C has an impact on the optimization index, and factor A has no impact on the optimization index, and it is determined that the optimal factor and level combination of the orthogonal test is A1B3C3. Under this combination, the thermal deviation in the furnace is 1.349 K, and the problem of thermal deviation is basically eliminated, being 116.066 K lower than the highest thermal deviation of 117.415 K, which is very obvious.

1. Introduction

With the increasing global greenhouse effect and the increasing shortage of fossil fuels such as coal, further improving the efficiency of coal-fired power generation and reducing CO2 emissions has become an urgent problem to be solved [1,2,3,4,5]. The 700 °C ultra-supercritical coal-fired power generation technology refers to the advanced thermal power generation technology with the main steam temperature exceeding 700 °C and the main steam pressure exceeding 35 MPa [6,7]. Without the use of secondary reheating, this technology can greatly increase the power generation efficiency of the unit by nearly 50%, or even exceeding that, thereby greatly reducing coal consumption and reducing the production of SO2 and NOX [6,8]. Therefore, the higher-efficiency 700 °C ultra-supercritical coal-fired power generation technology is currently a key research and development project [8,9].
Energy is vital to a country’s economic development. In China, coal is the main primary energy source, so coal-fired power generation is the most important way of generating electricity today [10,11]. Most domestic power station boilers use the tangential combustion method. The advantages of this combustion method are as follows: the adaptability of pulverized coal is strong, the pulverized coal is well mixed in the furnace, the combustion is stable, the flame is full, and the pulverized coal particles have a long enough residence time in the furnace, which is conducive to burnout [12,13,14]. However, this combustion method has very serious shortcomings. Due to the limitation of the furnace height, the rotating airflow in the furnace still has residual rotation in the horizontal flue of the furnace, which also causes deviations in the speed and temperature of the flue gas on the left and right sides of the horizontal flue [15,16,17,18]. The existence of flue gas temperature deviation causes uneven heat absorption between the superheater and reheater, which causes deviation of the steam temperature of the superheater and reheater system. Serious temperature deviation will cause overheating of the heat exchanger tube screen [19,20].
The numerical simulation method is widely used because of its low cost, flexible and changeable application objects, and the large amount of data that can be obtained. Ho Young Park et al. [21] carried out a numerical simulation of changing the burnout air nozzle angle based on an 800 MW tangential coal-fired boiler. The results showed that changing the separation burnout air to the optimal injection angle can significantly reduce the temperature deviation of the main steam by 18 K. The reheat steam was increased to the desired value. Hongmei Qi et al. [22] studied the effect of the reverse tangent angle of the separation burnout air on the aerodynamic field of the 600 MW boiler and found that when the SOFA reverse tangent angle is less than 15°, the airflow in the main combustion zone has basically no effect; when the SOFA reverse tangent angle is 15–20°, the airflow above the combustion zone begins to be turbulent; when the SOFA reverse tangent angle is greater than 20°, the reverse rotation phenomenon will occur above the main combustion zone. Zhipeng Yao et al. [23] studied the flue gas temperature deviation of a 700 °C tangentially fired boiler, and used the orthogonal experiment method to discuss the influence of the deflection angle of the separate over-fire air and the upward swing angle of the burner on the flue gas temperature deviation at the furnace outlet. The results showed that the deflection angle of the separate over-fire air and the upward swing angle of the burner can reduce the residual rotation momentum at the furnace outlet, and significantly reduce the flue gas temperature deviation at the furnace outlet. Tian D et al. [24] conducted a numerical simulation on the serious temperature deviation of flue gas and reheat steam in a 700 MW tangentially fired pulverized coal boiler. The study showed that the upper swing angle of the burner can effectively reduce the deviation value of flue gas. When the burner swings up 11°, the residual rotation of the horizontal flue is reduced by 44%, and the temperature deviation of the reheated steam is reduced by 12 K, which effectively reduces the residual rotation intensity and flue gas deviation. Wei Du [25], Li Yao [26] and others studied the effects of different air distribution methods on the air flow and combustion characteristics in the furnace, and found that choosing the optimal air distribution method can solve the structural wall temperature over-temperature problem of the panel superheater, effectively reducing the temperature deviation of the furnace outlet.
In this paper, the orthogonal test table is designed based on the orthogonal test method, and the combustion numerical simulation of a 700 °C ultra-supercritical boiler is carried out using the CFD software platform. The thermal deviation of the outlet section of the furnace is optimized by studying the secondary air distribution mode, the reverse tangent angle of the separate over-fire air, and the angle of the upper swing of the burner.

2. Research Object and Calculation Methods

2.1. The Research Object

The boiler studied in this paper is a 700 °C ultra-supercritical once-through boiler, with a single furnace, one intermediate reheat, four-corner tangential combustion, П-shaped layout, solid slag discharge, and all-steel suspension structure. P1 is the primary air section, P2 is also the primary air section, P3 is the central longitudinal section of the furnace, and P4 is the outlet section of the furnace. The boiler body size and section parameters are shown in Table 1. The three-dimensional structure is shown in Figure 1.
As shown in Figure 2, on the horizontal section, the primary air carries pulverized coal into the furnace along the centerline of the section; the secondary air and the primary air are injected into the furnace counterclockwise at an angle of 3°; the oil nozzle adds a small amount of oil when igniting, and after stable combustion, the secondary air is introduced; the rotation direction of the separate over-fire air is clockwise, the reverse tangent angle to the primary air is α, and the specific angle is adjusted according to the actual cases. In the longitudinal section, the burners are arranged on the four corners of the furnace, and each corner burner is divided into three groups: A, B, and C. Each single nozzle, two primary air nozzles, and four secondary air nozzles form a group.

2.2. Mathematical Model

In the process of numerical simulation of combustion, the Realizable k-ε turbulence model is used to avoid negative stress to simulate gas-phase turbulence; the PDF model is used to simulate the gas-phase combustion process in the furnace to avoid solving a large number of component transport formulas; the particle random orbit model is used to simulate the movement of pulverized coal particles; the P-1 radiation model is used to describe the radiation heat transfer calculation between the gas and the particles in the furnace. This model has a small amount of calculation and considers the effect of particle scattering; the kinetic/diffusion control reaction rate model is used to simulate the coke combustion, and this model can reflect that the coke oxidation is controlled by the rate of oxygen to the coke surface and the surface reaction rate of coke and oxygen; the two-equation competition model is used to describe the pyrolysis of pulverized coal particles; the pressure and velocity coupling is solved by the SIMPLE algorithm, and the pressure equation can be prevented by the PRESTO! format of pseudo-diffusion; other discrete methods are set to first-order upwind format.

2.2.1. Turbulence Model

The commonly used turbulence models are mainly the standard k - ε model, the RNG k - ε model, and the Realizable k - ε model. Among them, the Realizable k - ε model can simulate moderately complex flows such as jet flow, secondary flow, and swirl flow. Considering the swirl characteristic effect, the calculation is simple. In this paper, the Realizable k - ε model is used to simulate the gas-phase turbulent flow. The turbulent kinetic energy and its dissipation rate transport equation of the Realizable k - ε turbulence model are:
ρ D k D t = x j μ + μ t σ k + G k + G b ρ ε Y M
ρ D ε D t = x j μ + μ t σ t ε x j + ρ C 1 S ε ρ C 2 ε 2 k + ν ε + C 1 ε ε k C 3 ε G b
where C 1 = m a x 0.43 , η η + 5 ,   η = S k / ε ,   G k representing the turbulent kinetic energy generated by the average velocity gradient, G b   is for turbulent kinetic energy generation due to buoyancy effects, Y M   is the effect of compressible turbulent pulsation expansion on the total dissipation rate; σ k and σ ε are the turbulent Prandtl numbers of the turbulent kinetic energy and its dissipation rate, respectively; C 1 ε , C 2 , σ k and σ ε are all constants, and their values are 1.44, 1.9, 1.0, and 1.2, respectively.

2.2.2. Gas Phase Combustion Model

In this paper, in order to simulate the gas-phase combustion process in the furnace and avoid solving a large number of component transport formulas, the probability density function (PDF) model is adopted. In the probability density model, the mixture component f can be used instead to solve the transport and reaction equations in chemical equilibrium.
f = Z i Z i , o x Z i , f u e l Z i , o x
where Z i is the mass fraction of element i . The subscript Z o x represents the mass fraction at the oxidant inlet, and Z f u e l represents the mass fraction at the fuel flow inlet.

2.2.3. Radiation Model

In the pulverized coal combustion boiler, the heat transfer inside the furnace is mainly radiation heat transfer. Using the P-1 model does not consider the directivity of the radiation transfer equation, but only the diffusion equation of the incident radiation. In the P-1 model, the incident radiation variable G is described in the region by the equation composed of the diffusion and source terms as:
· τ G + S = 0
τ = 1 3 a + 3 C σ
S = a 4 σ T 4 G
To complete the realization of the P-1 model, the radiation energy equation must be coupled with the thermal energy equation. This can be done by modifying the source term and the wall boundary conditions of the energy equation.

2.2.4. Char Combustion Model

Char combustion is controlled by oxygen diffusion and surface chemical reaction rates. The kinetic/diffusion model is used to simulate the heterogeneous oxidation reaction of char. The model needs to set the kinetic parameters of char combustion, mainly referring to the preexponential factor A and the activation energy E :
k = A · exp E R T
where k is the reaction rate constant at temperature T . The recommended values for A and E are 0.0043 k g m 2 s P a   and   8.37 × 10 7   J / kmol .

2.3. Mesh System

As shown in Figure 3, the boiler model is divided into an ash hopper area, burner lower area, burner area, burner upper area, and heat exchanger area from the bottom to the top. The grid is divided according to different areas. The model mainly adopts the following structure: The grid of the burner area is divided along the direction of the airflow and is encrypted to prevent the pseudo-diffusion phenomenon that may occur in the burner area. The grid division results are divided into three levels according to the number, namely 1.22 million, 1.52 million, and 1.82 million. The grid independence verification is shown in Figure 4. The temperature distribution of the three grids is similar. The temperature distribution of the 1.22 million grid is lower than that of the 1.52 million and 1.82 million grids, while the temperature distributions of the 1.52 million and 1.82 million grids are basically the same. Considering the computational cost, the number of grids used in the simulation is determined to be 1.52 million.

2.4. Boundary Conditions

In the numerical simulation, the burner inlet condition is the velocity inlet, the P4 section of the furnace outlet is set as the pressure outlet boundary, and slight negative pressure is added to simulate the effect of the induced draft fan, and the reflux temperature of 1000 K is set. The coal consumption of the boiler is 219 t/h under the design condition, and the coal quality parameters are shown in Table 2. The design air volume of the boiler is 535 kg/s, and the specific air rate and air speed are shown in Table 3.

2.5. Simulation Conditions

The levels and factors of the orthogonal test are shown in Table 4. The factors are A (secondary air distribution mode), B (reverse tangent angle of the separate over-fire air), and C (burner swing angle). Three levels are designed for each factor. According to the factors and levels, the L 9 ( 3 4 ) orthogonal test table is selected, and the specific orthogonal test conditions are shown in Table 5. Among them, the air is equally distributed, and the secondary air of the three groups A, B, and C is 45 m·s−1; for positive pagoda-type air distribution, the secondary air of group A is 51 m·s−1, the secondary air of group B is 45 m·s−1, and the secondary air of group C is 39 m·s−1; for drum waist-type air distribution, the secondary air of group A is 43 m·s−1, the secondary air of group B is 49 m·s−1, and the secondary air of group C is 43 m·s−1.

3. Results and Discussion

3.1. Verification of Numerical Simulation Results

As shown in Table 6, comparing the simulated value of case 1 with the design value, it can be concluded that the error between the simulated value and the design value is within 5%, and there is basically no error, which can prove that it is feasible to use CFD software to simulate boiler combustion.

3.2. Analysis of Velocity Field in Furnace

Figure 5 shows the velocity field distribution of the furnace center section (Y = 9.408 m) and primary air section (Z = 23.02 m) in case 1. In the central section of the furnace, the velocity distribution is uniform and symmetrical, the velocity near the wall is high, and the velocity in the central area of the furnace is low; in the separate over-fire air area, the injected separate over-fire air speed is high, which increases the turbulence intensity and makes the airflow velocity in this area increase. In the primary air section, the primary air enters from the four corners of the furnace. Under the action of the secondary air, the airflow forms a good symmetrical tangent circle in the furnace. The air speed in the center of the furnace is low, and the wind speed near the wall is high, and there is no phenomenon of the air flow scouring the water wall.

3.3. Analysis of the Temperature Field in the Furnace
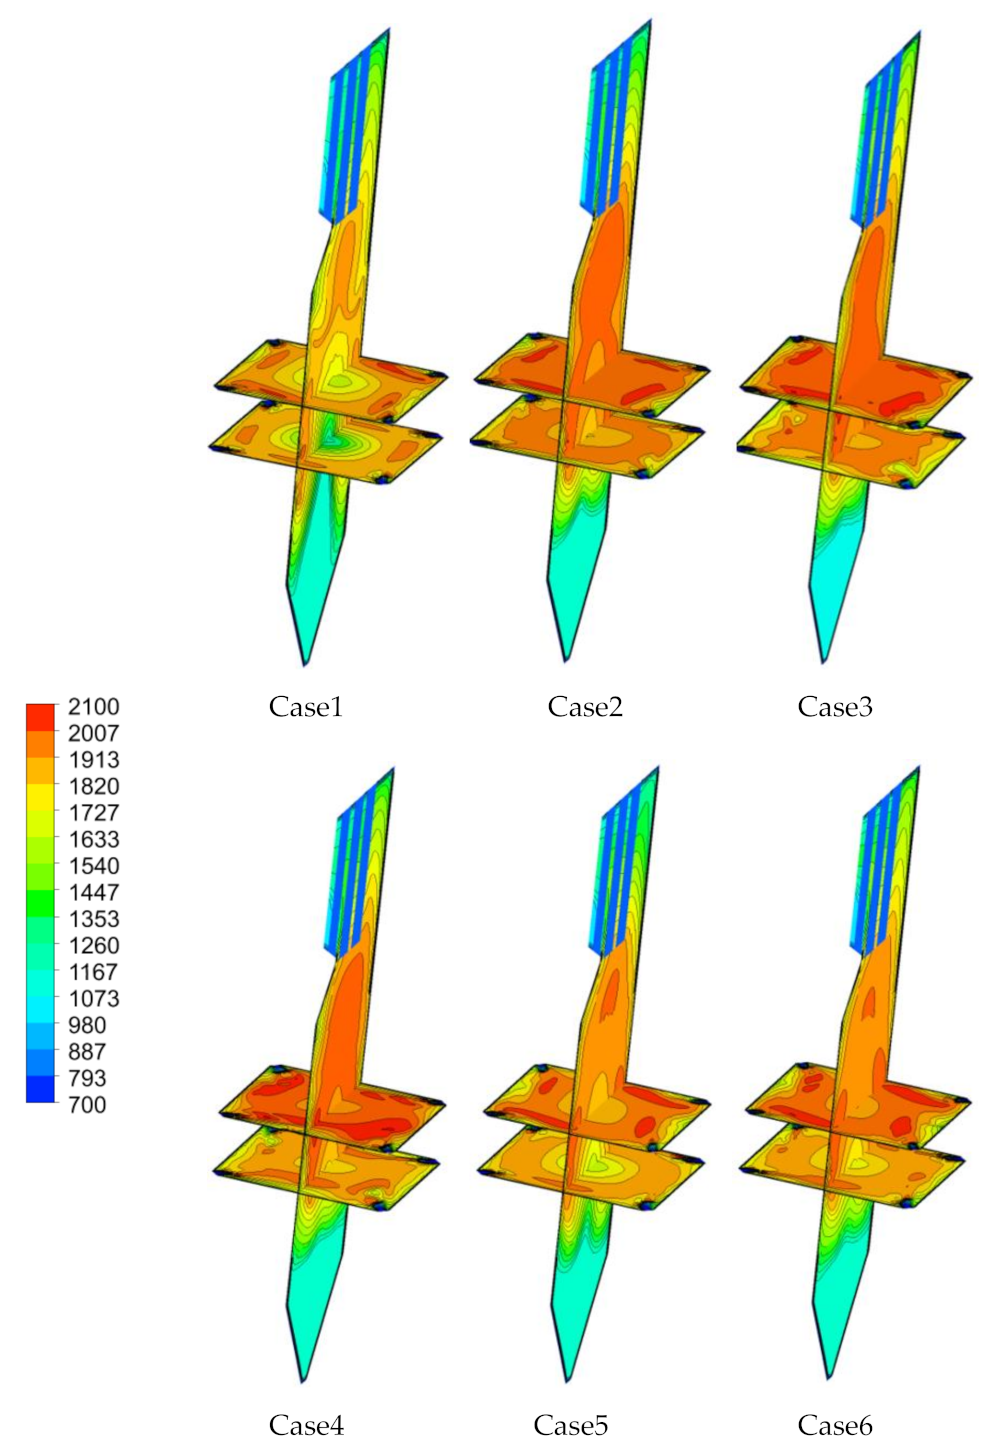
As shown in 
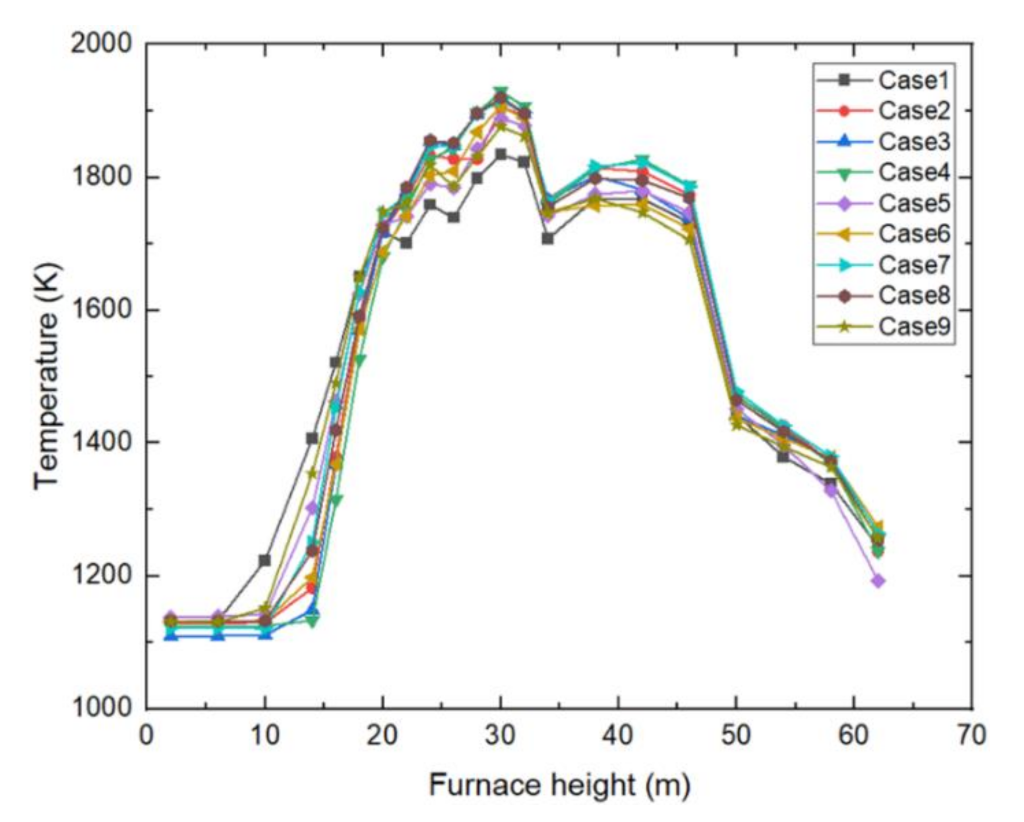
Figure 6, the temperature distribution trends along the height direction are basically the same for the nine cases. In the burner area and the lower part of the burner area, the temperature increases with the height; in the burner area, the temperature in the furnace reaches the maximum value, and the highest temperature reaches 1900 K; in the separate over-fire air area, a large amount of low-temperature burn-out air is added, which reduces the temperature of the furnace in this area; in the burnout area, due to the addition of the separate over-fire air, the unburned pulverized coal particles in the burner area continue to burn and release heat in this area, which makes the temperature in the furnace rise. Under nine different cases, changing the air distribution mode of the secondary air, the reverse tangent angle of the separate over-fire air, and the upward swing angle of the burner have no obvious impact on the main combustion zone, and can still ensure stable combustion inside the furnace.
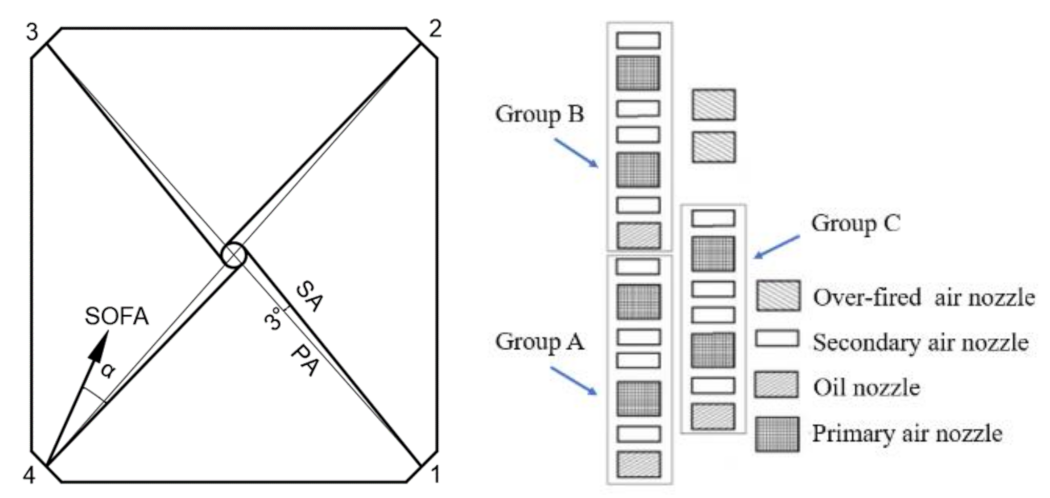
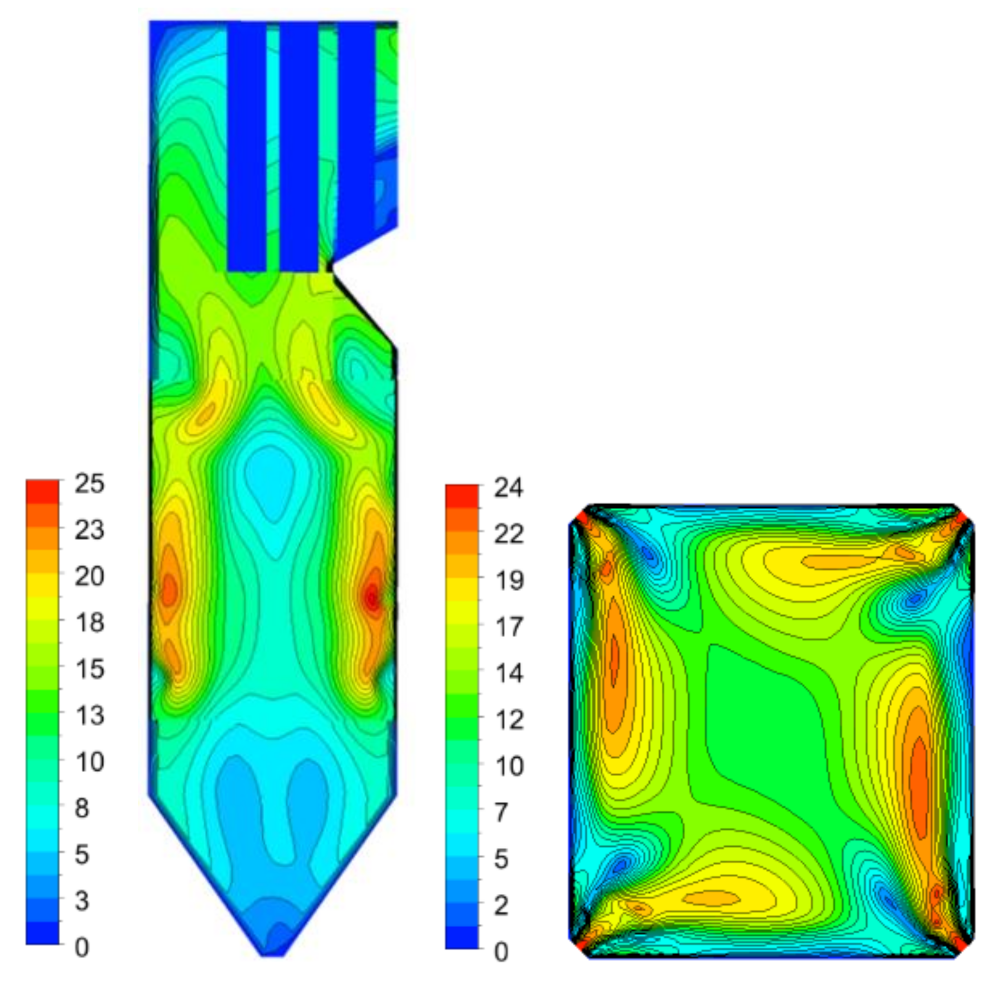
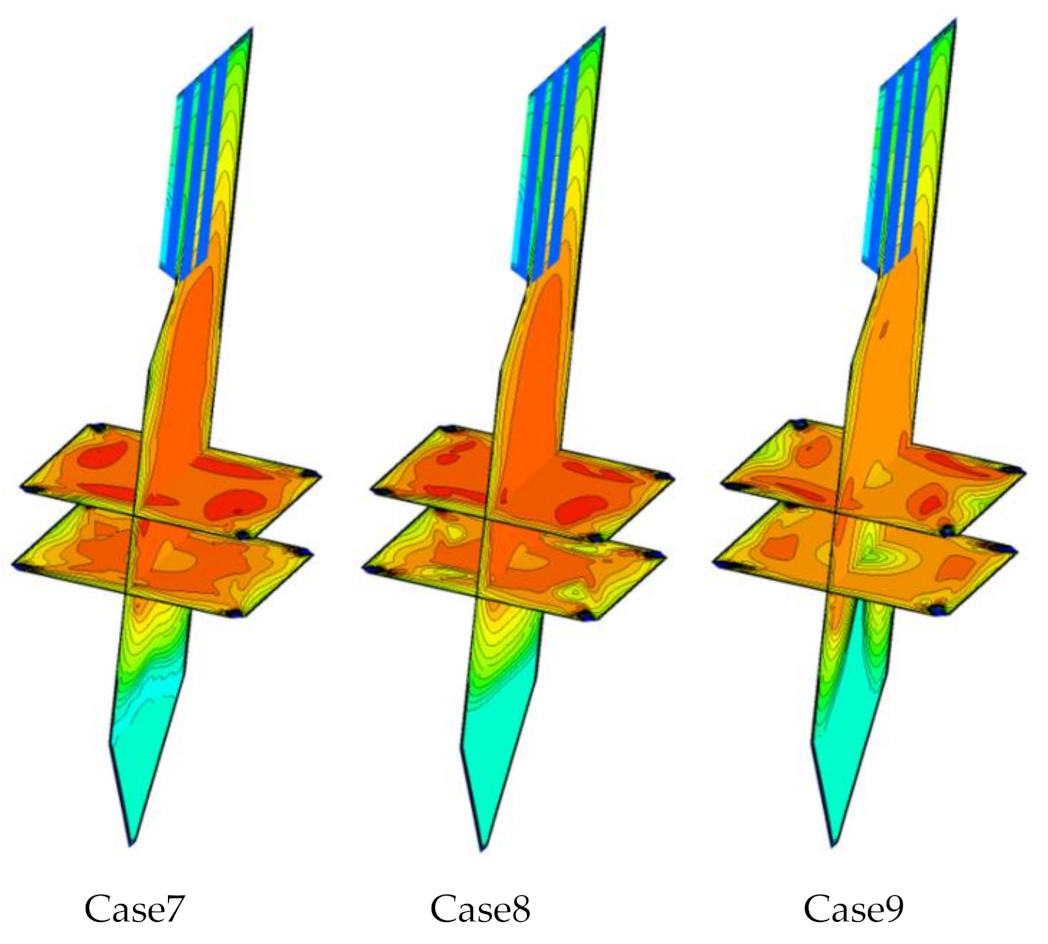
Figure 7 shows the temperature distribution in the furnace chamber. P1 and P2 are the sections where the primary air nozzles are located, and the temperature distributions of the P1 and P2 sections under each case show the characteristics of four-corner tangent circle combustion, that is, the overall temperature of the section is symmetrically distributed, the four corners of the nozzle and the near wall are the high-temperature area, and the center of the section is the low-temperature area. In cases 1, 2 and 3,as the upward swing angle of the burner increases, the diameter of the tangent circle formed by combustion on the same section decreases. The situation is similar in cases 5, 6 and 4 and in cases 9, 7 and 8. P3 is the central longitudinal section of the furnace, and the temperature distribution of the section is basically symmetrical; along the high area, the temperature near the burner is high due to the combustion of pulverized coal, and the temperature in the central area is low, and the maximum temperature of the section can reach 2000 K. The temperature of the burner area is lower than that of the burner area when the low-temperature separate over-fire air is added to this part; the unburned pulverized coal in the upper burner area of the separate over-fire air area is completely burned here, releasing heat and increasing the temperature in this area. As the upward swing angle of the burner increases, it will cause the high-temperature area in the section to move upward.

3.4. Temperature Distribution of the Furnace Outlet Section

As shown in Figure 8, based on the temperature distribution of the furnace outlet (P4) section of each case, it can be clearly seen that the temperature distributions of the P4 section in the nine cases have different degrees of temperature deviation. The distributions of high-temperature areas in case 1, case 2, case 4, case 5, case 7, and case 8 are mainly concentrated on the right side of the section. Except for case 1, the high-temperature area of the section is close to the lower area, and the high-temperature areas in other cases are all close to the upper part; in case 3, case 6, and case 9, the high temperature area of the section temperature distribution is close to the center of the section, and the section temperature deviation is significantly slowed down.

3.5. Thermal Deviation Numerical Analysis

In order to intuitively analyze the specific temperature deviation of each case, the temperature deviation value Δ T , the temperature deviation factor G , and the P4 section temperature unevenness coefficient M T are defined to describe the degree of temperature deviation in the furnace. The specific expression is as follows:
Δ T = T ¯ R T ¯ L
G = T ¯ R / T ¯ L
M T = T ¯ + 3 σ T T ¯
In Equations (8) and (9), T ¯ R represents the average temperature value on the right side of the P4 section, and T ¯ L represents the average temperature value on the left side of the P4 section; in Equation (10), T ¯ represents the average temperature of the P4 section, σ T = 1 n 1 i = 1 n T i T ¯ 2 , where T i is the temperature value on the i -th grid node.
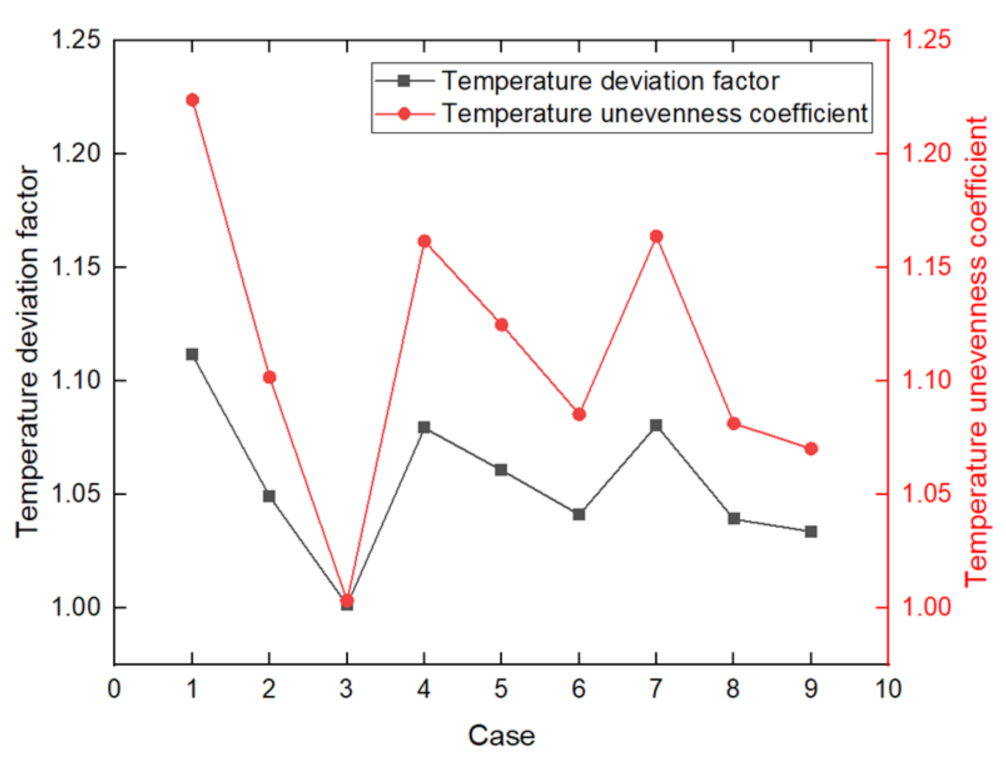
The simulation data is brought into the above formula for calculation, and the calculation result is displayed in Figure 9. It can be seen that it is consistent with the cloud map results. In case 3, case 6, and case 9, the inflection point in the figure shows a smaller P4 section temperature deviation factor and temperature distribution uneven coefficient than in the other cases; that is, the three cases’ P4 section temperature distribution is the most uniform, and the temperature deviation somewhat alleviated. Compared with each case, case 3 has the smallest temperature deviation factor and temperature distribution uneven coefficient, which is close to 1, and is the best case.

3.6. Orthogonal Results Range Analysis

The evaluation index of the orthogonal test is the temperature deviation value Δ T of the P4 section. In the table, K ¯ i j is the average value of the i -th level test index sum on the jth column (i = 1, 2, 3; j = 1, 2, 3, 4). The range R j is introduced to describe the range value of K ¯ i j on the jth column. The larger the R j , the greater the influence of the factor on the test index, and the more important is the factor. The specific formula of R j is as follows:
R j = max { K ¯ i j } min { K ¯ i j }
The calculation results are listed in Table 7. From the range analysis method, it can be concluded that the range order is R2 > R3 > R4 > R1; that is, the primary and secondary order of factors affecting the test index is: B > C > D > A, where factor D is located as the error column, the range of factor A is smaller than that of the D error column, indicating that the influence of factor A on the test index can be ignored.
The relationship between the factor level and the temperature deviation of the test index is shown in Figure 10. It can be seen that factor A has little influence on the test index and can be neglected; the optimal level is A3; factor B has the greatest influence on the test index and the optimal level is B3; factor C has a moderate influence on the test index and the optimal level is C3. Therefore, the best test combination obtained by the range analysis method is A3B3C3, and the test condition is not in the orthogonal table. The best orthogonal test condition in Table 7 is case 3, in which the thermal deviation value of section P4 is 1.349 K.

3.7. Orthogonal Results Variance Analysis

The range analysis method is relatively rough, as it does not distinguish the fluctuation of the test results caused by the factor level from the fluctuation of the test results together with the test error, and it cannot provide specific criteria for the significance of the factors affecting the test results. In order to overcome these shortcomings, this paper introduces variance analysis. Define the factor mean square sum S ¯ j in column j , F value F j in column j (where j = 1, 2, 3, 4), when the number of levels r = 3, the specific calculation formulas of S ¯ j and F j are as follows:
S ¯ j = S j / f j
F j = S ¯ j / S ¯ e
where   S j = 1 9 K ¯ 1 j K ¯ 2 j 2 + K ¯ 2 j K ¯ 3 j 2 + K ¯ 3 j K ¯ 1 j 2 , S ¯ e is the error column (D column) sum of mean squares.
Substitute the data in Table 7 into Formula (12) and compare the calculated value with the critical value in the F distribution table; critical value F 0.90 (2, 4) = 4.32, F 0.95 (2, 4) = 6.94, F 0.99 (2, 4) = 18.00. The results are shown in Table 8. It can be concluded that factor A has no effect on the test index, factor B has a significant impact on the test index, and factor C has a certain impact on the test index.

3.8. Orthogonal Result Weight Matrix Analysis

From the above two analysis methods, although the primary and secondary order of each factor and the degree of influence on the optimization index can be obtained, it cannot be reflected in the specific weight of the factors affecting the optimization index. Therefore, the weight matrix analysis method is introduced to further study the effect of each factor on test optimization index.
The weight matrix analysis method needs to list the data structure model levels as shown in Table 9. According to the data structure, a structure model is constructed, which comprises the index level, the factor layer, and the horizontal layer.
From the above data model, the index layer matrix M , the factor layer matrix T , and the horizontal layer matrix S are constructed, and the weight ratio is ω , defined as follows:
M = [ k 11 k 12 k 13 0 0 0 0 0 0 0 0 0 0 0 0 k 21 k 22 k 23 0 0 0 0 0 0 0 0 0 0 0 0 k 31 k 32 k 33 0 0 0 0 0 0 0 0 0 0 0 0 k 41 k 42 k 43 ]
T = T 1 0 0 0 0 T 2 0 0 0 0 T 3 0 0 0 0 T 4
S = S 1 S 2 S 3 S 4
ω = M T S
For the matrix M , there are k factors in the orthogonal test, each factor has m levels, and the average value of the test index of the ith level of factor Aj is K ¯ j i . If the test index is larger, then k j i = K ¯ j i ; if the test index is smaller, then k j i = 1/ K ¯ j i . For matrix T , T j = 1 / i = 1 3 k j i . For matrix S , S j = R j / j = 1 4 R j , (where i = 1, 2, 3; j = 1, 2, 3, 4).
The calculation gives ω = (0.028, 0.024, 0.029, 0.087, 0.155, 0.301, 0.062, 0.074, 0.105, 0.052, 0.045, 0.039)T. That is, the weight ratio of each factor is: A = 0.080, B = 0.543, C = 0.241, D = 0.136, factor B has the largest weight, factor A has the smallest weight, and the order of the orthogonal test factors affecting the test indicators is B > C > A.
The order of importance of the influence of different levels on the test indicators on factor A is A3 (0.029) > A1 (0.028) > A2 (0.024); on factor B, the order of importance of the influence of different levels on the test indicators is B3 (0.301) > B2 (0.155) > B1 (0.087); the order of importance of the influence of different levels on the test indicators on factor C is C3 (0.105) > C2 (0.074) > C1 (0.062); factor D is listed in the error column, and the weight of factor A is less than the weight of factor D in the blank column, so the influence of factor A on the test index factors can be ignored; according to the weight matrix analysis method, the best combination can be determined as A3B3C3.

4. Conclusions

In this study, based on the CFD software, the orthogonal test method was used to study the effects of the air distribution mode of secondary air, the reverse tangent angle of the separate over-fire air, and the upward swing angle of the burner on the thermal deviation of the flue gas at the exit section of the furnace. The orthogonal test table L 9 ( 3 4 ) was designed, nine cases were studied in total, and the results of the orthogonal test were deeply analyzed by the range analysis method, variance analysis method, and weight matrix analysis method, respectively. The relevant conclusions are as follows:
(1) From the temperature field in the furnace, it can be known that the residual swirling airflow of the horizontal flue causes uneven temperature distribution at the furnace outlet, resulting in a deviation of the flue gas temperature on the left and right sides of the furnace outlet. Changing the air distribution mode of the secondary air, the reverse tangent angle of the separate over-fire air, and the upward swing angle of the burner have no obvious impact on the main combustion zone, and can still ensure stable combustion inside the furnace.
(2) Based on the orthogonal test range and variance analysis, the degree of influence of each factor on the temperature deviation of the P4 section of the test index is as follows: factor B > factor C > factor A; factor A has no effect on the test index, factor B has a significant impact on the test index, and factor C has a certain impact on the test index.
(3) Based on the weight matrix analysis, the weight of each factor in the temperature deviation of the P4 section of the test index is: A = 0.080, B = 0.543, and C = 0.241. The weight order of each level of factor A is: A3 > A1 > A2. The weight order of each level of factor B is: B3 > B2 > B1. The weight order of each level of factor C is: C3 > C2 > C1.
(4) After the analysis of range, variance, and weight matrix, the best combination of test cases is A3B3C3; in the orthogonal table, the best combination of conditions is case 3 (A1B3C3), that is, equal air distribution, an inverse tangent angle of SOFA of −25°, and the upper swing angle of the burner of +8°. The temperature deviation value of this case is 1.349 K, which basically eliminates the thermal deviation problem of the boiler.

Author Contributions

Conceptualization, Z.K.; methodology, Z.K.; software, Z.K., J.L. and C.Z.; validation, J.L. and C.Z.; data curation, Z.K.; writing—original draft preparation, Z.K.; writing—review and editing, J.L. and C.Z.; supervision, J.L. and C.Z. All authors have read and agreed to the published version of the manuscript.

Funding

This research was funded by the National Key R&D Program of China (2018YFB060440204).

Data Availability Statement

Not applicable.

Acknowledgments

The authors would acknowledge our appreciation for the financial support from the National Key R&D Program of China (2018YFB060440204).

Conflicts of Interest

The authors declare no conflict of interest.

Nomenclature

CFDcomputational fluid dynamics
PDFProbability density function
PAprimary air
SAsecondary air
SOFAseparate over-fire air
SHsuperheater
S horizontal layer matrix
T temperature, K
Δ T temperature deviation value, K
G temperature deviation factor
R i range of factor i
M the index layer matrix
T factor layer matrix
ω weight ratio

References

  1. Yang, W.; Wang, B.; Lei, S.; Wang, K.; Chen, T.; Song, Z.; Ma, C.; Zhou, Y.; Sun, L. Combustion optimization and NOx reduction of a 600 MWe down-fired boiler by rearrangement of swirl burner and introduction of separated over-fire air. J. Clean. Prod. 2019, 210, 1120–1130. [Google Scholar] [CrossRef]
  2. Zhang, X.; Zhou, J.; Sun, S.; Sun, R.; Qin, M. Numerical investigation of low NOx combustion strategies in tangentially-fired coal boilers. Fuel 2015, 142, 215–221. [Google Scholar] [CrossRef]
  3. Zhou, J.; Zhu, M.; Xu, K.; Su, S.; Tang, Y.; Hu, S.; Wang, Y.; Xu, J.; He, L.; Xiang, J. Key issues and innovative double-tangential circular boiler configurations for the 1000 MW coal-fired supercritical carbon dioxide power plant. Energy 2020, 199, 117474. [Google Scholar] [CrossRef]
  4. Yang, J.H.; Kim, J.E.; Hong, J.; Kim, M.; Ryu, C.; Kim, Y.J.; Park, H.Y.; Baek, S.H. Effects of detailed operating parameters on combustion in two 500-MWe coal-fired boilers of an identical design. Fuel 2015, 144, 145–156. [Google Scholar] [CrossRef]
  5. Tan, P.; Tian, D.; Fang, Q.; Ma, L.; Zhang, C.; Chen, G.; Zhong, L.; Zhang, H. Effects of burner tilt angle on the combustion and NOx emission characteristics of a 700 MWe deep-air-staged tangentially pulverized-coal-fired boiler. Fuel 2017, 196, 314–324. [Google Scholar] [CrossRef]
  6. Liu, R.; Xiao, P.; Zhong, L.; Jiang, J.Z.; Xu, Z.Q. Research progress of advanced 700 °C ultra-supercritical coal-fired power generation technology. Therm. Power Gener. 2017, 46, 1–7. (In Chinese) [Google Scholar]
  7. Xu, J.; Zhou, Y.G. The Development of 700 °C USC Technology. Sino-Glob. Energy 2012, 6, 13–17. (In Chinese) [Google Scholar]
  8. Schuhbauer, C.; Angerer, M.; Spliethoff, H.; Kluger, F.; Tschaffon, H. Coupled simulation of a tangentially hard coal fired 700 °C boiler. Fuel 2014, 122, 149–163. [Google Scholar] [CrossRef]
  9. Ge, X.; Dong, J.; Fan, H.; Zhang, Z.; Shang, X.; Hu, X.; Zhang, J. Numerical investigation of oxy-fuel combustion in 700 °C-ultra-supercritical boiler. Fuel 2017, 207, 602–614. [Google Scholar]
  10. Ren, J.; Li, F.; Zhu, Q.; Wu, J.; Yang, Y.; Liu, Q.; Liu, H. Research of Multi-Fuel Burning Stability In A 300MW Coal-Fired Utility Boiler. Energy Procedia 2012, 17, 1242–1248. [Google Scholar]
  11. Chen, S.; He, B.; He, D.; Cao, Y.; Ding, G.; Liu, X.; Duan, Z.; Zhang, X.; Song, J.; Li, X. Numerical investigations on different tangential arrangements of burners for a 600 MW utility boiler. Energy 2017, 122, 287–300. [Google Scholar] [CrossRef]
  12. Wu, X.; Fan, W.; Liu, Y.; Bian, B. Numerical simulation research on the unique thermal deviation in a 1000 MW tower type boiler. Energy 2019, 173, 1006–1020. [Google Scholar] [CrossRef]
  13. Guo, A.; Fang, Q.; Zhao, S.; Wu, Y.; Xia, Y.; Zhang, C.; Chen, G. Optimal control of flue gas temperature deviation of 660 MW supercritical wall tangential pulverized coal boiler. J. Power Eng. 2017, 37, 341–348. [Google Scholar]
  14. Long, D.; Li, P.; Shi, Z.; Zhou, Y.; Zhao, H. Experimental study on reducing flue gas temperature deviation of tangentially fired boiler of 660MW unit. J. Power Eng. 2020, 40, 8–13. [Google Scholar]
  15. Liu, Y.; Fan, W.; Li, Y. Numerical investigation of air-staged combustion emphasizing char gasification and gas temperature deviation in a large-scale, tangentially fired pulverized-coal boiler. Appl. Energy 2016, 177, 323–334. [Google Scholar] [CrossRef]
  16. Chui, E.; Gao, H. Estimation of NOx emissions from coal-fired utility boilers. Fuel 2010, 89, 2977–2984. [Google Scholar] [CrossRef]
  17. Park, H.Y.; Baek, S.H.; Kim, Y.J.; Kim, T.H.; Kang, D.S.; Kim, D.W. Numerical and experimental investigations on the gas temperature deviation in a large scale, advanced low NOx, tangentially fired pulverized coal boiler. Fuel 2013, 104, 641–646. [Google Scholar] [CrossRef]
  18. Zhou, H.; Zhou, K.; Tang, Q.; Chen, S.; Cen, K. Using a core-vector machine to correct the steam-separator temperature deviations of a 1000 MW boiler. Fuel 2014, 130, 142–148. [Google Scholar] [CrossRef]
  19. Liu, H.; Zhang, L.; Li, Q.; Zhu, H.; Deng, L.; Liu, Y.; Che, D. Effect of FGR position on the characteristics of combustion, emission and flue gas temperature deviation in a 1000 MW tower-type double-reheat boiler with deep-air-staging. Fuel 2019, 246, 285–294. [Google Scholar] [CrossRef]
  20. Liu, Y.C.; Fan, W.D.; Wu, M.Z. Experimental and numerical studies on the gas velocity deviation in a 600 MWe tangentially fired boiler. Appl. Therm. Eng. 2017, 110, 553–563. [Google Scholar] [CrossRef]
  21. Park, H.Y.; Baek, S.H.; Kim, H.H.; Kim, Y.J.; Kim, T.H.; Lim, H.S.; Kang, D.S. Reduction of main steam temperature deviation in a tangentially coal-fired, two pass boiler. Fuel 2016, 166, 509–516. [Google Scholar] [CrossRef]
  22. Qi, H.; Hui, S.; Cui, D. Test Study on in-fluence of the reversed tangential angle for separating over-fired air upon the aerodynamic field in furnace. Therm. Power Gener. 2010, 39, 13–17. (In Chinese) [Google Scholar]
  23. Yao, Z.; Liu, J.; Qiu, Z.; Pan, W.; Wu, Z. Numerical investigation of 700 °C boiler flue gas thermal deviation based on orthog-onal experiment. Fuel 2021, 295, 120510. [Google Scholar] [CrossRef]
  24. Tian, D.; Zhong, L.; Tan, P.; Ma, L.; Fang, Q.; Zhang, C.; Zhang, D.; Chen, G. Influence of vertical burner tilt angle on the gas temperature deviation in a 700 MW low NOx tangentially fired pulverised-coal boiler. Fuel Process. Technol. 2015, 138, 616–628. [Google Scholar] [CrossRef]
  25. Du, W.; Ding, H.; Pan, W.; Guo, D.; Zhou, Q.; Guo, S.; Ding, C.; Ding, Y. Numerical simulation of air distribution influence on combustion characteristics in furnace under deep air staging condition. J. Shanghai Univ. Electr. Power 2021, 37, 361–365. (In Chinese) [Google Scholar]
  26. Yao, L.; Ren, B.; Wu, S. Experimental study on combustion adjustment of a newly built 660 MW supercritical tangentially fired boiler. Energy Energy Conserv. 2020, 11, 139–141. (In Chinese) [Google Scholar]
Figure 1. Boiler structure.
Energies 15 07596 g001
Figure 2. Burner section and vertical layout.
Energies 15 07596 g002
Figure 3. Grid division of boiler.
Energies 15 07596 g003
Figure 4. Temperature distribution along furnace height.
Energies 15 07596 g004
Figure 5. The velocity field distribution of the furnace center section and primary air section (velocity: m·s−1).
Energies 15 07596 g005
Figure 6. Temperature distribution in furnace height direction under various cases.
Energies 15 07596 g006
Figure 7. Temperature distribution of P1, P2 and P3 sections in the furnace under nine cases (temperature: K).
Energies 15 07596 g007aEnergies 15 07596 g007b
Figure 8. P4 section temperature distribution (temperature: K).
Energies 15 07596 g008
Figure 9. P4 section temperature parameter.
Energies 15 07596 g009
Figure 10. Relationship between temperature deviation and factor level.
Energies 15 07596 g010
Table 1. Boiler body size and section parameters.
NameProjectValue
Boiler body sizeWidth18.816 m
Depth16.80 m
Height63.29 m
Section parametersP1 sectionZ = 23.02 m
P2 sectionZ = 27.05 m
P3 sectionY = 9.408 m
P4 section/
Table 2. Coal quality parameters.
NameCoal CompositionValue
Proximate analysisMar (%)14.00
Aar (%)12.00
Var (%)27.00
FCar (%)47.00
Ultimate analysisCar (%)61.45
Har (%)3.61
Nar (%)0.71
Oar (%)7.80
Sar (%)0.43
Calorific valueQnet,ar (MJ·kg−1)23.42
Table 3. Wind rate and wind speed parameters.
ProjectPrimary AirSecondary AirSeparate Over-Fire AirAir Leakage
wind rate/%16.955.322.85
wind speed/m·s−1244556/
Table 4. Orthogonal test factors and levels.
LevelFactor AFactor BFactor C
1Equal air distribution0
2Positive pagoda-type air distribution−15°+5
3Drum waist-type air distribution−25°+8
Table 5. Orthogonal test conditions.
CaseFactor AFactor BFactor C
1111
2122
3133
4213
5221
6232
7312
8323
9331
Table 6. Simulation value and design value.
LocationProjectDesign
Values
Analog
Values
Error Values
Final SH inletflue gas temperature/K127012481.76%
Final SH inletO2 volume fraction/%2.792.883.13 %
Final SH outletCarbon content of fly ash/%1.501.542.60%
Final SH outletCO2 volume fraction/%16.3817.214.82%
Table 7. Orthogonal test range analysis.
CaseABCD Δ T / K
11113117.415
2122253.740
313311.349
4213285.271
5221166.235
6232345.178
7312186.425
8323342.836
9331237.009
K ¯ 1 j 57.50196.37073.55351.336
K ¯ 2 j 65.56154.27061.78158.673
K ¯ 3 j 55.42327.84543.15268.476
R j 10.13868.52530.40117.140
Table 8. Orthogonal test variance analysis.
Source of VarianceSum of Mean Squares F Value Salience
AΔ9.559
B398.13023.277influential
C78.3244.579more influential
e24.650
eΔ34.209
Table 9. Data structure model hierarchy table.
Indicator Layer P 4   Sec tion   Temperature   Deviation   Value   Δ T
factor layerfactor Afactor Bfactor Cfactor D
horizontal layer123123123123
Publisher’s Note: MDPI stays neutral with regard to jurisdictional claims in published maps and institutional affiliations.

