Article

Tensor-Based Harmonic Analysis of Distribution Systems

1
Transpower New Zealand Ltd., 22 Boulcott Street, Wellington P.O. Box 1021, New Zealand
2
Electrical & Computer Engineering Department, University of Canterbury, Private Bag 4800, Christchurch 8140, New Zealand
*
Author to whom correspondence should be addressed.
Energies 2022, 15(20), 7521; https://doi.org/10.3390/en15207521
Submission received: 9 September 2022 / Revised: 28 September 2022 / Accepted: 6 October 2022 / Published: 12 October 2022
(This article belongs to the Special Issue Advances in Multi-Energy Systems and Smart Grids)

Abstract

:
Over the past few decades, there have been rapid advances in solid-state technology as well as a reduction in cost. This, coupled with the functionality and efficiency improvements they afford, has resulted in a massive increase in the use of electronic devices. Where traditionally, there were a few well-known nonlinear loads that needed to be considered, now there are numerous low-power devices. Although individually insignificant, collectively, they are very significant. This paper presents a tensor-based harmonic analysis approach that is capable of capturing important interactions while being computationally efficient enough to model a large distribution system. Numerical experiments are used to highlight the advantages of the tensor framework. Numerous papers have investigated the tensor parametrisation or its mathematical equivalent—harmonically coupled admittance matrices (also known as frequency coupling matrices). However, this paper, for the first time, demonstrates how these models can be applied to perform harmonic modelling of a complete low voltage (LV) distribution system.

1. Introduction

Simulation tools are critical for planning studies as well as investigating problems and finding remedies in an electrical power system. The widespread use of electronic devices is changing the nature of the equipment connected to the power system. The desire for a sustainable system has seen an exponential growth of renewable energy resources. The energy efficiency improvements and improved functionality has seen the replacement of direct connected induction motors with variable speed drives (VSDs) for use in irrigation, heat pumps/air conditioners, and even in fridges and freezers, washing machines, and clothes dryers. In addition, lighting technology is now nonlinear. These changes have created great challenges for the simulation tools used for power system analysis [1]. This paper will focus on one such tool, harmonic analysis.
The presence of nonlinear equipment necessitates harmonic analysis to ensure harmonic levels are acceptable and undesirable interference between devices does not occur. Historically, the system was predominantly linear, with only a few large well-known nonlinear devices. This allowed a number of frequency-domain, time-domain, and hybrid tools to be applied. With an extremely large number of nonlinear devices in the network, new techniques need to be adopted. Frequency-domain modelling approaches are computationally more efficient than time-domain and better suited for analysing large networks. The traditional method is a direct injection (harmonic current sources and harmonic voltage sources). An early attempt to model the effect of the widespread use of a nonlinear device (i.e., CFLs) was that of [2]. Because of the scale of the problem, one branch of the network was modelled in detail, and to capture the effect of the rest of the nonlinear loads, Norton equivalents were used at each junction of the network. The method of obtaining these Norton equivalents was given. Although this approach correctly modelled all the nonlinear devices in the network, it did not model how the harmonic current injected by the nonlinear devices was a function of the voltage distortion at its terminals. Other frequency-domain techniques have been developed to overcome this limitation, such as iterative harmonic analysis (IHA) [3,4], frequency coupling matrices (FCM) [5,6,7,8,9], harmonic domain [10,11,12,13], and harmonic state space [14]. Although they do overcome the simplifications in the direct injection method, they are best applied to cases where there are only a few significant nonlinear devices because of the dimensionality of the formulation. The dimensions become more intractable when a large number of harmonics are considered (e.g., when both low frequency and high frequency are considered as they interact and, hence, interdepend). Solutions such as thresholding and adaptive generation of harmonics (or interharmonics) need to be considered only to partially mitigate the dimensionality problem.
Previous work has shown the phase-dependent behaviour in nonlinear electronic devices in the frequency domain, and the tensor representation can correctly model this, unlike complex numbers [10,11,12,13]. This phase dependency manifests itself in the way the harmonic current changes with the voltage harmonics (in both self and cross-coupling harmonic terms) at its terminals. This is caused by the harmonic currents of the device itself flowing through the network impedances, as well as the harmonic currents from other nonlinear devices, as shown in Figure 1. Figure 1 also depicts the flow of fundamental and harmonic power.
Therefore, the tensor-based analysis holds the promise of being able to effectively model large networks while correctly representing this interaction. This paper builds on the previous work by formulating a tensor-based harmonic analysis tool and demonstrating the impact of correctly modelling the interaction between the AC system and nonlinear device, as well as the interaction of multiple nonlinear devices. Although there are many papers on the parameterisation of the response of nonlinear devices to terminal voltage distortion, they demonstrate the accuracy of the developed device model in isolation (e.g., [15]). In this study, a complete LV feeder is presented with a variety of nonlinear loads in each home, each represented by a detailed harmonically coupled model.

2. Phase Dependency and Harmonic Interaction

The first stage is characterising the admittance loci and finding the representative tensors. Derivation of the admittance loci can be via time-domain simulations, which inherently models this interaction and phase dependency, or physical testing in the laboratory. Both require perturbation of the distorting harmonic voltage the device is subjected to and measuring the harmonic current response at the various harmonic orders, as illustrated in Figure 2. The subscripts m and n are the harmonic order of the current and voltage, respectively. From these admittance loci (or impedance loci), representative tensors over a range of distortion levels can be developed. Normally I m b a s e is taken as the harmonic current when the voltage waveform is undistorted (i.e., V n b a s e = 0 ).
The incremental admittance is:
Y ( m , n ) = I m I m b a s e V n V n b a s e
The nonlinear device can be viewed as a Norton equivalent where the shunt admittance is a tensor parallel with a fixed harmonic current source (base harmonic current injection), as shown in Figure 3. From Figure 3, it is evident that the larger the terminal distortion, the greater the ΔV and greater the ΔI, which is the difference between the fixed current injection and what will be the actual current injection.
Phase dependency can be modelled using either complex conjugates representation [16] or 2 × 2 tensor using only positive frequencies. The latter is used in the present work, with each element being a tensor comprising four real numbers. For a given frequency, the tensor takes the form:
Δ I R Δ I I = Y 11 Y 12 Y 21 Y 22 Δ V R Δ V I = Y T Δ V R Δ V I
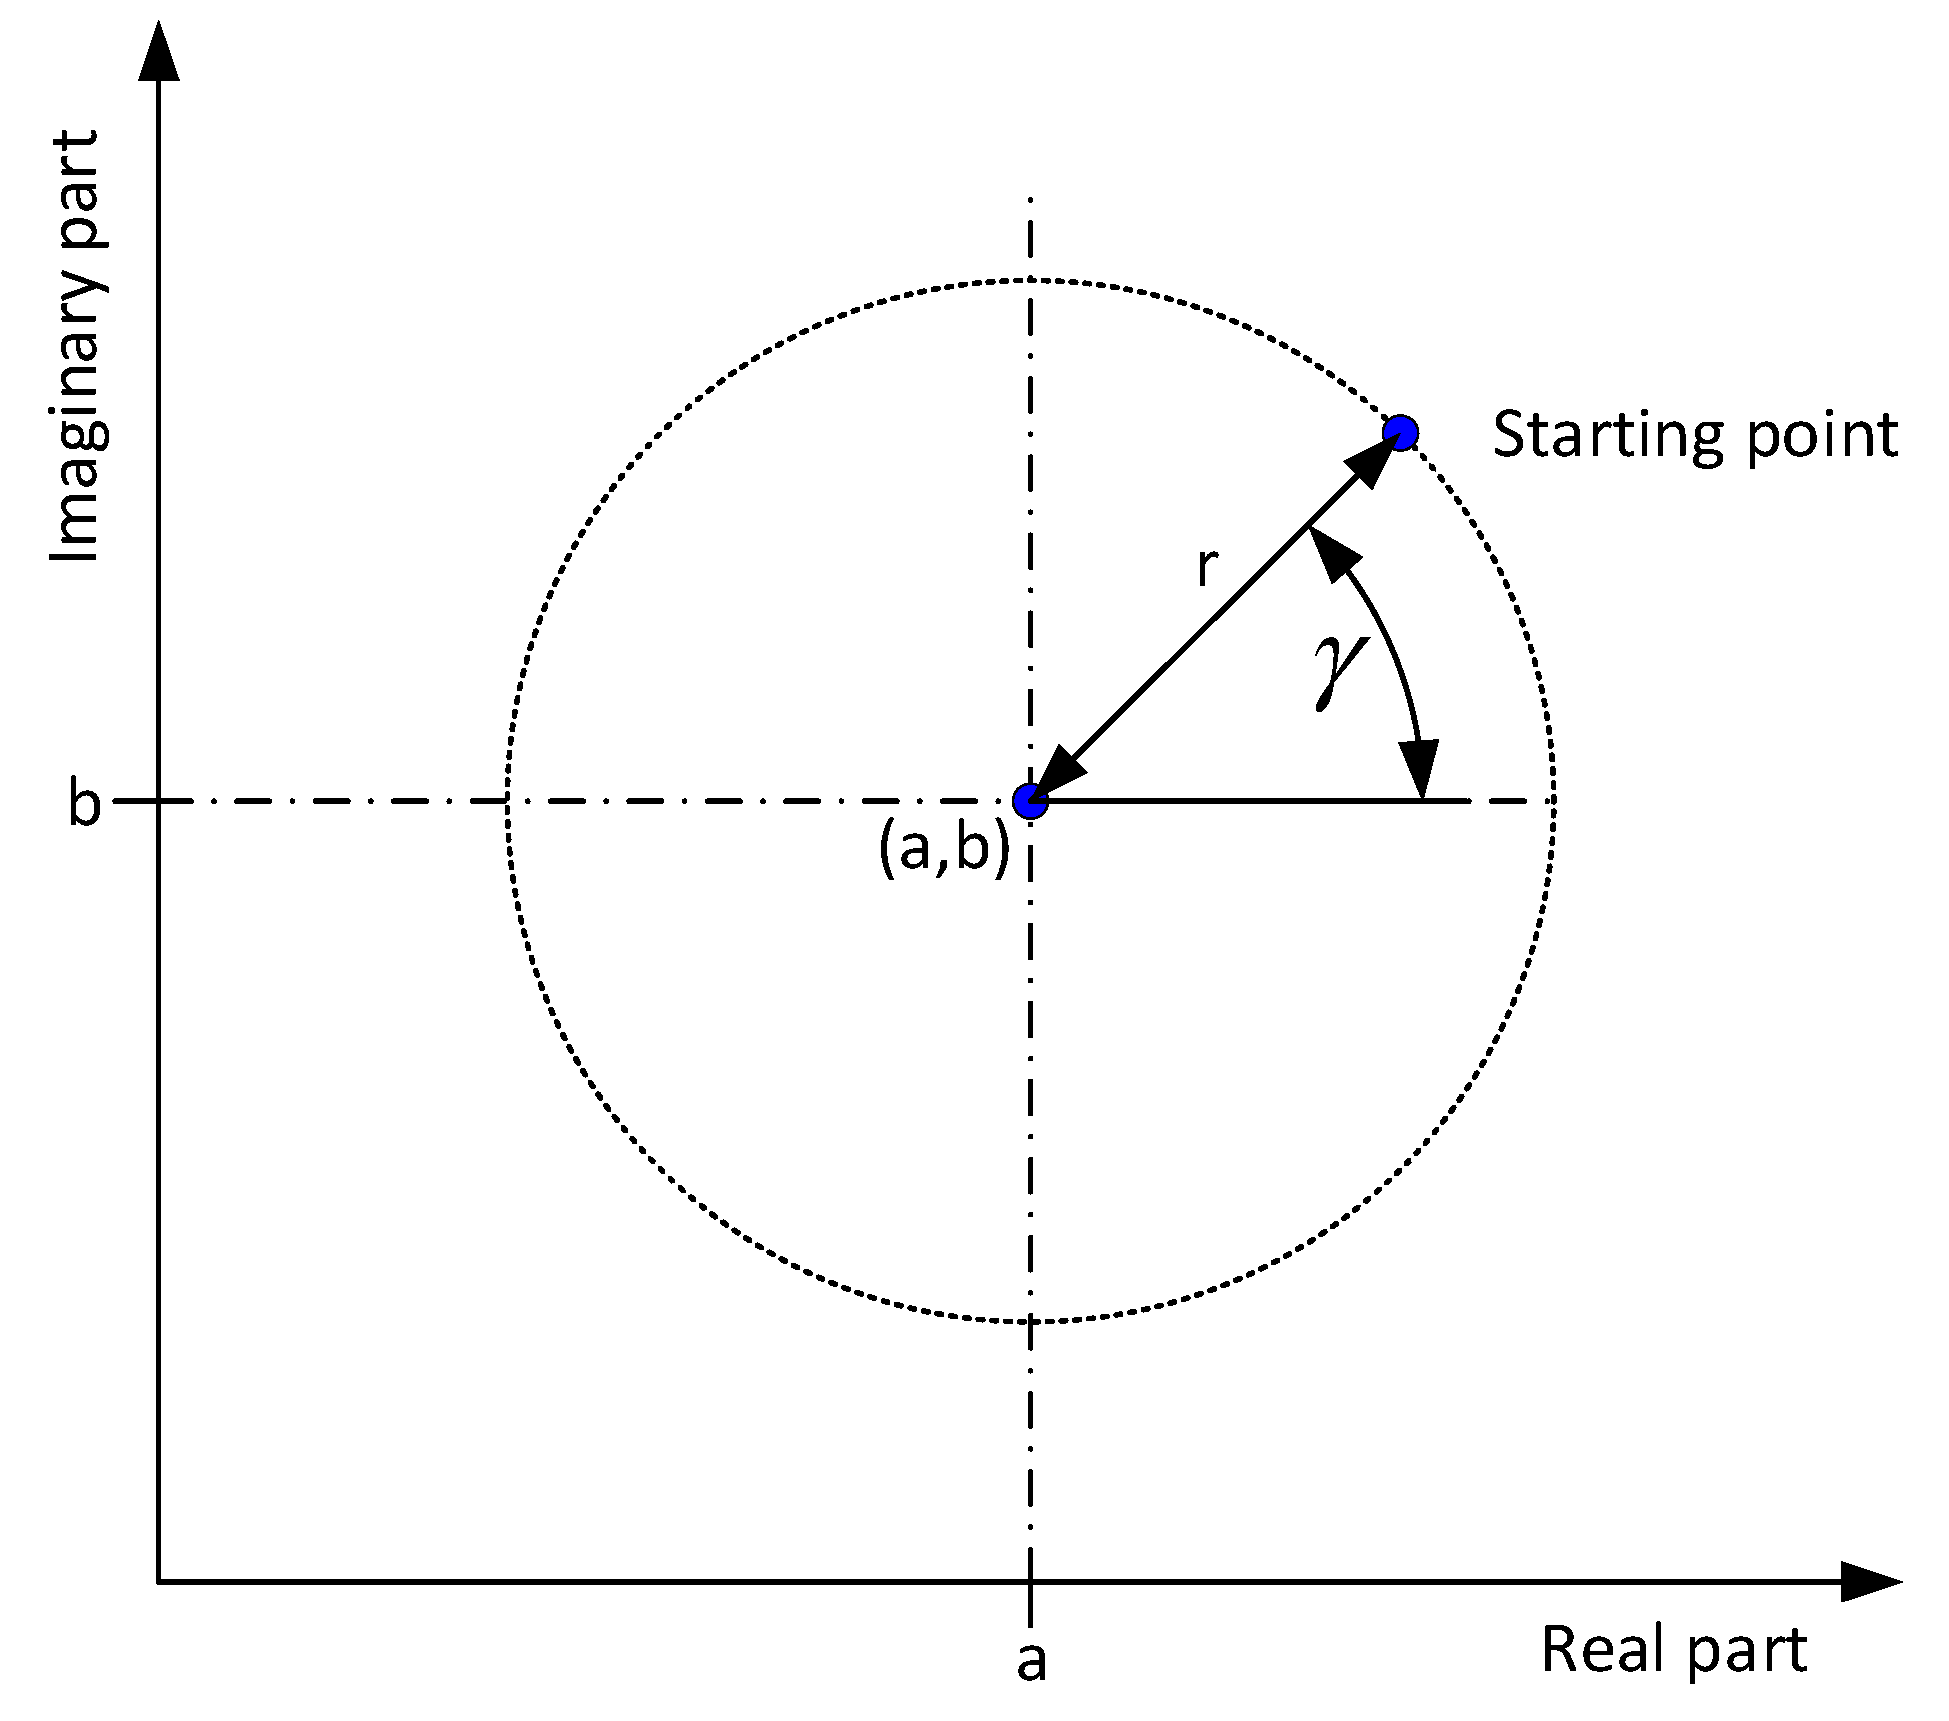
In the complex (real–imaginary) plane, the 2 × 2 tensor expressing the phase dependency is a circular locus, as depicted in Figure 4. The loci points depend on the phase of the harmonic voltage relative to the fundamental voltage. The main features a, b, r, and γ are given by Equations (3)–(6).
a = 1 2 Y 11 + Y 22
b = 1 2 Y 21 Y 12
r = 1 2 Y 11 Y 22 2 + Y 21 + Y 12 2
γ = tan 1 Y 21 + Y 12 Y 11 Y 22
A complex number is a special case of a tensor with a radius of zero. It should be noted that the analysis here applied to admittances is equally applicable to incremental impedances as in [11]. An earlier paper [17] concentrated on the determination of the tensor elements from the perturbation results. Numerically obtained tensors were verified via laboratory testing.

3. Tensor-based Harmonic Analysis Formulation

Expanding the tensor for one frequency to include cross-coupling between frequencies gives:
Δ I R Δ I I 3 Δ I R Δ I I 5 Δ I R Δ I I 7 Δ I R Δ I I N = Y T 3 , 3 Y T 3 , 5 Y T 3 , 7 Y T 3 , N Y T 5 , 3 Y T 5 , 5 Y T 5 , 7 Y T 5 , N Y T 7 , 3 Y T 7 , 5 Y T 7 , 7 Y T 7 , N Y T N , 3 Y T N , 5 Y T N , 7 Y T N , N Δ V R Δ V I 3 Δ V R Δ V I 5 Δ V R Δ V I 7 Δ V R Δ V I N
The subscripts denote the frequencies coupled., i.e., [YT]k,m is derived from the kth order harmonic current response to a perturbation in the mth order harmonic voltage. These are used to populate the system admittance matrix in the same fashion admittances are traditionally used to generate a system admittance matrix in a nodal formulation [18]. In building the system admittance matrix, the normal rules for a nodal formulation are adhered to; that is, the self-terms are the sum of the admittance tensors of all the connected branches, and the off-diagonal terms are the negative of the interconnecting branches’ admittance tensor.
The framework for modelling a complete system containing n nodes is shown in Figure 5 [16]. First, the incremental admittance (loci) is determined and then tensor parameterisation (generation of representative tensors). In the tensor-based harmonic analysis, the tensors for all the components are then assembled into a system incremental admittance matrix, and this system equation is solved for the harmonic current contributions (current through the tensor block in Figure 3), based on the latest estimate of voltage distortion. From this and other harmonic current injections (e.g., fixed harmonic current sources), the harmonic voltages throughout the system are determined. These new harmonic voltages are used to update the harmonic contribution of the nonlinear devices. This is continued until convergence is achieved.

4. Numerical Experiment

To illustrate the application of the tensor-based analysis, two test systems will be used, each nonlinear in differing proportions [11]. Both systems are existing distribution systems but are also representative of their class after using k-mean clustering on 10,558 LV networks—representative as they are closest to the centroid of the cluster based on the four cluster variables.

4.1. Urban LV Network

The LV network consists of 1110 nodes (shown in Figure 6). Although the reticulation is a three-phase four-wire multiple earthed neutral (MEN) system with 370 connecting points, the homes are predominantly single-phase connections. It can be shown that tensors representing individual devices in a home can be added to give a tensor for one home without loss of accuracy. These tensors can then be used to build up the system admittance matrix. The form of the system admittance matrix is shown in Figure 7. The system admittance matrix is extremely sparse, so sparsity storage and algorithms would greatly improve the tensor-based analysis. The dimension is 17,760 × 17,760 as there are 370 three-phase connection points, the tensor is 2 × 2, and 8 harmonic orders are considered (17,760 = 370 × 3 × 2 × 8).
For the comparison with the fixed harmonic current injection approach, three representative cases were considered. These were 30% of the load nonlinear, 60%, and, finally, 90%.
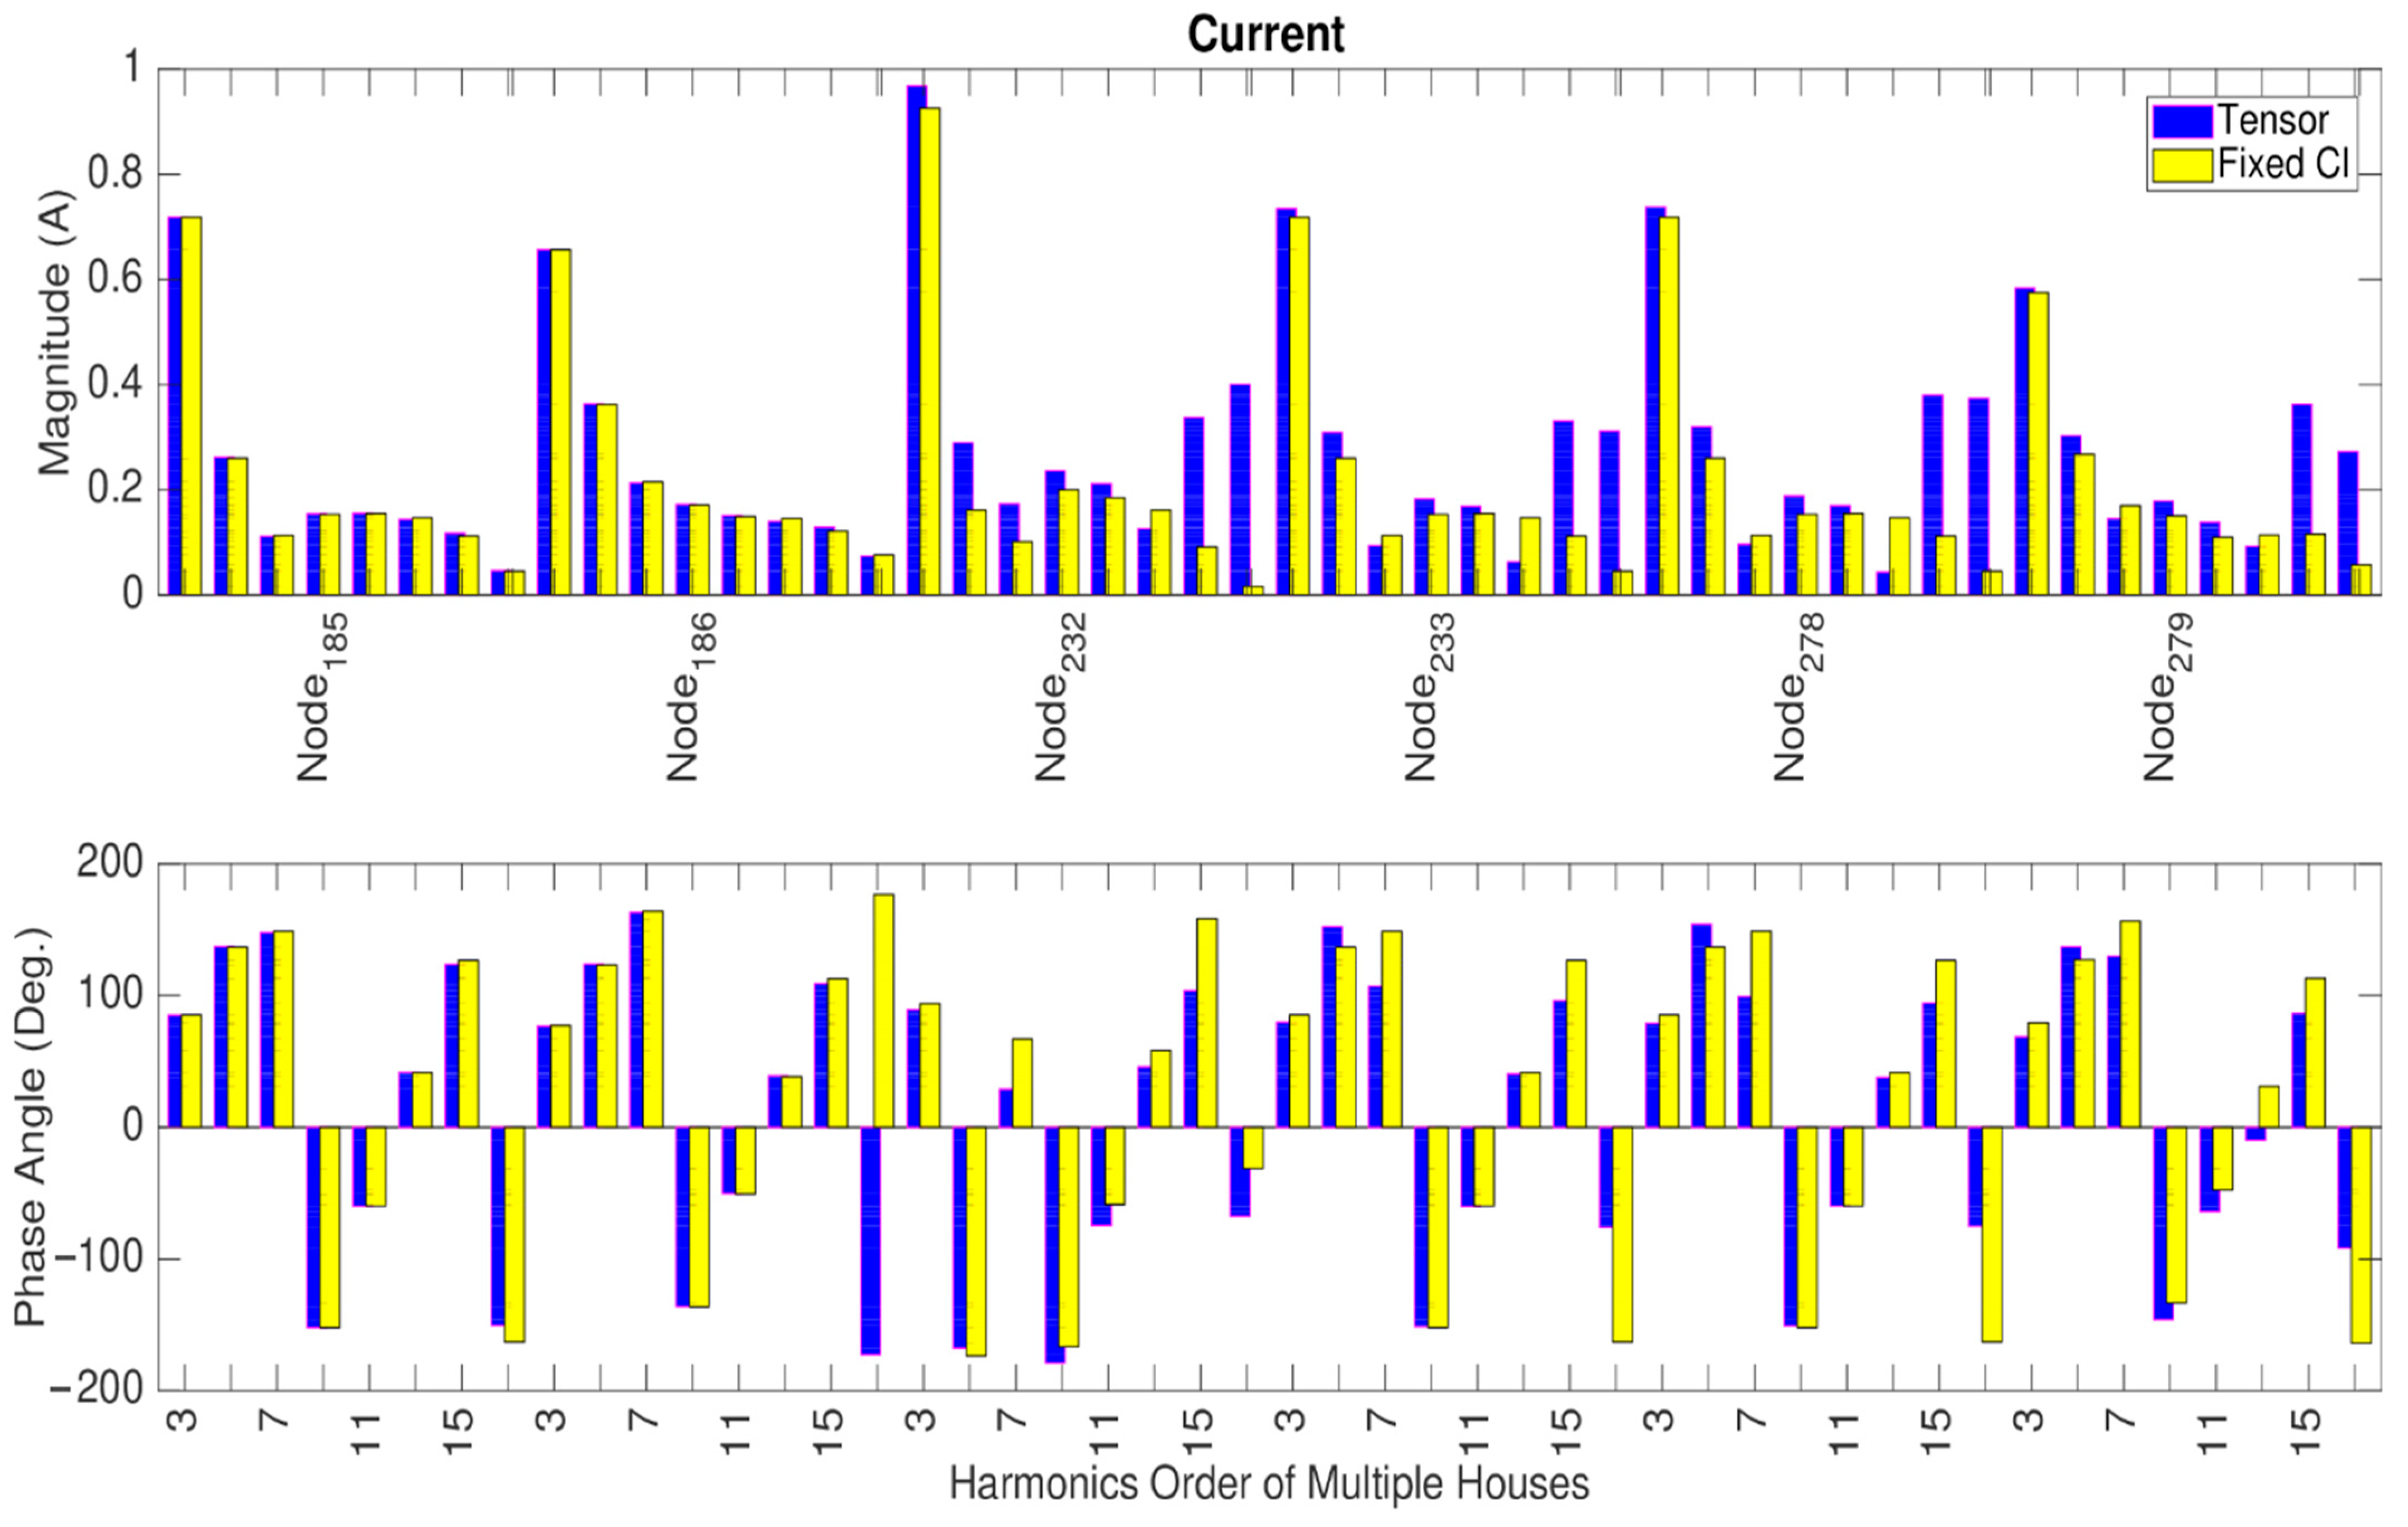
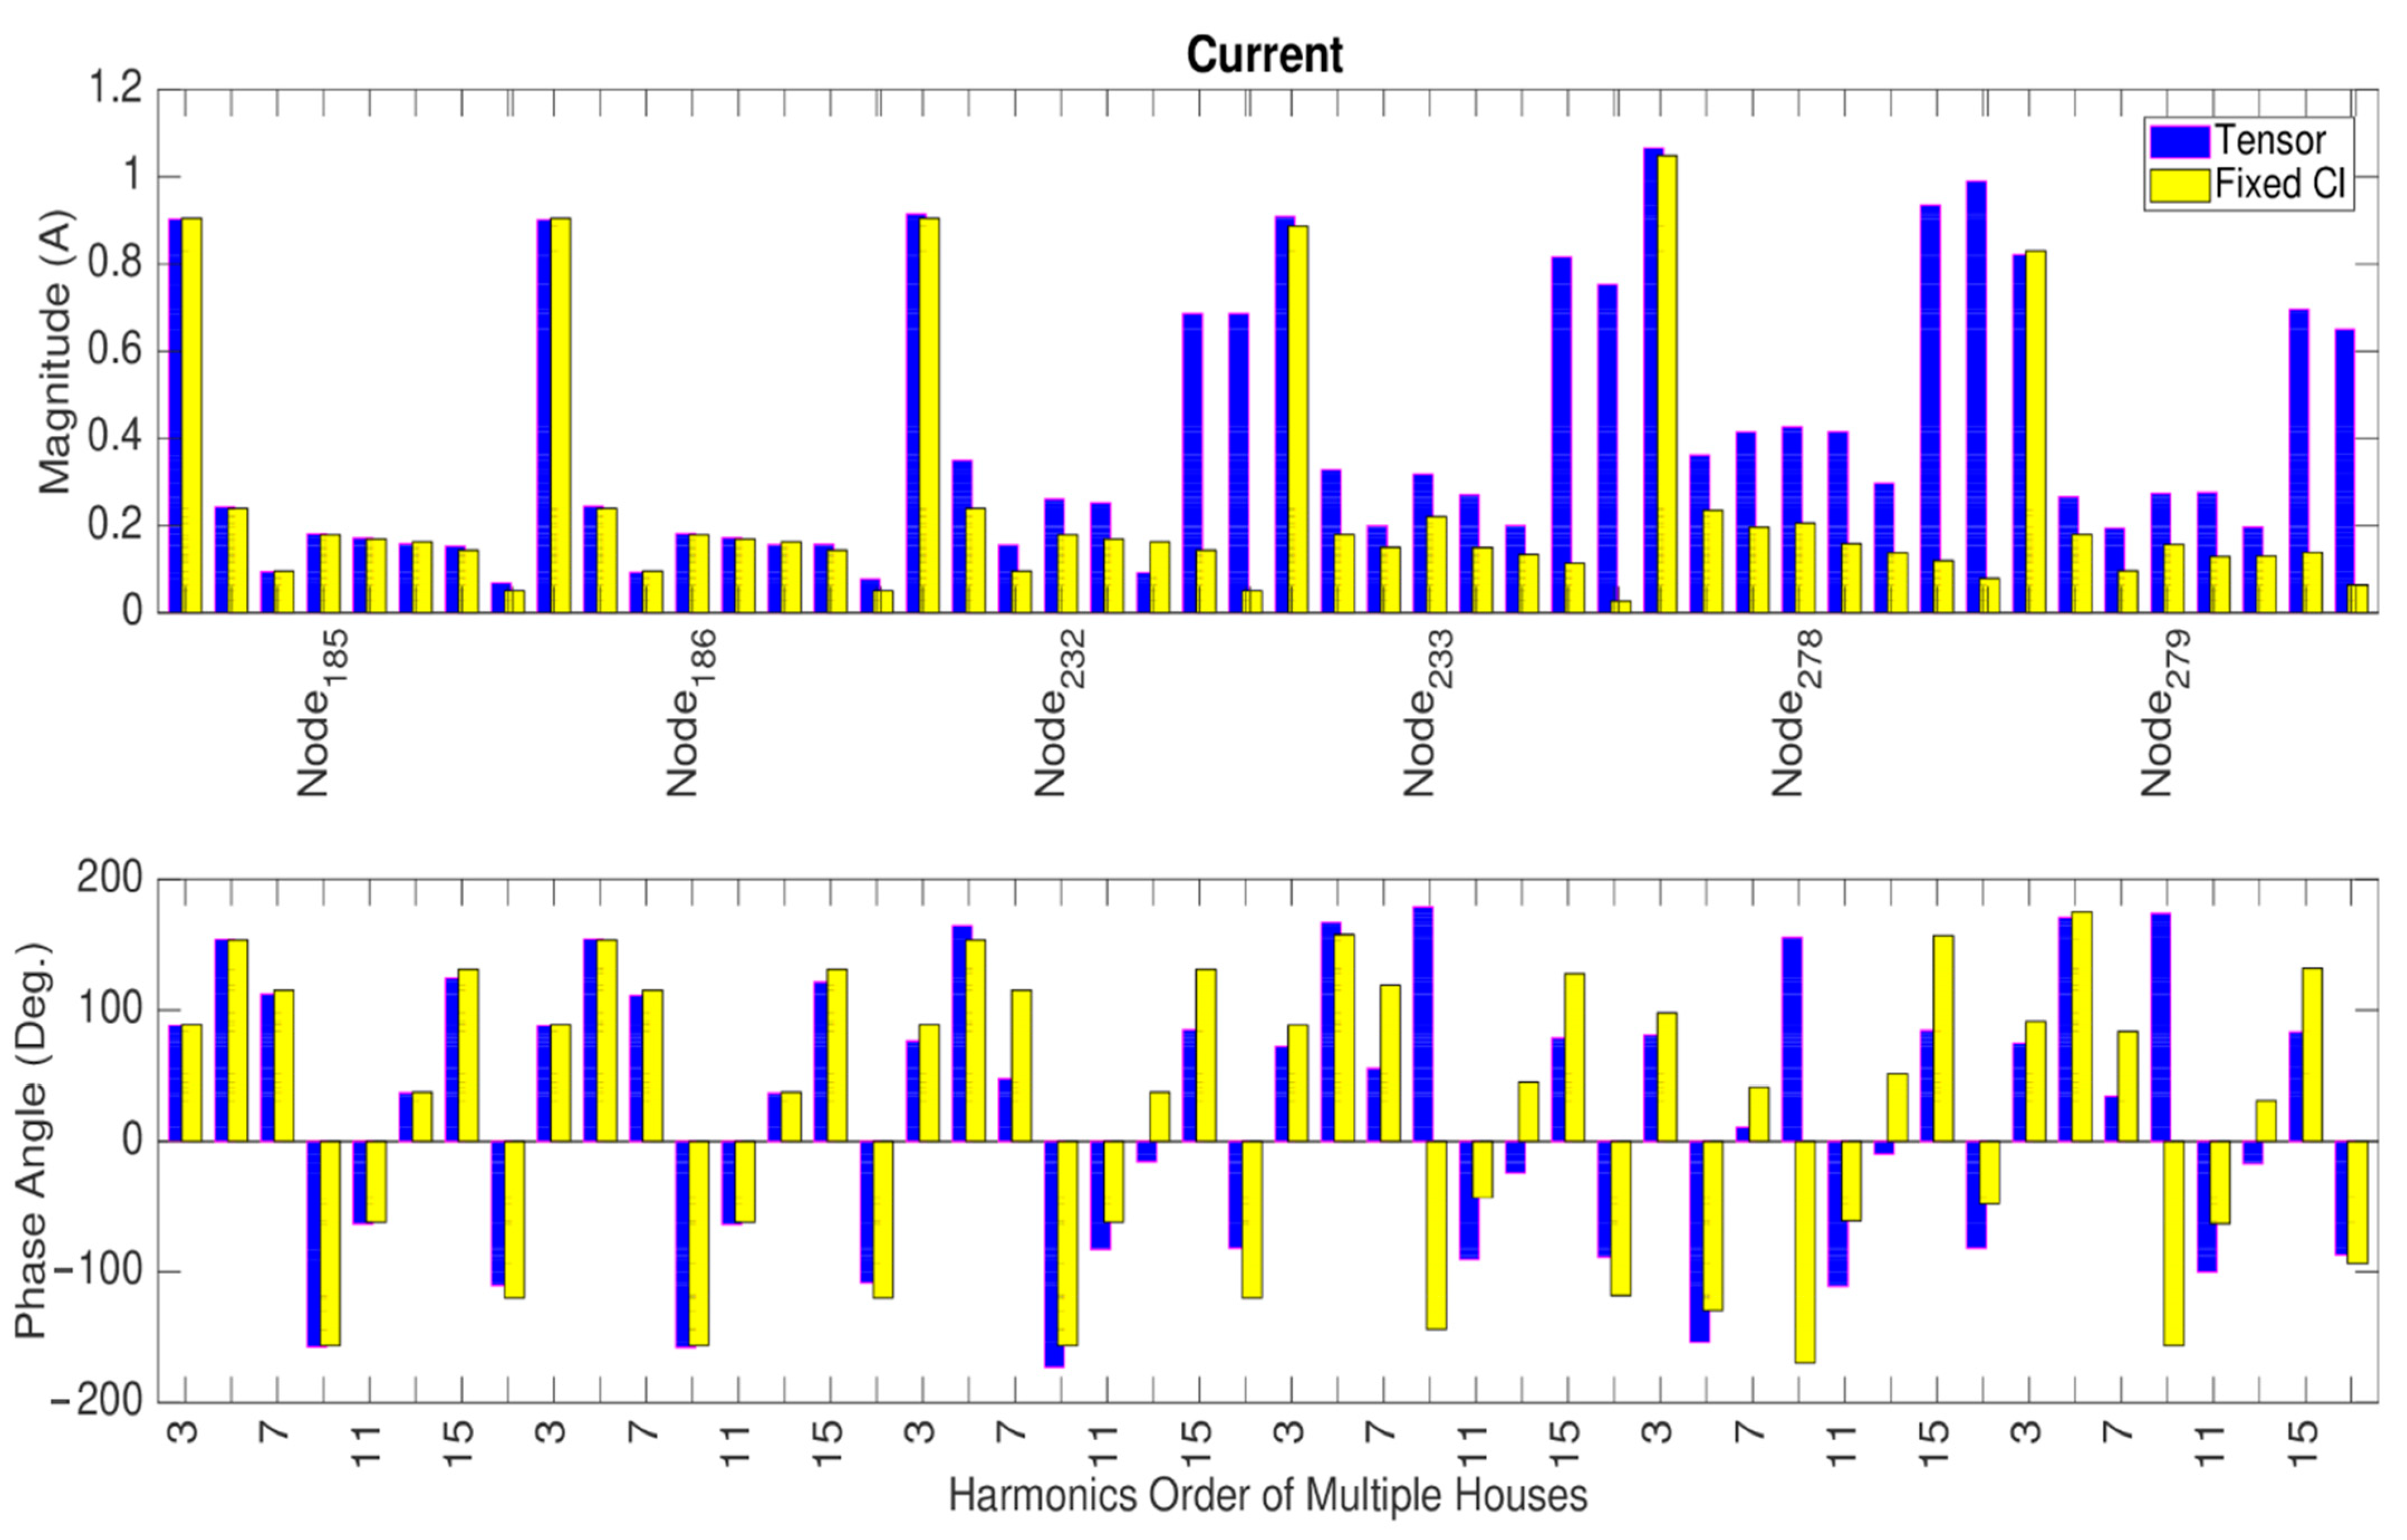
Figure 8, Figure 9 and Figure 10 show the comparison between the current injection method and tensor-based harmonic analysis. The x-axis shows the connection point, and the subintervals are the considered eight harmonics (harmonic orders 3, 5, 7, 9, 11, 13, 15, and 17). The locations shown in Figure 8, Figure 9 and Figure 10 were selected as they display nodes that are at the end of a feeder (178 and 179), those close to the supply point (185 and 186), and those midway along a long feeder (232 and 233), and the voltage distortion will differ because of their position in the network.
Figure 8 shows the case of 30% on nonlinear loads. As expected, the harmonic magnitudes and phase angles are all close for all points in the network, because of the limited voltage distortion level. There is just a noticeable discrepancy for houses at the middle and end of the lines. Note that in Figure 8, the phase angles for the 15th harmonic order at node 232, and 9th harmonic and node 233, respectively, are very similar but on the opposite side of 180°, hence the appearance. Figure 9 shows the same comparison for 60% of the nonlinear load. The difference between modelling the phase dependency is more noticeable. Clearly, the greatest discrepancy is for nodes at the end of the feeder where the voltage distortion is greatest. The discrepancy is frequency-dependent, and although the error is low in the third harmonic, the higher-order harmonics show a significant error. These trends are even more accentuated for 90% of nonlinear devices, as shown in Figure 10.
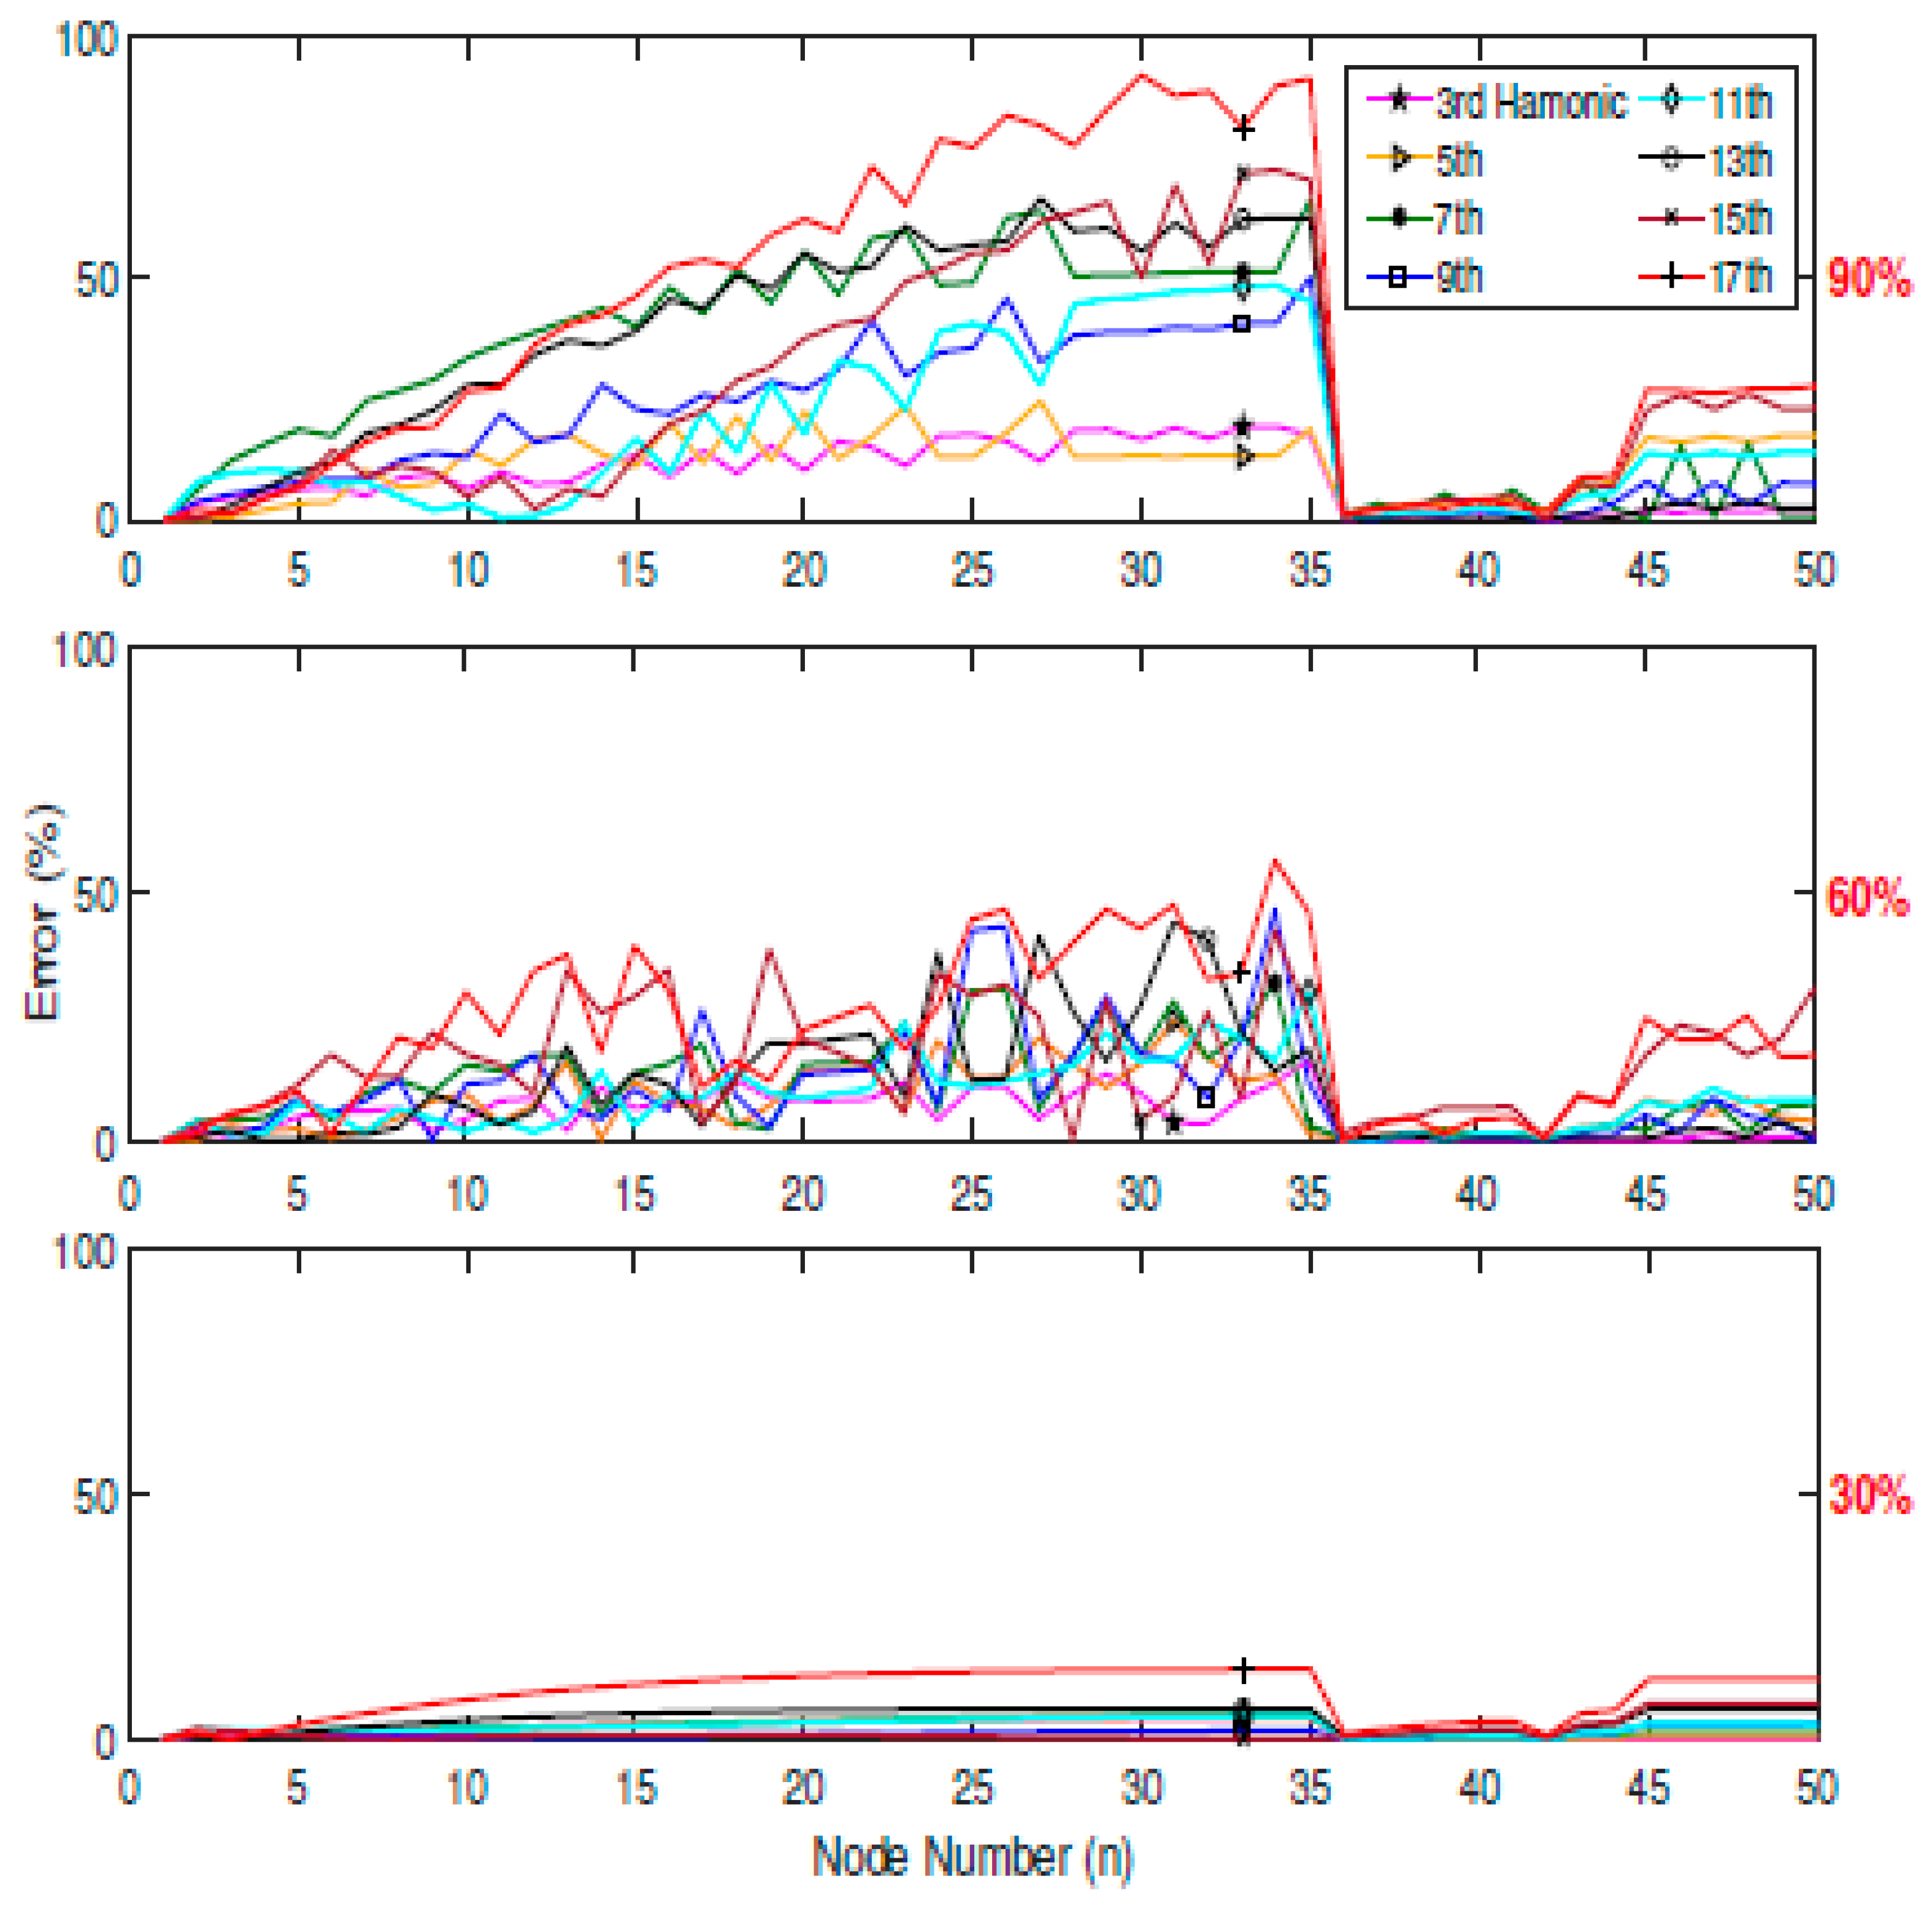
A summary of the error for the three scenarios is presented in Figure 11.

4.2. City Centre LV Network

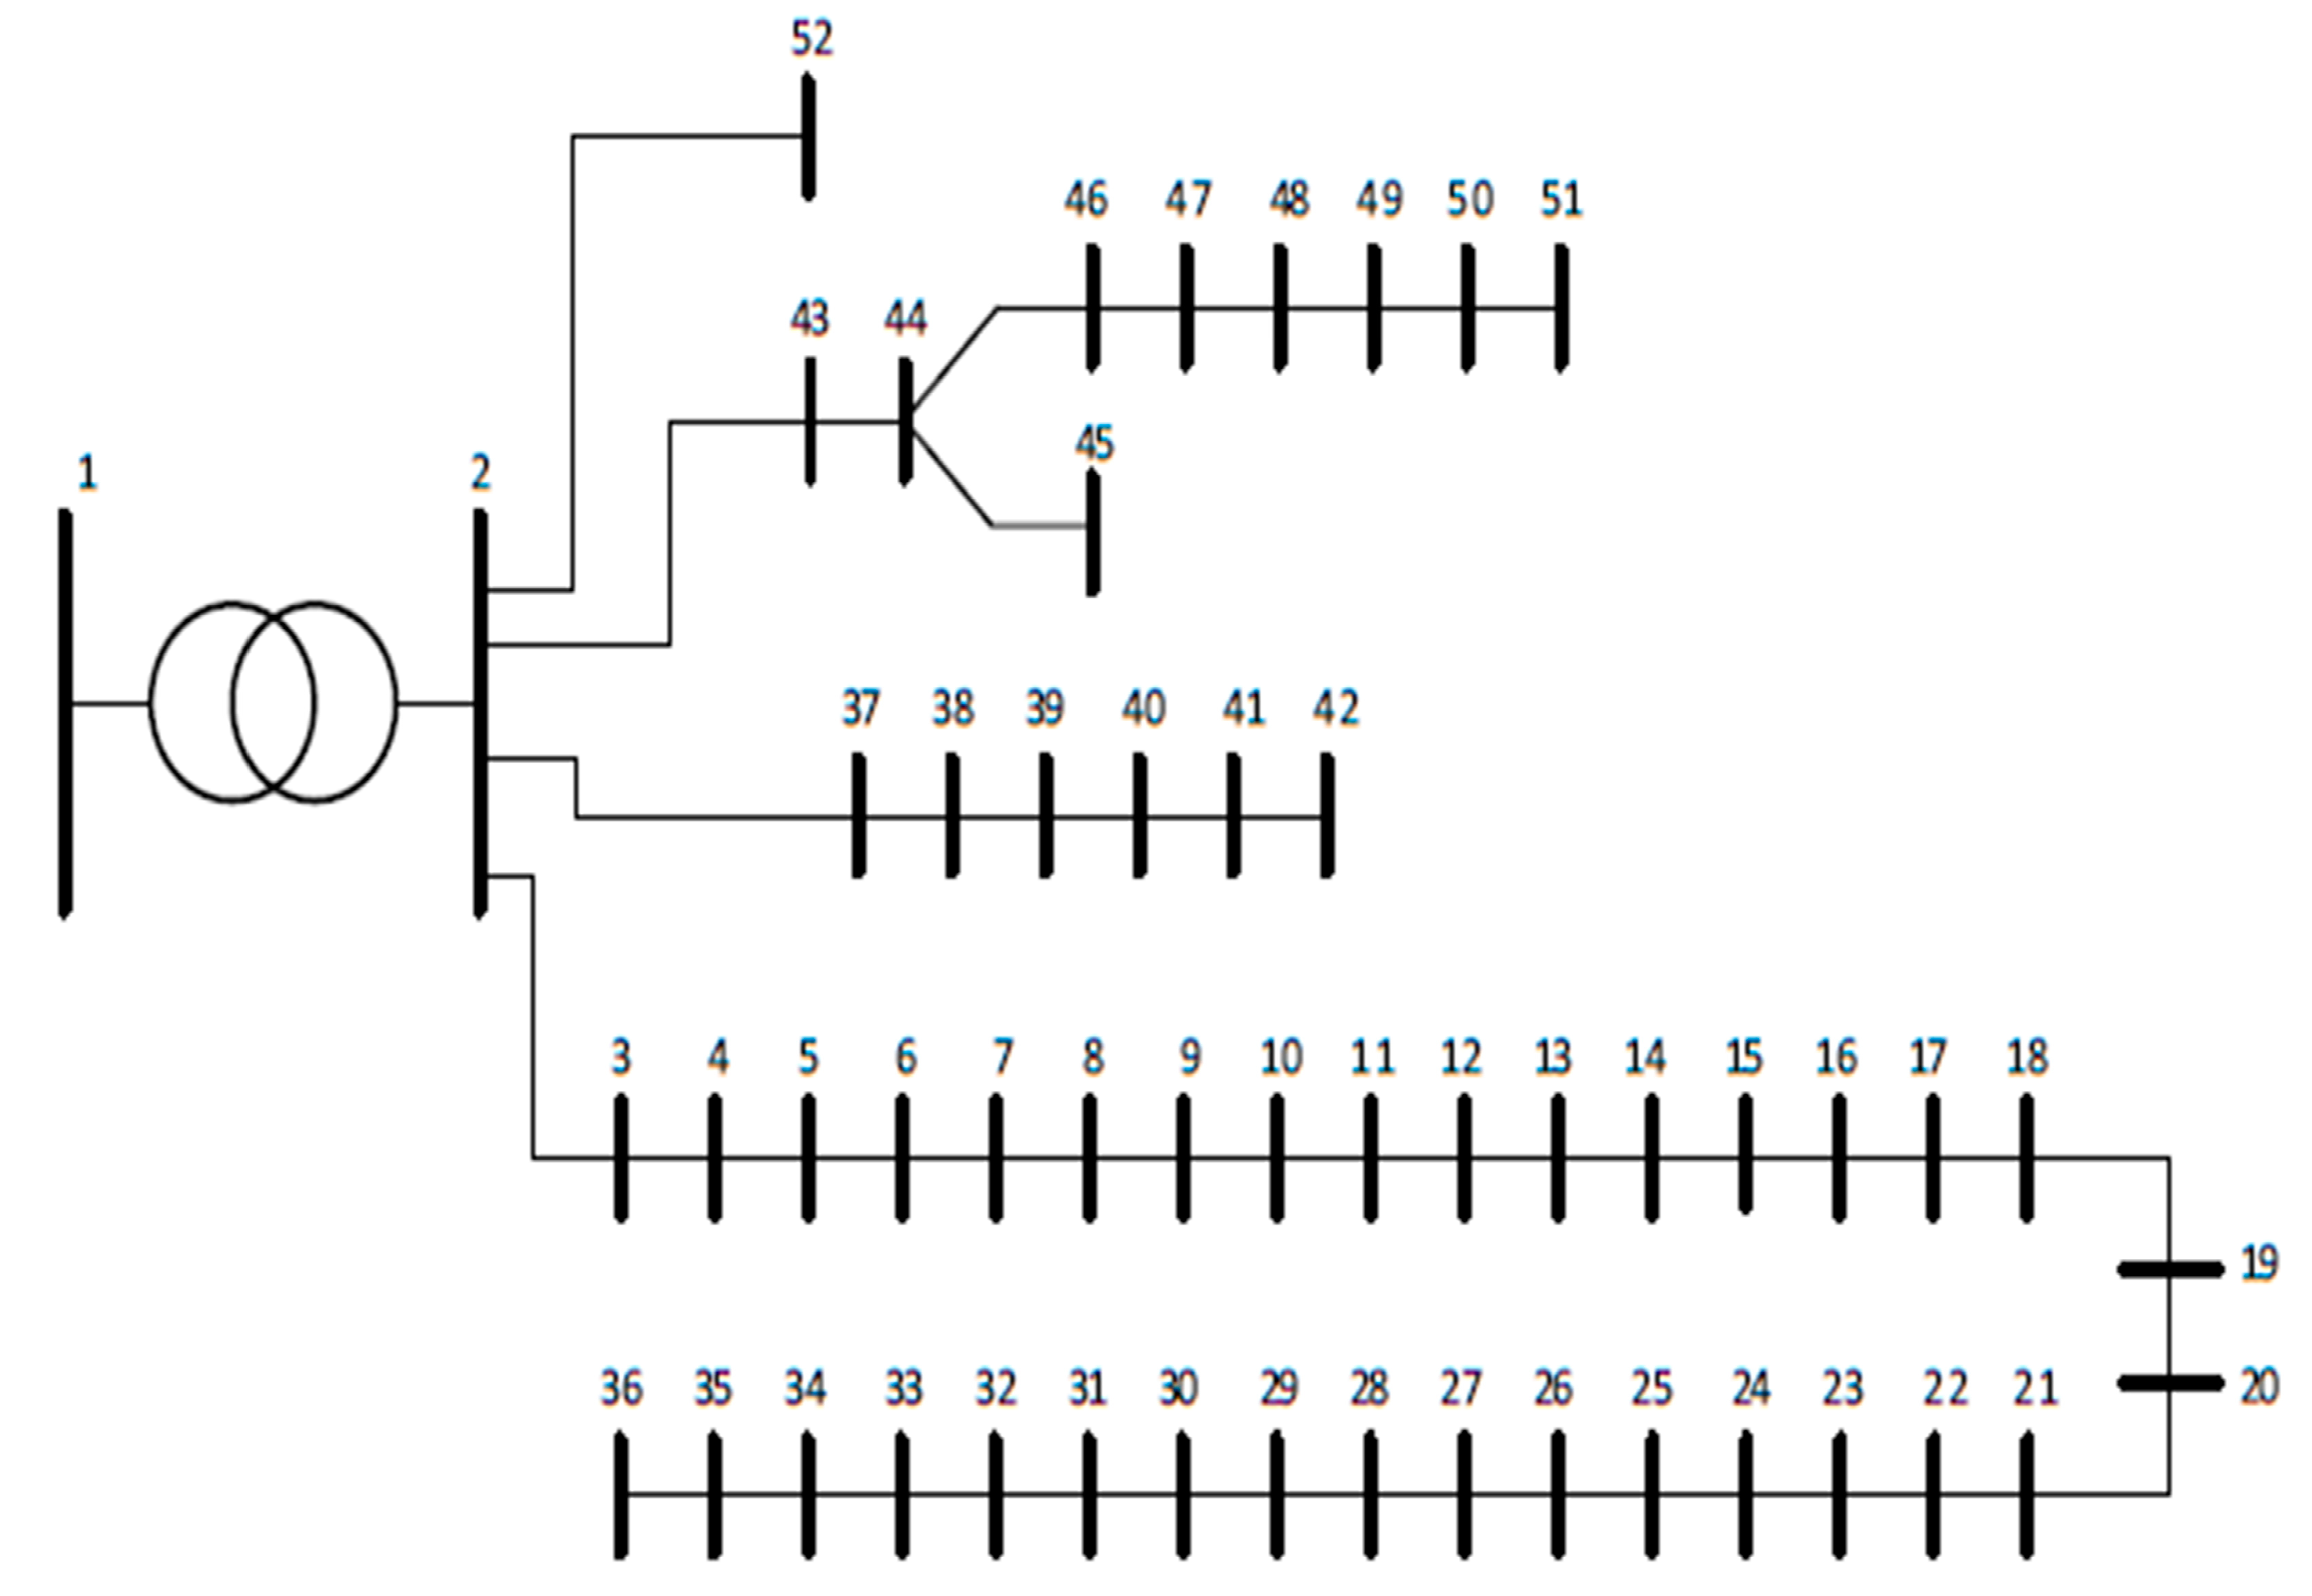
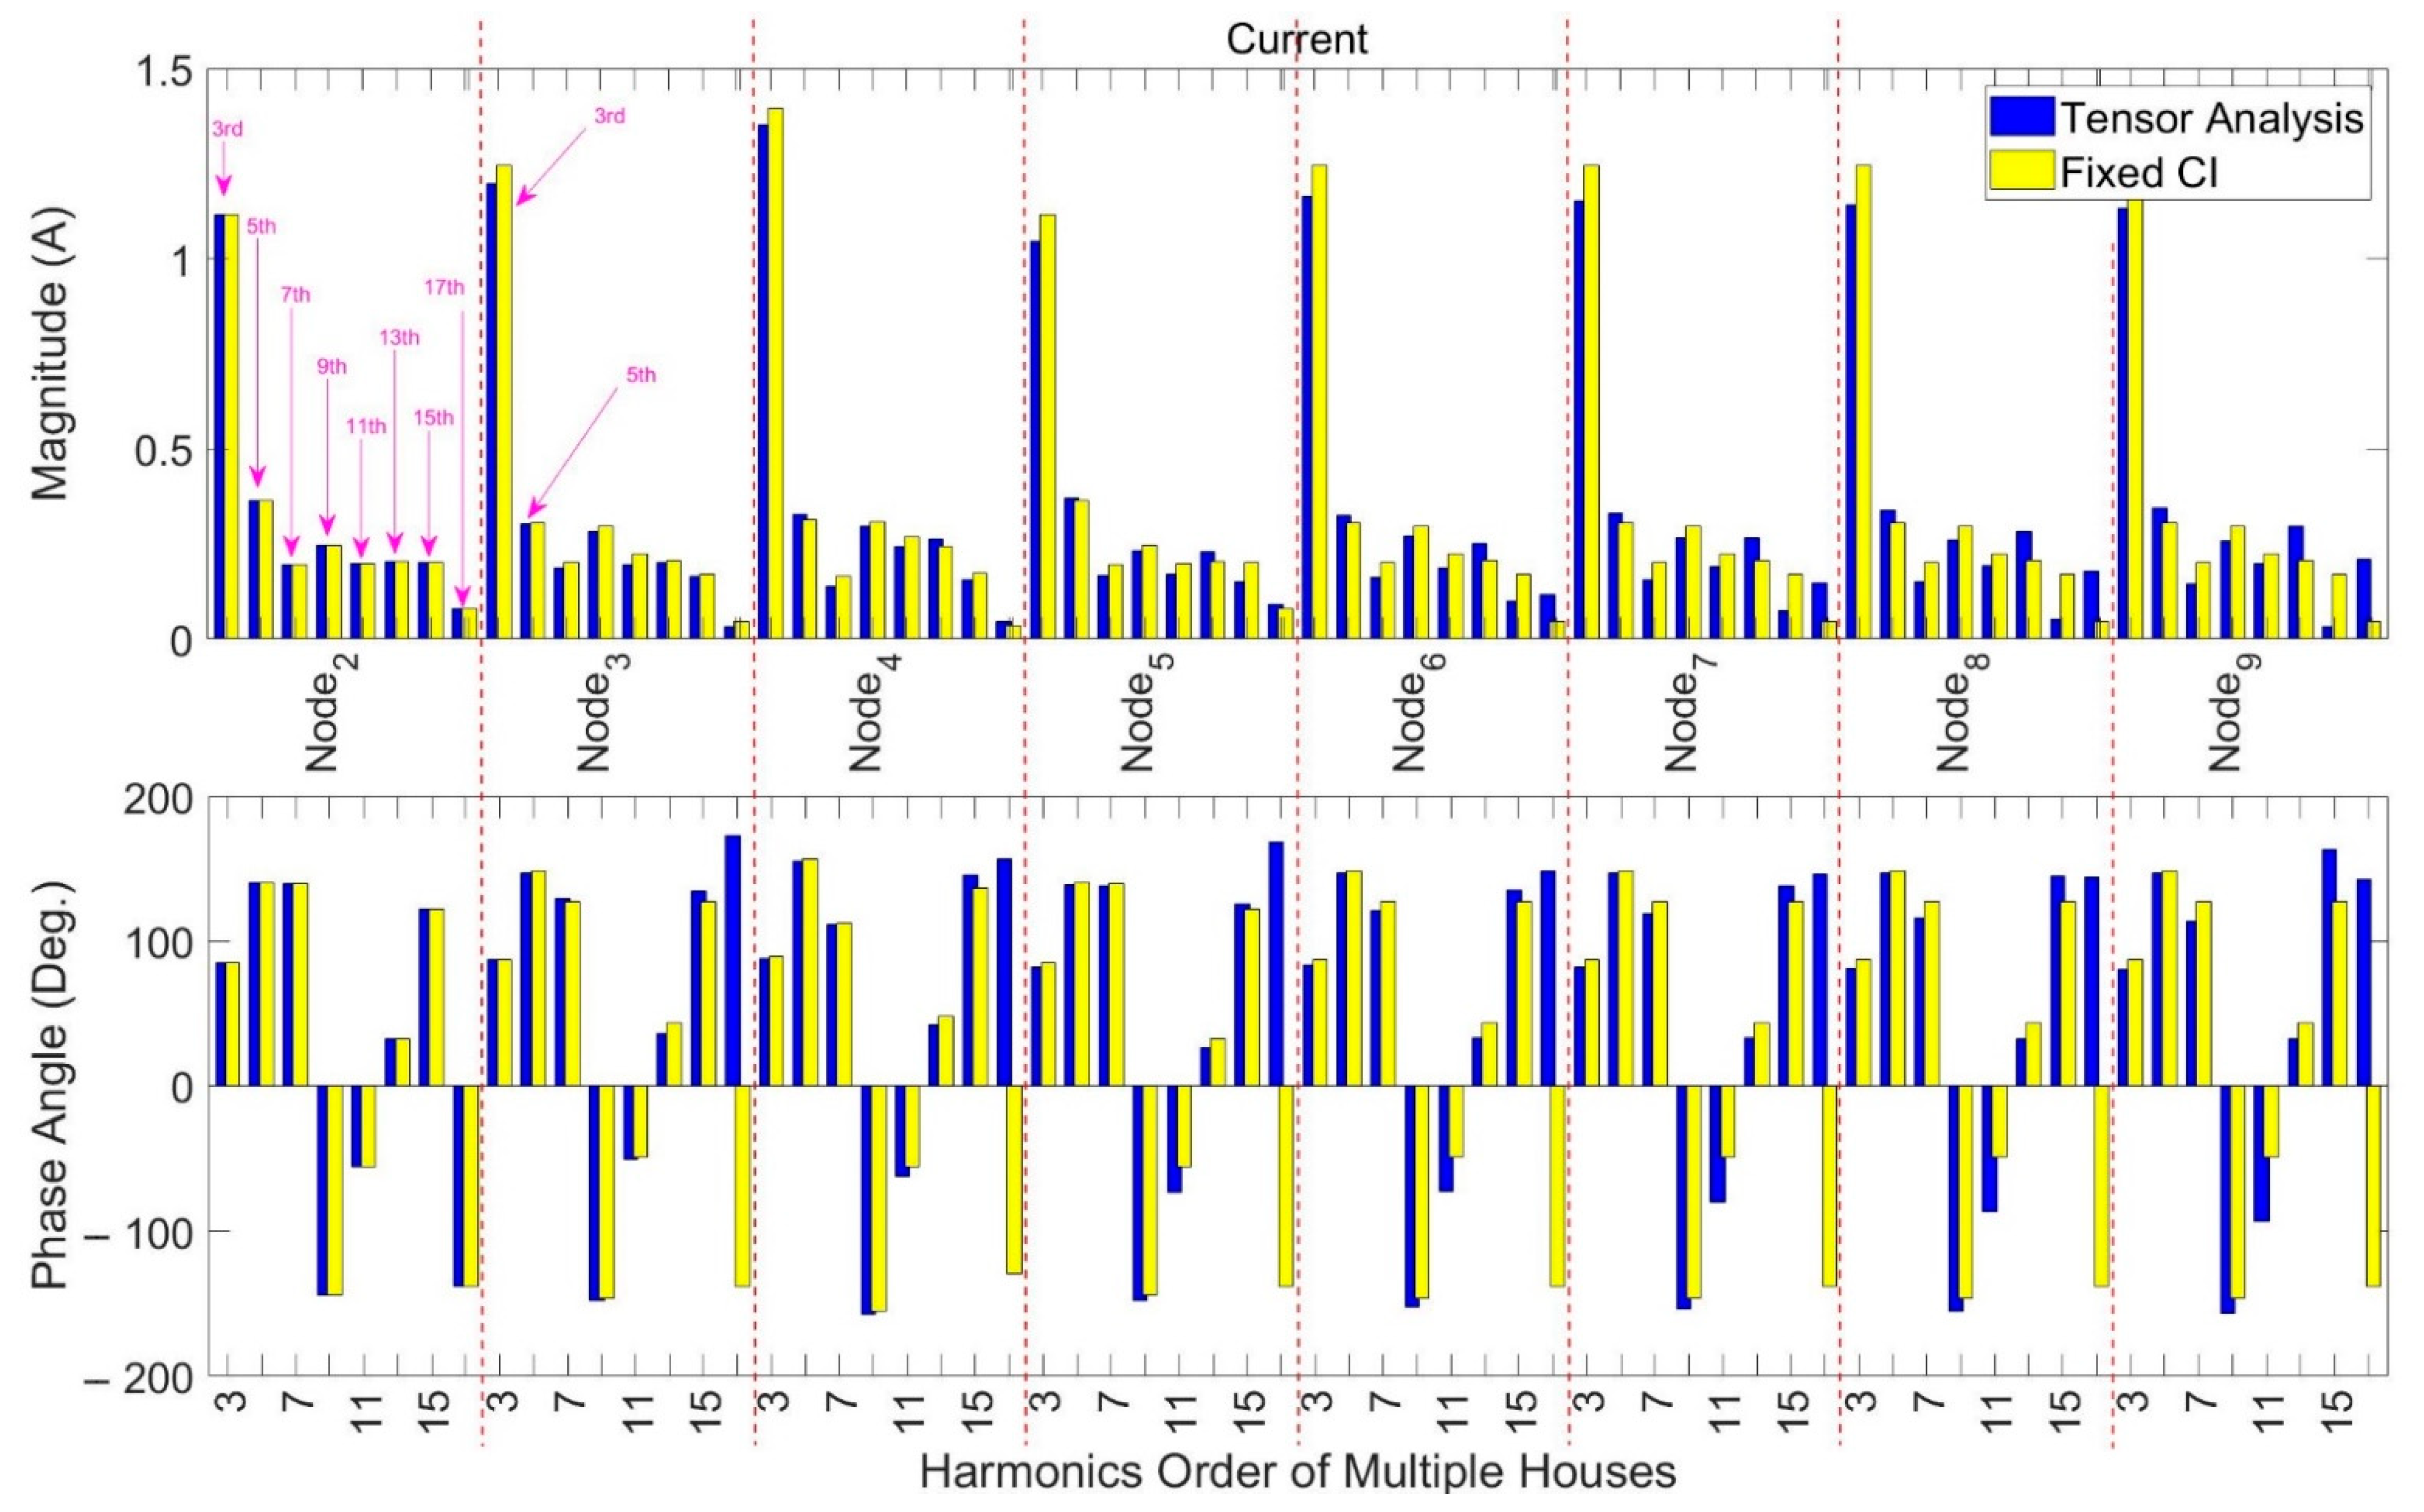
The city centre LV network, displayed in Figure 12, is more compact; hence, there is less distance between connection points and less impedance. For brevity, only the cases of 90% of nonlinear devices are presented in Figure 13 and Figure 14. Clearly, the distortion levels are lower than in the urban case, and the comparison is less dramatic. Note that Figure 14 shows a location at the end of a feeder (36) and those near the supply point (37–45). A summary of the errors is given in Figure 15, where the tensor-based analysis is taken as the benchmark to calculate the error in the Current Injection method. The accuracy deteriorates further from the supply point because of the increased harmonic voltage across the higher network impedance and the harmonic current contribution of the nonlinear devices. Note that the higher the harmonic order, the greater the error. These results clearly show the effect of modelling the phase dependency and frequency-coupling of nonlinear devices in the harmonic analysis of a power system. When the voltage distortion is low, the discrepancy between using the direct current injection method and the detailed iterative method is small. The discrepancy becomes very large near the end of the feeders, where the voltage distortion is more significant.

5. Conclusions and Discussion

Harmonic analysis is becoming more important with the proliferation of nonlinear devices in the electrical distribution network. It has been shown that tensor-based harmonic analysis is far better than the traditional direct injection techniques commonly used at present. This is because it models the phase dependency that exists in electronic equipment and the inherent interaction between the harmonic current injected into the system and the harmonic voltage distortion at the device’s terminal. This technique models interaction in the same harmonic order as well as harmonic cross-coupling. The dramatic increase in the number of nonlinear devices being deployed necessitates new techniques that can model these nonlinear devices more accurately. This paper has shown one method of encapsulating the phase dependency and frequency coupling of nonlinear devices when performing harmonic analysis on a power system. The formulation has been detailed and applied to two different types of LV distribution feeders. These test systems represent actual LV distribution feeders in the New Zealand power system. From the results, the effect of modelling the phase dependency and frequency coupling of nonlinear devices was evident.
The dimensionality of the system admittance matrix increases with the number of nodes and the number of harmonics considered; however, the admittance matrix is very sparse and, with the use of sparsity techniques, is manageable, even for large systems. This is because the number of nodes directly interconnected is small. Moreover, distribution systems are normally radial which allows parts of the system to be solved independently or in parallel, as in [19,20].
Although there have been several contributions using perturbation analysis to develop frequency coupling matrices or admittance loci, there is a great need to have a library of representative tensors that are readily available for system studies. This is because of the considerable effort needed to generate the representative tensors. The tensor is not only a function of the circuit topology but also circuit parameters, such as the DC filter capacitor size and effective DC loading.

Author Contributions

Conceptualization, N.R.W. and M.R.; software and validation, M.R.; writing—review and editing, all authors; supervision, N.R.W. All authors have read and agreed to the published version of the manuscript.

Funding

No external funding for research, however, Muhammad Ramzan was the recipient of a UC Ph.D. Scholarship.

Conflicts of Interest

The authors declare no conflict of interest.

References

  1. Strezoski, L.V.; Vojnovic, N.R.; Strezoski, V.C.; Vidovic, P.M.; Prica, M.D.; Loparo, K.A. Modeling challenges and potential solutions for integration of emerging DERs in DMS applications: Power flow and short-circuit analysis. J. Mod. Power Syst. Clean Energy 2019, 7, 1365–1384. [Google Scholar] [CrossRef] [Green Version]
  2. Watson, N.R.; Scott, T.L.; Hirsch, S.J.J. Implications for distribution networks of high penetration of compact fluorescent lamps. IEEE Trans. Power Deliv. 2009, 24, 1521–1528. [Google Scholar] [CrossRef]
  3. Carbone, R.; Menniti, D.; Testa, N.S.A. Iterative harmonic and interharmonic analysis in multiconverter industrial systems. In Proceedings of the 8th International Conference on Harmonics and Quality of Power. Proceedings (Cat. No.98EX227), Athens, Greece, 14–16 October 1998; Volume 1, pp. 432–438. [Google Scholar] [CrossRef]
  4. Carbone, R.; Fantauzzi, M.; Gagliardi, F.; Testa, A. Some considerations on the iterative harmonic analysis convergence. IEEE Trans. Power Deliv. 1993, 8, 487–493. [Google Scholar] [CrossRef]
  5. Collin, A.J.; Djokic, S.Z.; Drapela, J.; Guo, Z.; Langella, R.; Testa, A.; Watson, N.R. Analysis of Approaches for Modeling the Low Frequency Emission of LED Lamps. Energies 2020, 13, 1571. [Google Scholar] [CrossRef] [Green Version]
  6. Gallo, D.; Landi, C.; Langella, R.; Luiso, M.; Testa, A.; Watson, N.R. On the measurement of power electronic devices’ frequency coupling admittance. In Proceedings of the 2017 IEEE International Workshop on Applied Measurements for Power Systems (AMPS), Liverpool, UK, 20–22 September 2017; pp. 1–6. [Google Scholar]
  7. Gallo, D.; Langella, R.; Luiso, M.; Testa, A.; Watson, N.R. A new test procedure to measure power electronic devices frequency coupling admittance. IEEE Trans. Instrum. 2018, 67, 2401–2409. [Google Scholar] [CrossRef]
  8. Langella, R.; Testa, A.; Caicedo, J.E.; Romero, A.A.; Zini, H.C.; Meyer, J.; Watson, N.R. On the use of Fourier descriptors for the assessment of frequency coupling matrices of power electronic devices. In Proceedings of the 2018 18th International Conference on Harmonics and Quality of Power (ICHQP), Ljubljana, Slovenia, 13–16 May 2018; pp. 1–6. [Google Scholar]
  9. Caicedo, J.E.; Romero, A.A.; Zini, H.C.; Langella, R.; Meyer, J.; Watson, N.R. Impact of reference conditions on the frequency coupling matrix of a plug-in electric vehicle charger. In Proceedings of the 2018 18th International Conference on Harmonics and Quality of Power (ICHQP), Ljubljana, Slovenia, 13–16 May 2018; pp. 1–6. [Google Scholar] [CrossRef]
  10. Arrillaga, J.; Smith, B.C.; Watson, N.R.; Wood, A.R. Power System Harmonic Analysis; John Wiley & Sons: Hoboken, NJ, USA, 1997. [Google Scholar]
  11. Arrillaga, J.; Watson, N.R. Power System Harmonics, 2nd ed.; John Wiley & Sons: Hoboken, NJ, USA, 2003. [Google Scholar]
  12. Smith, B.C.; Arrillaga, J.; Wood, A.R.; Watson, N.R. A review of iterative harmonic analysis for ac-dc power systems. IEEE Trans. Power Deliv. 1998, 13, 180–185. [Google Scholar] [CrossRef]
  13. Smith, B.C.; Watson, N.R.; Wood, A.R.; Arrillaga, J. Harmonic tensor linearisation of hvdc converters. IEEE Trans. Power Deliv. 1998, 13, 1244–1250. [Google Scholar] [CrossRef]
  14. Love, G.N.; Wood, A.R. Harmonic State Space model of power electronics. In Proceedings of the 2008 13th International Conference on Harmonics and Quality of Power, Wollongong, NSW, Australia, 28 September–1 October 2008; pp. 1–6. [Google Scholar] [CrossRef]
  15. Malagon-Carvajal, G.; Duarte, C.; Ordoñez-Plata, G.; Almeida, C.F.M.; Kagan, N. A Harmonic Frequency Domain Modeling Method for Single-Phase Full Bridge Rectifiers. J. Control. Autom. Electr. Syst. 2020, 31, 1322–1333. [Google Scholar] [CrossRef]
  16. Ramzan, M. Modelling Distribution Network through Tensor Representation in the Presence of Power Electronic Devices. Ph.D. Thesis, University of Canterbury, Christchurch, New Zealand, 2021. [Google Scholar]
  17. Ramzan, M.; Othman, A.; Watson, N.R. Comparison of Assessment Methods for Tensors of Nonlinear Devices. Electr. Power Syst. Res. 2022, submitted.
  18. Arrillaga, J.; Watson, N.R. Computer Modelling of Electrical Power Systems, 2nd ed.; John Wiley & Sons: Hoboken, NJ, USA, 2001. [Google Scholar]
  19. Watson, J.D.; Watson, N.R. Impact of Electric Vehicle Chargers on Harmonic Levels in New Zealand. In Proceedings of the 7th Innovative Smart Grid Technologies (ISGT Asia 2017), Auckland, New Zealand, 4–7 December 2017. [Google Scholar]
  20. Watson, J.D.; Watson, N.R. Impact of Residential PV on Harmonic Levels in New Zealand. In Proceedings of the 7th IEEE International Conference on Innovative Smart Grid Technologies (ISGT Europe 2017), Torino, Italy, 26–29 September 2017. [Google Scholar]
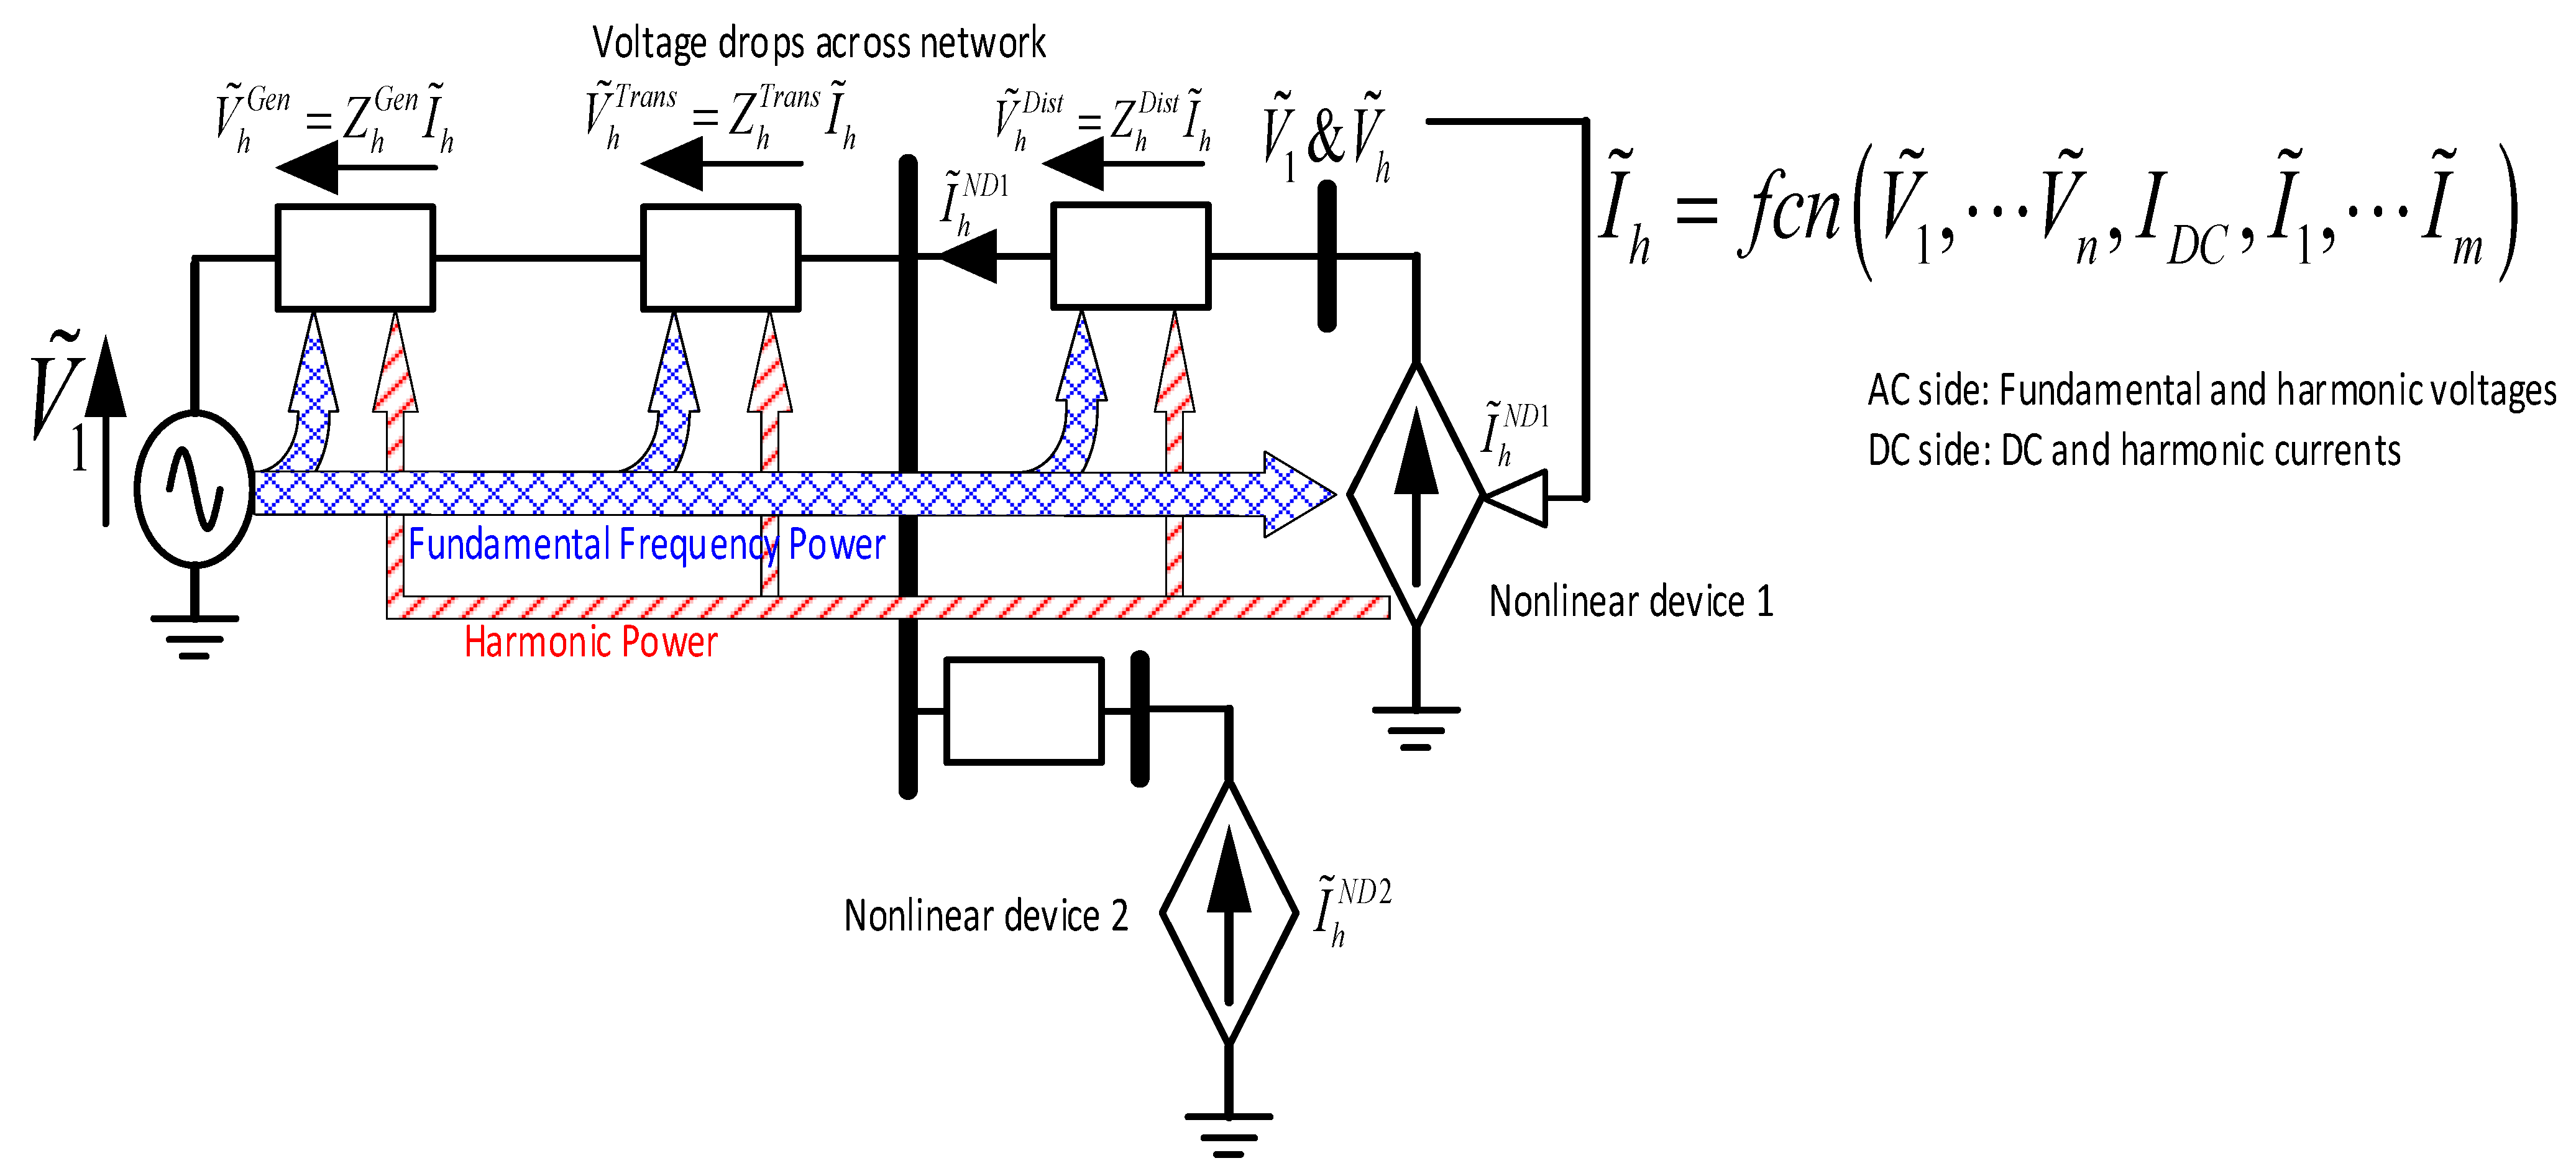
Figure 1. Nonlinear device interactions through the system impedance.
Energies 15 07521 g001
Figure 2. Perturbations to determine the admittance loci.
Energies 15 07521 g002
Figure 3. Norton Equivalent.
Energies 15 07521 g003
Figure 4. Phase-dependent admittance locus for an admittance tensor.
Energies 15 07521 g004
Figure 5. Tensor-based analysis framework.
Energies 15 07521 g005
Figure 6. Schematic of Urban LV network.
Energies 15 07521 g006
Figure 7. System Admittance matrix made from the tensor representation of nonlinear devices.
Energies 15 07521 g007
Figure 8. Urban LV network (30%).
Energies 15 07521 g008
Figure 9. Urban LV network (60%).
Energies 15 07521 g009
Figure 10. Urban LV network (90%).
Energies 15 07521 g010
Figure 11. Errors for 30%, 60% and 90% of nonlinear load scenarios.
Energies 15 07521 g011
Figure 12. City centre LV network.
Energies 15 07521 g012
Figure 13. Comparison for nodes 2–9 (90% nonlinear devices).
Energies 15 07521 g013
Figure 14. Comparison for nodes 36–45 (90% nonlinear devices).
Energies 15 07521 g014
Figure 15. Summary of accuracy.
Energies 15 07521 g015
Publisher’s Note: MDPI stays neutral with regard to jurisdictional claims in published maps and institutional affiliations.