Review

Research Progress of Applying Distributed Fiber Optic Measurement Technology in Hydraulic Fracturing and Production Monitoring

1
Unconventional Petroleum Research Institute, China University of Petroleum, Beijing 102249, China
2
China Institute of Communications, Beijing 100026, China
3
State Key Laboratory of Petroleum Resources and Prospecting, China University of Petroleum, Beijing 102249, China
*
Author to whom correspondence should be addressed.
Energies 2022, 15(20), 7519; https://doi.org/10.3390/en15207519
Submission received: 31 August 2022 / Revised: 25 September 2022 / Accepted: 6 October 2022 / Published: 12 October 2022
(This article belongs to the Special Issue Advances in Oil and Gas Well Engineering Science and Technology)

Abstract

:
With the exploration and development of unconventional oil and gas resources, downhole environmental monitoring and data-analysis technologies are becoming more and more important. Distributed fiber optic measurement technology, as a new monitoring technology to obtain accurate data, has a wide range of applications in hydraulic fracturing and production monitoring. It mainly includes: distributed fiber optic temperature sensors (DTSs) to monitor gas lift, identify in-flow fluid types, interpret flow profiles and monitor production enhancement operations; distributed fiber optic acoustic sensors (DASs) to monitor low frequency strain and microseismic and hydraulic fracturing operations; and distributed fiber optic stress sensors (DSSs) to characterize fractures in the near-well area, which have been well applied in the field. This paper describes the current application status of DASs and DSSs in hydraulic fracturing and production monitoring, respectively, from the principle of distributed fiber optic measurement technology. It also points out the limitations of these measurement technologies and the direction of future development. Distributed fiber optic measurement technology has been making technical breakthroughs in recent years, providing strong technical support for the development of unconventional oil and gas resources.

1. Introduction

With the world’s demand for energy gradually increasing, the production of conventional oil reservoirs is decreasing year by year. Unconventional reservoirs with rich reserves have become the focus of current exploration and development [1]. However, unconventional reservoirs generally have poor physical properties, low permeability, complex seepage mechanisms and generally a lower natural production capacity than industrial oil flow. Therefore, horizontal wells, fracturing, heating, asphaltene control [2], etc., are currently used as reservoir production-enhancement techniques. The vast majority of horizontal wells require hydraulic fracturing to modify the reservoir and increase the contact area between the reservoir and the wellbore.
During hydraulic fracturing of unconventional reservoirs, timely and accurate information about the downhole conditions can improve fracturing efficiency along with well production. Production monitoring plays a key role in the hydraulic fracturing process. Traditional hydraulic fracturing detection methods include an inclinometer, well temperature logging methods and isotope logging methods. However, all of these have certain limitations. For example, an inclinometer needs to be installed in the monitoring well and cannot provide information about the fracture length. The resolution of the inclinometer decreases as the distance between the monitoring well and the fracturing well increases. Well temperature logging can only determine the fracture height. Isotope logging can only measure the fracture height in the near-well zone. In addition, the radioactive elements used in the isotope-logging method can cause environmental pollution, and subsequent disposal of the discharge is difficult. Similarly, traditional production monitoring methods such as tracers, flow meters, multi-parameter loggers and fluid-scanning imagers are used. These traditional production-monitoring methods have long construction cycles, high monitoring instrumentation costs, limited distances, production delays, varying adaptations to well conditions and high installation difficulties, which are prone to failure [3,4,5].
With the rapid development of distributed measurement technology, new solutions have been brought to address the shortcomings of traditional methods, including distributed fiber optic measurement techniques for real-time monitoring. These can not only detect downhole temperature, vibration, strain, and seismic waves without interfering with the well, but also obtain distributed data information along the length of the borehole, which is widely used in fracture monitoring, production logging and VSP. With the advantages of its low cost, long-time monitoring, high resolution and sensitivity, and high temperature and pressure resistance, distributed fiber optic measurement technology has become one of the important development trends of hydraulic fracturing and production monitoring technology [6,7,8].
In this paper, the measurement principles of DTS, DAS and DSS are briefly introduced from the installation of distributed fiber optic sensors. The current application status and research progress of DTS, DAS and DSS in hydraulic fracturing and production monitoring are described, respectively, while the limitations of their measurement technologies and future development directions are pointed out. This is hoped to provide help to understand the basic principles and field-monitoring applications of distributed fiber optic measurement technology.

2. Principles of Distributed Fiber Optic Measurement Technology

The fiber optic sensing system consists of three main components: the interrogator, the fiber optic cable and the sensor. The sensor is the optical fiber itself, which is both the sensing and data-transmission element. The fiber cable should include the fiber core, coatings and outer covers. The interrogator emits pulsed light into the fiber. As the pulsed light travels through the fiber, it produces backscattered light. The backscattered light includes Rayleigh scattered light, Raman scattered light and Brillouin scattered light. The amount and type of backscattered light is recorded. The measured values of the parameters can be obtained by the relationship between these scattered lights and the measured parameters [9].

2.1. Fundamentals

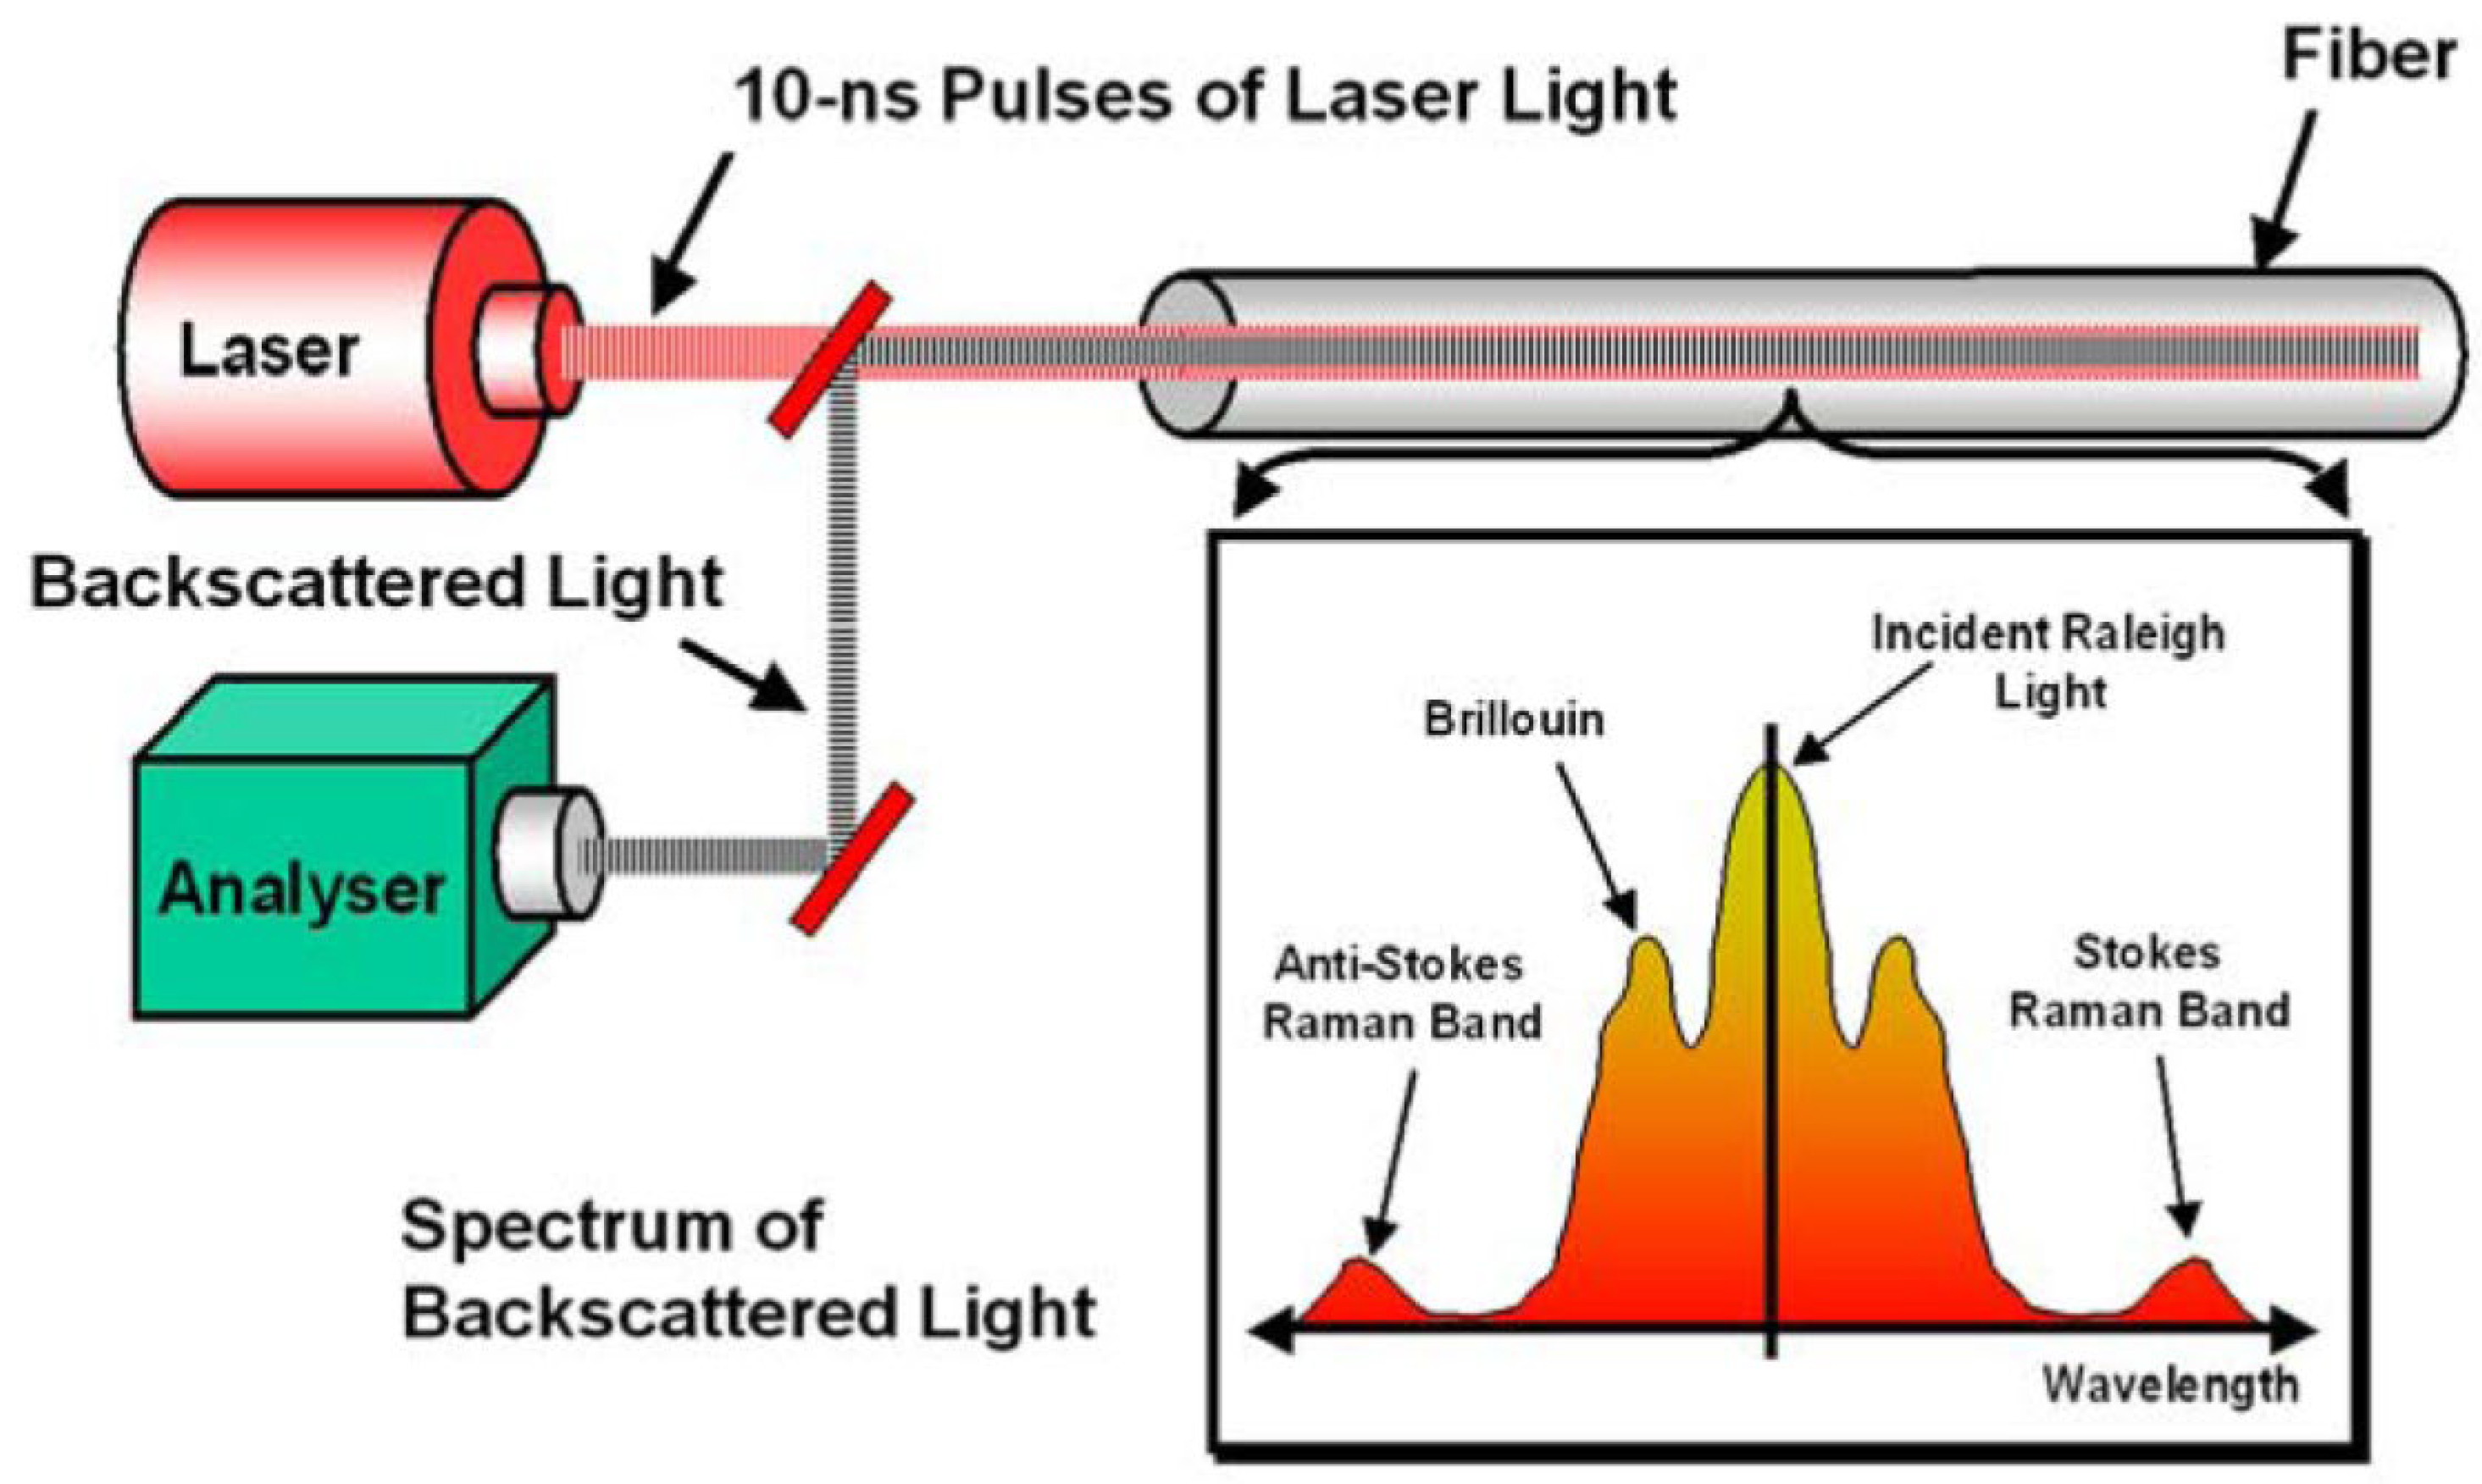
2.1.1. Fundamentals of DTS

The distributed fiber optic temperature sensor is based on the optical time-domain reflection technique for positioning and the Raman scattering principle for temperature measurement. The principle of temperature measurement is shown in Figure 1. An optical pulse is emitted from a laser into the fiber at a frequency of 10 ns. The refractive index in the fiber is microscopically inhomogeneous and this pulse of light produces backscattered light. The time from the start of the incident light emission to the reception of the backscattered light is t. The speed of light propagation in the fiber is C, which approximates the speed of light. The distance L between the incident end and the reflected end can be measured as in Equation (1). The Raman-scattering spectrum contains Stokes light and anti-Stokes light. The intensity of the anti-Stokes light is positively correlated with temperature. The correlation between Stokes light and temperature is weaker. The anti-Stokes light can be used as a reference value for removing signal noise. As shown in Equation (2), the ratio of Stokes-light and anti-Stokes-light intensity is calculated to obtain the measured value of temperature [6,10,11].
L = c t 2 n
T = h C 0 v K ln a ln l a s l s

2.1.2. Fundamentals of DAS

A series of light pulses are emitted into the fiber by a narrow linewidth laser, which produces scattering in the fiber. The backward scattered light is collected and processed. As shown in Figure 2, when a vibration signal in the acoustic field is applied to the fiber, the length and refractive index of the fiber at that location changes [12]. This results in a change in the intensity of the backscattered Rayleigh light at that location. The collected backward Rayleigh light curves before and after being disturbed are subtracted. The acoustic signal at each point along the fiber can be obtained by analyzing the difference in the backscattered Rayleigh light through spatial differential processing. The speed of light and the signal arrival time are known to allow the precise localization of the event generating the perturbation [12,13,14,15].

2.1.3. Fundamentals of DSS

Distributed fiber optic strain sensors use Rayleigh backscattering to measure stress changes along an optical fiber. Backscattering occurs from inhomogeneities in the glass density in the fiber and is manifested as changes in the refractive index and length of the fiber. As shown in Figure 3, for a certain frequency, the constructive and destructive interferences between the Rayleigh backscatters of the density fluctuations cause irregular amplitude fluctuation in the coherent optical time-domain reflectometer along the fiber length [16]. For each individual fiber segment, a unique Rayleigh-scattering spectrum is obtained by scanning the fiber with a coherent optical time-domain reflectometer using a tunable wavelength laser system. Changes in temperature and strain in the fiber cross-section cause a change in the frequency of the Rayleigh spectrum. The Rayleigh frequency shift is related to temperature and strain as described in Equation (3). However, the change in temperature can be measured independently using a distributed temperature sensor. When the change in temperature can be measured independently, a distributed stress sensor based on the Rayleigh frequency-shift principle can measure the strain changes [16,17].
Δ υ R = C 1 Δ ε + C 2 Δ T

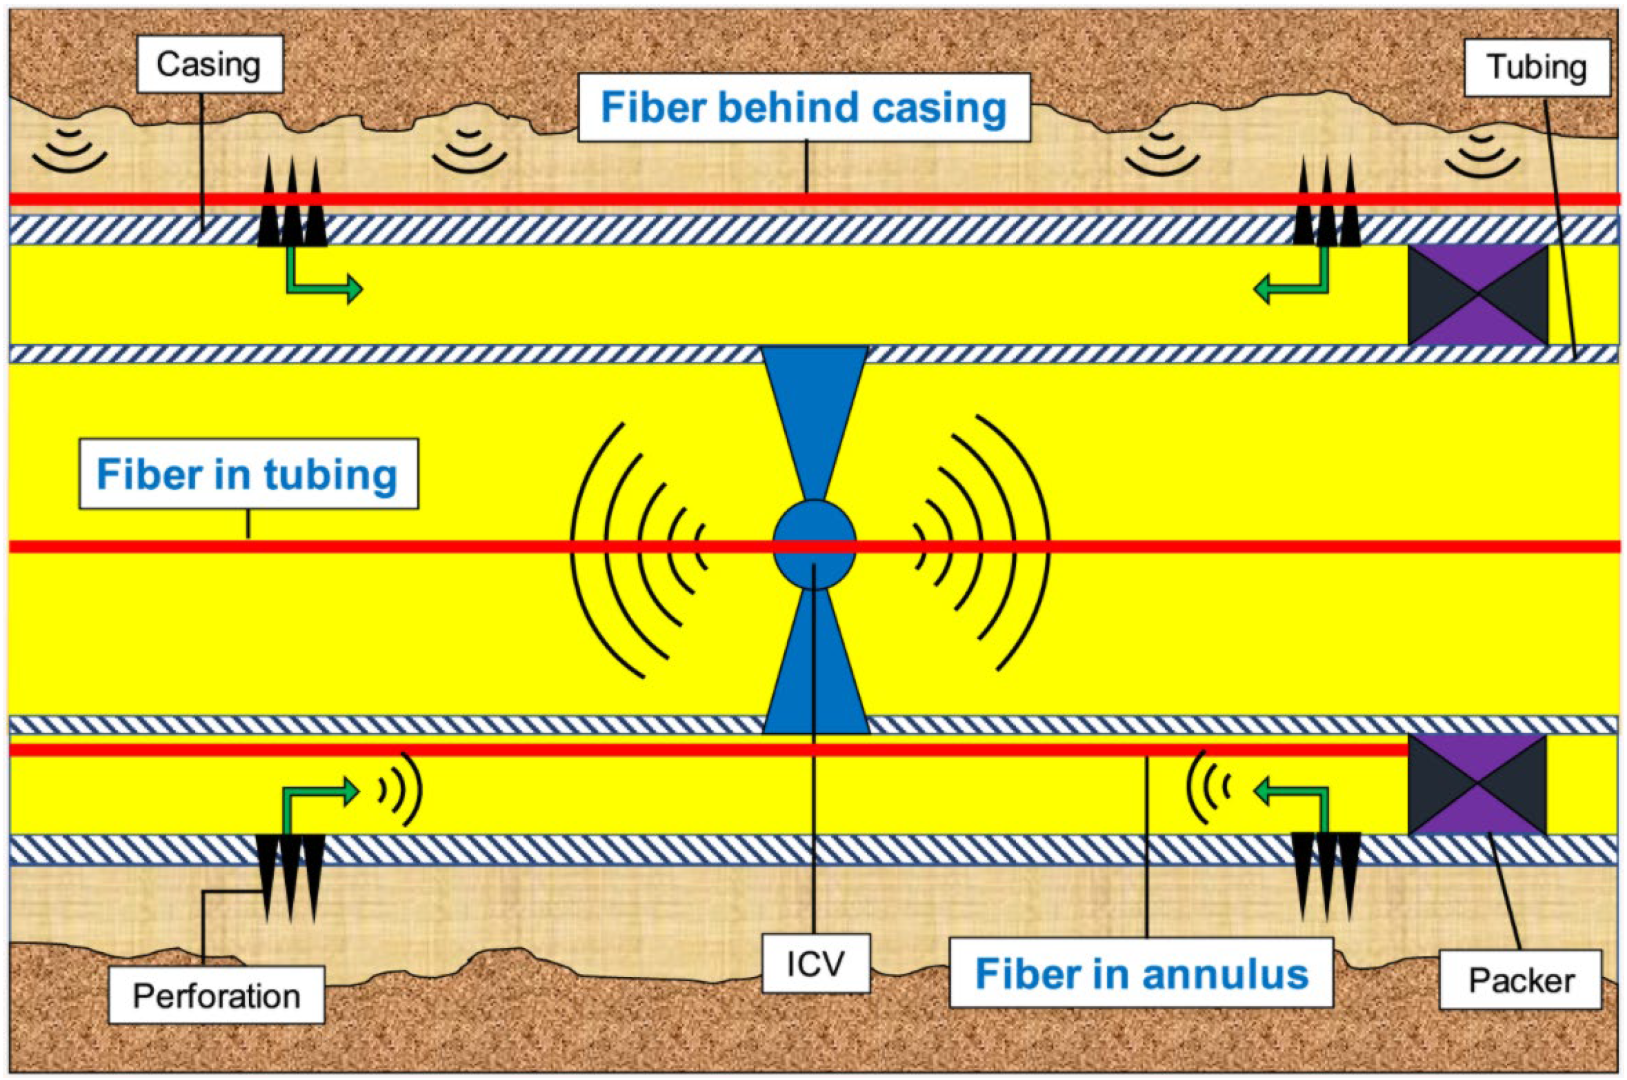
2.2. Installation Location

Distributed fiber optic sensors can be divided into permanent and short-duration monitoring according to the monitoring period. As shown in Figure 4, the installation locations of fiber optics are generally the inner wall of the oil pipe, the outer wall of the oil pipe and the outer wall of the casing [12]. The advantages, disadvantages and content of monitoring events are summarized in Table 1, according to the different installation locations of optical fibers as elaborated by Jose (2008) [18], Shoaibi (2016) [19], Mohammad (2019) [12] and Soroush (2022) [20]. In practice, the installation position of optical fibers can be selected rationally according to the type of operation, monitoring purpose, and actual production conditions.

3. Application of Distributed Measurement Technology for Hydraulic Fracturing and Production Monitoring

3.1. Advances in the Application of DTS for Hydraulic Fracturing and Production Monitoring

3.1.1. Gas-Lift Monitoring with DTS

DTS is a highly efficient and stable temperature measurement tool for gas-lift monitoring. This is because the DTS provides a continuous temperature profile of the entire well in real time. The operator is able to monitor the operating status of all gas-lift valves simultaneously, which is not possible with conventional temperature-measurement tools. That is, in wells with gas-lift valves, the gas entering the well through the gas-lift valve causes a decrease in temperature due to the Joule–Thomson effect. The Joule–Thomson coefficient of the gas is greater than that of the liquid, so the DTS can accurately identify the position of the gas-lift valve and grasp the operating status of the gas-lift valve. Figure 5 shows the cooling effect of gas passing through gas-lift valve 1, corresponding to the depth information, to get the location of the gas-lift valve. Using a DTS for gas-lift monitoring not only reduces the intervention time of the well but also can quickly identify the problem and take corresponding measures in time [11,21,22,23,24,25].

3.1.2. Identification of the Fluid Type with DTS

Figure 6 shows the qualitative determination of the type of fluid flowing from the reservoir into the wellbore based on the Joule–Thomson effect. When the output is gas, the temperature decreases as the gas expands from the high-pressure to low-pressure region by heat absorption. When the output is a liquid, the fluid is fluidized from the high-temperature region to the wellbore, thus increasing the temperature. The properties of water and oil are similar. When oil and water are produced together, the temperature at the time of water production will be lower than the temperature at the time of oil production because the specific heat capacity of water is greater than that of oil. The temperature–well depth profile can be plotted, and where the slope of the curve changes, it represents a change in the fluid, which not only identifies the fluid type but also determines the location of water and gas production. In addition to this, early gas and water breakthroughs can be identified promptly. Water and gas breakthroughs in bottom water reservoirs or gas tops can lead to changes in monitoring data due to temperature differences with the producing fluid, allowing one to determine in turn the location and time of gas and water breakthrough, and then solve the gas and water vertebrae into the problem through the downhole fluid control unit in the intelligent completion technology [26].

3.1.3. Interpretation of Flow Profiles with DTS

With the exploration and development of unconventional oil and gas resources, the borehole trajectory of horizontal wells is becoming more and more complex, and the profile-monitoring instruments currently produced are costly and require monitoring wells as well as specialized detection wells; the monitoring distance is limited and cannot be applied to long borehole wells; the installation is difficult and easily fails; the information lags and the interpretation of downhole conditions and production profile is inaccurate; and there is a series of disadvantages especially for horizontal wells with multi-phase flow. It is difficult to solve the problem of fluid distribution in the horizontal section because of the unusual complexity of the production profile. However, the development of DTS measurement technology has led to the maturation of downhole temperature testing techniques and equipment that can monitor the entire well along the borehole trajectory in real-time, provide temperature profiles with continuous measurement points and accurate data, and are simple to install at low cost [27]. The interpretation of flow profiles using transient temperature data provided by DTS has become a current research craze.
The temperature data obtained by using distributed fiber optic temperature-measurement technology can determine the suction level, the degree of cooling of the formation. The time required to return to temperature marks the suction capacity of the formation, and, for subsurface high-temperature reservoirs, the injection of fluid will make the temperature decrease; and the greater the amount of suction fluid, the longer the time required to return to temperature [28]. However, the above studies have remained in qualitative analysis, and since Ramey first proposed a model for the qualitative analysis of flow profiles based on wellbore temperature distribution in the 1960s [29], various temperature-measurement techniques have been used to quantitatively interpret flow profiles, and the development of DTS interpretation theory has moved from qualitative analysis to the mature stage of quantitative calculation [30]. In 2013, Yang used the iFlowTM fitter, combined with DTS measurement data, to predict the wellbore temperature profile and obtain the flow profile of gas wells; however, this simulator cannot handle complex fluid flow in the wellbore and can be applied only to a small extent [31]. Wu et al. (2022) considered multiple microthermal effects for gas wells with single-phase gas radial flow fixed production, developed a temperature prediction model for multi-layer co-production low-permeability gas wells and analyzed the sensitivity parameters on temperature variation. The in-version results are consistent with the results of the field experimental interpretation in the Yongle area of the South China Sea, but the assumptions are too ideal and only applicable to reservoirs that are homogeneous and where no tampering occurs; a lot of research has also been done on the output profile interpretation methods for fractured horizontal wells. Luo et al. (2019), established a DTS temperature-data-inversion interpretation model based on the L-M algorithm for the quantitative interpretation of output profiles for low-permeability gas reservoirs and the fracture parameters of fractured horizontal wells [32]; however, when the number of fractures is large, i.e., the vector length of the inversion target parameters is large, the calculation using the L-M algorithm is inefficient and time-consuming, and the accuracy of the calculation results needs to be improved. Li et al. (2021), established a temperature-profile-prediction model for fractured horizontal wells in box-type shale-gas reservoirs and used the MCMC algorithm to invert DTS data. The output profiles of shale-gas reservoirs were interpreted to identify effective artificial fractures based on the positive correlation between flow rate and temperature drop, in addition to analyzing the three most important factors affecting temperature variation: fracture half-length, gas-flow rate and the permeability of the modified zone. The fracture half-length was used as the inversion target parameter and applied in a shale-gas well with good results [33]; subsequently, Luo et al., using the SA algorithm to explain the output profile, not only overcame the defect that the L-M algorithm might fall into the local optimum and not obtain the global optimum solution, but also avoided the problem of randomly distributed and uncontrollable inversion errors caused by the random inversion calculation of the MCMC algorithm. The reliability of their model was verified by using the PLT results in the field. The computational efficiency is being continuously improved and the inversion process is being optimized.

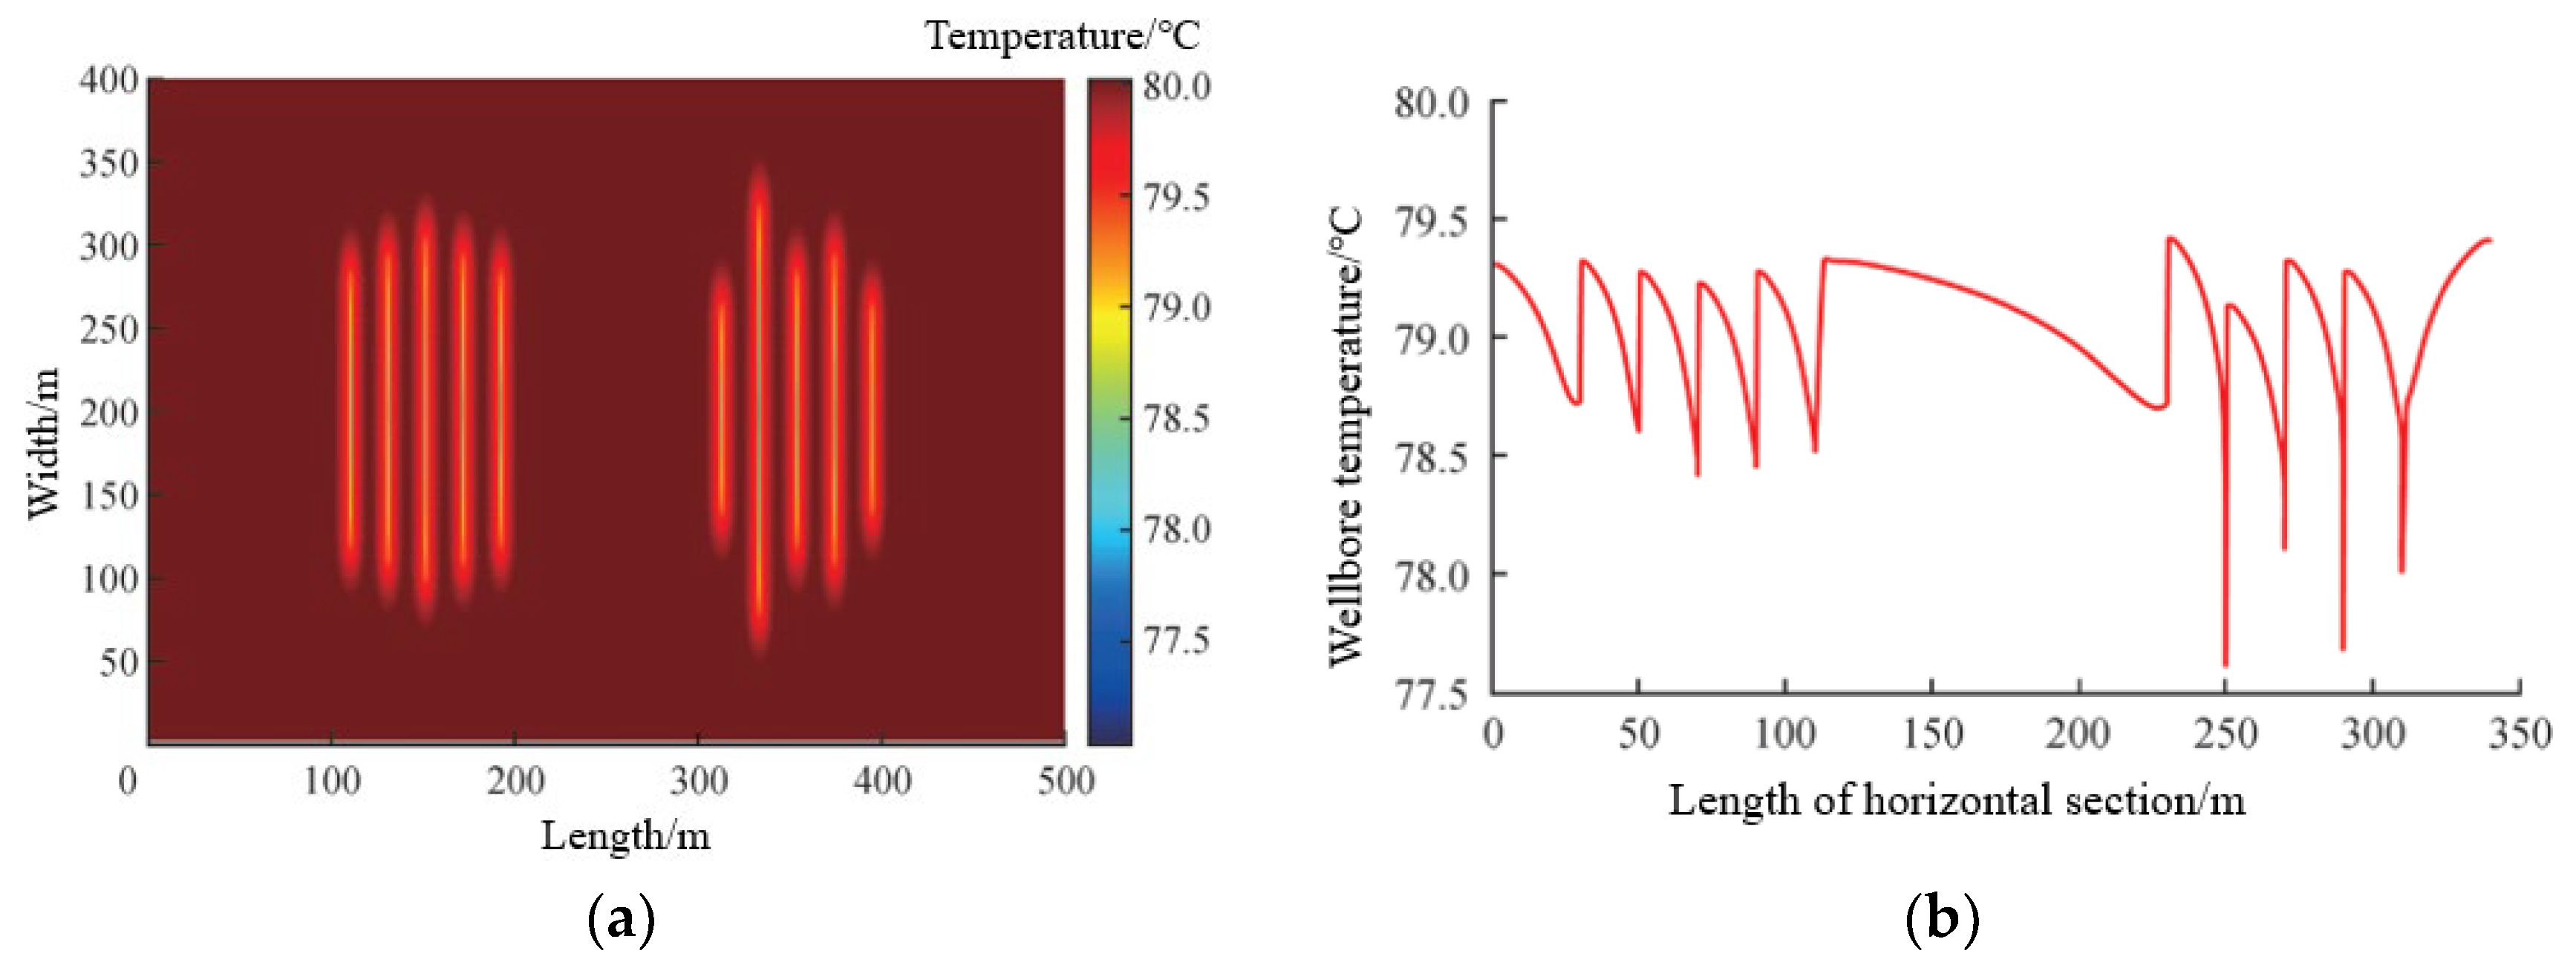
3.1.4. Application of DTS in Hydraulic Fracturing Monitoring

The production enhancement effect of hydraulic fracturing depends on the perfection of fracturing construction, and the monitoring and data interpretation of hydraulic fracturing by DTS is a key means to ensure the fracturing construction, which is extremely important guidance for field construction. The number of fracture bars, the effectiveness of the seal between each fractured section, the integrity of the packer, and the original cause of fluid-fracture inter-section fouling can be determined from the DTS waterfall diagram [34]. In the gas-well-temperature profile, there is a significant temperature drop at the fracture due to the Joule–Thomson effect. The longer the fracture, the greater the temperature drop, and the flow rate in the fracture is positively correlated with the temperature drop, while the wellbore temperature increases in the cementing section due to heat transfer from the fluid. As shown in Figure 7, each “temperature drop + temperature rise” (sawtooth) combination corresponds to a fracture [33].
The joint DAS not only determines whether fracturing fluid is leaking during fracturing but also shows the extensional state of the fracture. During fracturing, the DAS detects acoustic activity below the bridge plug (warmer colors detect acoustic signals), while the DTS also shows the cooling effect below the bridge plug [35] (cooler colors indicate fluid inflow), indicating a fluid leak between fractured sections. When the flow rate is too fast, resulting in a slow temperature response, the use of a double-head installation in a U-shape can improve the measurement accuracy in horizontal wells. Figure 8 shows the extension status of the fractures monitored during the fracturing process. The three perforation clusters from the toe to the heel are 4.1, 4.2 and 4.3. After the start of fracturing, three perforation clusters were fractured, and the DTS showed that all three clusters exhibited cooling effects, while the DAS detected acoustic signals corresponding to the three clusters, and both signals continued until the start of proppant injection, indicating that all three clusters were successfully fractured. Sometime after the start of proppant injection, the acoustic signal of PC 4.1 disappeared on the DAS image, and the DTS image also showed rewarming, indicating the termination of the PC 4.1 fracture. During the injection of proppant, PC 4.2 also showed the phenomenon of the previous PC 4.1, indicating that PC 4.2 also stopped feeding fluid and sand, and the fracture extension ended. After the end of the fluid injection, there was no acoustic signal from PC 4.3 on the DAS image, and it also started to warm up on the DTS image, which indicated that PC 4.3 had the best fracture extension and continued until the end of the fluid injection. It is evident from the combined DTS/DAS image that not all shot-hole cluster fractures extended effectively to reach the initially stated goal, and the PC 4.1 extension was too short to even form an effective support fracture [36].
DTS with an inversion algorithm can calculate the distribution of fracturing fluid [34]. Tabatabaei et al. [37] (2014), used DTS data to qualitatively interpret the location, number and type (vertical/horizontal) of fractures produced after fracturing, and quantitatively calculated the distribution of fracturing fluid based on two algorithms, L-M and MCMC, within 5% error from the actual. Mccullagh et al. [38] (2014), based on Tabatabaei, integrated microseismic data to modify the wellbore-temperature model to improve the accuracy of the calculation results.
Li et al. [39], made a homemade set of physical simulation experiments based on temperature profiles of horizontal wells fractured in DTS gas reservoirs, and input different proppant types to set three fracture-inflow-capacity patterns, homogeneous fracture, increasing inflow capacity in sequence and decreasing inflow capacity in sequence, and plotted temperature profiles from the heel section to finger end based on the experimental results. They concluded that temperature drop at the fracture is positively correlated with fracture-inflow capacity. Combined with the fracture inflow, the fracture-inflow capacity can be estimated to identify and locate high-yield fractures, which provides a theoretical basis and physical experimental foundation for fracture diagnosis. Differences in both fracture-inflow capacity and geometry can lead to uneven distribution of the injected fluid, but such differences have little effect on the retort process, meaning that it is difficult to quantify the height and length of fractures from DTS retort data [40]. However, in 2020 Sun et al. developed the thermally embedded discrete fracture model (TEDFM) and the integrated multiple data assimilation (ESMDA) inversion model, which can be used to deal with the thermal behavior of complex fracture networks in multiphase flows, and the hydraulic fracture half-length, height and inflow capacity can be obtained based on the matching of DTS data history [41]. However, there are unavoidable limitations when using DTS back-temperature data, which require time to wait for the temperature to recover to the ground temperature gradient.

3.2. Advances in the Application of DAS for Hydraulic Fracturing and Production Monitoring

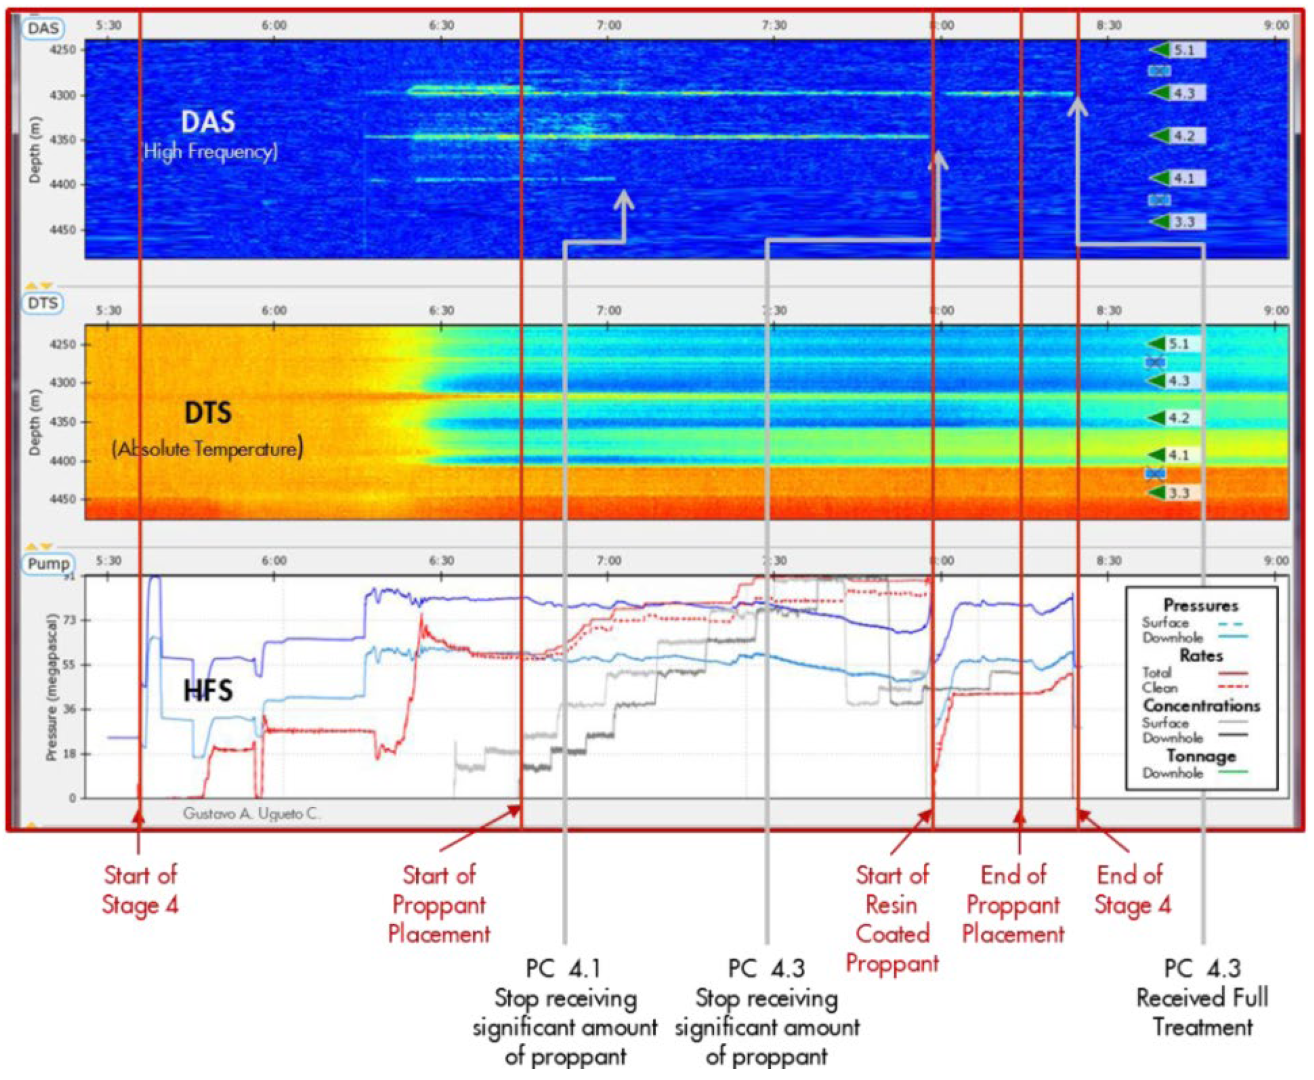
3.2.1. Monitoring the Distribution of Fracturing Fluid with DAS

Mathieu et al. [42] (2013) used DTS and DAS together for a field case study of cement-plug-injection completions to analyze the ball-sequestration process and determine leakage between fractured sections based on DTS and DAS waterfall plots, with stronger DAS acoustic signals representing higher inflow during injection to calculate the distribution of fracturing fluid and proppant, and by providing graphs of real-time flow rates of fracture clusters to evaluate the effect of steering-agent application [43]; Sookprasong et al. [35] (2014) jointly applied DTS and DAS to monitor different periods of fracture start, stop, dormancy and restart during the fracturing of tight gas wells, estimated the volume distribution of fracturing fluid and proppant in the fracture cluster based on DAS data and evaluated the current fracturing stage by DTS and DAS waterfall-graph bridge-plug-seal quality; however, this algorithm does not take into account the occurrence of fracturing-fluid leakage and the calculated fluid distribution has errors. Wheaton et al. [44] (2016) performed multi-stage hydraulic fracturing in horizontal shale wells in the Eagle Ford area and visualized the fracture geometry in a 3D fracture model with DTS and DAS data. Julia et al. [45,46] (2020), studied the factors that affect the borehole diameter due to injection erosion (proppant concentration, injection fluid velocity, injection direction, etc.), recreated a model for the calculation of borehole diameter, improved the accuracy of the calculation of fracturing-fluid and proppant distribution by using the updated borehole diameter at each time step to better interpret the fluid distribution, and used MSEEL (Marcellus Shale Energy and Environmental Laboratory) data. The improved DAS interpretation method was applied to the MIP-3H well, and the results showed that the effect of shot hole erosion on fluid distribution is small, and as Ugueto et al. (2019) stated, other factors such as near-well bending may have a greater effect on the DAS interpretation results; however, this factor has not yet been studied in depth. Luliia et al. [47] (2020) used acoustic signals measured by DAS to quantitatively interpret the distribution of fluids in fracture clusters based on the correlation between acoustic signals and flow velocities, and validated them using numerical simulations of the DTS temperature-recovery-inversion model, and also obtained MIP-3H well data from Marcellus Laboratories to confirm the feasibility of this method in field tests. In addition, the technique can be used with Halliburton’s SmartFleet intelligent fracturing system and surface monitoring system.

3.2.2. Strain Monitoring with DAS

The geometry of a fracture determines to some extent the degree of increased production after fracturing, and a clear understanding of the fracture geometry plays an important role in improving well performance and optimizing completion design. The application of DAS for strain monitoring can observe the length, height, width and density of a fracture, which can be used to constrain the fracture geometry and model optimization.
Sherman et al. [48] (2019) used a machine learning approach to estimate the overall extent of fractures using ML datasets and DNN models; Liu et al. [49] (2020) established a hydraulic fracturing model to simulate the simultaneous expansion of multiple fractures, thus generating fracture geometries, calculating fiber strains under different completion conditions, and analyzing the effects of fracture spacing, cluster number and borehole on strain rates. Based on this, three eigenvalues are proposed for identifying the arrival of the moment of fracture in monitoring wells, i.e., the maximum strain rate, the sum of strain rates and the sum of absolute values of strain rates ( ε s u m ,   ε m a x , ε m a x ), and the adaptability of the two fracture-arrival moment tests, strain and strain-rate images and eigenvalues is confirmed in field examples in unconventional shale formations in small-spaced multi-fractured wells [50]. DAS has two modes of displaying strain fields: strain and strain rate. Chen et al. [51] (2022) established a planar 3D multi-fracture extension model, learned the multi-fracture extension pattern based on fiber optic strain and analyzed the strain and strain-rate distribution characteristics with time in detail. As shown in Figure 9a, the strain images of the fiber can be divided into three stages: strain enhancement, shrinkage convergence and linear convergence during the whole stage from the beginning of crack extension to formation [52]. As shown in Figure 9b, the strain-rate change images can be divided into four stages: strain enhancement, shrinkage convergence, linear convergence and strain-rate reversal [52]. On the strain-distribution image, a linear convergence zone appears when the fracture reaches the position of the fiber in the monitoring well, and there is no special change when the pump is stopped. On the strain-rate distribution image, a “heart-shaped” convergence point appears as the fracture approaches the monitoring well, which reflects the rate of fracture expansion and identifies inter-well compressional fracture, but the heart-shaped convergence point in the inner fracture may not appear due to inter-fracture stress interference because of the large cluster number and small fracture spacing typically used in the unconventional production-enhancement phase. The fractures extend into the monitoring wells forming a straight line extension zone with a biplane compression zone beyond the straight line. The difference in fracture arrival time allows the analysis of the degree of non-uniform fracture extension. A strain-rate reversal on a straight line is a pump stoppage, thus reflecting the fluid injection state, and the mine experiments of Ugueto et al. [53] are consistent with the various characteristics of their model. Kan Wu et al. [54] (2021) developed a geomechanical orthorectified model and a Green’s function inverse model for low-frequency DAS data interpretation, which automatically processes field data to identify not only the arrival of the fracture moment of the monitoring well, but also quantifies the fracture width and height, and applies it to two horizontal shale oil wells with good results.
For the interpretation of fracture conductivity using DAS signals, Harrison et al. (2020), proposed an argument to explain that for the near-well area DAS records the tubular wave signals generated during hydraulic fracturing to characterize the fracture conductivity. The near-well area is the area within a few meters of the wellbore, and the reason for studying the fracture characteristics in the near-well area is related to the production of oil flowing from the reservoir into the wellbore [52]. The tubular wave generated during the shot-hole release propagates in both forward and backward directions within the shot hole and maintains a large amplitude far from the source; however, the hydraulic impedance may cause the attenuation of the tubular wave amplitude [55] (hydraulic impedance is the ratio of pressure to volume flow rate). By observing the field data, it is concluded that when the fracture conductivity increases, the hydraulic impedance also increases, which leads to the attenuation of the amplitude of the tube wave, and the fracture conductivity is explained by the degree of attenuation of the tube wave amplitude. If the correlation between the tube wave amplitude and hydraulic impedance is confirmed, then an inverse model can be developed to calculate the fracture conductivity in the future. The quantification of the tube-wave attenuation rate is addressed in subsequent work to lay the foundation for quantitative representation of the characteristics of the tube wave of fracture [56].

3.2.3. Advances in the Application of DAS in Microseismic Monitoring

One of the main tools used in unconventional reservoirs to evaluate fracturing for production enhancement is microseismic monitoring. During hydraulic fracturing, induced stresses are generated in the formation as the fracture expands, and when the induced stresses exceed the fracture strength of the rock, microseismic energy is released. Distributed acoustic sensors can record the waveforms emitted from the location of these microseismic events. Using a combination of large-aperture, densely sampled DAS, the P and S waves are collected to the point where the distance, size and location of these events can be estimated to understand fracture extension, direction, and extent [7]. Monitoring with conventional cable VSPs is demanding on the wellbore and is difficult and expensive to re-enter once fracturing has started. In contrast, DAS brings a new solution to this problem, which can be installed in wells that are inaccessible to geophones and acquire VSP data at low cost and high efficiency [57]. In downhole microseismic fracture monitoring, distributed acoustic sensing technology has entered the practical stage.
Mestayer et al. [58] (2011), confirmed in two field experiments in Canada and the United States that DAS can generate the same VSP images as geophones and can record longer lengths as well as higher frequency ranges than geophones; Mateeva et al. [59] (2012), improved the DAS device to bring the DAS data close to the VSP vertical seismic profile data utility and confirmed the applicability of DAS in VSP for inspection, imaging and time-lapse monitoring in various field tests. Andrew et al. [60] (2017), compared DAS with geophones and concluded that the advantages of DAS for microseismic monitoring are (1) monitoring the entire life cycle of a well; (2) applicability to harsh environments such as high temperature and pressure; (3) low-cost installation; (4) lack of need to monitor wells; and (5) low HSE risk, while its disadvantages are (1) dependence on direction; (2) difficulty in locating the event location in the absence of multi-component fiber; and (3) lower sensitivity than geophones. In practice, the sensitivity of DAS is approximately double cos2(θ) for signals at an angle of θ to the fiber, which can be improved by winding the cable into a spiral structure. Cole et al. [61] (2017) estimated the hydraulic diffusion coefficient directly from low-frequency DAS microseismic data as well as locating microseismic event locations. Ran Zhou et al. [62] (2017) used two fracture models from Riiger and Tsvankin to detect and characterize fractures by DAS-VSP, but with the prerequisite that the amplitude variations of both models are observable. As shown in Figure 10, Wheaton et al. [44] (2016) characterized the shape of the fracture. Gary et al. [63] (2018) used DAS VSP measurements to relate P-wave arrival-time differences to fracture geometry, using DAS for microseismic monitoring to describe crack length, intensity and orientation.

3.2.4. Production Monitoring with DAS

Commonly used methods for monitoring injection profiles are isotope-tracer-injection profile logging, flow-meter logging, and pulsed neutron oxygen-activation logging. Traditional testing methods have long construction cycles, and varying adaptability to various underground working conditions, and the radioactive elements are hazardous and impactful to the environment and staff. However, the joint application of distributed fiber optic temperature and acoustic sensors not only can adapt to various underground working conditions, but also can provide permanent downhole temperature and acoustic monitoring results online in real time, and processing and estimation of monitoring data can grasp the injection profile of oilfield water wells.
Earlier, fluid distribution was estimated by relying on the proportional relationship between the flow rate and the DAS acoustic signal [64]. The faster the flow rate of injection water into the formation from the perforations, the greater the vibration generated, and the faster the temperature of the well changes. Based on the monitoring results of DTS, the slope of the temperature change of the well is used to qualitatively analyze the injection volume of each layer; the relationship between the injection volume and the change in vibration intensity is consistent, and the injection volume of each layer section is estimated using the proportional relationship based on the ratio of vibration intensity corresponding to the wave peaks of each section of DAS combined with the total injection volume. Chen and Pakhotina et al. confirmed a linear relationship between the logarithm of the sound pressure level and the cube of the flow velocity (the following equation), and a linear relationship between the acoustic energy and the sound pressure level. A linear relationship can be established using the acoustic energy to quantify the fluid distribution in the production process based on the relationship between the acoustic wave and the flow rate. During fluid injection, the temperature distribution on the DTS waterfall diagram is almost uniform, and no information about the flow rate can be obtained, but when the temperature warms back up after the end of injection, the time required to warm back up is long when more fluid is injected. The fluid distribution is quantitatively explained based on the DTS warming-temperature-inversion numerical simulation, because it takes some time to warm back up, the DTS results can be used to verify the results obtained by DAS [46].
log q 3 = A · L SP + B

3.3. Advances in the Application of DSS for Hydraulic Fracturing and Production Monitoring

Microseismic monitoring can capture far-field fracture characteristics, but it is difficult to obtain qualitative analysis and quantitative calculations of fracture geometry or fracture-section production capacity for fluid-producing wells in the near-wellbore region. The core experiments of Gale et al. showed that a large number of hydraulic fractures are distributed near the production-enhancing wells [59], and the fracture characteristics in the near-well region are concerned with the production dynamics of the well because the produced fluids flow into the wellbore from the fractures in the near-well region. The first application of the Rayleigh-frequency-shift-based DSS technique at a fracturing test site has shown great potential in characterizing the fracture characteristics in the near-well region and evaluating the injection efficiency [16,17,65].
DSS-RFS (DSS based on the Rayleigh-frequency-shift principle) strain and DAS sound-intensity measurements have a high correspondence within the fracture section [66]. The shape and magnitude of the strain change curve can be used to interpret fracture geometry and connectivity, and the peak strain change can measure several properties of the fracture, such as fracture width and area. As the pressure rises during shut-in, the pore size and the length of the fractures change, and the strain changes with them [67]. Jin et al. [16] (2021) concluded that there are three modes of pressure–strain diagnostic plots for different perforation clusters: no hysteresis, upward hysteresis and downward hysteresis. No hysteresis exists in the near-wellbore region without a large number of fracture branches, while the largest factor for upward hysteresis characteristics is the presence of a large number of fracture branches, and fracture length is the most likely cause of downward hysteresis in diagnostic plots [68]. Liu (2022) et al. simulated DSS signals with different fracture characteristics, and the size and shape of the peak of the DSS measurement map depended on the fracture characteristics; however, more in-depth studies are needed on the driving mechanisms that generate the observed characteristics.

4. Advantages and Limitations of Distributed Fiber Optic Measurement Technology

The technical advantages of distributed fiber optic measurements in hydraulic fracturing and production monitoring are summarized as follows [7,8,13,69].
(1)
Real-time monitoring of temperature, acoustic and strain information distributed along the length of the borehole by optical fibers throughout the life of the well.
(2)
Adaptability in harsh environments, with up to ten years of continuous operation in humid, high-temperature and high-pressure environments, and the fact that distributed fiber optic measurement technology is the only viable option for wells with polymer drives, where non-Newtonian fluids have a severe impact on most production-logging tools and the data obtained are not reliable;
(3)
The monitoring period can be regulated with the installation method and is easy to install: it can be installed before and during fracturing in just a few hours;
(4)
Low cost, averaging one dollar per measurement point, and reduced operational time for fault detection and well-stoppage testing compared to conventional measuring instruments, without delaying production time;
(5)
Stable nature, no electronic components, no interference with downhole information, and no interference from electromagnetic radiation;
(6)
With high data quality and a wide range of applications, fiber optic measurement systems can provide a variety of information, such as reservoir fracturing, leak detection, fluid injection and flow distribution.
Compared to other technical means, the limitations of applying distributed fiber optic measurements in hydraulic fracturing and production monitoring are summarized as follows [6,16,18,28,70]:
(1)
The intensive sampling interval poses a challenge for storage and transmission, and current distributed fiber optic measurement technologies have autonomous data preliminary filtering and compression systems that can reduce the amount of data, but the filtered signals may contain events that lead to errors in the judgment of current conditions;
(2)
Installation of fiber optics in some wells, such as those with submerged electric pumps, is difficult to achieve;
(3)
The signal-to-noise ratio of DAS needs to be improved to match the geophone;
(4)
For microseismic detection, the sensitivity of DAS depends on the direction, which is generally lower than that of geophones, so the monitoring distance is limited and lacks multicomponent acquisition; otherwise it is difficult to locate the event;
(5)
DSS is sensitive to high-frequency vibration and cannot provide reliable measurement data in noisy environments. Due to its sensitivity to both temperature and strain, the measurement of stress relies on independent temperature measurements (e.g., DTS measurements are available to eliminate temperature effects). Beyond this, the accuracy of the measurements remains dependent on the coupling of the fiber to the ground;
(6)
Proving the integrity of the fiber optic sensing system is the technical basis for all successful monitoring. To avoid fiber damage, a series of shot-avoidance techniques have been carried out, such as directional shot, sliding casing, tube-delivered shotgun (TCP) outside the casing and a hydraulically controlled casing valve. However, once the fiber is damaged, subsequent measurements will be severely affected or even fail.

5. Outlook of Development Trends

Distributed fiber optic measurement systems in hydraulic fracturing and production monitoring have been developed rapidly and widely used, and have also achieved good field-application results. However, the development in some aspects is still insufficient, and some key issues are still unsolved. We need to continue to advance in the following areas:
(1)
To form a permanent distributed fiber optic measurement system, it is necessary to manage the explosive growth of data in the field. The huge data volume of real-time measurements poses a great challenge for data transmission and processing. The key to managing monitoring data is the hierarchical processing of the data. In the future, a database can be built to automatically generate the detection of fiber optic signal anomalies using machine learning algorithm construction. Data volume is reduced at the source by automatically identifying events in real time;
(2)
When monitoring hydraulic fracturing, the optical fiber needs to be fixed outside the casing and entered into the well together with the casing. In case of casing damage and perforation offset, it is difficult to ensure the integrity of the fiber. Ensuring that the fiber is not damaged is a prerequisite for successful monitoring. Although a number of techniques have been developed to avoid damage to the fiber during hole injection, they are not yet mature enough. Based on the technology of directional shot holes and junction-distributed fiber installation locations, we will continue to develop techniques to protect the fiber during the perforation process;
(3)
Distributed fiber optic measurement systems provide measurement data along the entire borehole and throughout the life of the well. With its unique advantages, it will definitely become a regular and important tool for fracture monitoring and evaluation. Among these, the DTS interpretation of flow profiles, DAS characterization of fracture parameters in hydraulic fracturing operations, optimization of fracture models, and joint monitoring and evaluation of hydraulic fracturing operations by DTS and DAS are a current theoretical research boom. In the future, reservoir parameter physical inversion and fracture monitoring and evaluation will continue to be hot research areas for DTS and DAS;
(4)
DAS is still limited by the directionality in microseismic monitoring. The technical difficulties, which are difficult to solve, are overcoming the dependence of DAS on direction and reducing the signal-to-noise ratio;
(5)
DTS has been very much studied in temperature-interpretation models for fractured horizontal wells, but DAS is still very much lacking in interpretation models for hydraulic fracturing. There are certain requirements for researchers if they want to translate the downhole information provided by DAS. Researchers need to have multidisciplinary knowledge, such as expertise in optics, logging, mathematics, acoustics and fracturing. The interpretation results of DAS and the monitoring data of DTS are combined with each other to reduce the multi-solution of the problem and to give a reasonable interpretation of the DAS data.

6. Summary

(1)
By establishing a three-dimensional fiber optic intelligent sensing network, the dynamic changes of hydraulic fracturing and production of oil and gas fields can be monitored in real time, and distributed fiber optic measurement technology can provide technical support and a theoretical basis for decision management and product development of oil and gas fields;
(2)
Real-time strain and microseismic data acquired by DAS monitor low-frequency strain and microseismics. These data can be used to observe the strain effect and fracturing-operation process in treatment wells. This includes stress disturbance, pump stopping time and fracture-extension dynamics. Based on the data provided by DAS, fracture length, height, width and density can be obtained, providing valuable data for fracture monitoring to constrain the fracture geometry and model to optimize fracturing and completion operations in real time;
(3)
DAS can monitor the core details of the fracturing process, such as bridge-plug sealing, ball seating, perforation and fracturing-fluid injection at different stages. DAS can monitor fracturing-fluid injection in clusters with a resolution of less than 3 m. This not only improves the monitoring capability from fracturing section to fracturing cluster but also achieves real-time dynamic and intuitive evaluation of the hydraulic fracturing effect;
(4)
The temperature variation is affected differently by formation permeability, fluid exchange rate and thermal properties of fluids and rocks. Based on the transient temperature data monitored by distributed fiber optic temperature sensors in real time and combined with downhole pressure-test data, reservoir property parameters (such as permeability, flow coefficient, skin coefficient, damage radius and damage permeability) are solved by establishing flow and thermodynamic models of reservoir and wellbore. The model is built to achieve the purpose of reservoir physical parameter inversion and flow-profile interpretation;
(5)
The data provided by the DSS strain based on the Rayleigh-frequency-shift principle are used to study the “pressure–strain variation path” of each fracture cluster, and their numerical simulation can not only explain and quantify the fracture characteristics and production in the near-well area but also provide important information about the fracture conductivity and reservoir fluid supply in the near-well area;
(6)
Distributed fiber optic measurement technology is increasingly used in hydraulic fracturing and production monitoring. With the development of distributed fiber optic measurement technology and more in-depth research in related fields, a multi-component, multi-parameter, multi-channel composite instrument that integrates distributed fiber optic temperature, acoustic and strain sensors can be developed in the future. Distributed fiber optic measurement technology continues to be optimized toward improving measurement accuracy and operational efficiency and reducing system costs. Technicians also need to continuously improve the knowledge of the relationship between measurement data and reservoir physical properties.

Author Contributions

Y.W.: methodology, investigation, original draft preparation; Z.W.: resources, project administration, writing—review and editing; F.W.: supervision, writing—review and editing. All authors have read and agreed to the published version of the manuscript.

Funding

This research received no external funding.

Data Availability Statement

Not applicable.

Conflicts of Interest

The authors declare no conflict of interest.

Nomenclature

L the distance from the incident end to the reflected end, m;
c 0 speed of light in a vacuum, m/s;
c speed of light propagation in the fiber, c = c 0 / n , m/s;
n refractive index of the fiber;
t the time required for the incident light to be received as reflected light, s;
T absolute temperature, K;
v Raman translation, m 1 ;
h Planck’s constant, J/K;
a the temperature dependent coefficient is the temperature dependent coefficient;
l a s inverse Stokes light intensity, cd;
l s Stokes light intensity, cd;
Δ υ R the frequency shift of the Rayleigh scattering spectrum;
C 1 and C 2 depend on the nature and structure of the fiber material;
Δ ε and Δ T strain and temperature variations, respectively.
q the flow rate,
L SP sound pressure level; (The sound pressure level is the intensity of the sound and is replaced by the acoustic energy in the calculation.)
A and Bthe correlation coefficients.

References

  1. Zou, C.N.; Yang, Z.; Dong, D.Z.; Zhao, Q.; Chen, Z.H.; Feng, Y.L.; Li, J.R.; Wang, X.N. Formation, Distribution and Prospect of Unconventional Hydrocarbons in Source Rock Strata in China. Earth Sci. 2022, 47, 1517–1533. [Google Scholar]
  2. Khormali, A.; Sharifov, A.-R.; Torba, D.-I. The control of asphaltene precipitation in oil wells. Pet. Sci. Technol. 2018, 36, 443–449. [Google Scholar] [CrossRef]
  3. Tabatabaei, M.; Zhu, D. Fracture Stimulation Diagnostics in Horizontal Wells Through Use of Distributed Temperature Sensing Technology. SPE Prod. Oper. 2012, 37, 154–158. [Google Scholar] [CrossRef]
  4. Song, X. Research and application of real-time monitoring and interpretation technology for hydraulic fracturing. Inn. Mong. Petrochem. Petrochem. Petrochem. Ind. 2011, 37, 154–158. [Google Scholar]
  5. Liu, X. Research and Application of Real-Time Monitoring and Interpretation Technology for Hydraulic Fracturing; Southwest Petroleum University: Chengdu, China, 2003. [Google Scholar]
  6. Li, H.; Luo, H.; Xiang, Y.; Xiang, Y.; An, S.; Li, Y.; Jiang, B.; Xie, B.; Xin, Y. The Application Status and Prospect of DTS/DAS in Fracturing Monitoring of Horizontal Wells. Xinjiang Oil Gas 2021, 17, 62–73. [Google Scholar]
  7. Sui, W.; Liu, R.; Cui, K. Application and research progress of distributed optical fiber acoustic sensing monitoring for hydraulic fracturing. Sci. Sin. Tech. 2021, 51, 371–387. (In Chinese) [Google Scholar] [CrossRef]
  8. Sui, W.; Zhang, D.; Wang, M.; Wang, X. Review on application and theoretical models for temperature monitoring technology under intelligent well completion conditions in oil and gas field development. Pet. Geol. Recovery Effic. 2020, 27, 129–138. [Google Scholar]
  9. Zhu, G.; Wang, X. Fiber Optic Sensing for Improving Wellbore Surveillance. Well Logging Technol. 2014, 38, 251–256. [Google Scholar]
  10. Zhu, S.; Li, H.; Zhang, J.; Tang, C.; Yang, M. Potential of fiber optic distributed temperature sensing technology for oilfield development. Reserv. Eval. Dev. 2015, 5, 69–75. [Google Scholar]
  11. Costello, C.; Sordyl, P.; Hughes, C.; Figueroa, M.; Balster, E.; Brown, G. Permanent Distributed Temperature Sensing (DTS) Technology Applied In Mature Fields: A Forties Field Case Study. In Proceedings of the SPE Intelligent Energy International Conference and Exhibition, Utrecht, The Netherlands, 27–29 March 2012. [Google Scholar]
  12. MoSoroush, M.; Roostaei, M.; Fattahpour, V.; Mahmoudi, M.; Keough, D.; Cheng, L.; Moez, K. Prognostics thermal well management: A review on wellbore monitoring and the application of Distributed Acoustic Sensing DAS for steam breakthrough detection. In Proceedings of the SPE Thermal Well Integrity and Design Symposium 2019, Banff, AB, Canada, 19–21 November 2019. [Google Scholar]
  13. Zhou, X.; Chen, W.; Jiangfeng, Y.; Li, X. Application review of DAS technology in oil and gas geophysics. Prog. Geophys. 2021, 36, 338–350. [Google Scholar]
  14. Liang, G.; Shaohua, Z.; Gang, Y.; Ximing, W.; Shujie, A.; Junjun, W.; Yuanzhong, C. Optical Sensing Promotes Intelligence, Innovation and Development of Reservoir Geophysical Technology. Pet. Sci. Technol. Forum 2021, 40, 55–64. [Google Scholar]
  15. Parker, T.; Shatalin, S.; Farhadiroushan, M. Distributed Acoustic Sensing—A new tool for seismic applications. First Break 2014, 32. [Google Scholar] [CrossRef]
  16. Jin, G.; Ugueto, G.; Wojtaszek, M.; Guzik, A.; Jurick, D.; Kishida, K. Novel Near-Wellbore Fracture Diagnosis for Unconventional Wells Using High-Resolution Distributed Strain Sensing during Production. SPE J. 2021, 26, 3255–3264. [Google Scholar] [CrossRef]
  17. Ugueto, G.A.; Wojtaszek, M.; Mondal, S.; Guzik, A.; Jurick, D.; Jin, G. New Fracture Diagnostic Tool for Unconventionals: High-Resolution Distributed Strain Sensing via Rayleigh Frequency Shift during Production in Hydraulic Fracture Test 2. In Proceedings of the SPE/AAPG/SEG Unconventional Resources Technology Conference 2021, Online, 16–18 November 2021. [Google Scholar]
  18. Sierra, J.R.; Kaura, J.D.; Gualtieri, D.; Glasbergen, G.; Sarker, D.; Johnson, D. DTS Monitoring Data of Hydraulic Fracturing: Experiences and Lessons Learned. Presented at the SPE Annual Technical Conference and Exhibition, Denver, CO, USA, 21–24 September 2008. Paper SPE 116182. [Google Scholar]
  19. Al Shoaibi, S.; Kechichian, J.; Mjeni, R.; Al Rajhi, S.; Bakker, G.G.; Hemink, G.; Freeman, F. Implementing fiber optics distributed sensing as a key surveillance tool. In Proceedings of the Abu Dhabi International Petroleum Exhibition & Conference 2016, Abu Dhabi, United Arab Emirates, 7–10 November 2016. [Google Scholar]
  20. Soroush, M.; Mohammadtabar, M.; Roostaei, M.; Hosseini, S.A.; Fattahpour, V.; Mahmoudi, M.; Keough, D.; Tywoniuk, M.; Mosavat, N.; Cheng, L.; et al. Downhole Monitoring Using Distributed Acoustic Sensing: Fundamentals and Two Decades Deployment in Oil and Gas Industries. In Proceedings of the SPE Conference at Oman Petroleum & Energy Show 2022, Muscat, Oman, 21–23 March 2022. [Google Scholar]
  21. Sanchez, A.; Brown, G.A.; Carvalho, V.L.; Wray, A.S.; Gutierrez Murillo, G. Slickline with fiber-optic distributed temperature monitoring for water-injection and gas lift systems optimization in Mexico. In Proceedings of the SPE Latin American and Caribbean Petroleum Engineering Conference 2005, Rio de Janeiro, Brazil, 20–23 June 2005. [Google Scholar]
  22. Weaver, M.A.; Kragas, T.K.; Burman, J.; Copeland, D.L.; Phillips, B.; Seagraves, R. Installation and Application of Permanent Downhole Optical Pressure/Temperature Gauges and Distributed Temperature Sensing in Producing Deepwater Wells at Marco Polo. In Proceedings of the SPE Annual Technical Conference and Exhibition 2005, Dallas, TX, USA, 9–12 October 2005. [Google Scholar]
  23. Ting, C.S.; Minggu, N.A.; Kamat, D.; Chaw, K.T.; Tan, C.S.; Kalidas, S.; Barretto, G.J. Production Enhancement Evaluation via Permanent Fiber Optics Distributed Temperature Sensing Interpretation for a Gas-Lifted Producer in Field B, Offshore Malaysia. In Proceedings of the Offshore Technology Conference Asia 2022, Kuala Lumpur, Malaysia, 22–25 March 2022. [Google Scholar]
  24. Bello, O.; Bale, D.S.; Yang, L.; Yang, D.; Kb, A.; Lajith, M.; Lazarus, S. Integrating downhole temperature sensing datasets and visual analytics for improved gas lift well surveillance. In Proceedings of the SPE Annual Technical Conference and Exhibition 2018, Dallas, TX, USA, 24–26 September 2018. [Google Scholar]
  25. Patel, D.; Wee, K.; Gorgi, S.; Ashraf, H. Success Story: 64 Wells with Hybrid Real Time DTS/DAS Monitoring and Permanent Downhole Gauges Installed in the United Arab Emirates. In Proceedings of the Abu Dhabi International Petroleum Exhibition & Conference 2020, Abu Dabi, United Arab Emirates, 9–12 November 2020. [Google Scholar]
  26. Li, Y. Production Profile Interpretation Model and Its Software Development Based on DTS Data for Horizontal Well in Bottom Production Profile Interpretation Model and Its Software Development Based on DTS Data for Horizontal Well in Bottom Water Gas Reservoir; Southwest Petroleum University: Chengdu, Chiana, 2018. [Google Scholar]
  27. Wu, M.; Zheng, Y.; Long, T.; Duan, Y.; Wei, M. Interpretation of gas well production profile based on distributed temperature sensing monitoring: A case study of multilayered exploration wells in Yongle, South China Sea. Sci. Technol. Eng. 2022, 22, 2245–2251. [Google Scholar]
  28. Fu, J.; Xiao, L.; Zhang, Y. Progress of permanent fiber-optic sensor applications to oil and gas well. Prog. Geophys. 2004, 19, 515–523. [Google Scholar]
  29. Ramey, H.J. Wellbore heat transmission. J. Pet. Technol. 1962, 14, 427–435. [Google Scholar] [CrossRef]
  30. Zhao, Z.; Yang, H.; Wu, J.; Chang, C.; Sun, H.; Sepehrnoori, K.; Yu, W.; Torres, F.; Xavier, M. Fracture Diagnosis with Distributed Temperature Sensing Using Thermal Embedded Discrete Fracture Model (EDFM). In Proceedings of the 55th US Rock Mechanics/Geomechanics Symposium 2021, Online, 18–25 June 2021. [Google Scholar]
  31. Yang, B. Successful Flow Profiling of Gas Wells Using Distributed Temperature Sensing Data. Inn. Mong. Petrochem. Petrochem. Ind. 2013, 39, 47–50. [Google Scholar]
  32. Hongwen, L.U.O.; Haitao, L.I.; Huibin, L.I.U. A novel method to interpret production profiles of fractured horizontal well in low-permeability gas reservoir by inversing DTS data. Nat. Gas Geosci. 2019, 30, 1639–1645. [Google Scholar]
  33. Li, H.; Luo, H.; Xiang, Y.; Li, Y.; Jiang, B.; Cui, X.; Gao, S.; Zou, S.; Xin, Y. DTS based hydraulic fracture identification and production profile interpretation method of horizontal well. Nat. Gas Ind. 2021, 41, 66–75. [Google Scholar] [CrossRef]
  34. Wang, X.; Bussear, T.R. Real time horizontal well monitoring using distributed temperature sensing (DTS) technology. In Proceedings of the OTC Brasil Conference, Rio de Janeiro, Brazil, 4–6 October 2011. [Google Scholar]
  35. Sookprasong, P.A.; Hurt, R.S.; Gill, C.C. Downhole monitoring of multicluster, multistage horizontal well fracturing with fiber optic distributed acoustic sensing (DAS) and distributed temperature sensing (DTS). In Proceedings of the International Petroleum Technology Conference 2014, Doha, Qatar, 19–22 January 2014. [Google Scholar]
  36. Ugueto, C.G.A.; Huckabee, P.T.; Molenaar, M.M.; Wyker, B.; Somanchi, K. Perforation cluster efficiency of cemented plug and perf limited entry completions; Insights from fiber optics diagnostics. In Proceedings of the Spe Hydraulic Fracturing Technology Conference 2016, The Woodlands, TX, USA, 9–11 February 2016. [Google Scholar]
  37. Tabatabaei, M.; Ding, Z. Fracture stimulation diagnostics in horizontal wells using DTS. In Proceedings of the Canadian Unconventional Resources Conference 2011, Calgary, AB, Canada, 15–17 November.
  38. McCullagh, C.L.; Tutuncu, A.N.; Song, T.H. Coupling distributed temperature sensing (DTS) based wellbore temperature models with microseismic data for enhanced characterization of hydraulic fracture stimulation. In Proceedings of the 48th US Rock Mechanics/Geomechanics Symposium 2014, Minneapolis, MN, USA, 1–4 June 2014. [Google Scholar]
  39. Li, H.; Guo, Z.; Luo, H.; Xiang, Y.; Liu, W.; Ai, Y. Physical simulation experiment on temperature profile of fractured horizontal well in gas reservoir. Sci. Technol. Eng. 2021, 21, 14133–14138. [Google Scholar]
  40. Ghosh, S.; Zhou, D.; App, J.; Jain, L.; Hughes, K.; Emery, D.; Fu, J.; Zhang, R. Insights into fracture fluid distribution and fracture geometry in hydraulically fractured horizontal wells through thermal simulations and fiber optics distributed temperature sensing (FO-DTS) measurements. In Proceedings of the Unconventional Resources Technology Conference (URTEC) 2020, Austin, TX, USA, 20–22 July 2020; pp. 3787–3796. [Google Scholar]
  41. He, S.; Yu, W.; Sepehrnoori, K. Fracture Characterization and Flow Profiling with Distributed Temperature Sensing. In Proceedings of the Unconventional Resources Technology Conference (URTEC) 2020, Austin, TX, USA, 20–22 July 2020; pp. 4213–4244. [Google Scholar]
  42. Molenaar, M.M.; Cox, B.-E. Field cases of hydraulic fracture stimulation diagnostics using fiber optic distributed acoustic sensing (DAS) measurements and Analyses. In Proceedings of the SPE Unconventional Gas Conference and Exhibition 2013, Muscat, Oman, 28–30 January 2013. [Google Scholar]
  43. Evans, S.; Holley, E.; Dawson, K.; Garrison, N.; Montes, M.; Preston, G.; Hudson, S. Eagle Ford Case History: Evaluation of Diversion Techniques to Increase Stimulation Effectiveness. In Proceedings of the SPE/AAPG/SEG Unconventional Resources Technology Conference, San Antonio, TX, USA, 1–3 August 2016. [Google Scholar]
  44. Wheaton, B.; Haustveit, K.; Deeg, W.; Miskimins, J.; Barree, R. A case study of completion effectiveness in the eagle ford shale using DAS/DTS observations and hydraulic fracture modeling. In Proceedings of the SPE Hydraulic Fracturing Technology Conference, The Woodlands, TX, USA, 9–11 February 2016. [Google Scholar]
  45. Pakhotina, J.; Zhu, D.; Hill, A.D. Evaluating Perforation Erosion and its Effect on Limited Entry by Distributed Acoustic Sensor DAS Monitoring. In Proceedings of the SPE Annual Technical Conference and Exhibition 2020, Online, 26–29 October 2022. [Google Scholar]
  46. Pakhotina, I.; Sakaida, S.; Zhu, D.; Hill, A.D. Diagnosing multistage fracture treatments with distributed fiber-optic sensors. SPE Prod. Oper. 2020, 35, 852–864. [Google Scholar]
  47. Sakaida, S.; Pakhotina, I.; Zhu, D.; Hill, A.D. Estimation of Fracture Properties by Combining DAS and DTS Measurements. In Proceedings of the SPE International Hydraulic Fracturing Technology Conference & Exhibition 2022, Muscat, Oman, 11–13 January 2022. [Google Scholar]
  48. Sherman, C.S.; Mellors, R.J.; Morris, J.P. Subsurface monitoring via physics-informed deep neural network analysis of DAS. In Proceedings of the 53rd US Rock Mechanics/Geomechanics Symposium 2019, New York, NY, USA, 23–26 June 2019. [Google Scholar]
  49. Liu, Y.; Wu, K.; Jin, G.; Moridis, G. Hydraulic fracture modeling of fracture-induced strain variation measured by low-frequency distributed acoustic sensing (LF-DAS) along offset wells. In Proceedings of the 54th US Rock Mechanics/Geomechanics Symposium, Online, 28 June–1 July 2020. [Google Scholar]
  50. Liu, Y.; Wu, K.; Jin, G.; Moridis, G.J.; Kerr, E.; Scofield, R.; Johnson, A. Strain and strain-rate responses measured by LF-DAS and corresponding features for fracture-hit detection during multiple-fracture propagation in unconventional reservoirs. In Proceedings of the Unconventional Resources Technology Conference (URTEC), Online, 20–22 July 2020; pp. 1134–1152. [Google Scholar]
  51. Ming, C.; Guo, T.; Xu, Y.; Qu, Z.; Zhang, Z.; Zhou, T.; Wang, Y. Evolution mechanism of optical fiber strain induced by multi-fracture growth during fracturing in horizontal well. Pet. Explor. Dev. 2022, 49, 183–193. [Google Scholar]
  52. Schumann, H.; Jin, G. Inferring near-well conductivity from DAS-recorded tube waves generated by perforation shots. In Proceedings of the SEG International Exposition and Annual Meeting 2020, Online, 11–16 October 2020. [Google Scholar]
  53. Ugueto, G.A.; Todea, F.; Daredia, T.; Wojtaszek, M.; Huckabee, P.T.; Reynolds, A.; Laing, C.; Chavarria, J.A. Can you feel the strain? DAS strain fronts for fracture geometry in the BC Montney, Groundbirch. In Proceedings of the SPE Annual Technical Conference and Exhibition 2019, Calgary, AB, Canada, 30 September–2 October 2019. [Google Scholar]
  54. Zhu, X.; Ge, J. Analysis of cross-well fracture hits in DJ Basin, Colorado using low-frequency DAS data. In Proceedings of the SEG/AAPG/SEPM First International Meeting for Applied Geoscience & Energy 2021, Denver, CO, USA, 26 September–1 October 2021. [Google Scholar]
  55. Holzhausen, G.-R.; Gooch, R.-P. Impedance of hydraulic fractures: Its measurement and use for estimating fracture closure pressure and dimensions. In Proceedings of the SPE/DOE Low Permeability Gas Reservoirs Symposium 1985, Denver, CO, USA, 19–22 May 1985. [Google Scholar]
  56. Wu, C. 3D finite-difference elastic modeling for DAS VSP and microseismic surveys. In Proceedings of the SEG/AAPG/SEPM First International Meeting for Applied Geoscience & Energy 2021, Denver, CO, USA, 26 September–1 October 2021. [Google Scholar]
  57. Pakhotina, J.; Zhu, D.; Hill, A.D.; Santos, R. Characterization of production through a fracture cell using acoustic data. In Proceedings of the SPE Annual Technical Conference and Exhibition 2017, San Antonio, TX, USA, 9–11 October 2017. [Google Scholar]
  58. Mestayer, J.; Cox, B.; Wills, P.; Kiyashchenko, D.; Lopez, J.; Costello, M.; Bourne, S.; Ugueto, G.; Lupton, R.; Solano, G.; et al. Field trials of distributed acoustic sensing for geophysical monitoring. In SEG Technical Program Expanded Abstracts; Society of Exploration Geophysicists: Houston, TX, USA, 2011; pp. 4253–4257. [Google Scholar]
  59. Mateeva, A.; Mestayer, J.; Cox, B.; Kiyashchenko, D.; Wills, P.; Lopez, J.; Grandi, S.; Hornman, K.; Lumens, P.; Franzen, A.; et al. Advances in distributed acoustic sensing (DAS) for VSP. In SEG Technical Program Expanded Abstracts 2012; Society of Exploration Geophysicists: Houston, TX, USA, 2012; pp. 1–5. [Google Scholar]
  60. Zhou, R.; Willis, M.E.; Cheng, D.; Green, K. Characterization of a Fractured Reservoir Using DAS VSP—A Model-Based Reflection Amplitude Study. In Proceedings of the Fourth EAGE Borehole Geophysics Workshop, Abu Dhabi, United Arab Emirates, 19–22 November 2017; European Association of Geoscientists & Engineers: Utrecht, The Netherlands, 2017; pp. 1–5. [Google Scholar]
  61. Cole, S.; Karrenbach, M.; Boone, K.; Ridge, A.; Kahn, D.; Rich, J.; Silver, K.; Langton, D. Effective diffusivity estimates from distributed fiber-optic strain and microseismic measurements. In Proceedings of the 2017 SEG International Exposition and Annual Meeting, Houston, TX, USA, 24–29 September 2017. [Google Scholar]
  62. Chen, K.; Zhu, D.; Hill, A.D. Acoustic signature of flow from a fractured wellbore. In Proceedings of the SPE Annual Technical Conference and Exhibition 2015, Houston, TX, USA, 28–30 September 2015. [Google Scholar]
  63. Binder, G.; Titov, A.; Tamayo, D.; Simmons, J.; Tura, A.; Byerley, G.; Monk, D. Time delays from stress-induced velocity changes around fractures in a time-lapse DAS VSP. In Proceedings of the 2018 SEG International Exposition and Annual Meeting, Anaheim, CA, USA, 14–19 October 2018. [Google Scholar]
  64. Molenaar, M.M.; Hill, D.J.; Webster, P.; Fidan, E.; Birch, B. First downhole application of distributed acoustic sensing for hydraulic-fracturing monitoring and diagnostics. SPE Drill. Complet. 2012, 27, 32–38. [Google Scholar] [CrossRef]
  65. Gale, J.F.; Elliott, S.J.; Laubach, S.E. Hydraulic fractures in core from stimulated reservoirs: Core fracture description of HFTS slant core, Midland Basin, West Texas. In Proceedings of the Unconventional Resources Technology Conference, Houston, TX, USA, 23–25 July 2018; pp. 1340–1357. [Google Scholar]
  66. Zakhour, N.; Jones, M.; Zhao, Y.; Orsini, K.; Sahni, V. HFTS-2 Completions Design and State-of-the-Art Diagnostics Results. In Proceedings of the Unconventional Resources Technology Conference (URTeC), Houston, TX, USA, 26–28 July 2021; pp. 1162–1185. [Google Scholar]
  67. Liu, Y.; Jin, G.; Wu, K. New Insights on Near-Wellbore Fracture Characteristics from High-Resolution Distributed Strain Sensing Measurements. In Proceedings of the Unconventional Resources Technology Conference (URTeC), Houston, TX, USA, 26–28 July 2021; pp. 3366–3383. [Google Scholar]
  68. Liu, Y.; Jin, G.; Wu, K. New Insights on Characteristics of the Near-Wellbore Fractured Zone from Simulated High-Resolution Distributed Strain Sensing Data. SPE Reserv. Eval. Eng. 2022, 25, 99–112. [Google Scholar] [CrossRef]
  69. Berghmans, F. Reliability of optical fibers and components. In Proceedings of the 17th International Conference on Optical Fibre Sensors 2005, Bruges, Belgium, 23–27 May 2005; pp. 20–23. [Google Scholar]
  70. Van Der Horst, J.; Lopez, J.L.; Berlang, W.; Potters, H. In-well distributed fiber optic solutions for reservoir surveillance. In Proceedings of the Offshore Technology Conference 2013, Houston, TX, USA, 6–9 May 2013. [Google Scholar]
Figure 1. The principle of DTS measurement [11].
Energies 15 07519 g001
Figure 2. The principle of DAS measurement [12].
Energies 15 07519 g002
Figure 3. The principle of DSS measurement [16].
Energies 15 07519 g003
Figure 4. Distributed fiber optic sensing installation in the wellbore [12].
Energies 15 07519 g004
Figure 5. Monitoring of gas lift based on Joule–Thomson effect [11].
Energies 15 07519 g005
Figure 6. Joule–Thomson Effect in the reservoir and temperature profile [11].
Energies 15 07519 g006
Figure 7. (a) Temperature distribution of horizontal wells in shale-gas reservoirs [33]; (b) Wellbore temperature profiles for horizontal wells in shale-gas reservoirs [33].
Energies 15 07519 g007
Figure 8. Example of DAS and DTS measurements during the hydraulic fracturing operation [36].
Energies 15 07519 g008
Figure 9. (a) Fiber strain-rate distribution with time [52]; (b) Fiber strain distribution with time [52].
Energies 15 07519 g009
Figure 10. Three-dimensional depiction of the first four fracturing stages (heel to left, toe to right) [44].
Energies 15 07519 g010
Table 1. Advantages and disadvantages of different installation positions of optical fiber.
Installation
Location
Monitoring TimeAdvantagesDisadvantagesMonitoring Events
Outside of the casingPermanent1. Coupling with reservoirs
2. No production delays
3. Can be deployed post-production
1. One must consider the outer diameter of the casing and plan the installation clearance
2. Damage to fiber when perforation occurs
Monitoring near the wellbore or of cement quality
Outside of the tubingPermanent/
Semi-
Permanent
1. Can be installed in existing wells
2. Can be deployed post-production
1. No coupling to reservoirs
2. Damage to fiber when perforation occurs
3. Once removed it needs to be reinstalled
Monitoring of various types of leaks
Inside of the tubingSemi-
Permanent
1. High benefits
2. Can be installed in horizontal wells with large inclination
1. One must consider erosion resistance and avoid fiber damage
2. Interference conductivity material
Monitor stimulation and production
Publisher’s Note: MDPI stays neutral with regard to jurisdictional claims in published maps and institutional affiliations.

