
Interaction between a Cyclically Heated Building and the Ground, for Selected Locations in Europe


Abstract
1. Introduction
2. Materials and Methods
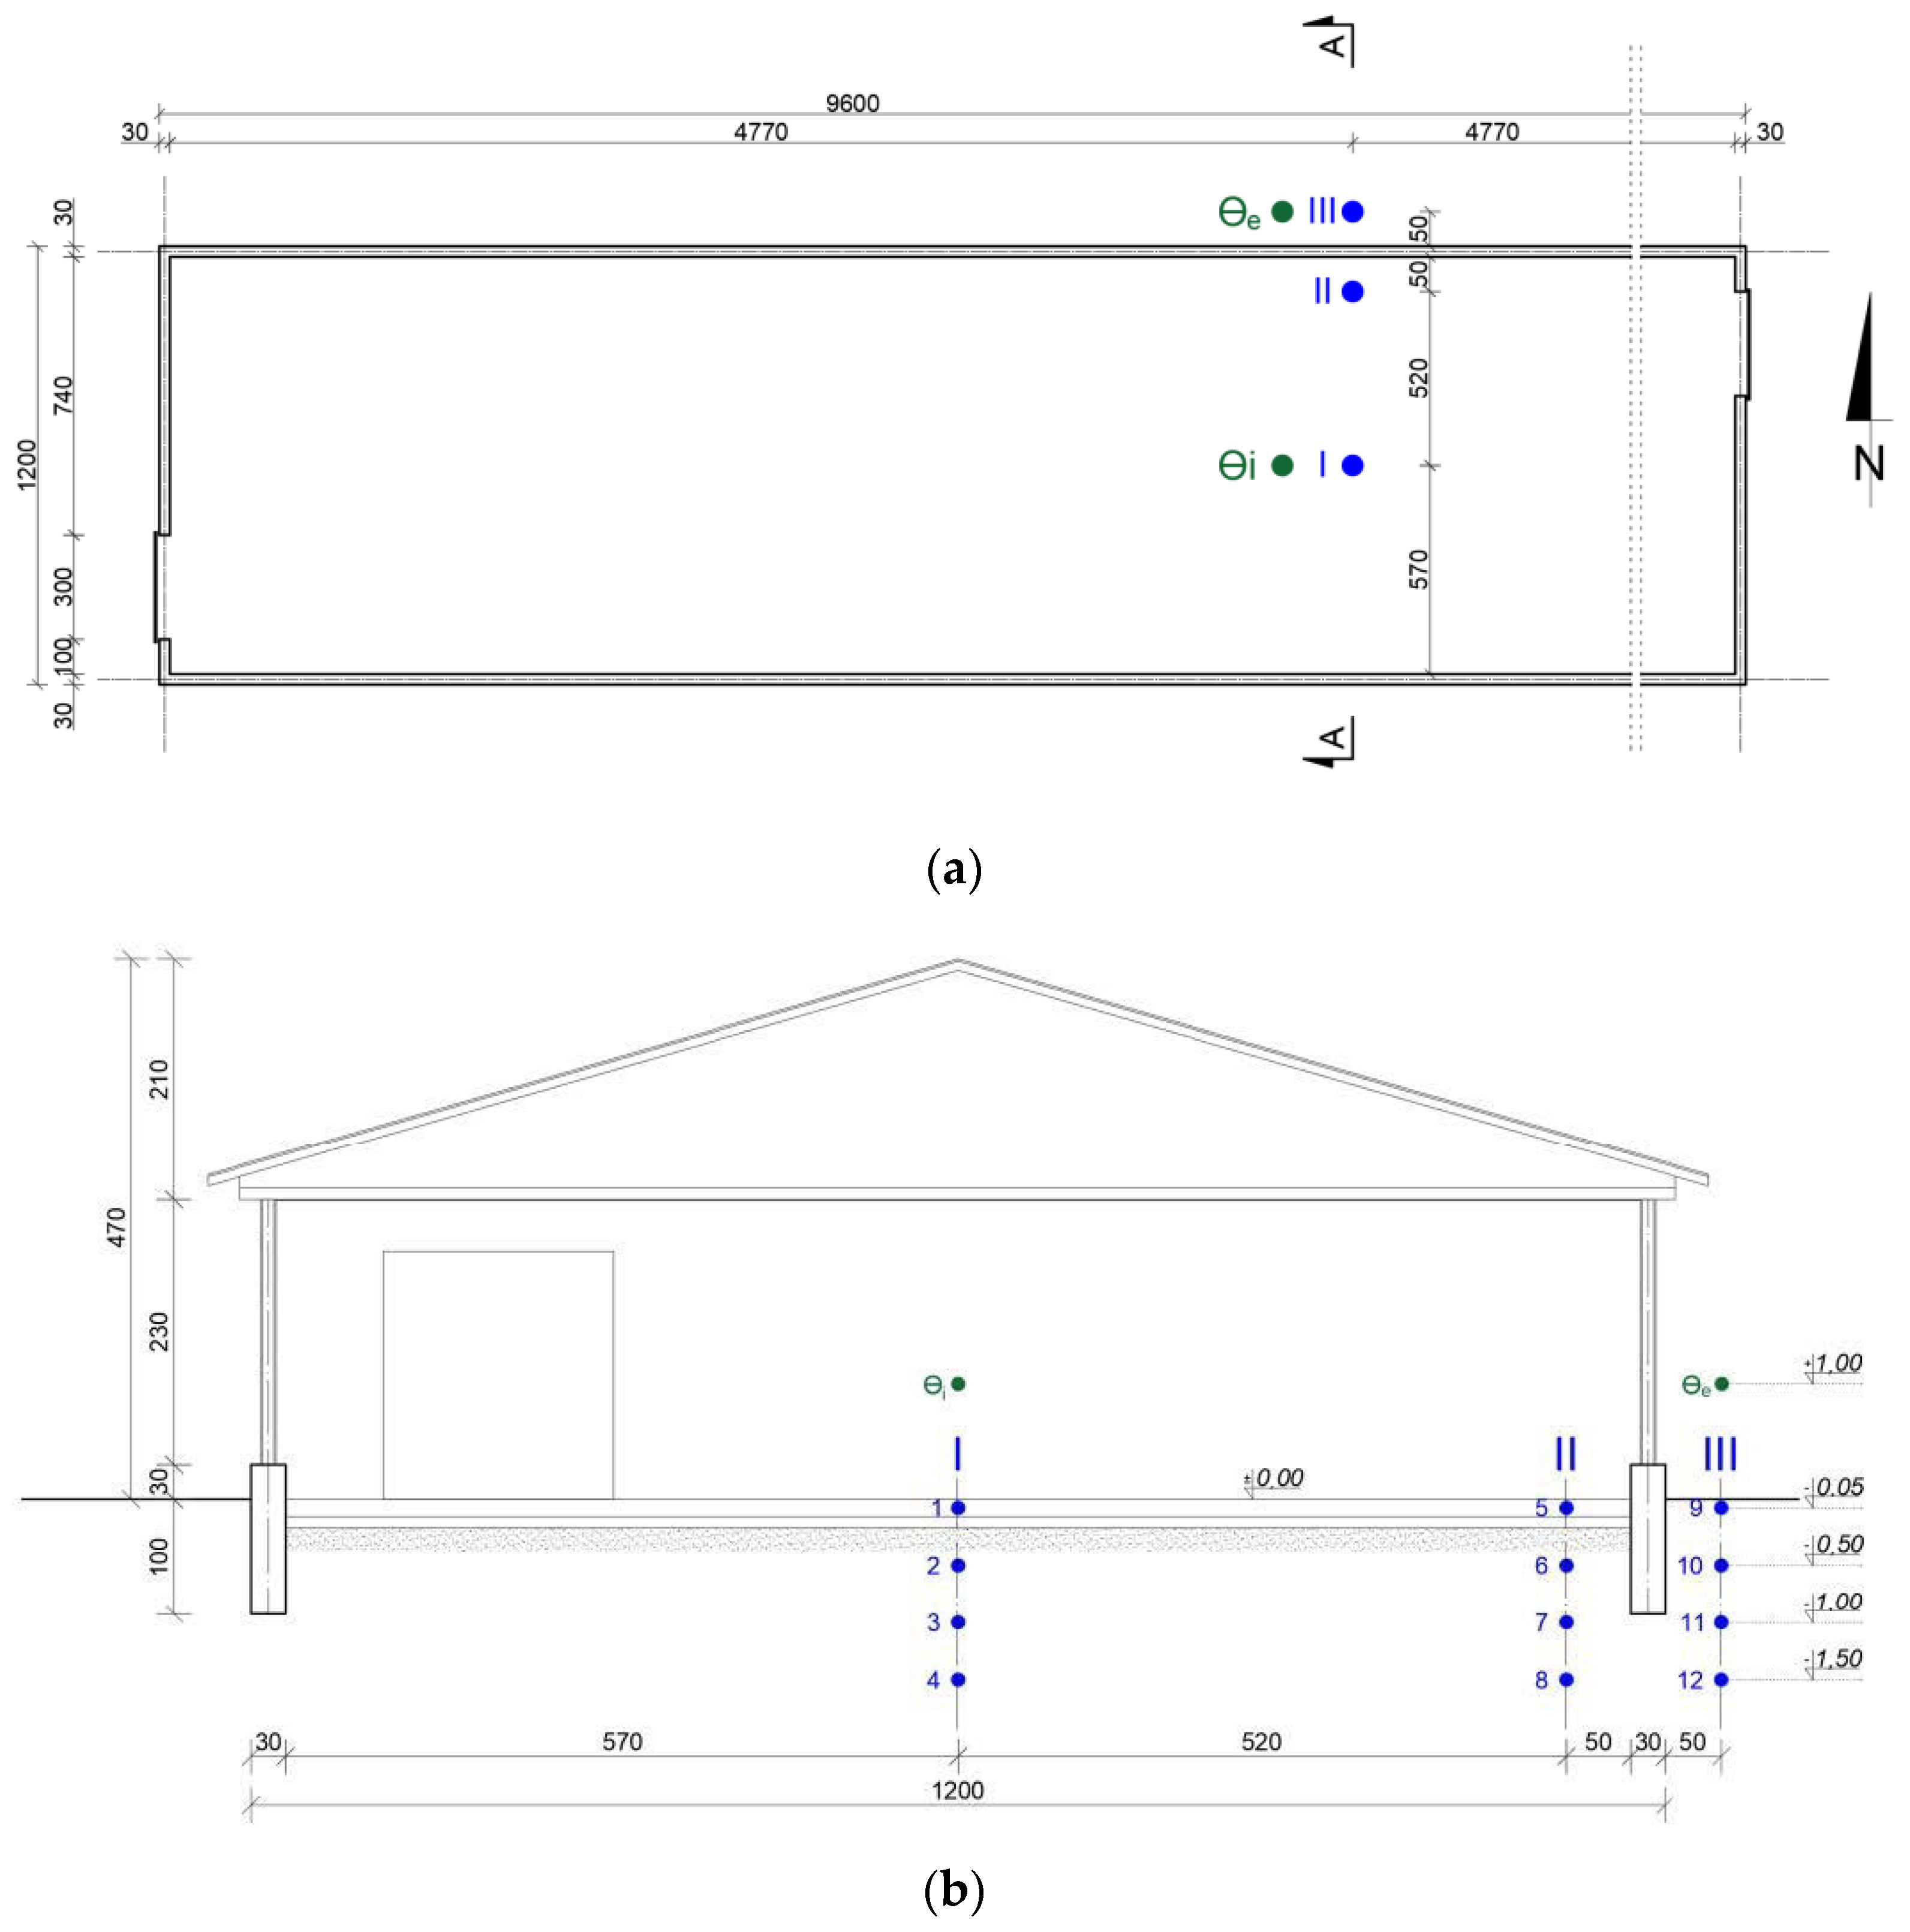
2.1. Test Object-Experimental Tests, Measuring Equipment
2.2. Validation of the Calculation Model
- (1)
- Implementation of the results of actual measurements to the model;
- (2)
- Creation of a geometric model of the building and soil;
- (3)
- Declaration of physical parameters of materials used in the model;
- (4)
- Adoption of a 90-day period of initial simulation, a learning phase for the computational model to adapt to the real conditions;
- (5)
- Determination of the characteristics of the HVAC system;
- (6)
- Planning and implementation of control points corresponding to actual measurement points in the geometric model;
- (7)
- Conduct of the simulation; and
- (8)
- Verification of compliance of the theoretical results with the actual results.
2.3. Calculations
3. Results
3.1. Field Measurement Results
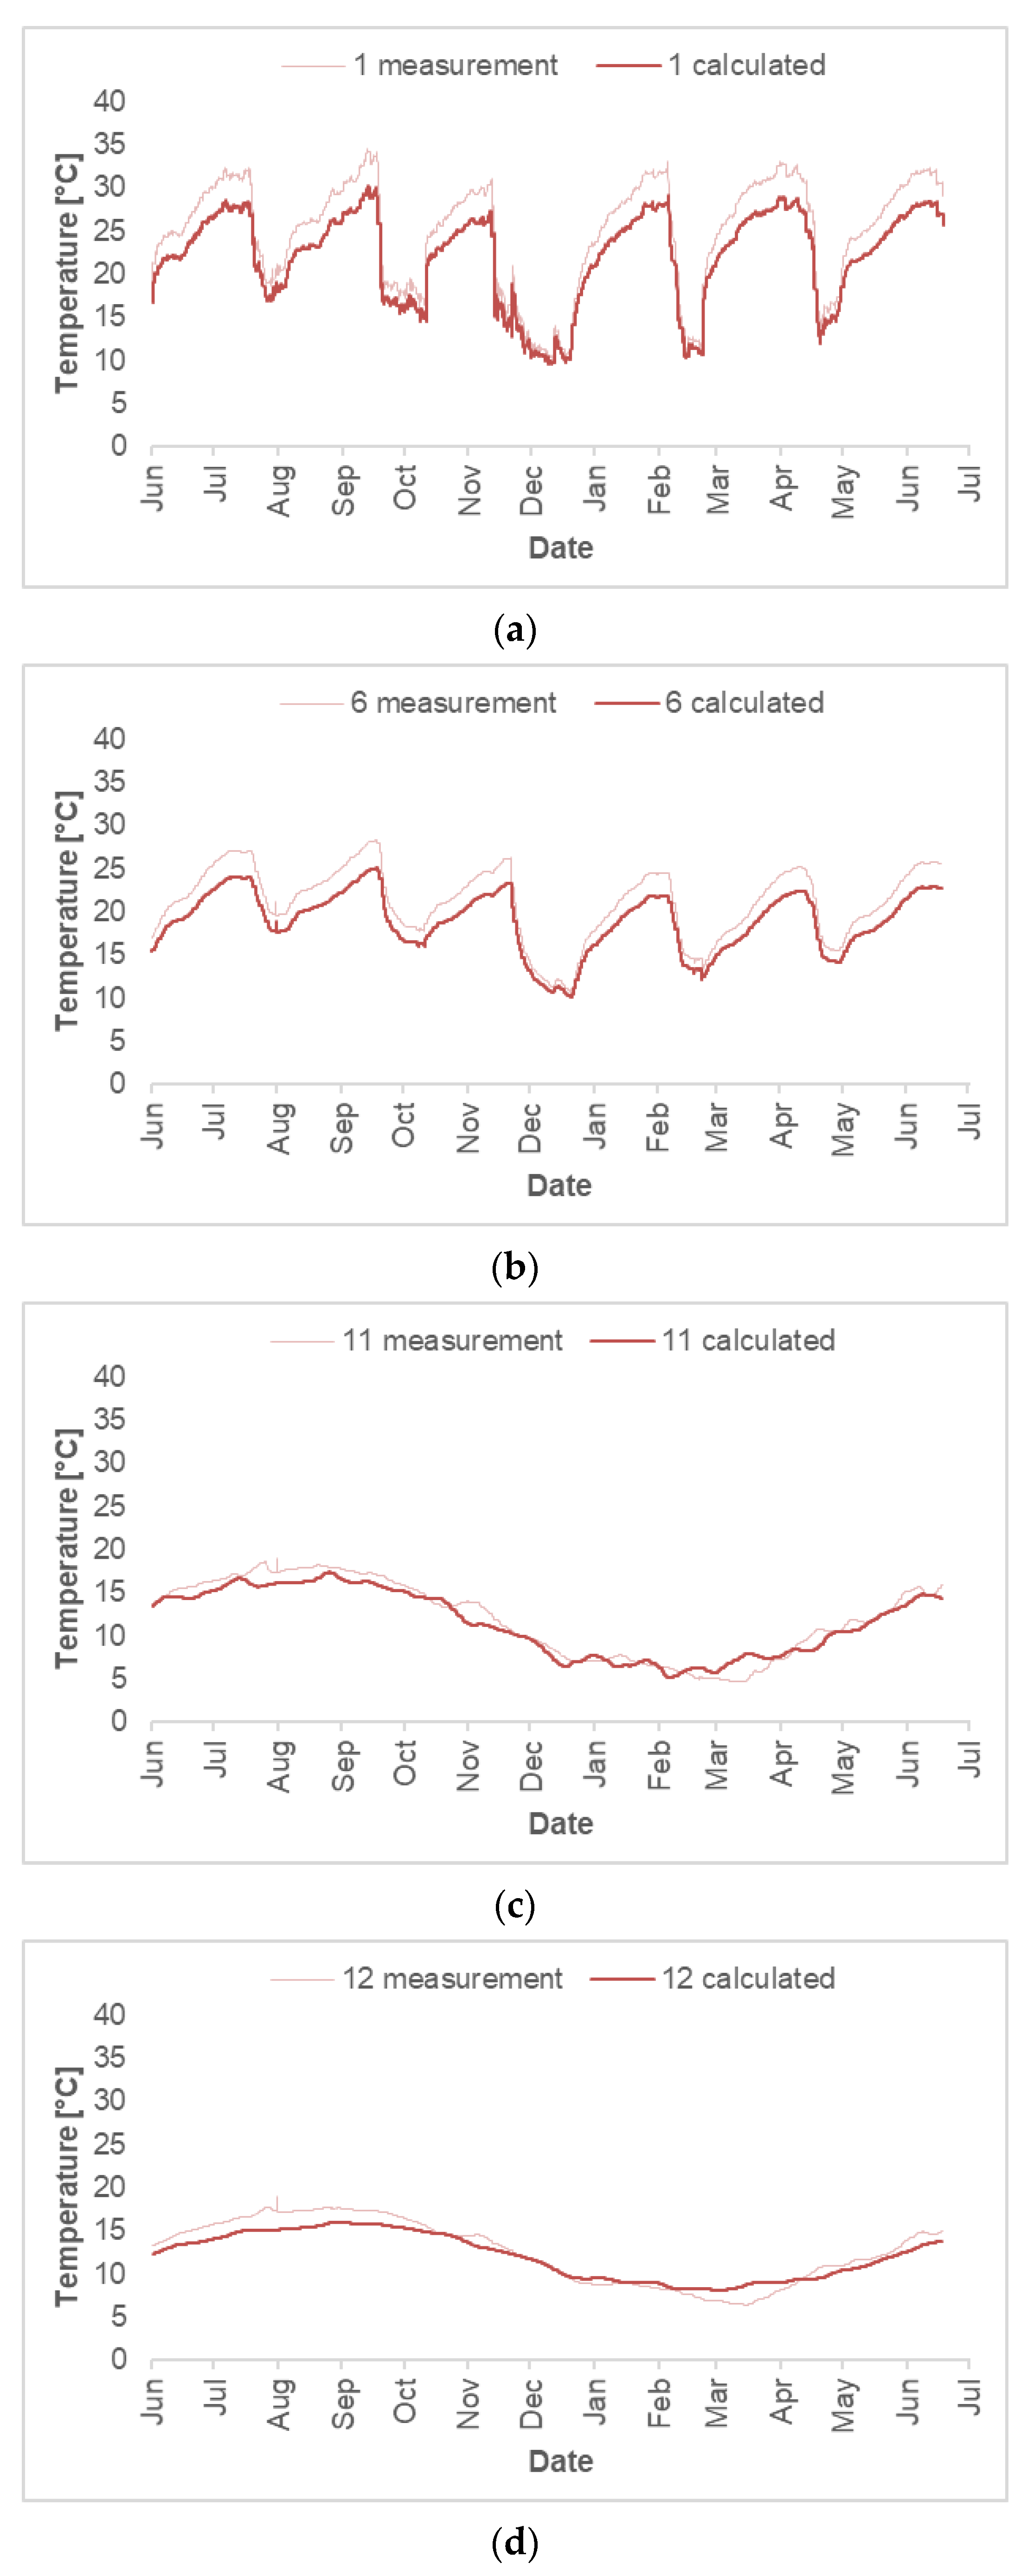
3.2. Validation
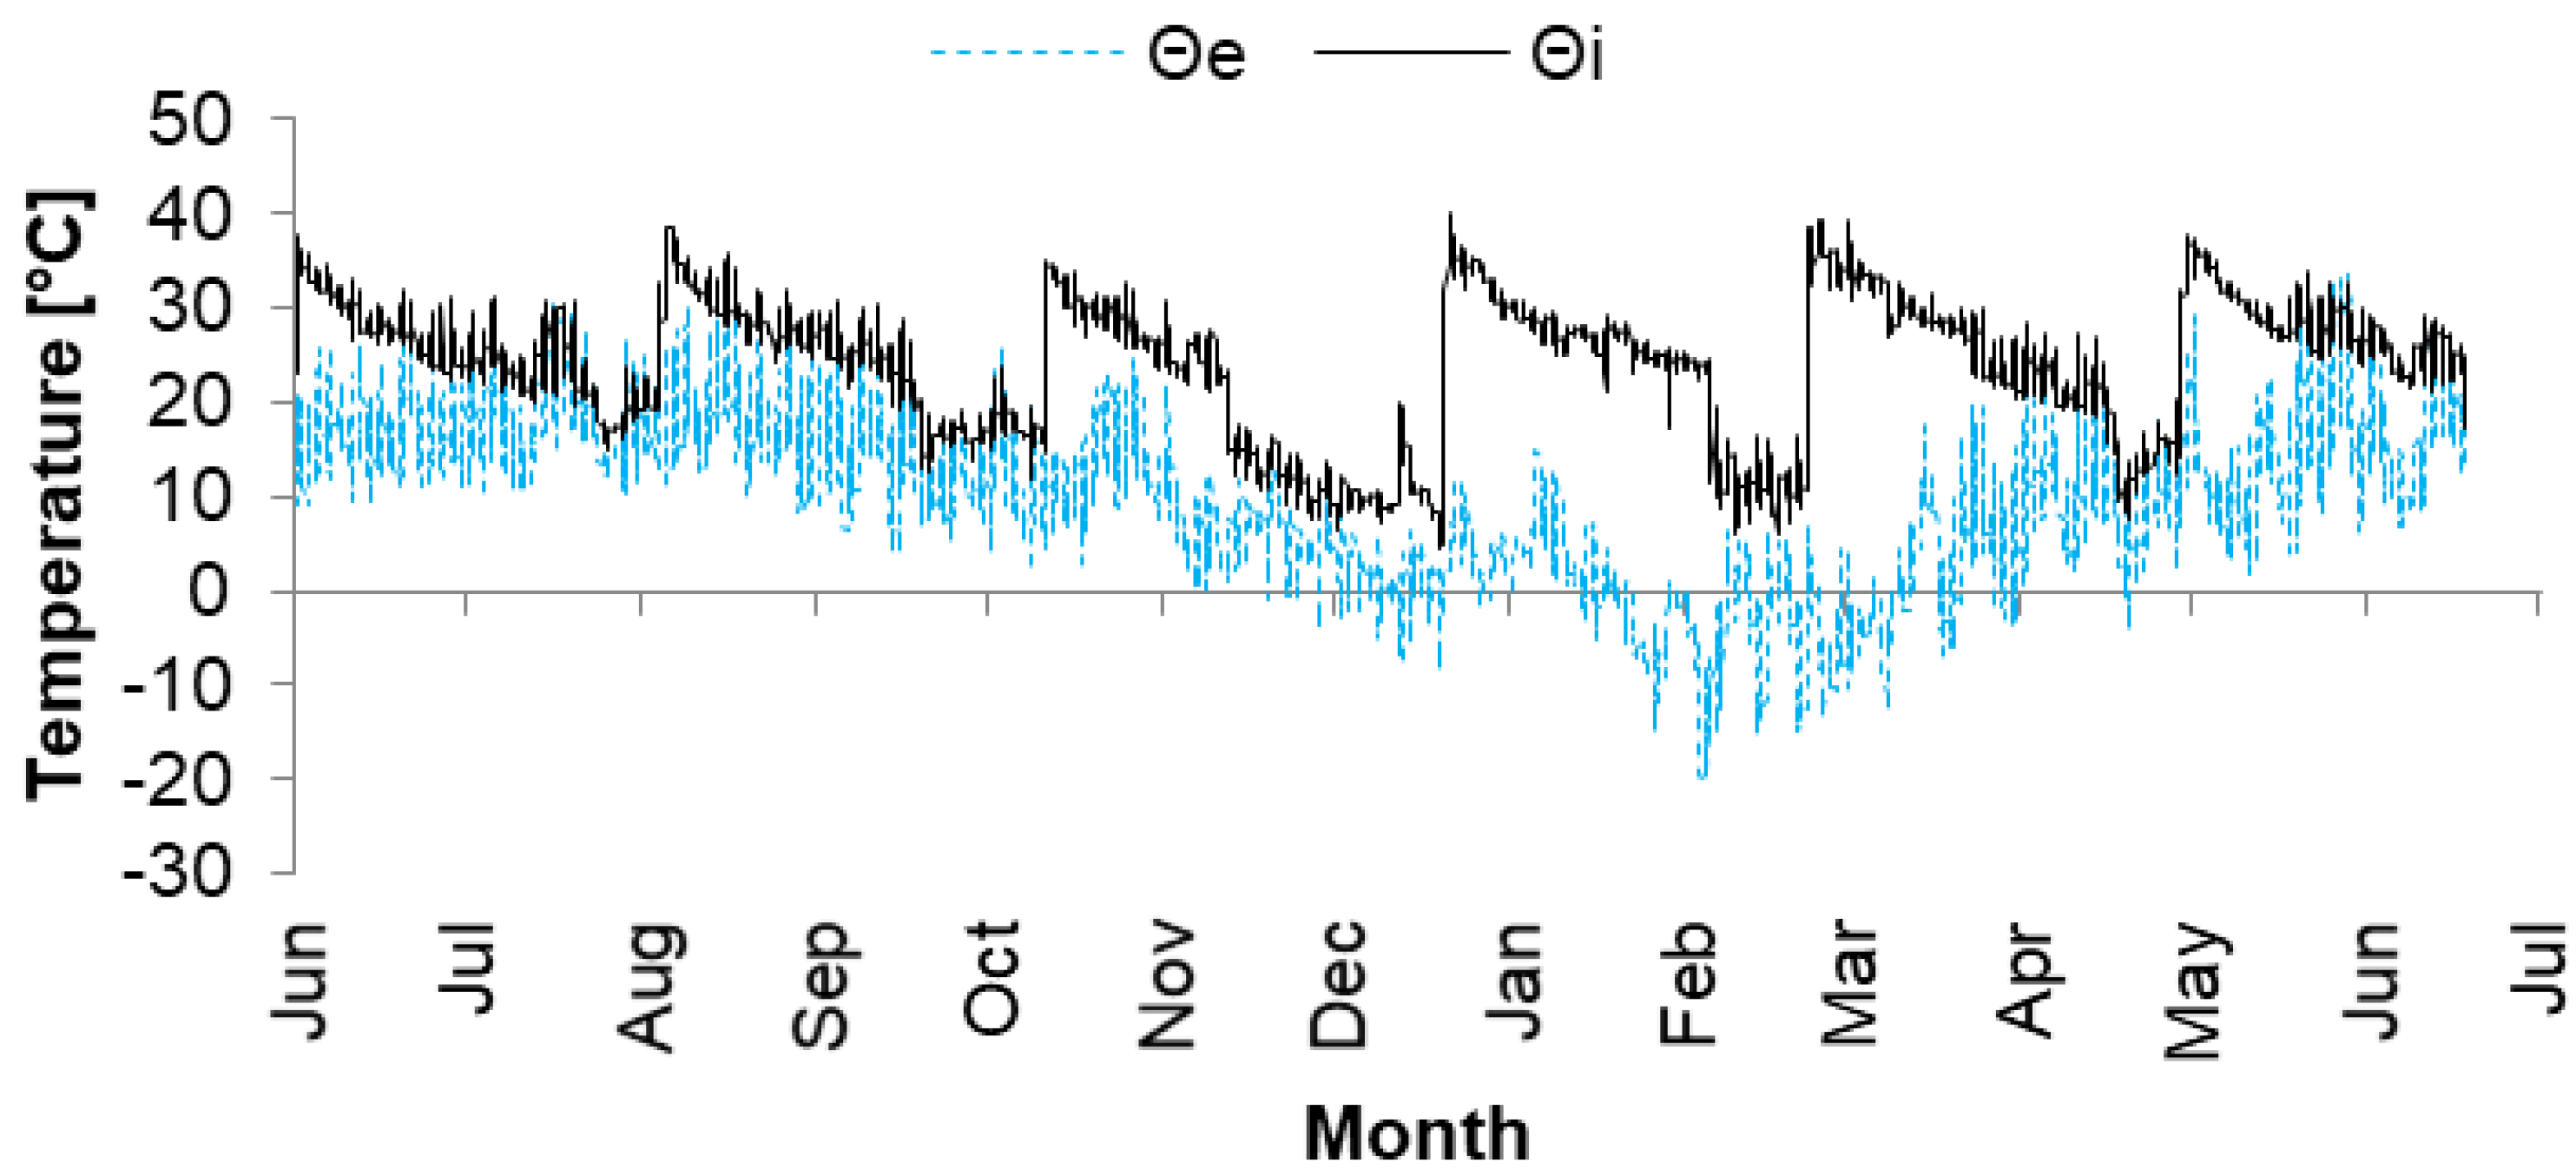
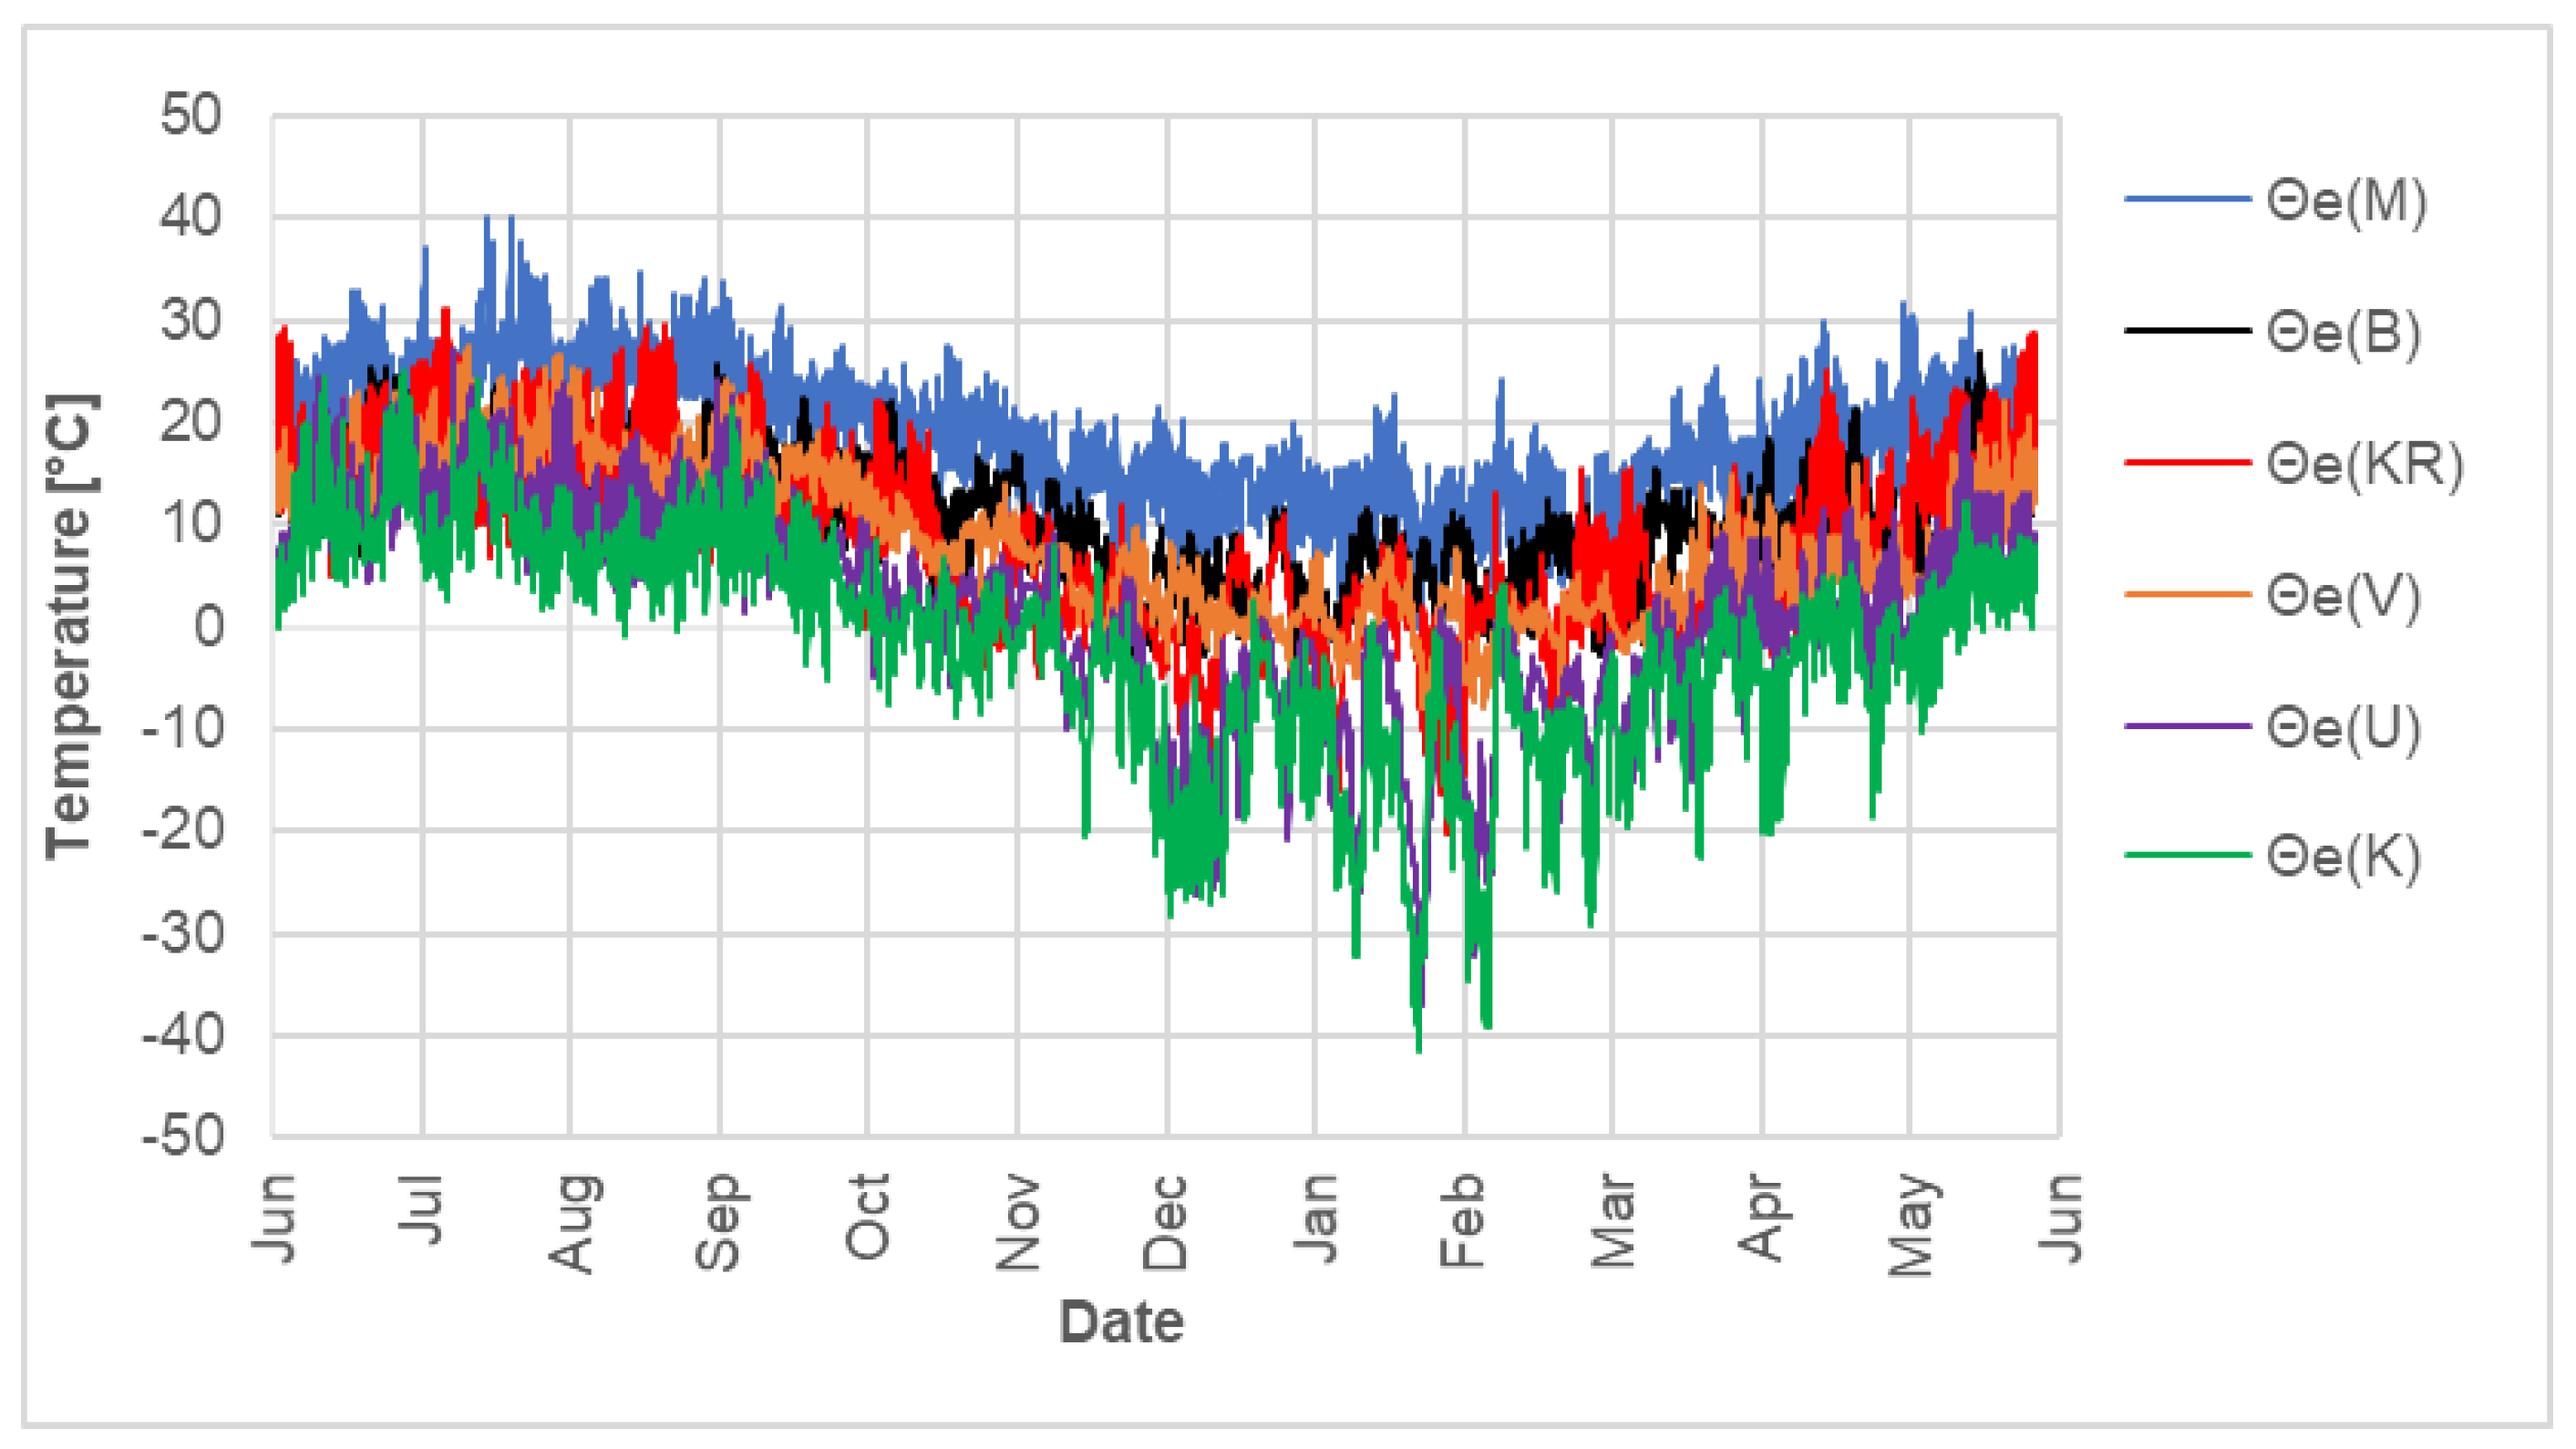
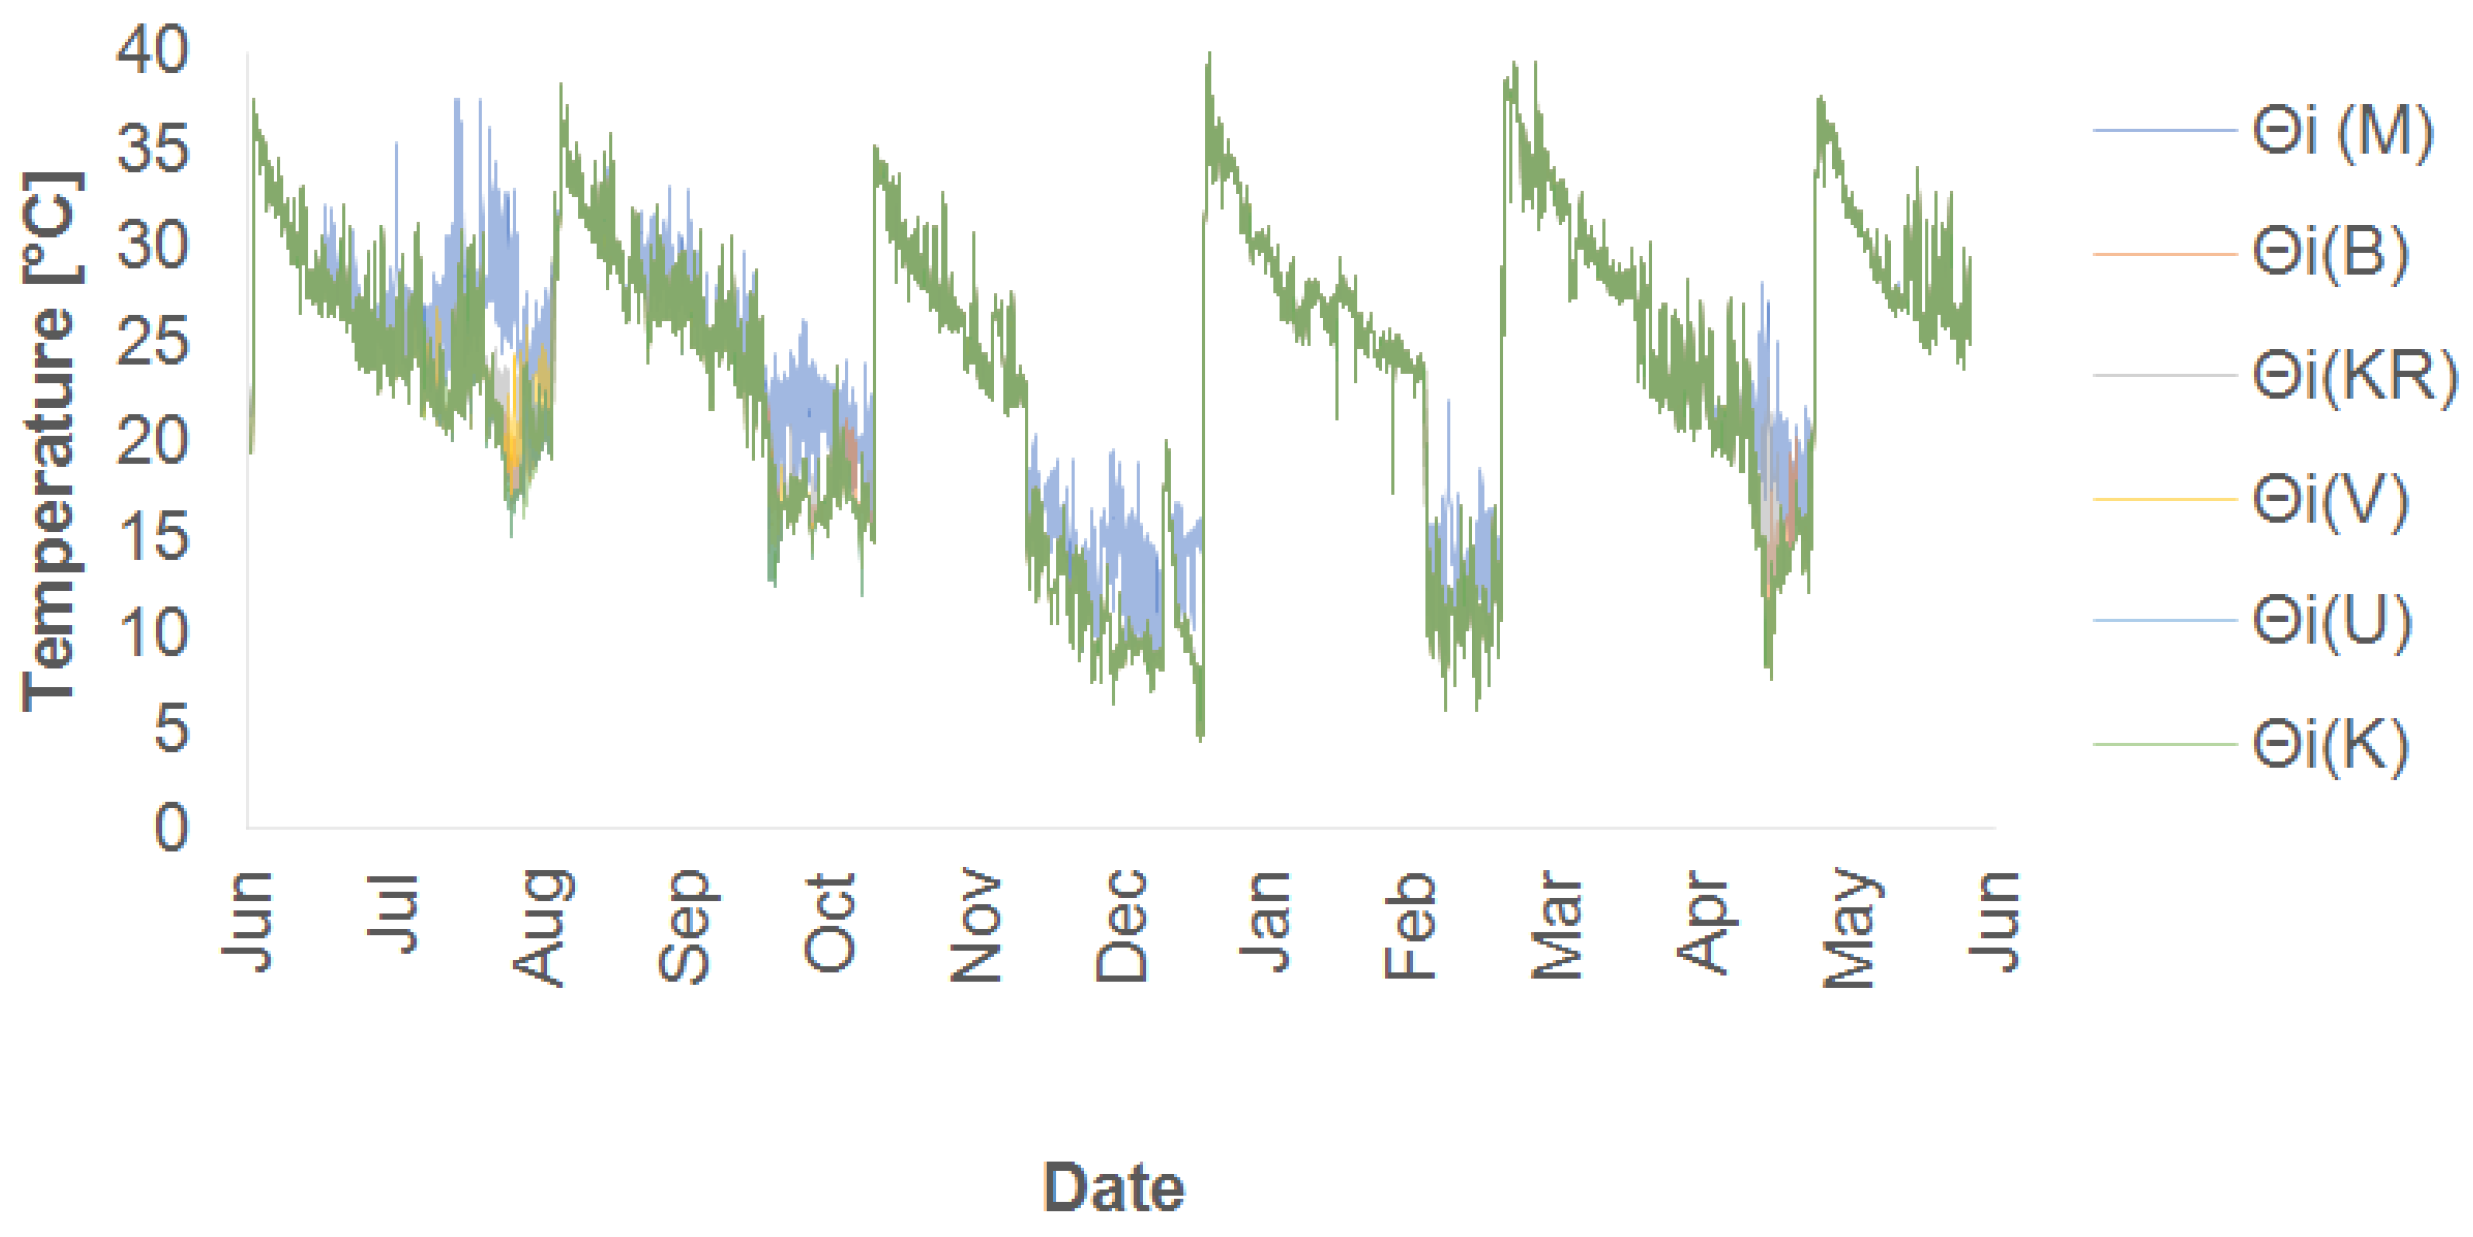
3.3. Simulation of External and Internal Microclimate
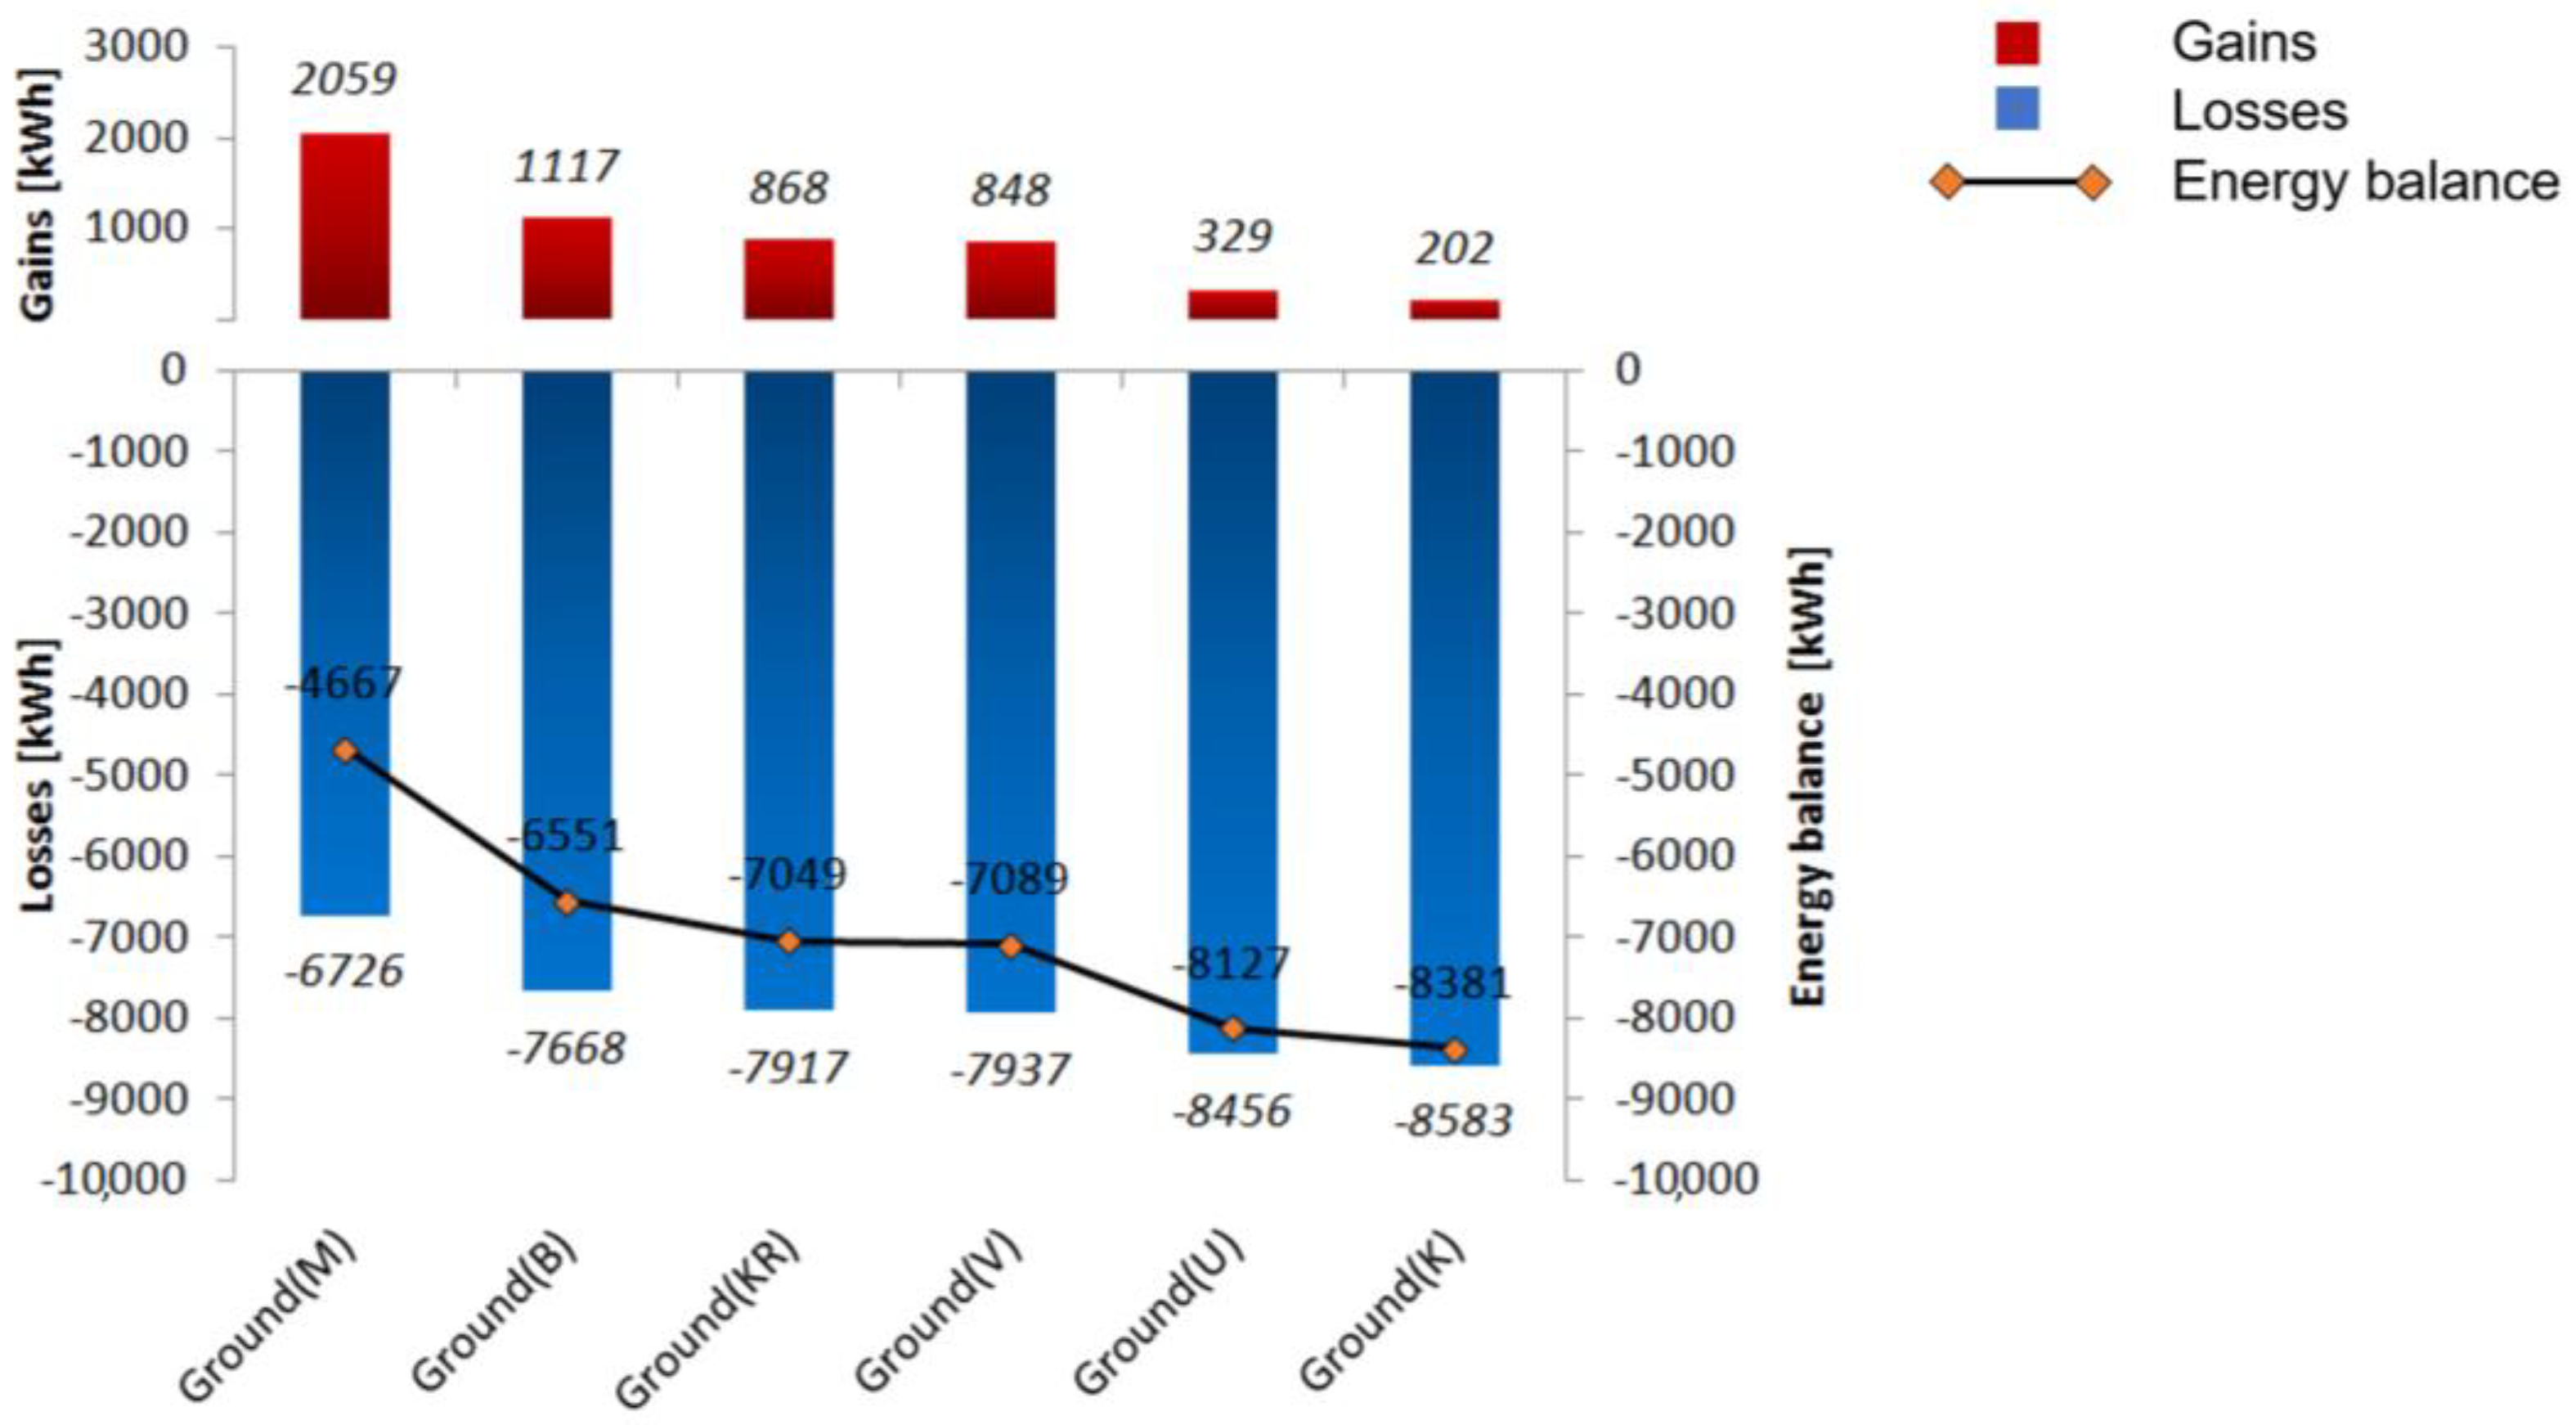
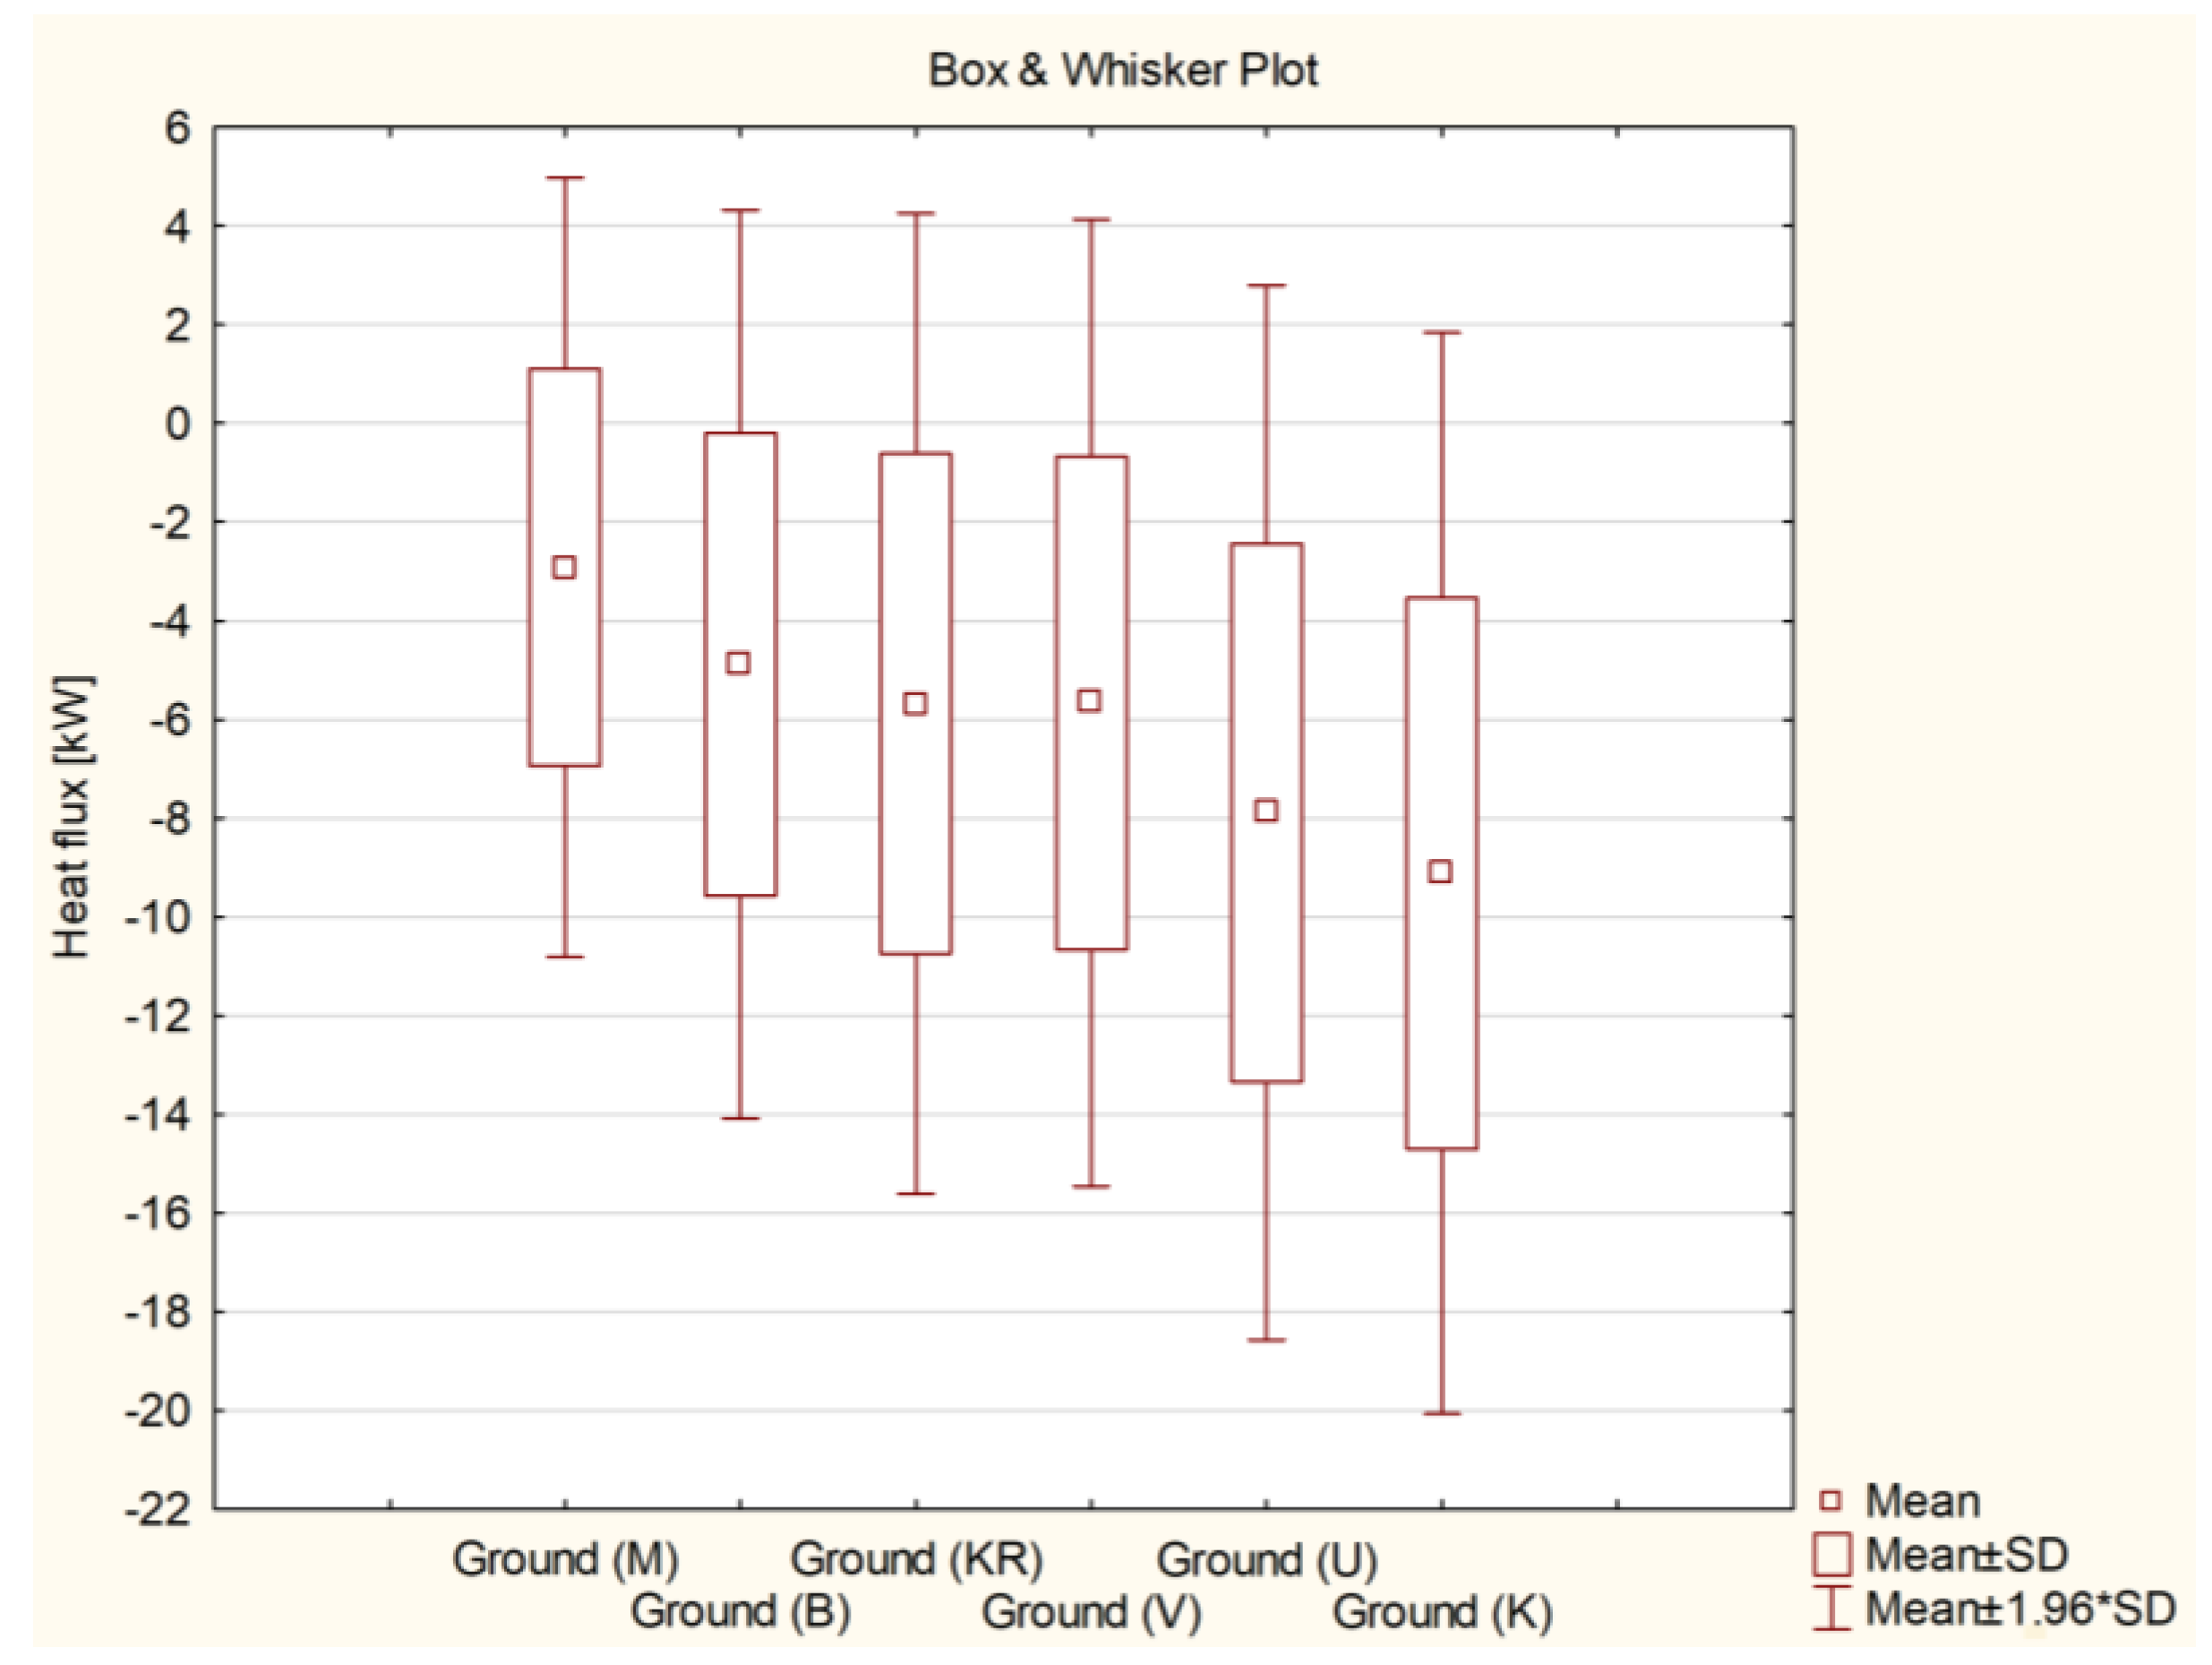
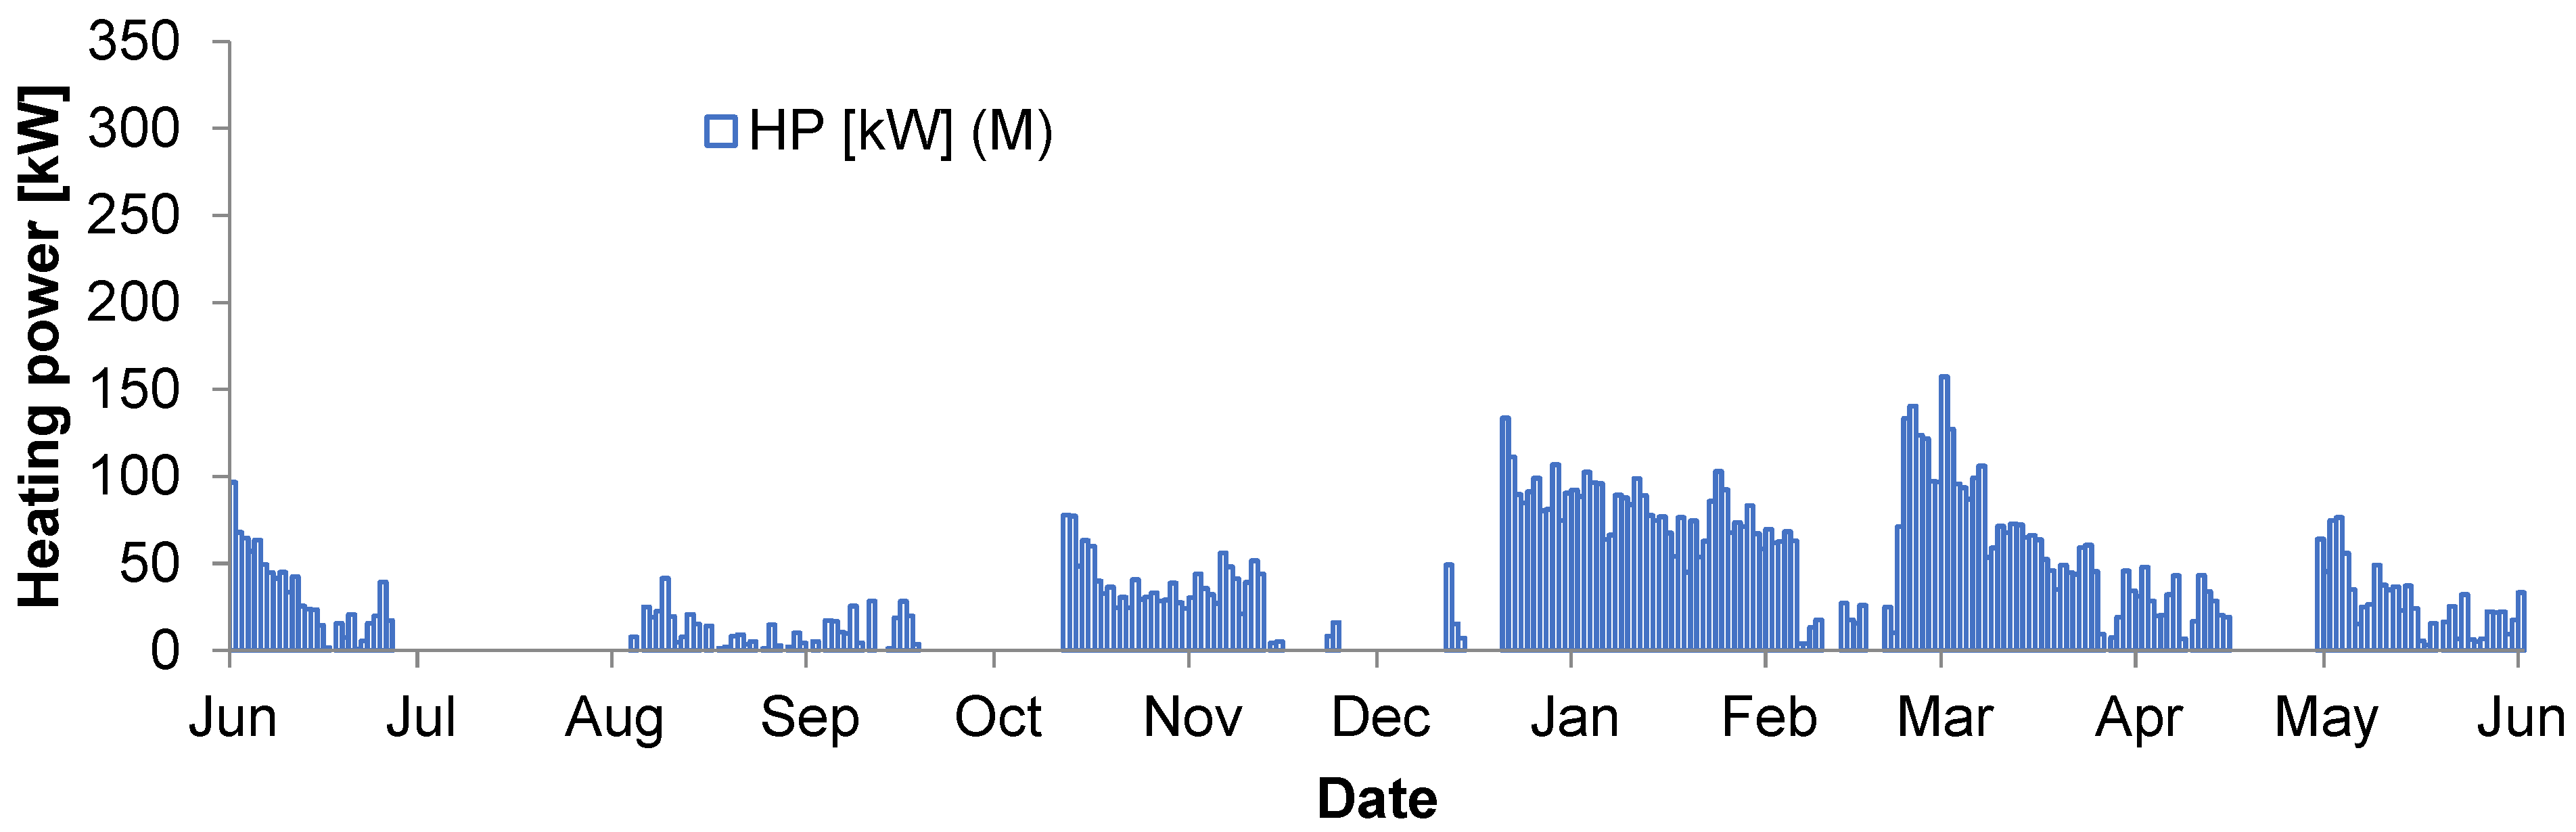
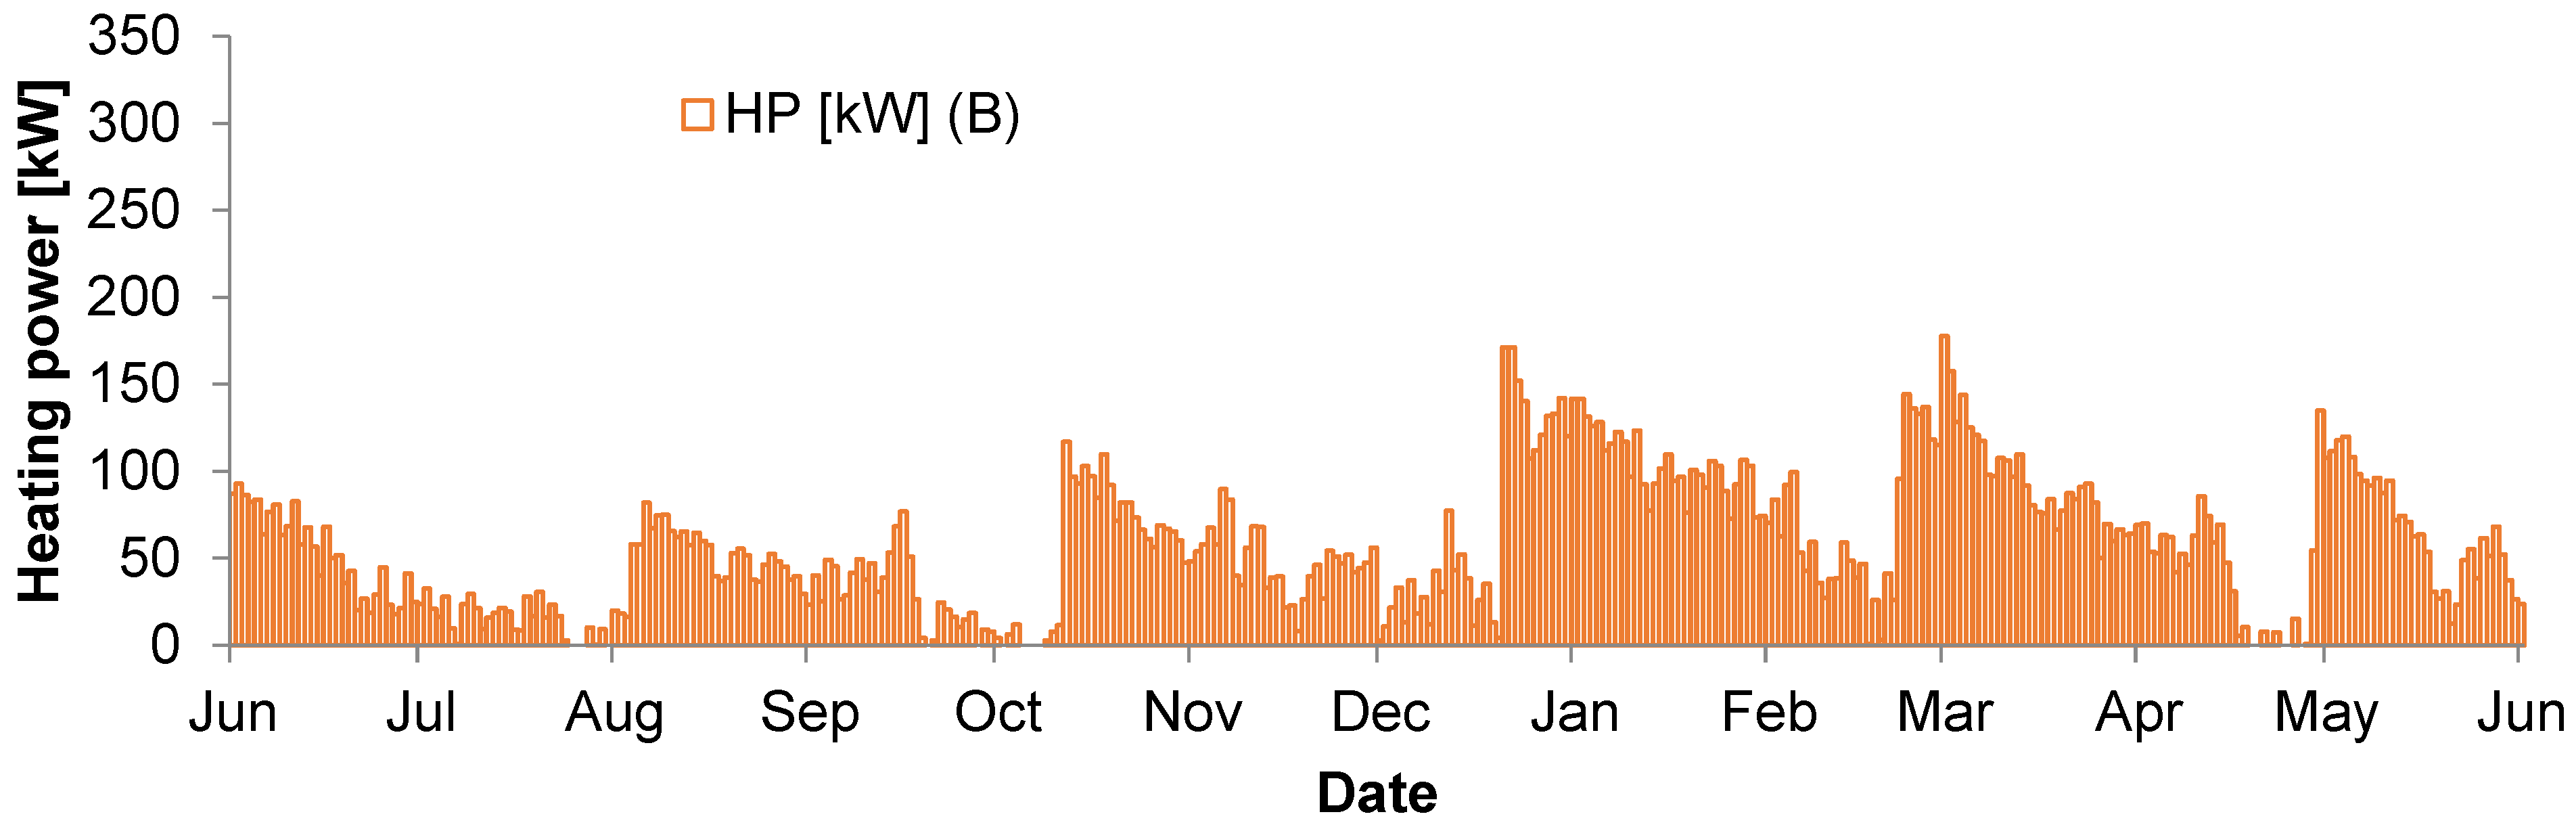
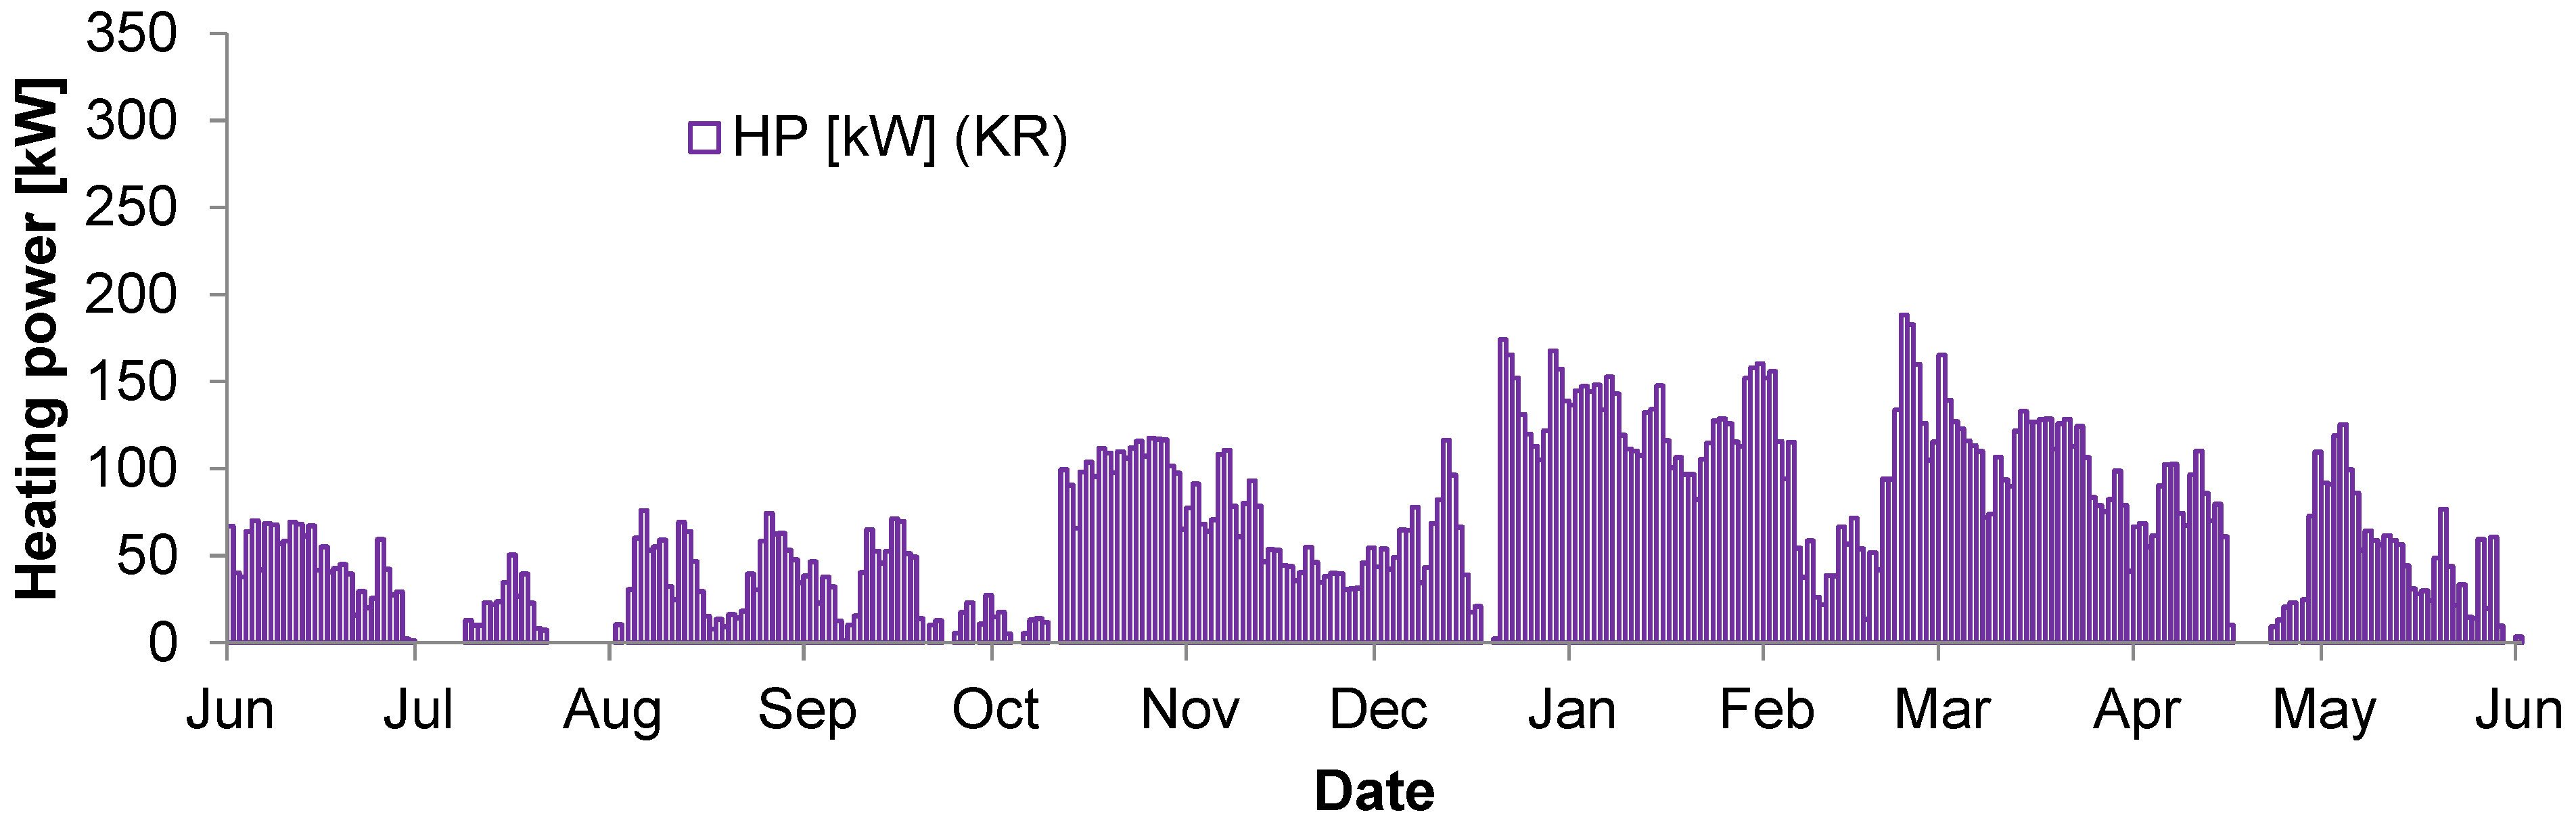
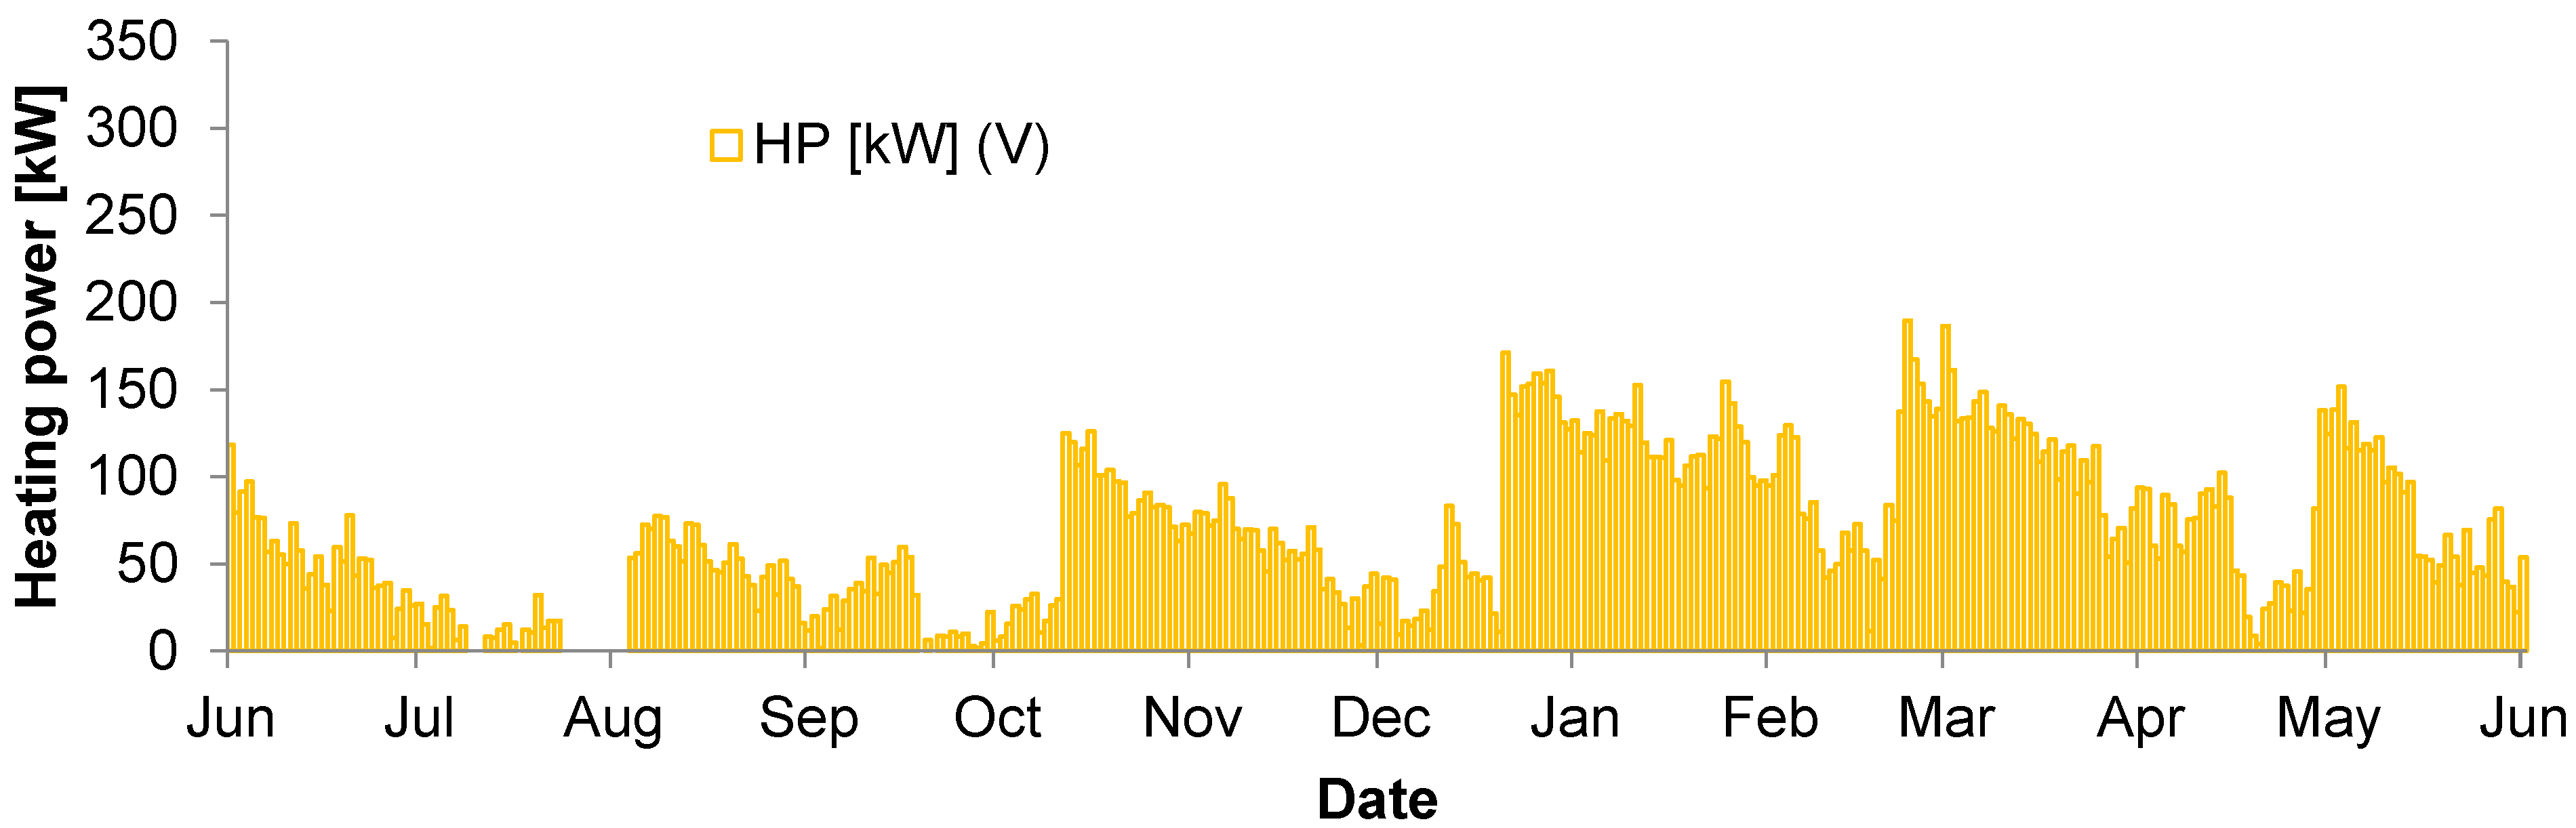
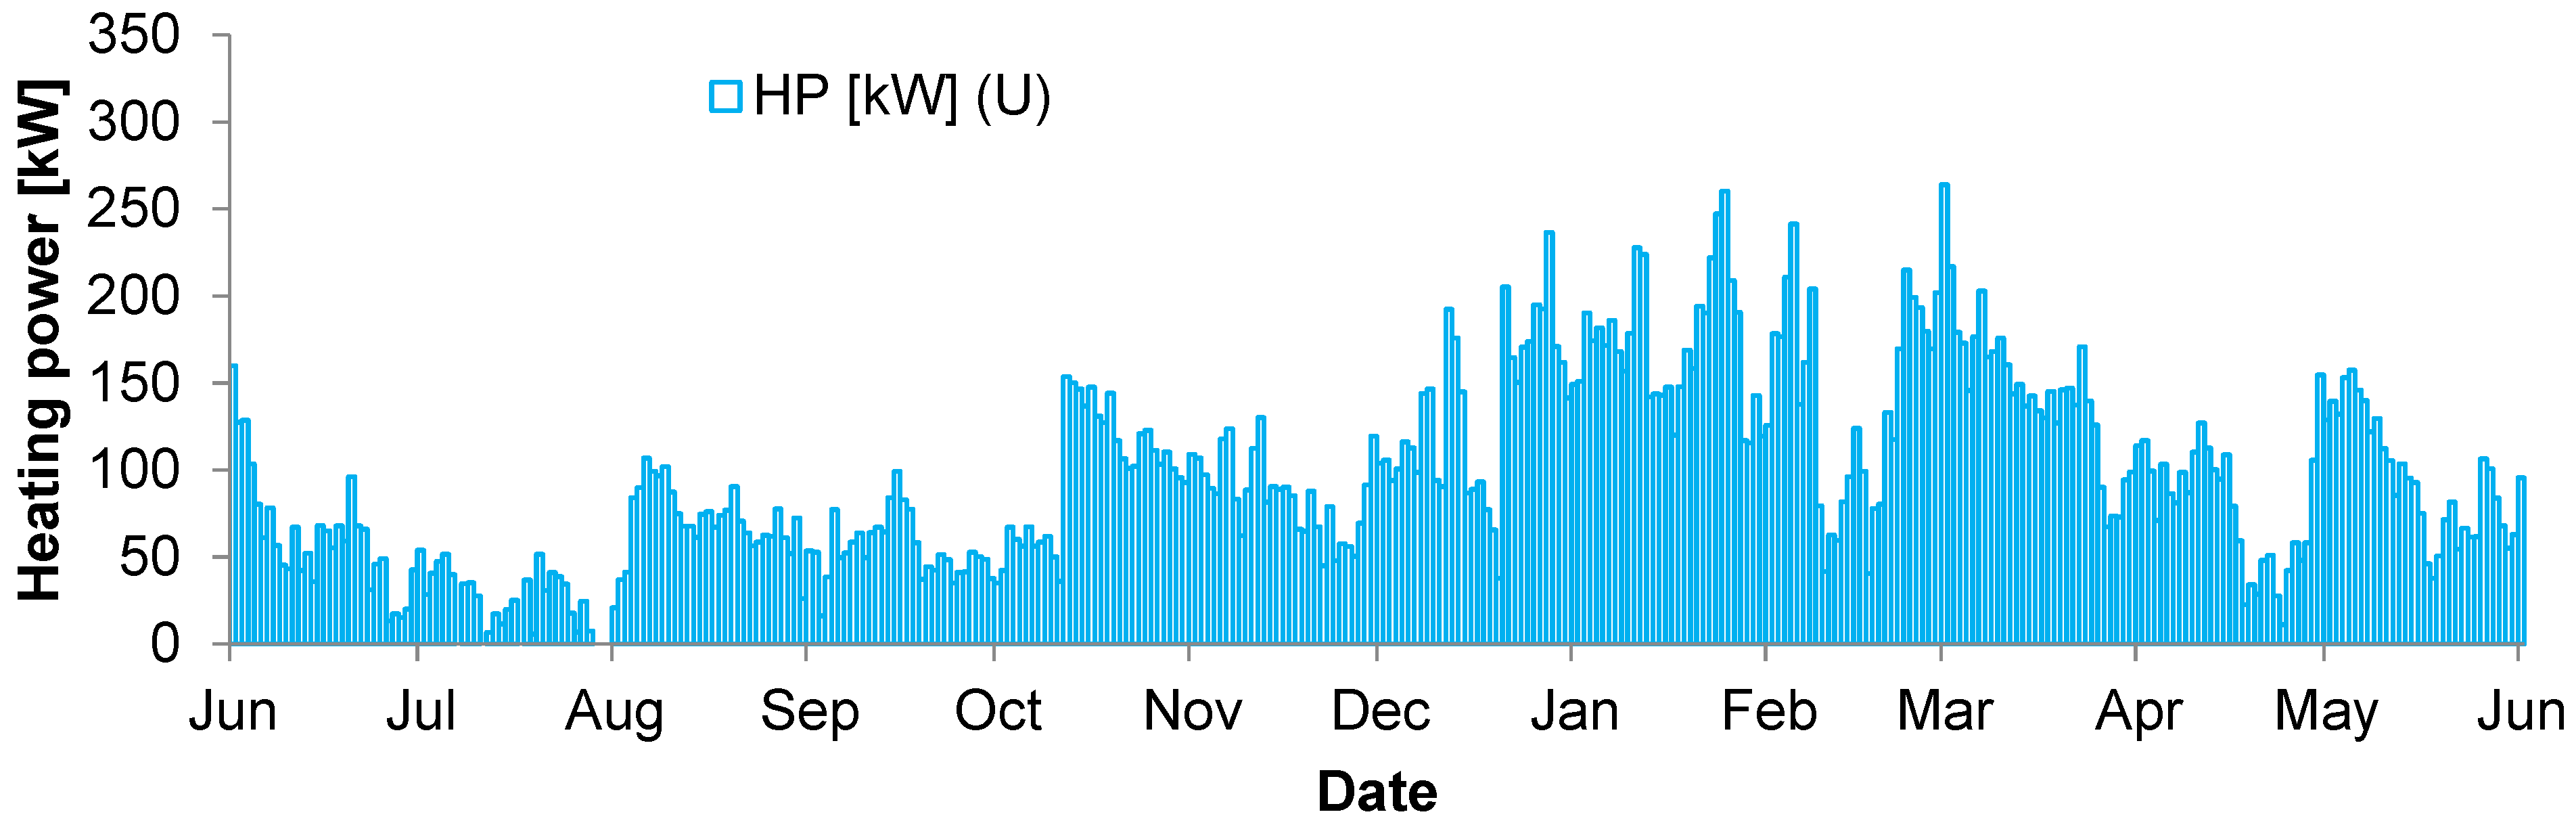
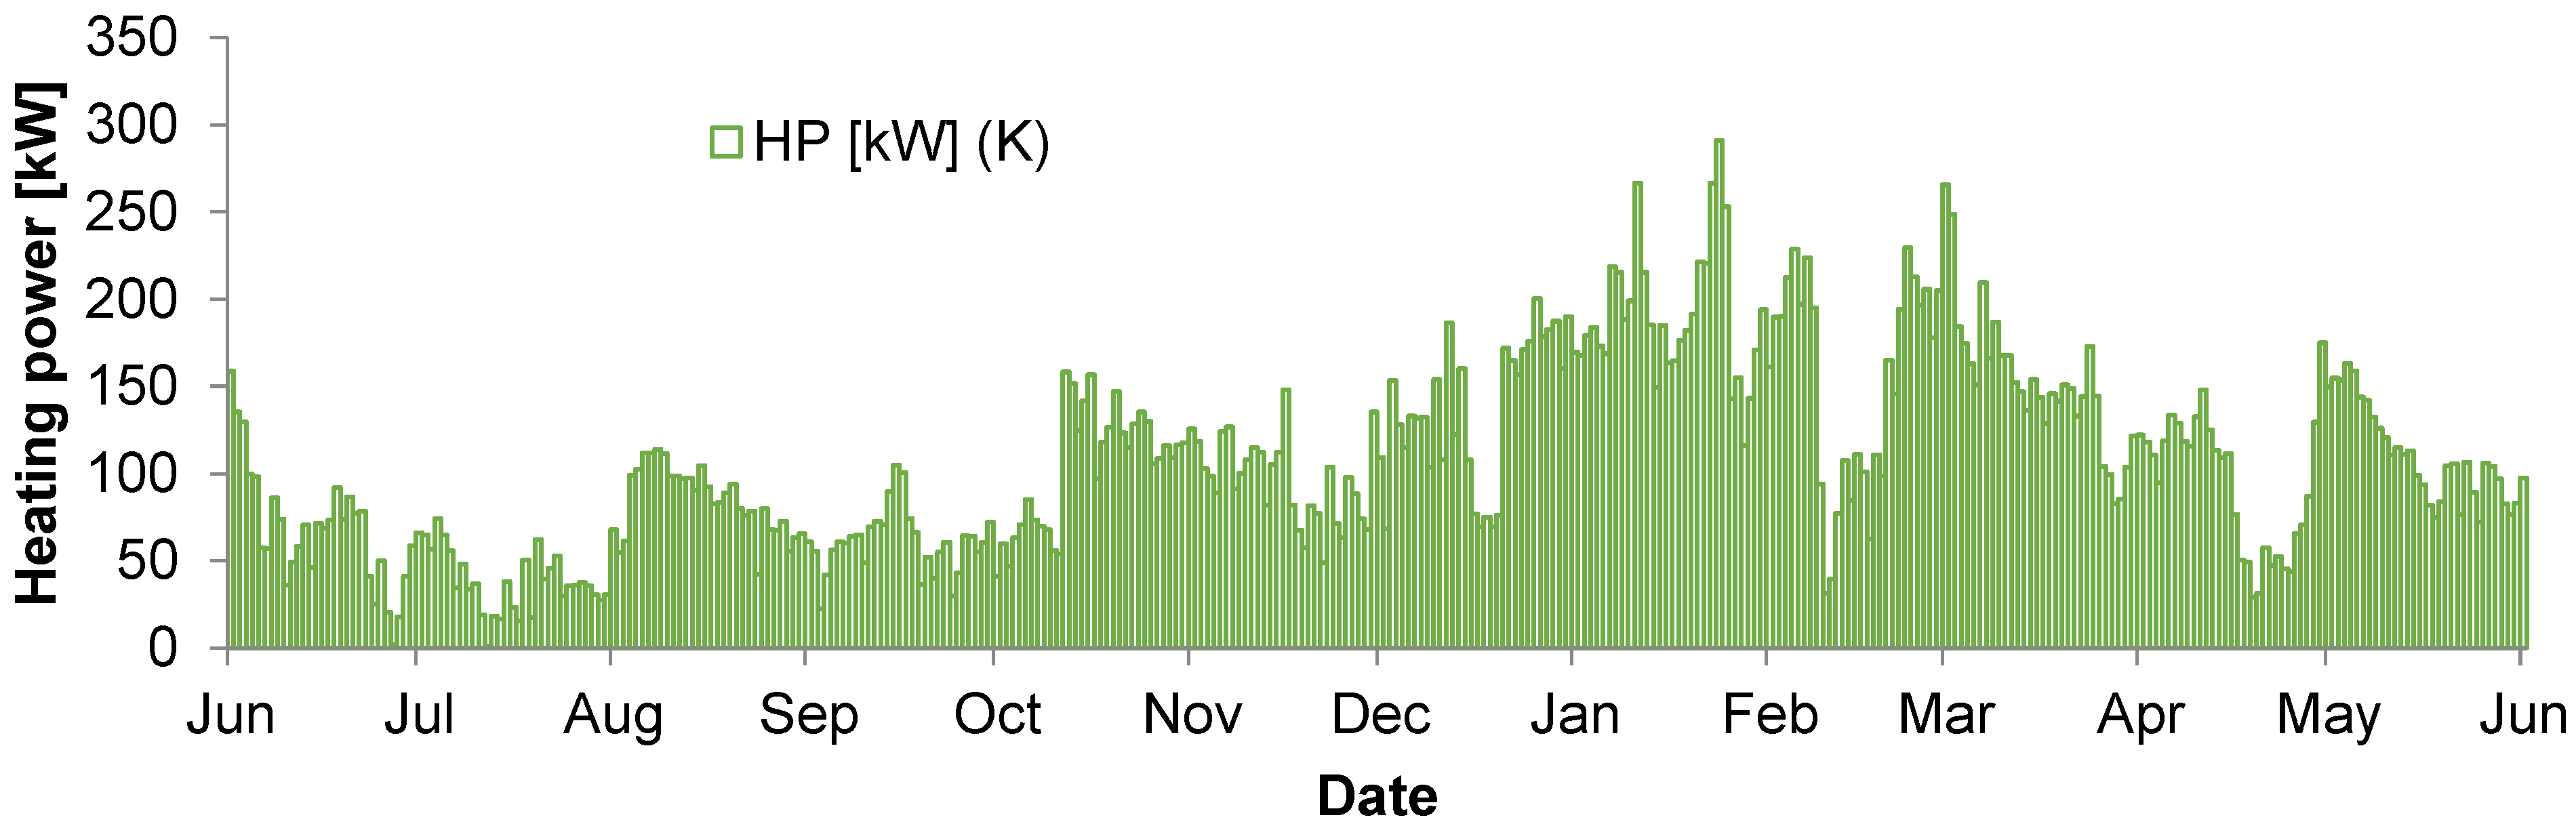
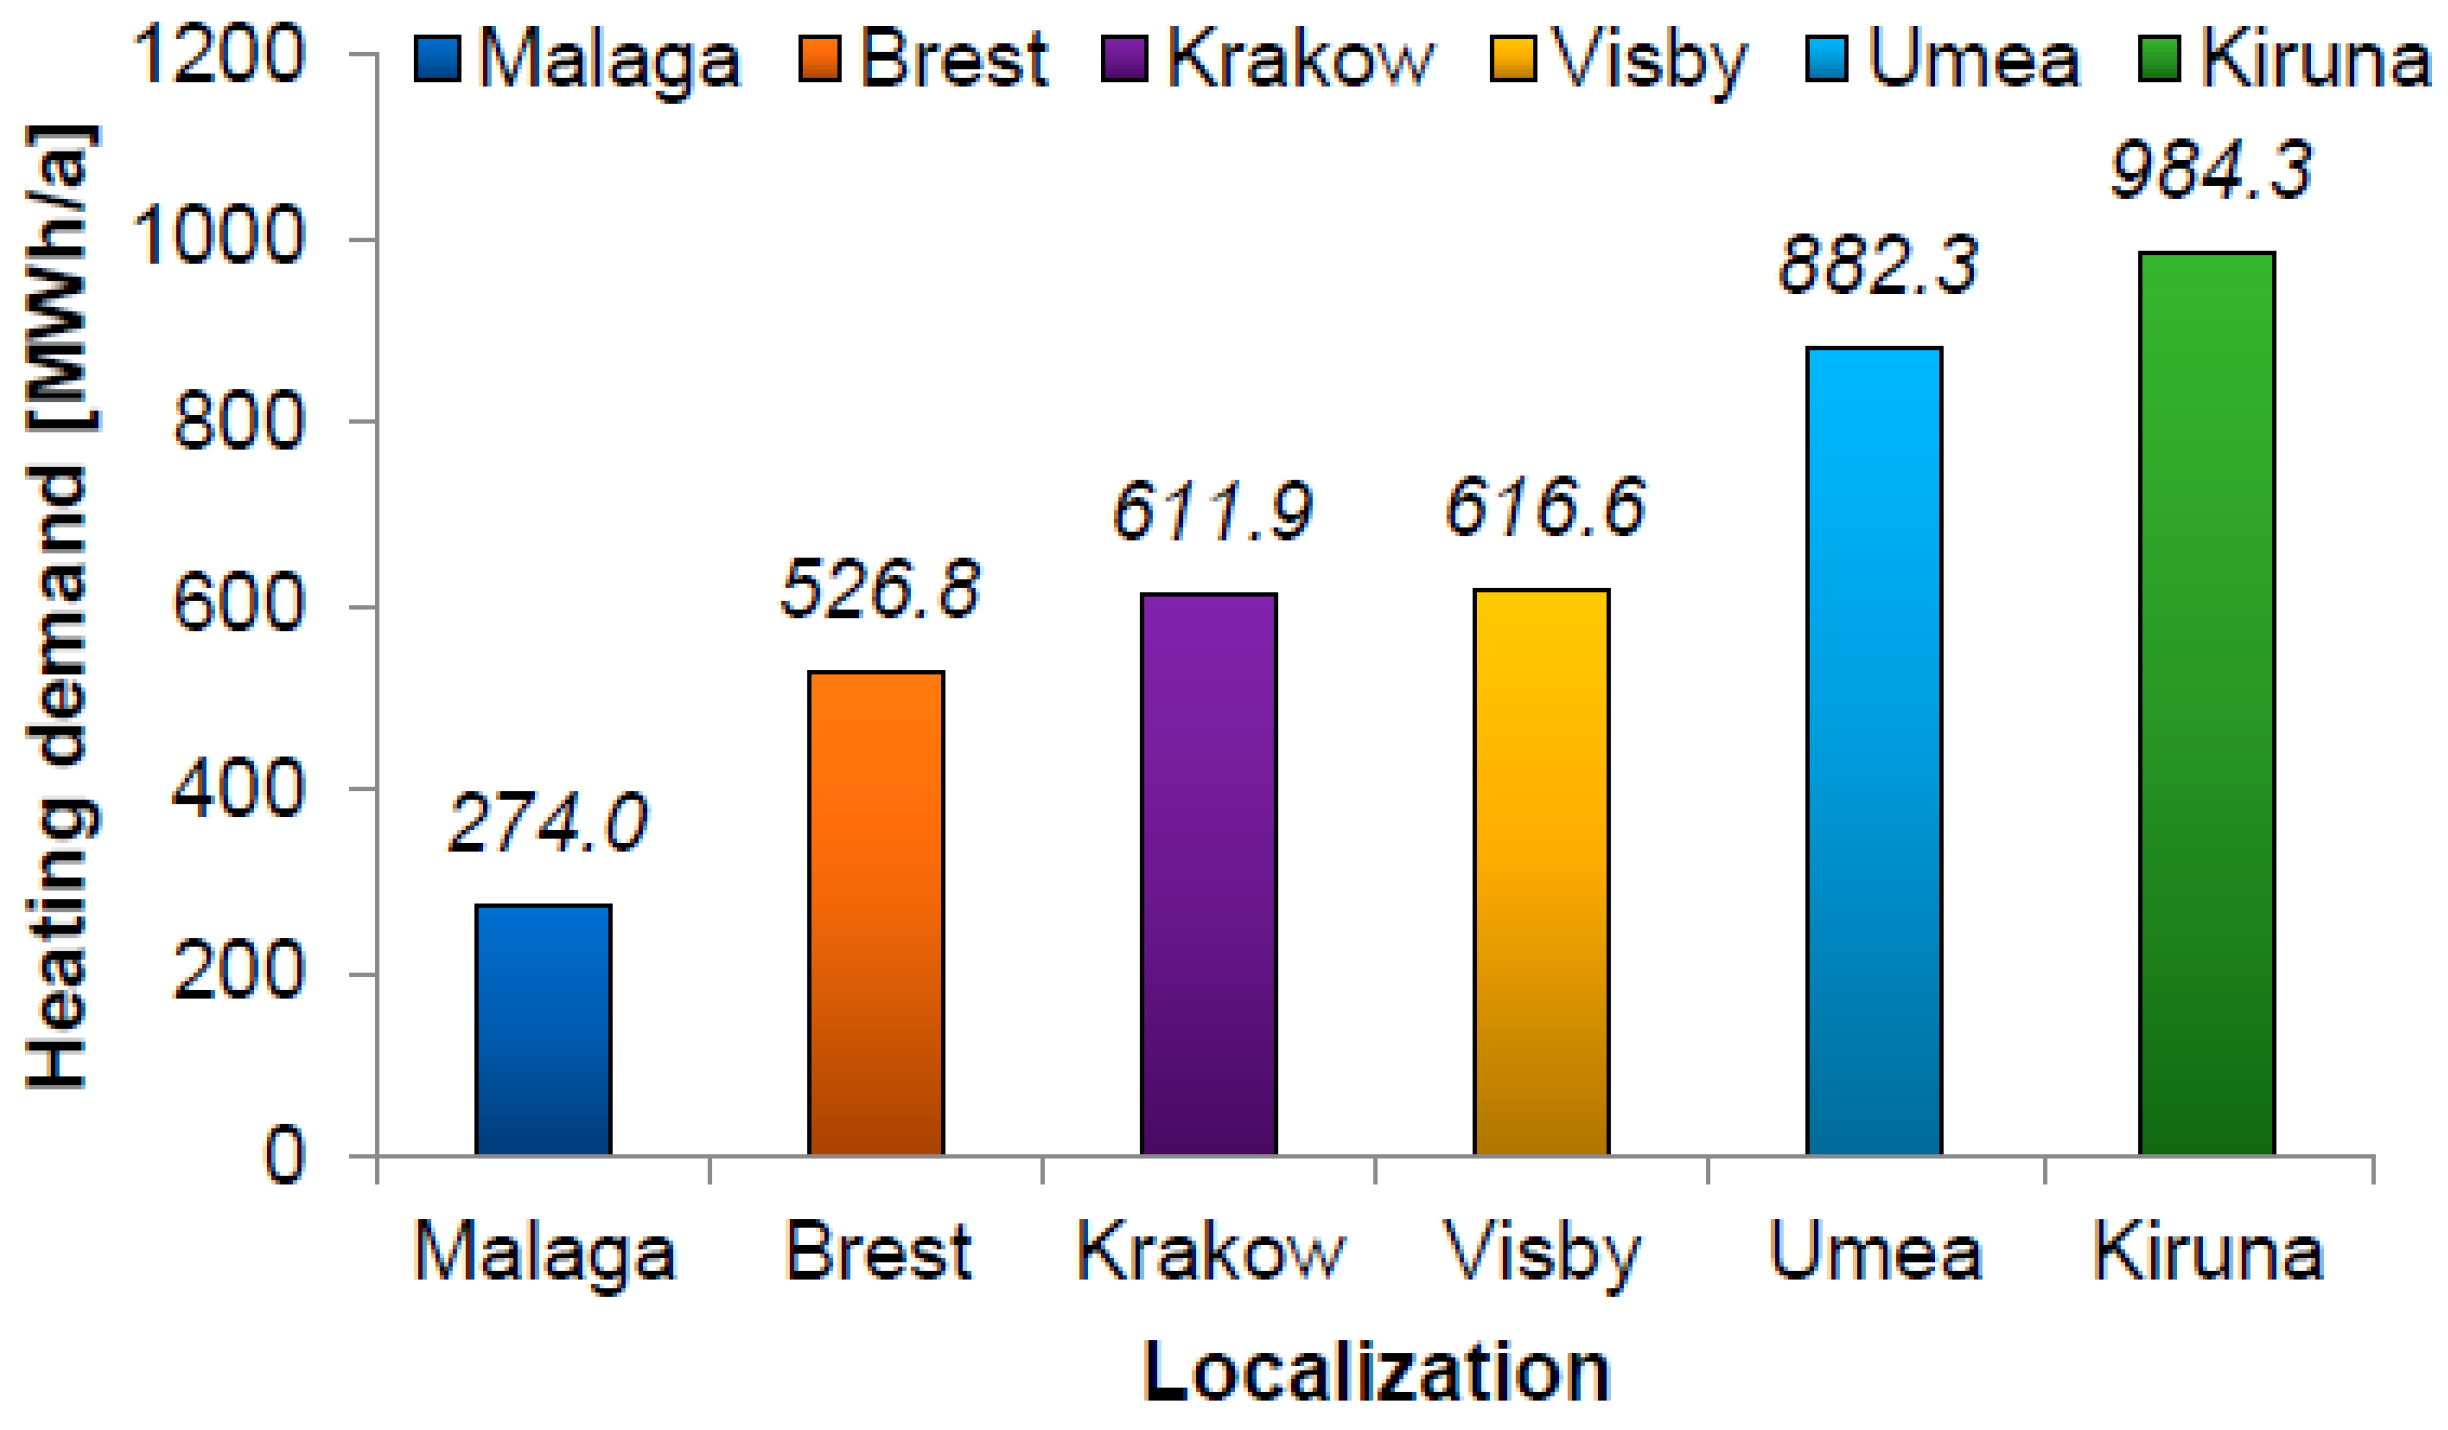
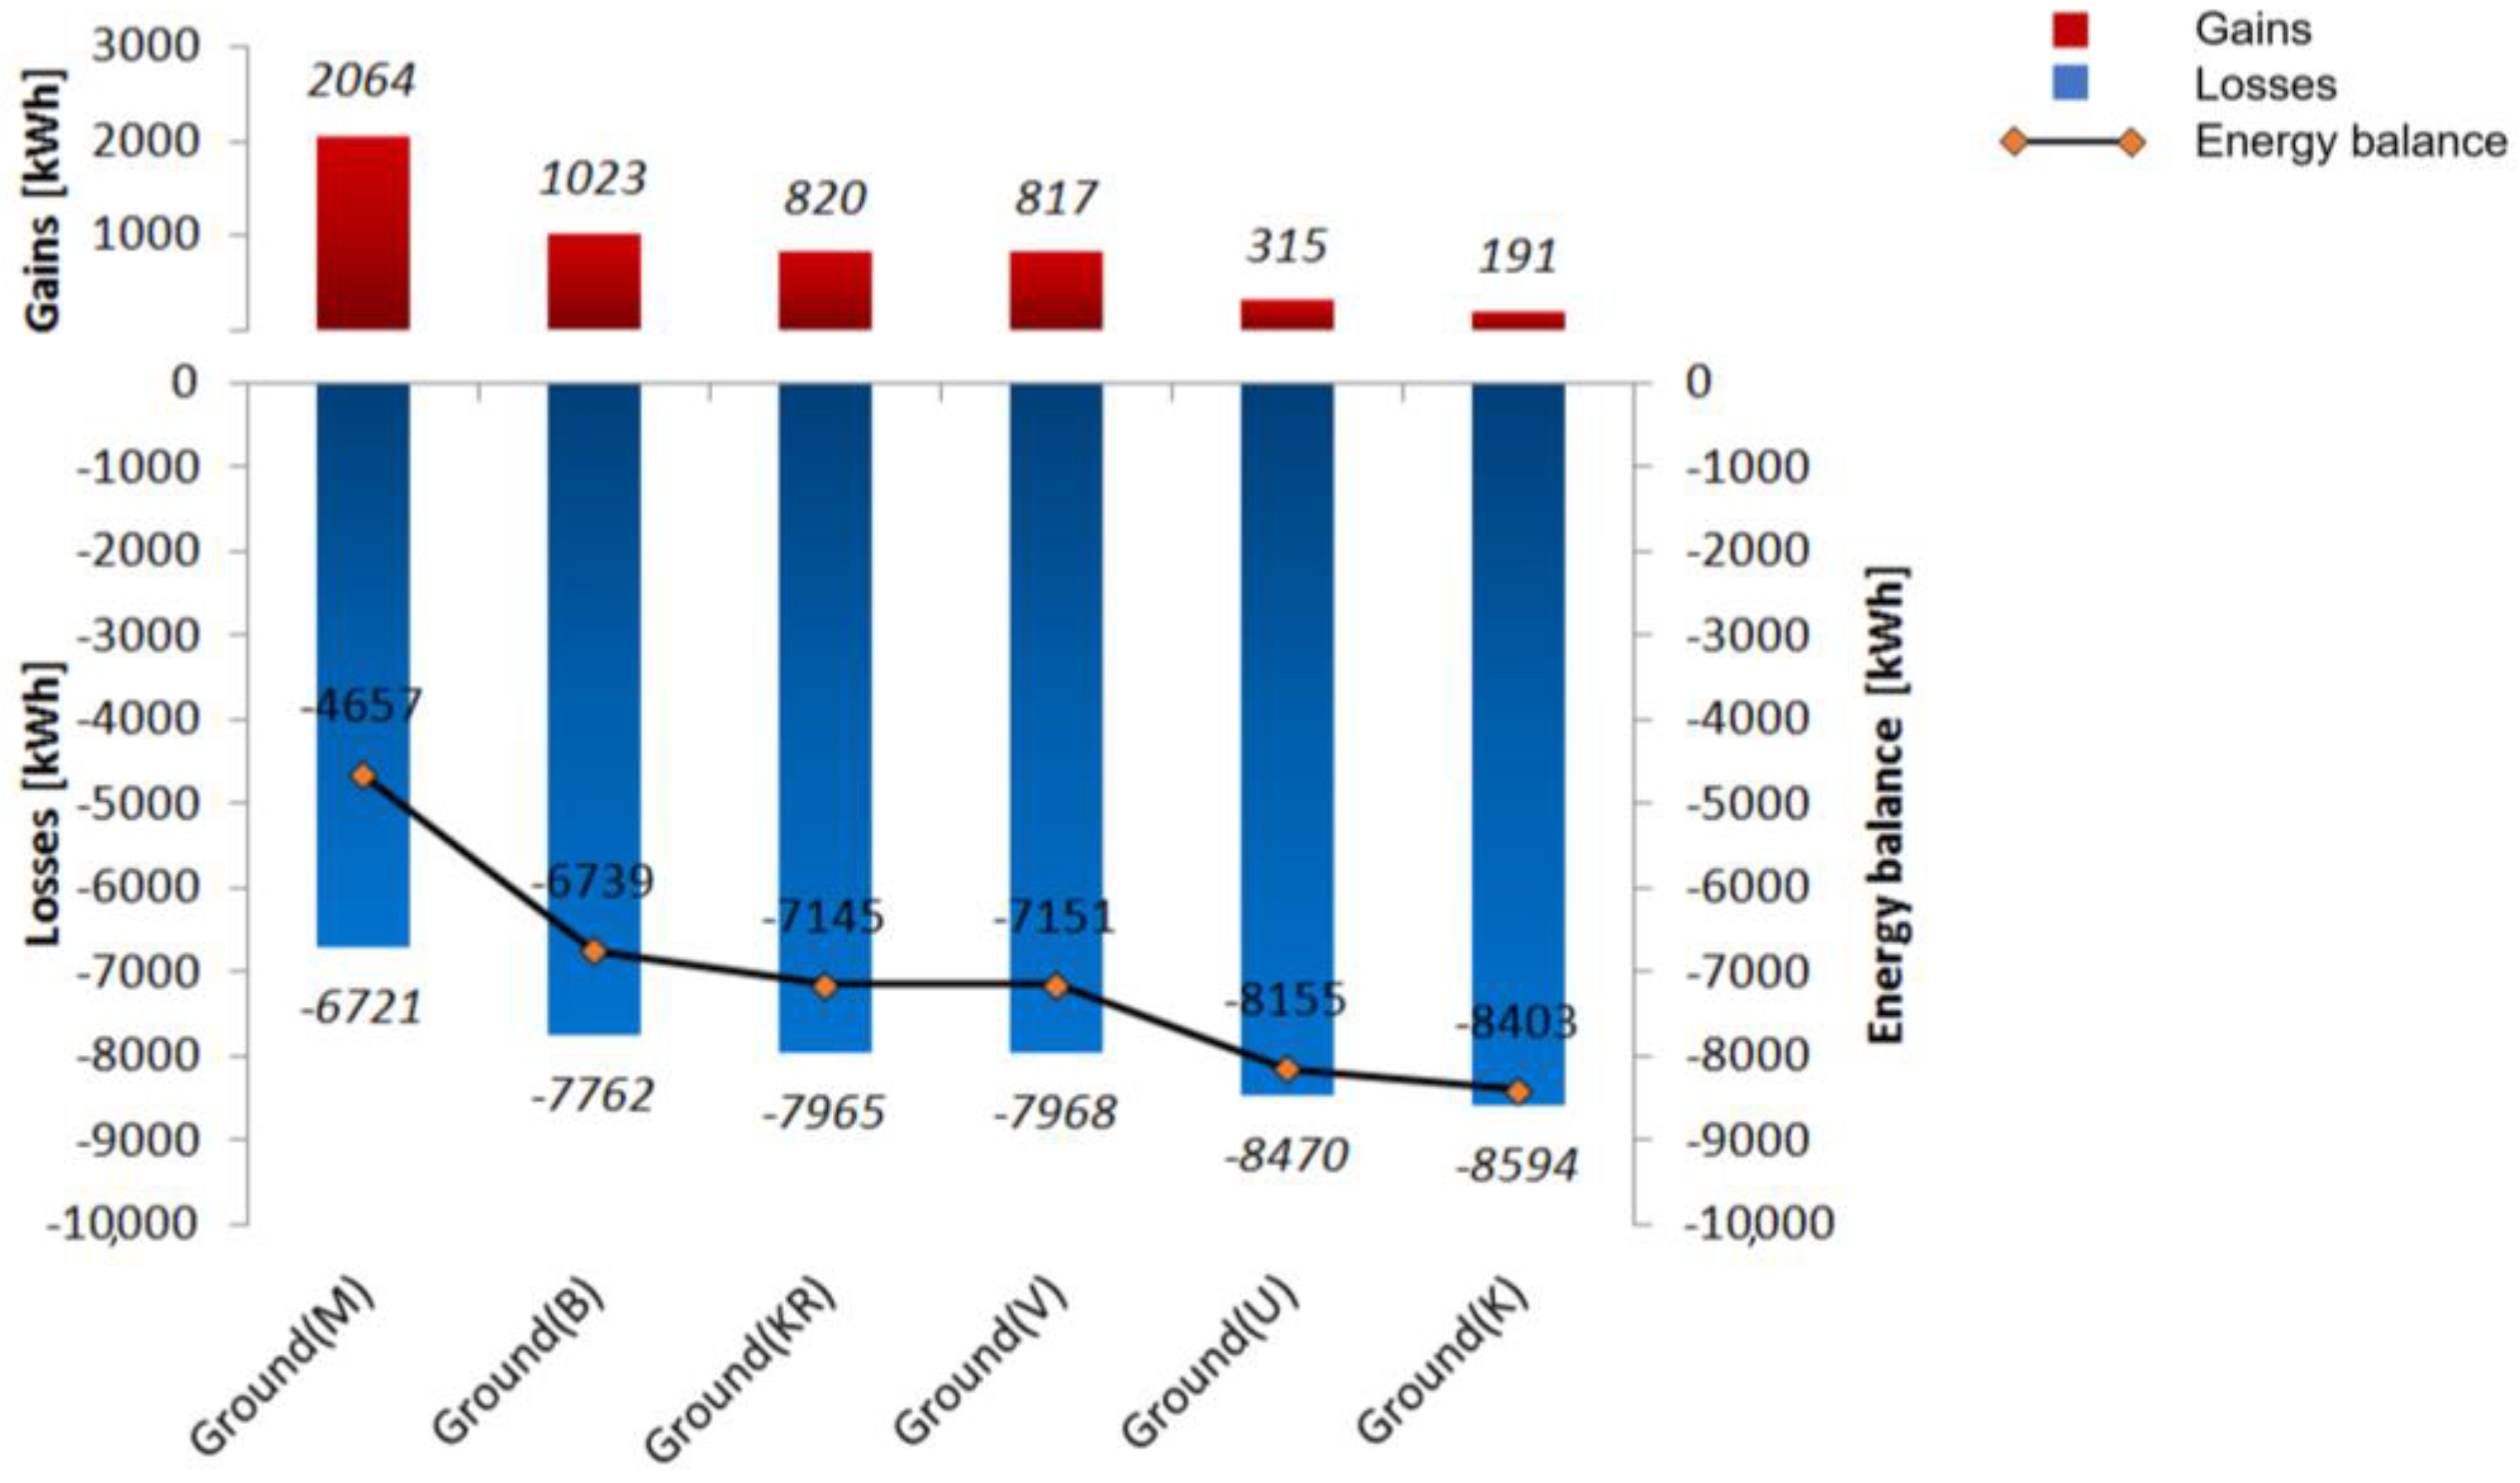
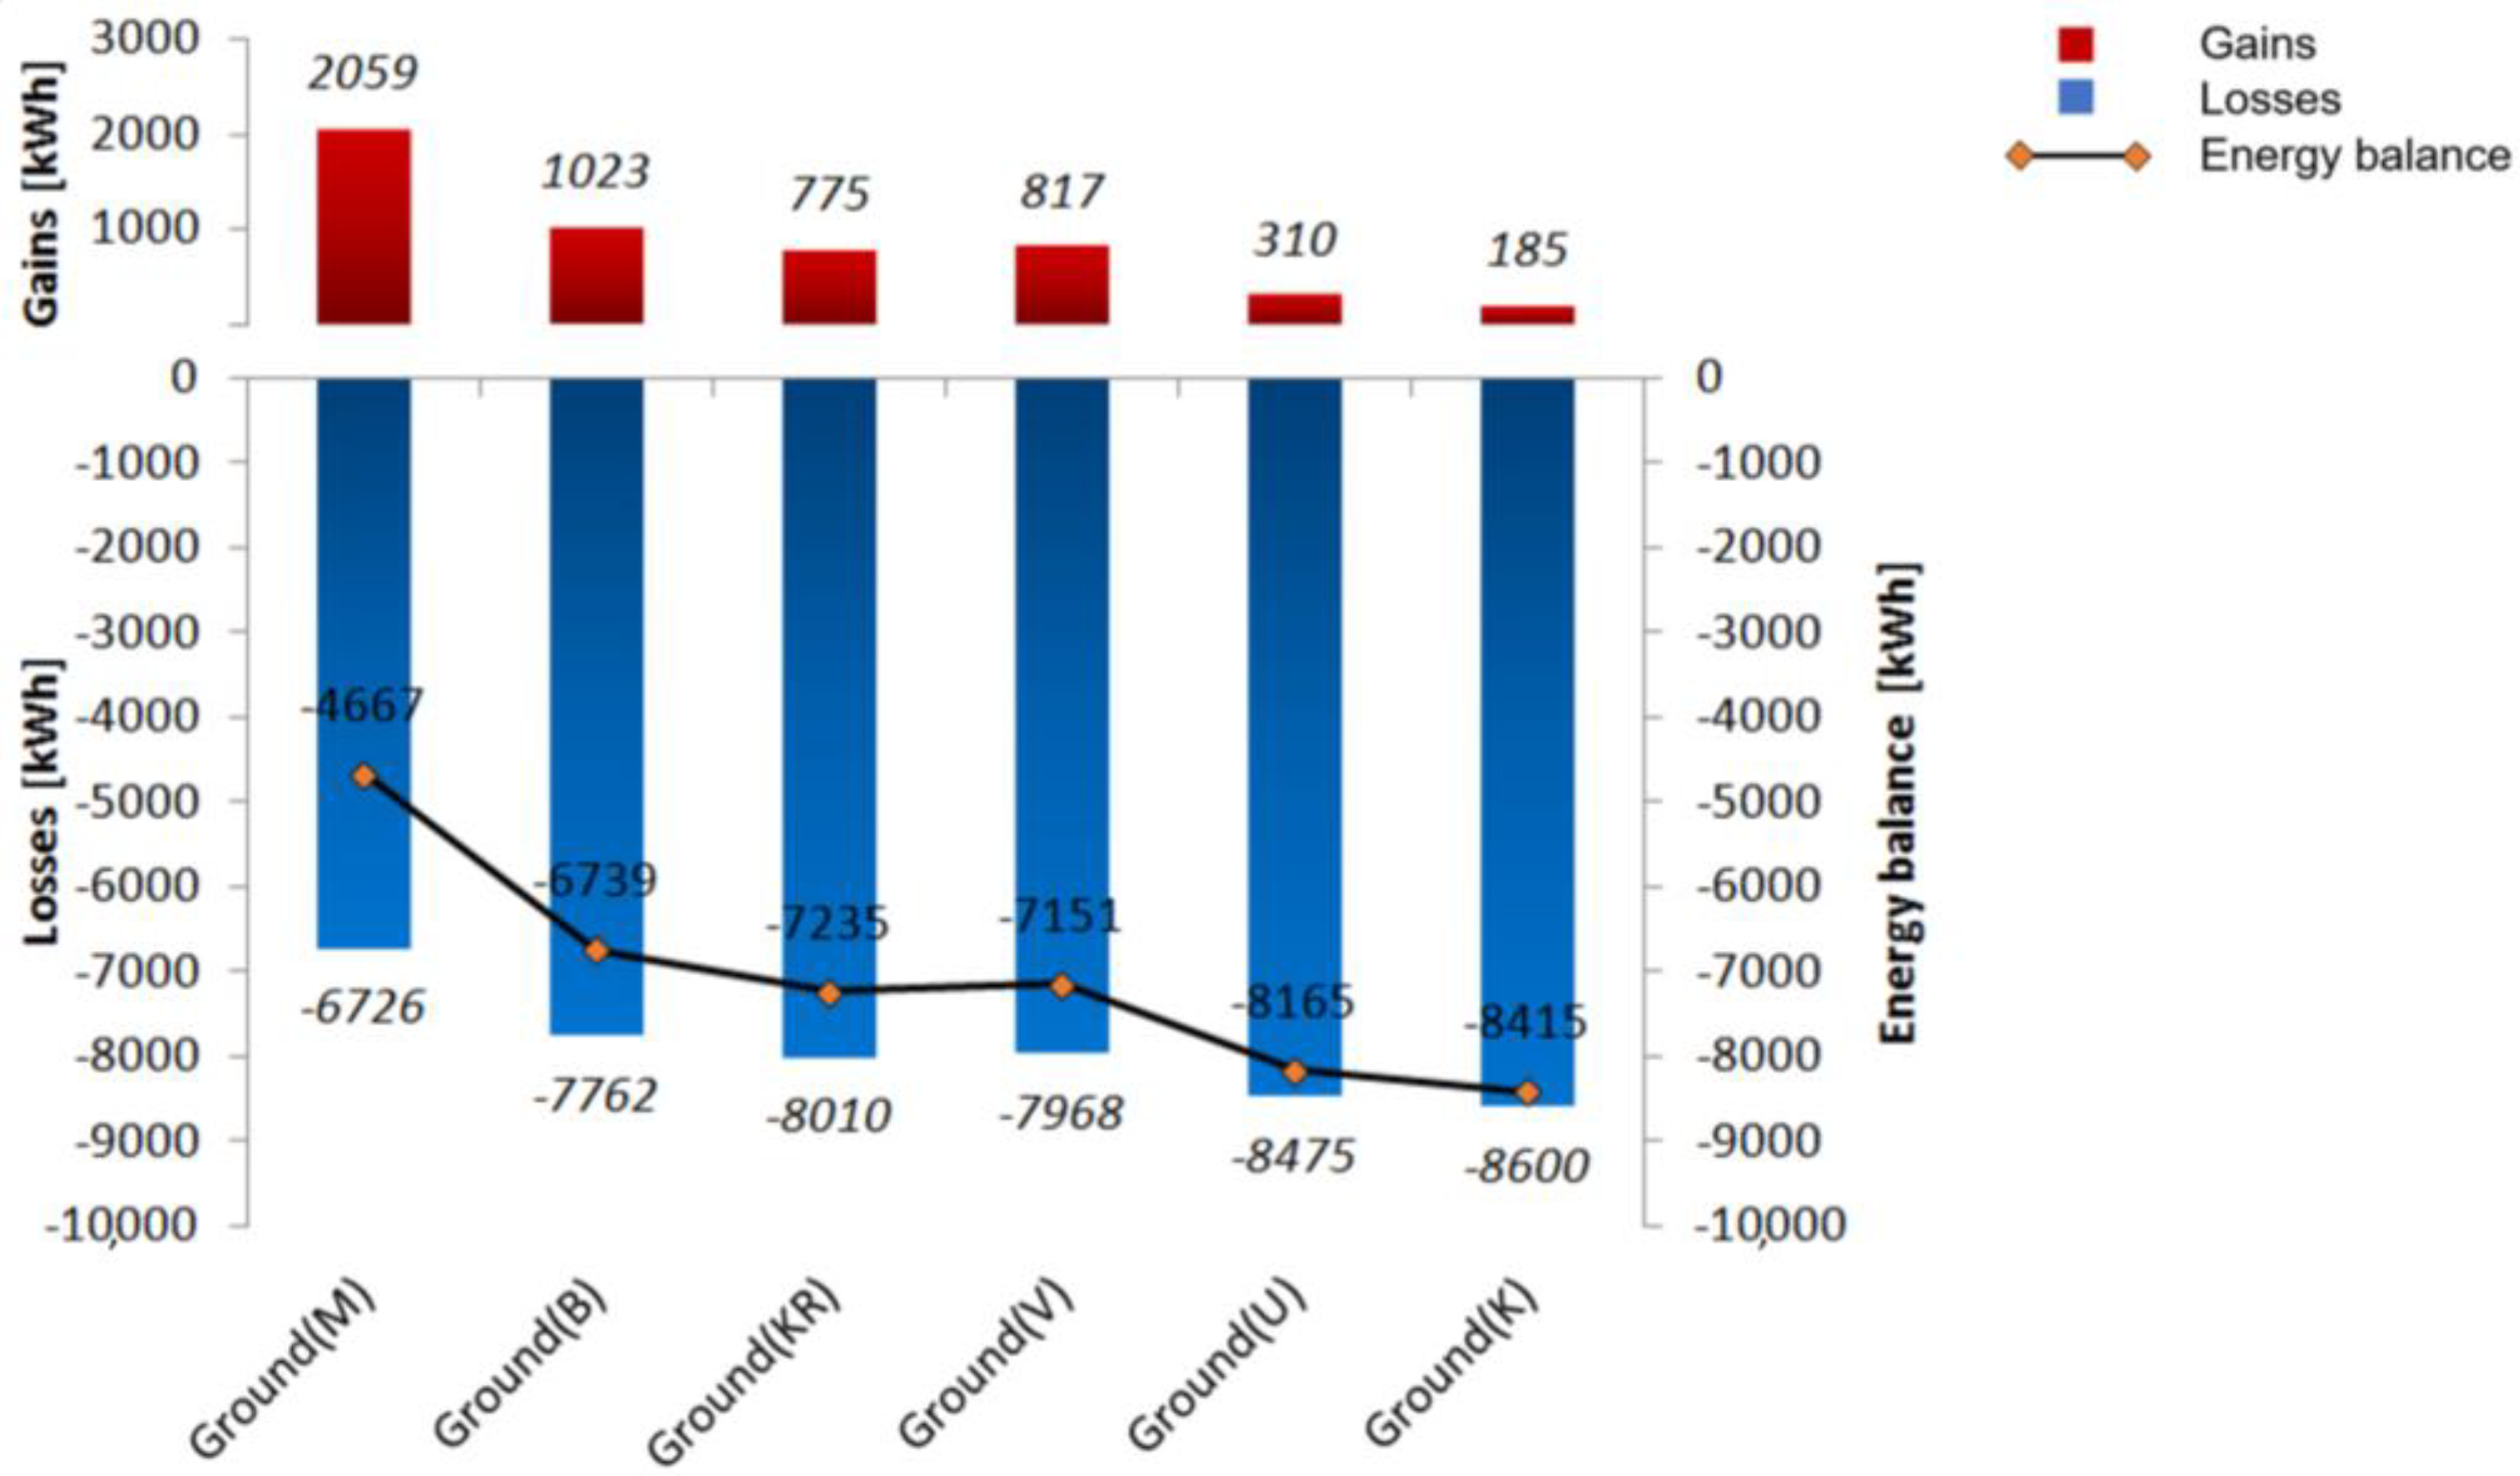
3.4. Heat Exchange with Ground and Energy Demand for Heating Purposes
4. Discussion
5. Conclusions
Author Contributions
Funding
Data Availability Statement
Conflicts of Interest
References
- Thornton, P.K.; Gerber, P. Climate Change and the Growth of the Livestock Sector in Developing Countries. Mitig. Adapt. Strateg. Glob. Chang. 2010, 15, 3185–3198. [Google Scholar] [CrossRef]
- Deutsch, L.; Kalkenamrk, M.; Gordon, L.; Rockstrom, J.; Folke, K. Water-mediated ecological consequences of intensification and expansion of livestock production. In Livestock in a Changing Landscape: Drivers, Consequences and Responses; Steinfeld, H., Mooney, H., Schneider, F., Neville, L., Eds.; Island Press: Washington, DC, USA, 2010; Volume 1, pp. 8182–8194. [Google Scholar]
- Thornton, P.K. Livestock production: Recent trends, future prospects. Philos. Trans. R. Soc. 2010, 365, 2853–2867. [Google Scholar] [CrossRef] [PubMed]
- United Nations Framework Convention on Climate Change, Challenges and Opportunities for Mitigation in the Agricultural Sector: Technical Paper; United Nation Framework Convention on Climate Change: New York, NY, USA, 2008.
- Perez-Lombard, L.; Ortiz, J.; Pout, C. A review on buildings energy consumption information. Energy Build. 2008, 40, 394–398. [Google Scholar] [CrossRef]
- Chastas, P.; Theodosiou, T.; Bikas, D. Embodied energy in residential buildings- towards the nearly zero energy building: A literature review. Build. Environ. 2016, 105, 267–282. [Google Scholar] [CrossRef]
- Costantino, A.; Fabrizio, E.; Biglia, A.; Cornale, P.; Battaglini, L. Energy use for climate control of animal houses: The state of the art in Europe. Energy Procedia 2016, 101, 184–191. [Google Scholar] [CrossRef]
- Costantino, A.; Fabrizio, E.; Ghiggini, A.; Bariani, M. Climate control in broiler houses: A thermal model for the calculation of the energy use and indoor environmental conditions. Energy Build 2018, 169, 110–126. [Google Scholar] [CrossRef]
- Rossi, P.; Gastaldo, A.; Riva, G.; de Carolis, C. Progetto Re Sole (Final Draft); Centro Ricerche Produzioni Animali (CRPA): Reggio Emilia, Italy, 2013. [Google Scholar]
- Alimohammadisagvand, B. Influence of Demand Response Actions on Thermal Comfort and Electricity Cost for Residential Houses. Ph.D. Dissertation, Aalto University, Aalto, Finland, 2018. Available online: https://aaltodoc.aalto.fi/handle/123456789/33143 (accessed on 7 May 2018).
- Alimohammadisagvand, B.; Jokisalo, J.; Sirén, K. The potential of predictive control in minimizing the electricity cost in a heat-pump heated residential house. In Proceedings of the 3rd IBPSA-England Conference BSO 2016, Great North Museum, Newcastle, UK, 12–14 September 2016; Available online: http://www.ibpsa.org/proceedings/BSO2016/p1049.pdf (accessed on 7 May 2018).
- Sokolowski, P.; Nawalany, G. Experimental study of the impact of the vegetable cold store floor location on heat exchange with the soil. Appl. Ecol. Environ. Res. 2019, 17, 8179–8189. [Google Scholar] [CrossRef]
- Sokolowski, P.; Nawalany, G. Numerical Analysis of the Impact of the Cooling Cycle Length in Vegetable Cold Stores on the Heat Exchange with Soil. J. Ecol. Eng. 2019, 20, 162–170. [Google Scholar] [CrossRef]
- Nawalany, G.; Sokołowski, P. Numerical Analysis of the Effect of Ground Dampness on Heat Transfer between Greenhouse and Ground. Sustainability 2021, 13, 3084. [Google Scholar] [CrossRef]
- Borrallo-Jimenez, M.; de Asiain, M.L.; Esquivias, P.M.; Delgado-Trujillo, D. Comparative study between the Passive House Standard in warm climates and Nearly Zero Energy Buildings under Spanish Technical Building Code in a dwelling design in Seville, Spain. Energy Build. 2022, 254, 111570. [Google Scholar] [CrossRef]
- Nawalany, G.; Lendelova, J.; Sokolowski, P.; Zitnak, M. Numerical Analysis of the Impact of the Location of a Commercial Broiler House on Its Energy Management and Heat Exchange with the Ground. Energies 2021, 14, 8565. [Google Scholar] [CrossRef]
- Nawalany, G.; Sokołowski, P. Improved Energy Management in an Intermittently Heated Building Using a Large Broiler House in Central Europe as an Example. Energies 2020, 13, 1371. [Google Scholar] [CrossRef]
- Andolsun, S.; Culp, C.H.; Heberl, J.; Witte, M. EnergyPlus vs DOE-2.1e: The effect of ground coupling on cooling/heating requirements of weak-on grade code houses in four climates of the US. Energy Build. 2012, 52, 189–206. [Google Scholar] [CrossRef]
- Ruiz, G.R.; Bandera, C.F. Validation of calibrated energy models: Common errors. Energies 2017, 10, 1587. [Google Scholar] [CrossRef]
- Radoń, J.; Wąs, K.; Flaga-Maryanczyk, A.; Schnotale, J. Experimental and theoretical study on hygrothermal long-term performance of outer assemblies in lightweight passive house. J. Build. Phys. 2018, 41, 299–320. [Google Scholar] [CrossRef]
- Liu, Y.J.; Li, J.D.; Misra, R.D.K.; Wang, Z.D.; Wang, G.D. A numerical analysis of weak heating characteristics in a rolling type reheating furnace with pulse combustion. Appl. Therm. Eng. 2016, 107, 1304–1312. [Google Scholar] [CrossRef]
- Snow, S.; Clerc, C.; Horrocks, N. Energy audits and eco-feedback: Exploring the barriers and facilitators of agricultural energy efficiency improvements on Australian farms. Energy Res. Soc. Sci. 2021, 80, 102–113. [Google Scholar] [CrossRef]
- Bambara, J.; Athienitis, A.K. Energy and Economic Analysis for greenhouse Ground Insulation Design. Energies 2018, 11, 3218. [Google Scholar] [CrossRef]
- Dong, C. Heat Loss via Concrete Slab Floors in Australian Houses. Procedia Eng. 2017, 205, 108–115. [Google Scholar]
- Starodubtseva, I.P.; Pavlenko, A.N.; Surtaev, A.S. Heat transfer during quenching of high temperature surface by the falling cryogenic liquid film. Int. J. Therm. Sci. 2017, 114, 196–204. [Google Scholar] [CrossRef]
- Akkurt, G.G.; Aste, N.; Borderon, J.; Buda, A.; Calzolari, M.; Chung, D.; Costanzo, V.; Del Pero, C.; Evola, G.; Huerto-Cardenas, H.E.; et al. Dynamic thermal and hygrometric simulation of historical buildings: Critical factors and possible solutions. Renew. Sustain. Energy Rev. 2020, 118, 109509. [Google Scholar] [CrossRef]
- Ferraz, P.F.P.; Yanagi, T.; Lima, R.R.D.; Ferraz, G.A.; Xin, H. Performance of chicks subjected to thermal challenge. Agropecuária Bras. 2017, 52, 113–120. [Google Scholar] [CrossRef]
- Olfati, A.; Mojtahedin, A.; Sadeghi, T.; Akbari, M.; Martínez-Pastor, F. Comparison of growth performance and immune responses of broiler chicks reared under heat stress, cold stress and thermoneutral conditions. Span. J. Agric. Res. 2018, 16, 307–321. [Google Scholar] [CrossRef]
- Cordeiro, M.B.; Tinôco, I.D.F.F.; Silva, J.N.D.; Vigoderis, R.B.; Pinto, F.D.A.D.C.; Cecon, P.R. Conforto térmico e desempenho de pintos de corte submetidos a diferentes sistemas de aquecimento no período de inverno. Rev. Bras. De Zootec. 2010, 39, 217–224. [Google Scholar] [CrossRef][Green Version]
- Goel, A.; Ncho, C.M.; Choi, Y.H. Regulation of gene expression in chickens by heat stress. J. Anim. Sci. Biotechnol. 2021, 12, 1–13. [Google Scholar] [CrossRef]
- Norton, T.; Sun, D.W.; Grant, J.; Fallon, R.; Dodd, V. Applications of computational fluid dynamics (CFD) in the modelling and design of ventilation systems in the agricultural industry: A review. Bioresour. Technol. 2007, 98, 2386–2414. [Google Scholar] [CrossRef]
- Seo, I.H.; Lee, I.B.; Moon, O.K.; Kim, H.T.; Hwang, H.S.; Hong, S.W.; Han, J.W. Improvement of the ventilation system of a naturally ventilated broiler house in the cold season using computational simulations. Biosyst. Eng. 2009, 104, 106–117. [Google Scholar] [CrossRef]


| Specification | Bulk Density | Heat Capacity | Thermal Conductivity |
|---|---|---|---|
| [kg·m−3] | [J·kg−1·K−1] | [W·m−1·K−1] | |
| Sandy loam | 1800 | 840 | 0.70 |
| Loam | 1800 | 840 | 0.85 |
| Sand | 1650 | 840 | 0.40 |
| Concrete | 2300 | 1000 | 2.30 |
| Aerated concrete | 600 | 840 | 0.21 |
| Styrofoam | 20 | 1500 | 0.04 |
| Mineral wool | 40 | 800 | 0.05 |
| Specification | Heat Transfer Coefficient |
|---|---|
| [W·m−2·K−1] | |
| Foundation | 5.55 |
| Floor | 0.45 |
| Walls | 0.23 |
| Ceiling | 0.37 |
| Roof | 5.77 |
| Doors | 1.80 |
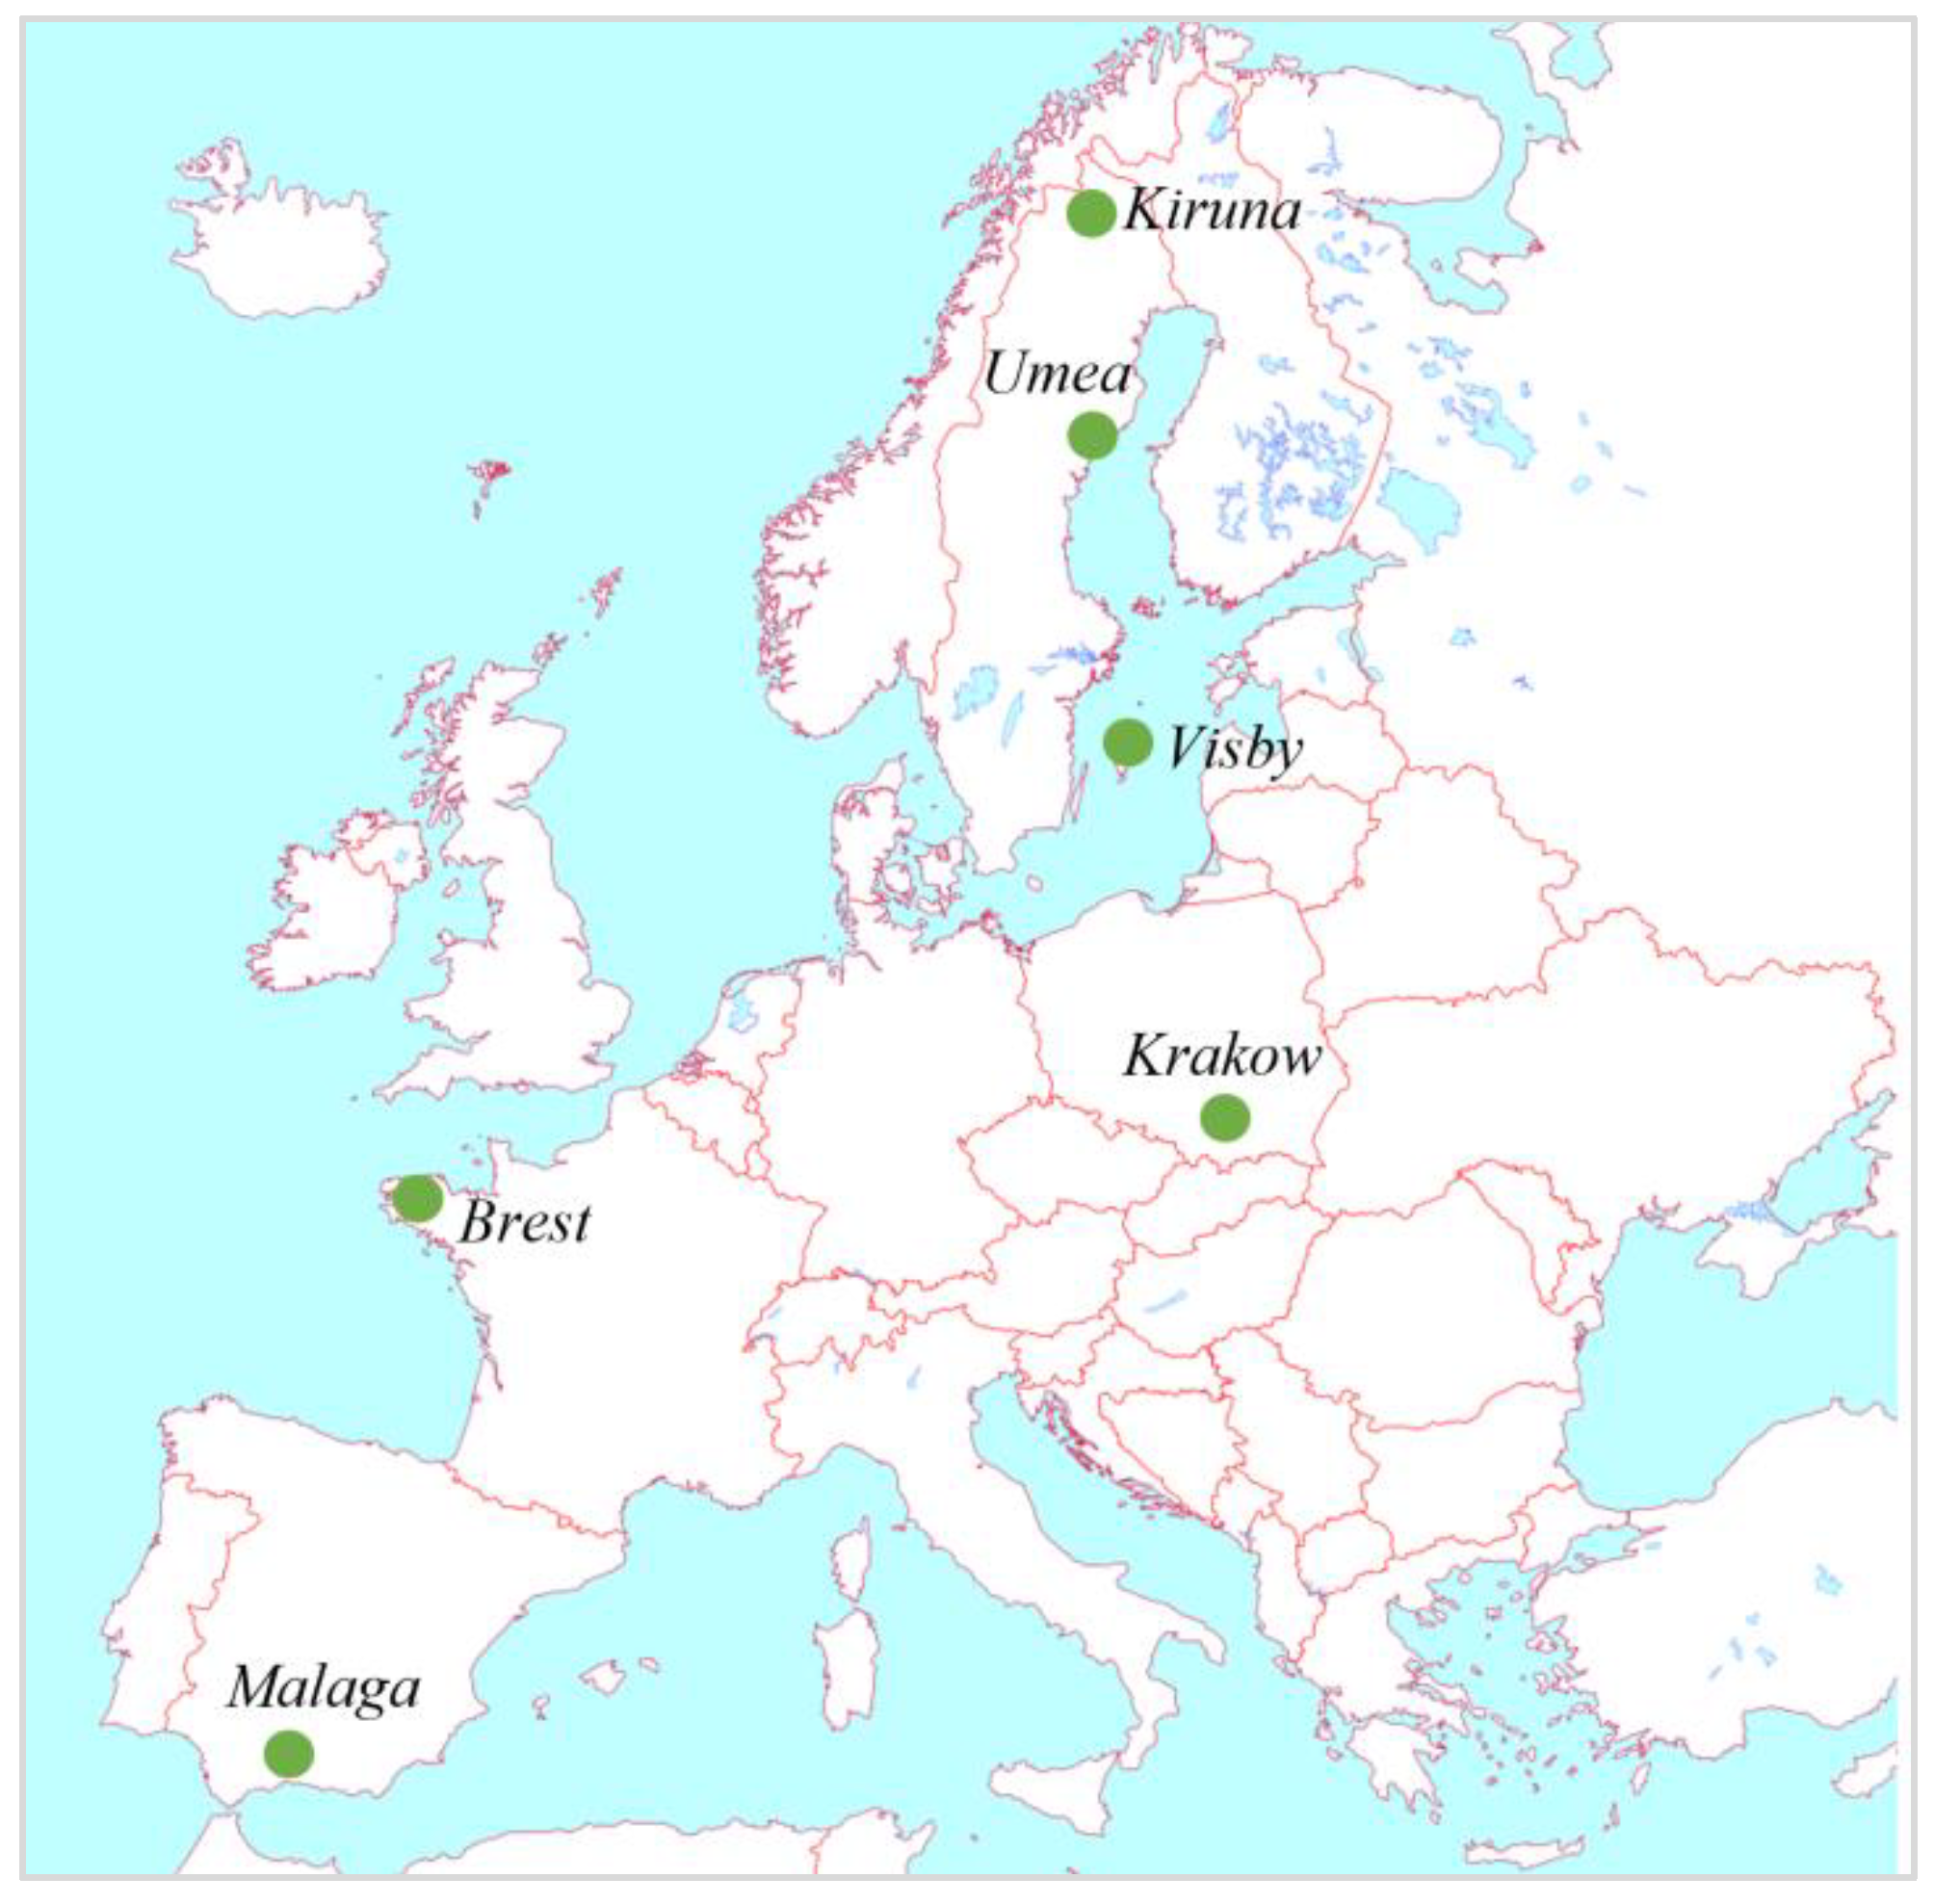
| Parameters | Θe (M) | Θe (B) | Θe (KR) | Θe (V) | Θe (U) | Θe (K) |
|---|---|---|---|---|---|---|
| [°C] | ||||||
| min | 0.0 | −4.2 | −20.1 | −8.3 | −37.0 | −41.4 |
| max | 40.0 | 26.8 | 31.0 | 27.6 | 27. 3 | 25.1 |
| average | 18.3 | 10.5 | 8.3 | 8.4 | 1.9 | −1.6 |
| median | 18.3 | 10.7 | 8.8 | 7.3 | 2.4 | −0.3 |
| stand. dev. | 6.6 | 5.8 | 8.7 | 7.3 | 10.3 | 10.9 |
| amplitude | 40.0 | 31.0 | 51.1 | 35.9 | 64.3 | 66.5 |
Publisher’s Note: MDPI stays neutral with regard to jurisdictional claims in published maps and institutional affiliations. |
© 2022 by the authors. Licensee MDPI, Basel, Switzerland. This article is an open access article distributed under the terms and conditions of the Creative Commons Attribution (CC BY) license (https://creativecommons.org/licenses/by/4.0/).
Share and Cite
Nawalany, G.; Sokołowski, P. Interaction between a Cyclically Heated Building and the Ground, for Selected Locations in Europe. Energies 2022, 15, 7493. https://doi.org/10.3390/en15207493
Nawalany G, Sokołowski P. Interaction between a Cyclically Heated Building and the Ground, for Selected Locations in Europe. Energies. 2022; 15(20):7493. https://doi.org/10.3390/en15207493
Chicago/Turabian StyleNawalany, Grzegorz, and Paweł Sokołowski. 2022. "Interaction between a Cyclically Heated Building and the Ground, for Selected Locations in Europe" Energies 15, no. 20: 7493. https://doi.org/10.3390/en15207493
APA StyleNawalany, G., & Sokołowski, P. (2022). Interaction between a Cyclically Heated Building and the Ground, for Selected Locations in Europe. Energies, 15(20), 7493. https://doi.org/10.3390/en15207493