Article

Analysis of Available Conditions for InSAR Surface Deformation Monitoring in CCS Projects

1
Key Laboratory of Digital Earth Science, Aerospace Information Research Institute, Chinese Academy of Sciences, Beijing 100094, China
2
University of Chinese Academy of Sciences, Beijing 100049, China
3
School of Geosciences & Surveying Engineering, China University of Mining and Technology-Beijing, Beijing 100083, China
4
National Institute of Natural Hazards, Ministry of Emergency Management of China, Beijing 100085, China
*
Author to whom correspondence should be addressed.
Energies 2022, 15(2), 672; https://doi.org/10.3390/en15020672
Submission received: 2 November 2021 / Revised: 15 January 2022 / Accepted: 16 January 2022 / Published: 17 January 2022
(This article belongs to the Special Issue Advances in Methane Production from Coal, Shale and Other Tight Rocks)

Abstract

:
Carbon neutrality is a goal the world is striving to achieve in the context of global warming. Carbon capture and storage (CCS) has received extensive attention as an effective method to reduce carbon dioxide (CO2) in the atmosphere. What follows is the migration pathway and leakage monitoring after CO2 injection. Interferometric synthetic aperture radar (InSAR) technology, with its advantages of extensive coverage in surface deformation monitoring and all-weather traceability of the injection processes, has become one of the promising technologies frequently adopted in worldwide CCS projects. However, there is no mature evaluation system to determine whether InSAR technology is suitable for each CO2 sequestration area. In this study, a new evaluation model is proposed based on the eight factors that are selected from the principle of the InSAR technique and the unique characteristics of the CO2 sequestration area. According to the proposed model, the feasibility of InSAR monitoring is evaluated for the existing typical sequestration areas in the world. Finally, the challenges and prospects of InSAR in the CCS project are discussed.

Graphical Abstract

1. Introduction

The constant excess of carbon dioxide (CO2) in the atmosphere is an important issue that human beings need to solve now and in the future. The Global Carbon Project (GCP) has published its latest assessment of the global CO2 budget, and despite the impact of COVID-19, human-made CO2 emissions (CO2 emissions from fossil fuel consumption and land use change) are still far greater than the net CO2 absorption by oceans and lands [1]. CO2 sequestration and utilization programs remain one of the most effective and cost-effective methods available [2]. With the development of sequestration technology and an increase in sequestration sites, it is urgent and necessary to ensure the safety and effective monitoring of sequestration.
CO2 will exist in a gas or supercritical fluid state after being injected into the reservoir, and the density of injected CO2 is usually lower than that of resident fluid. Due to gravity or the buoyancy effect, it may flow upward and leak to the ground; however, the density of CO2 is greater than that of air. After leakage, it will accumulate on the surface, which may lead to the loss of humans, animals, plants, and environment [3]. Therefore, real-time ground monitoring during injection is necessary. At the same time, due to the change of formation pressure caused by injection, new fractures may be generated, which will cause CO2 not to migrate according to the expected pathway but integrate into groundwater or rise to the surface along the fractures, resulting in the failure of storage, and the expected effect cannot be achieved in gas or oil displacement projects. Therefore, large-scale and long-time migration monitoring is also needed [4]. In order to realize real-time and long-term monitoring at the same time, multiple monitoring methods need to be applied jointly, which also leads to a large amount of investment and an increase in monitoring cost. A systematic and economic monitoring system still needs to be developed [5].
Currently, the practices utilized in leakage monitoring methods are primarily divided into three categories: near-surface monitoring, surface monitoring, and underground monitoring [6]. Among them, interferometric synthetic aperture radar (InSAR) monitoring, as an emerging near-surface monitoring technology, has attracted extensive attention, and its effect and feasibility for storage monitoring have been verified [7]. The successful monitoring cases of satellite-borne synthetic aperture radar (SAR) show that InSAR monitoring technology can conduct large-scale all-day monitoring without the need for a large number of personnel and instruments on site. Additionally, InSAR technology can realize continuous monitoring for years, and can effectively identify the underground migration direction of CO2, which is a reliable monitoring method from the perspectives of the economy and sustainability [8].
However, the use of InSAR technology in CCS is still in the exploratory stage. Although a lot of funds have been invested, the monitoring performance of InSAR in some sequestration areas is not ideal, which is primarily reflected in problems with identification and accuracy. InSAR technology still has great challenges in CCS project monitoring, such as incoherence caused by atmosphere and vegetation, which will lead to failure to detect deformation [9,10]. As a passive detection method, how to separate the deformation caused by CO2 injection is also a problem to be solved [11]. These problems lead to different effects in different projects. Thus, a systematic analysis and summary is urgently needed. It not only provides experience for existing projects, but also provides the basis for the evaluation of InSAR feasibility for subsequent storage monitoring projects.
In this study, using an analysis of successful monitoring cases, a feasibility evaluation model of InSAR surface deformation monitoring in CCS project was established. Eight factors, including the limitations of InSAR technology and the characteristics of storage area, were selected as the main controlling factors. Then, the model was applied to evaluate storage areas all over the world and give suggestions on whether it is suitable for InSAR monitoring. The study is structured as follows. After the introduction, the principle of deformation induced by CO2 injection and the feasibility of InSAR monitoring will be discussed in Section 2. Then, factors that may affect InSAR sequestration monitoring are proposed in Section 3, followed by a feasibility assessment of an existing/in design sequestration area in Section 4. Finally, a summary and discussion regarding the direction of improvements of the feasibility assessment and the future development of InSAR technology are discussed.

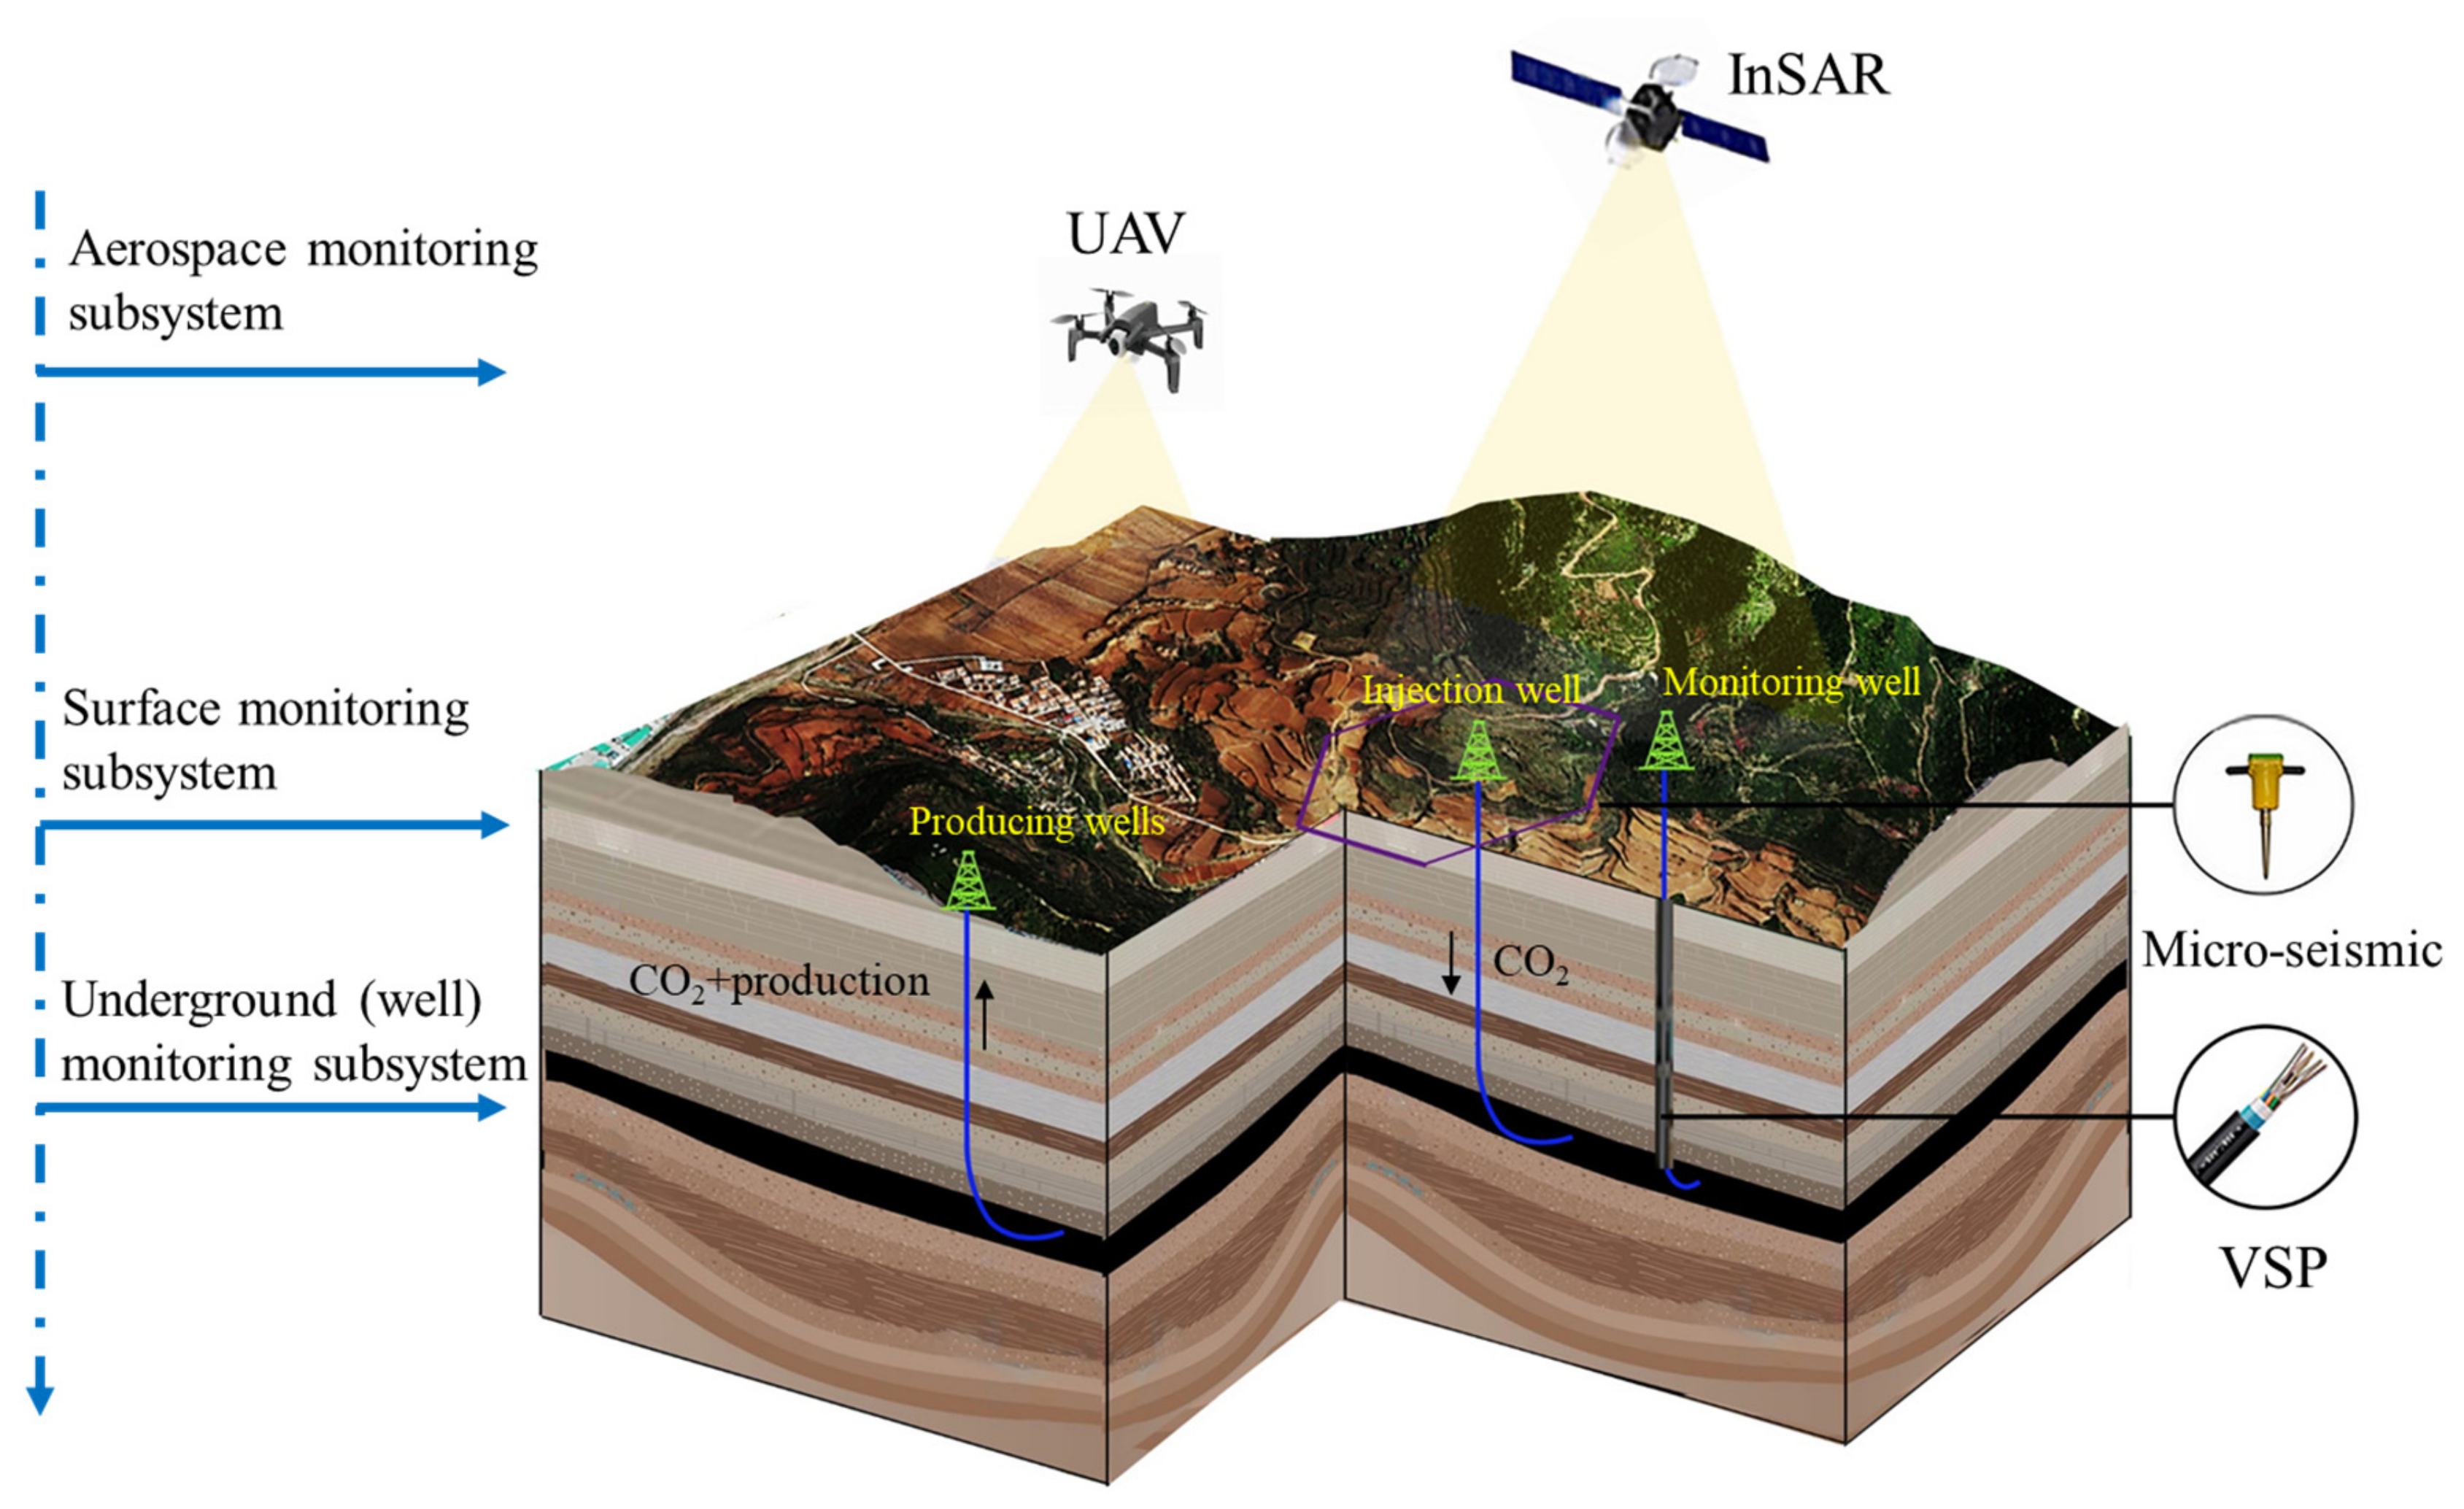
2. Feasibility of Monitoring CCS Using the InSAR Technique

During the storage process of CCS, when CO2 is injected, the pore pressure in the rock layer increases, which changes the effective stress field. This then causes a deformation of the reservoir, resulting in vertical strain and damage. In particular, the deformation near the injection point is the most sensitive and obvious, and this phenomenon has been confirmed in a variety of numerical simulation models [12,13,14].
In terms of its primary “measurement” function, InSAR is a space–earth observation technology that can measure millimeter-scale ground movement. In terms of its working principle, it realizes the measurement of spatial geometry and its changes by “comparing” the “phase change” (echo path length) in two or more radar image data of the same area [15]. The millimeter–centimeter deformation measurement accuracy of the InSAR technique is particularly consistent with the centimeter deformation measurement in the CO2 sequestered area. Therefore, the corresponding research began shortly after the InSAR technique was proposed. In 2004, InSAR monitoring was first used in the In Salah field to effectively monitor the 5–150 mm/y surface deformation caused by CO2 injection [16]. With the continuous development and improvement of InSAR technology, more sensors and a time series unwrapping algorithm have been used to monitor the CCS deformation. These include the application of an L-band sensor in the Scurry Country CO2-EOR field in West Texas [17], the application of a C-band sensor in the Jingbian CO2-EOR field in Shaanxi [18], China, the application of D-InSAR technology in the Aquistore CCS site in southeastern Saskatchewan, Canada [19], and the application of SBAS-InSAR technology in the Fengcheng Oil Field, Xinjiang, China [20].
Currently, more than 137 CCS projects have been built or planned in the world, as shown in Figure 1, while less than 10 cases have been successfully monitored using InSAR technology. As a large-scale, long-term, and economic technology, InSAR is worthy of more promotion, but the uncertainty of its monitoring result success has prevented it from being widely used. In order to avoid the wastage of funds caused by the failure of application, a method to evaluate the feasibility of InSAR in the storage area is urgently required.

3. Influencing Factors of InSAR Monitoring in a CCS Project

Based on the principle of InSAR and a review of the successful cases, this study proposes eight factors that may affect CCS monitoring using the InSAR technique. These can be divided into two factors of InSAR’s own limitations and six factors specific to the CCS storage area.

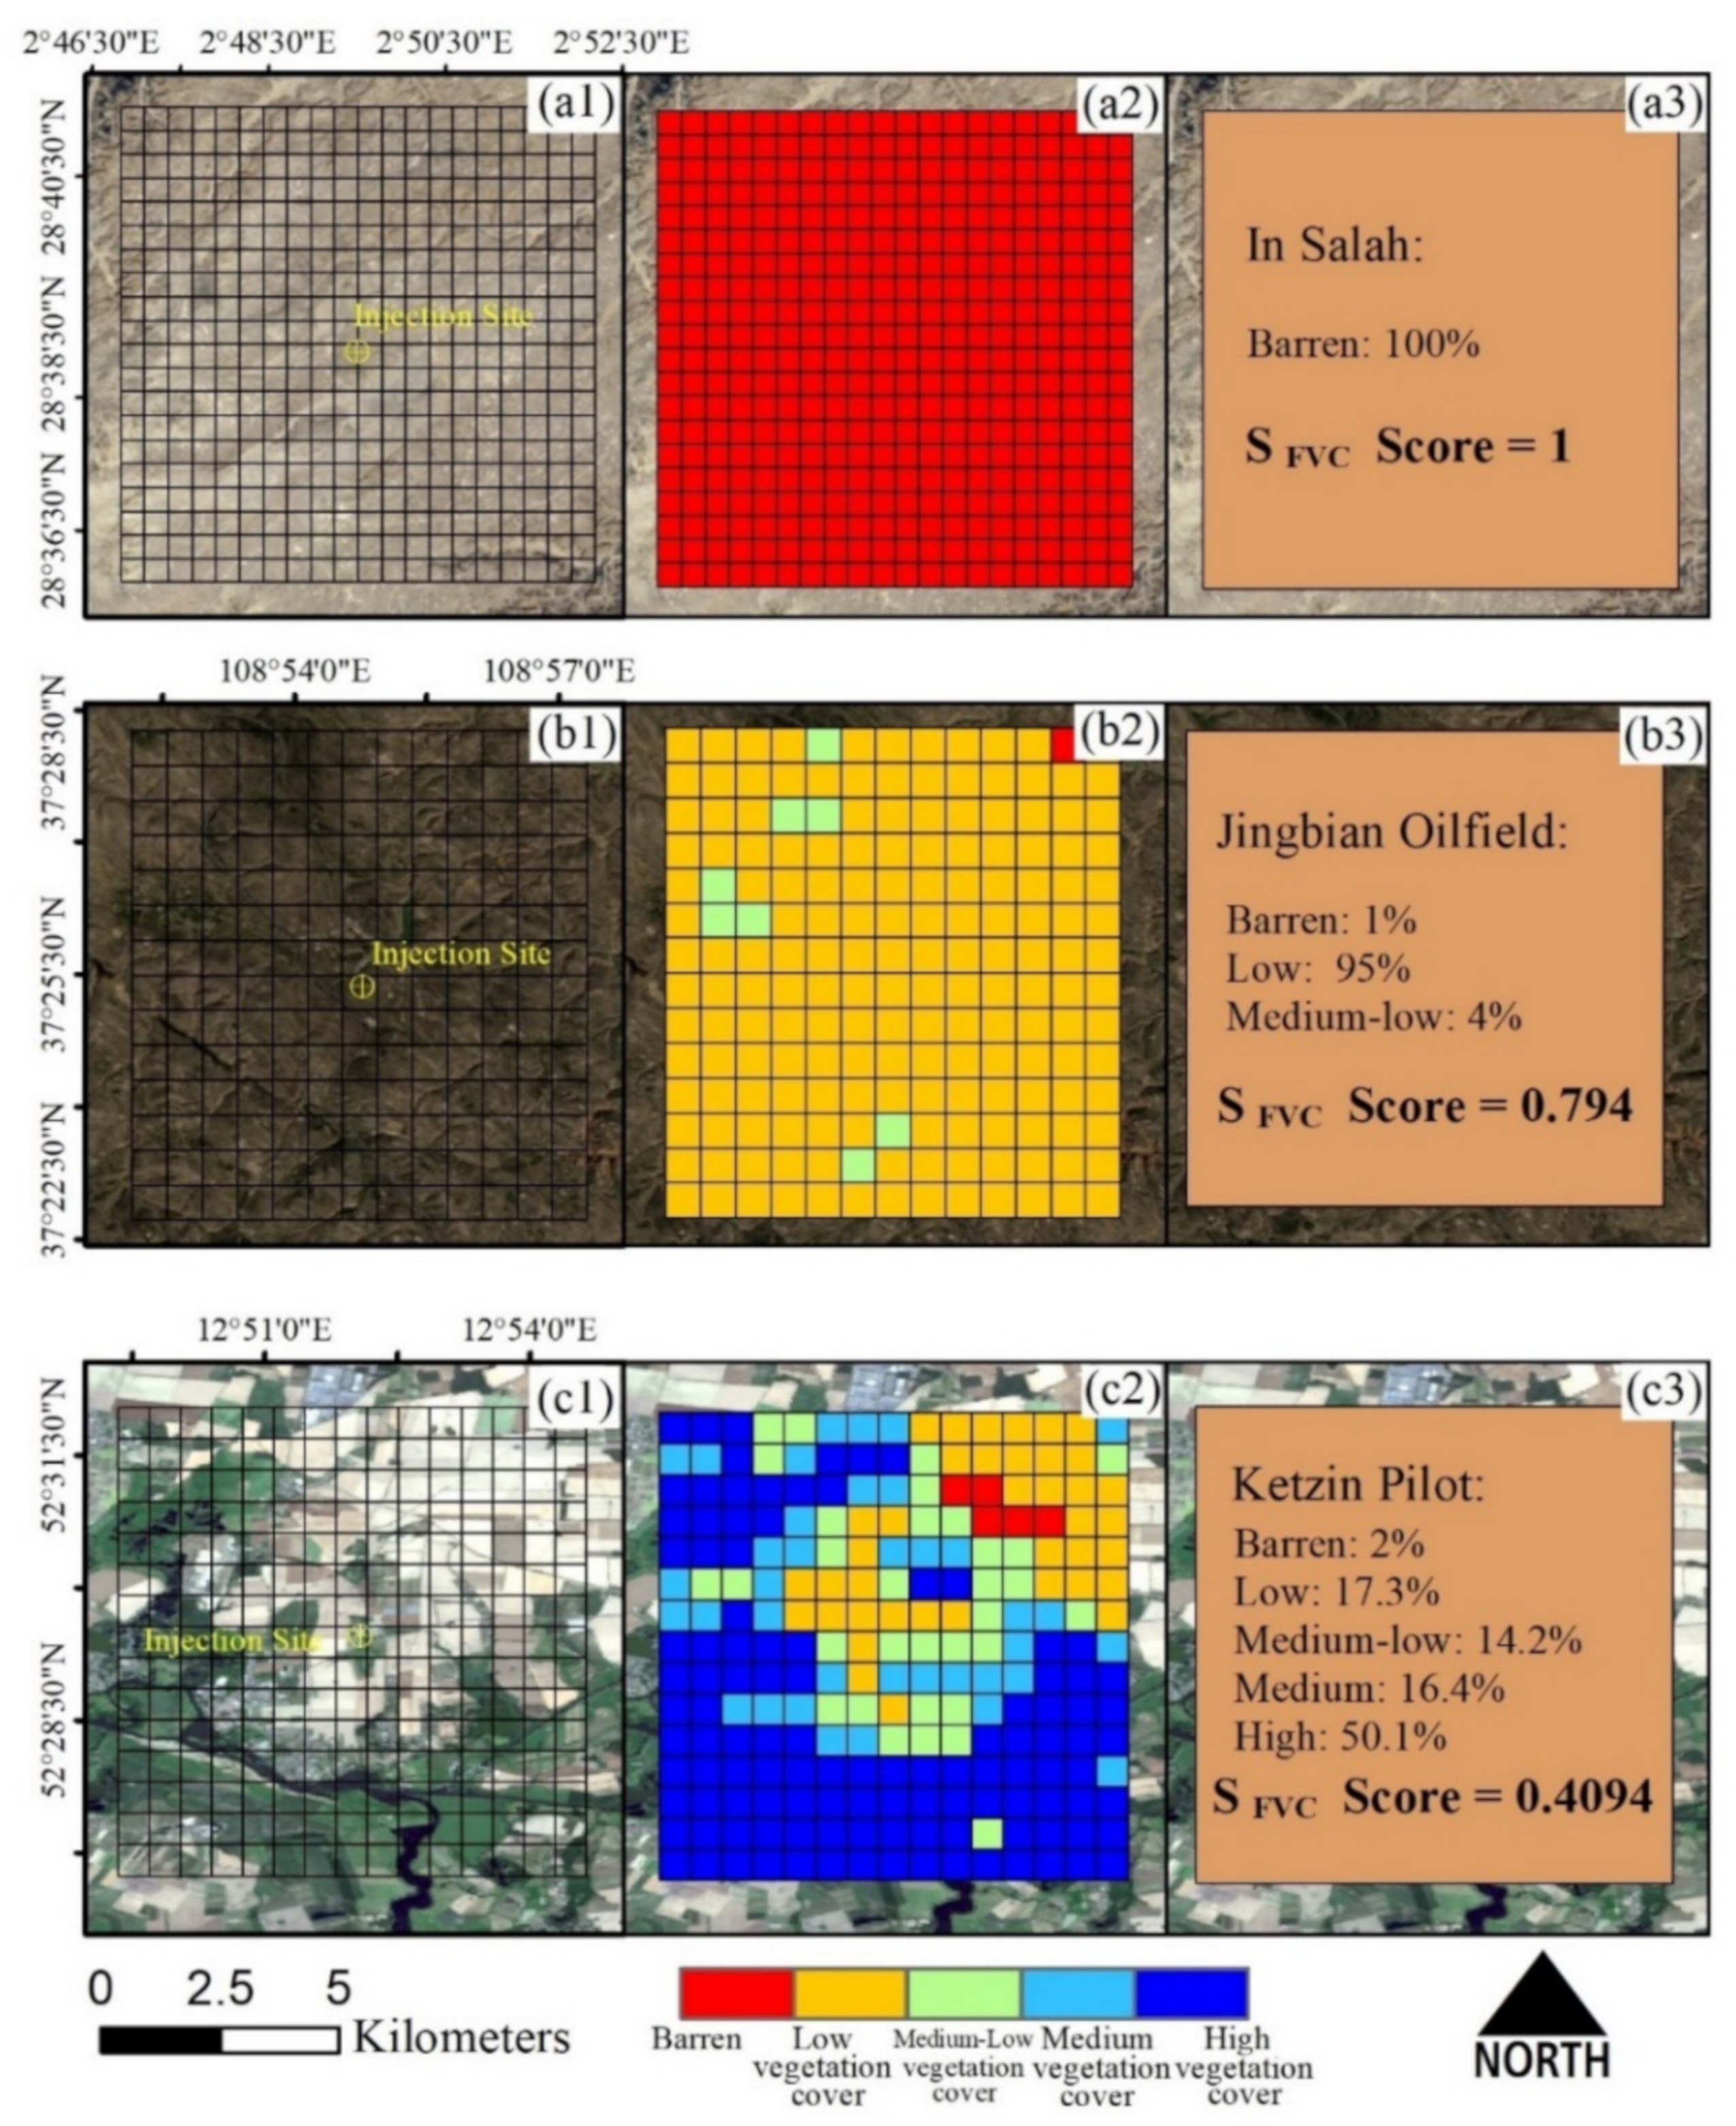
3.1. Vegetation Coverage

Phase unwrapping is the process of restoring phase from the principal value/phase to the true value, which is also a core step of the InSAR technique. The accuracy of phase unwrapping directly affects the final surface deformation results [21]. In 1989, when the California Institute of Technology demonstrated the feasibility of InSAR technology for detecting surface deformation for the first time, it was found that there was an incoherent phenomenon in the vegetated areas that led to a failure of the phase unwrapping [22]. The linear relationship between the normalized difference vegetation index (NDVI) and the SAR interferometric coherence has also been revealed [23]. Following years of exploration, time series InSAR was proposed to effectively reduce the incoherent effects caused by vegetation, but it is still deficient in dense areas.
In this study, the fractional vegetation cover (FVC) was used to measure the status of the surface vegetation. The FVC index refers to the percentage of the vertical projection area of vegetation on the ground to the total area of the statistical area [24]. The practical method to measure the FVC index is to calculate it using the NDVI, and the calculation equation is as follows:
FVC = NDVI NDVI s o i l / NDVI v e g NDVI s o i l ,
where NDVI s o i l refers to the NDVI value of bare soil or areas without vegetation coverage; and NDVI v e g refers to the NDVI value of pixels completely covered by vegetation. In this study, according to the different regions where the carbon dioxide sequestration areas were located, the factor scores were formulated according to the range of vegetation coverage, as presented in Table 1.
The Glass-FVC dataset of the University of Maryland [25] was used to extract the FVC in the 5 km rectangular buffer zone with the injection point as the center; the number of all types of grids was counted, and this was multiplied by the corresponding scoring factor. Then the average was calculated, which can be regarded as the final FVC score of the storage area. In order to intuitively illustrate our calculation method, three typical sequestration areas were selected for demonstration, as shown in Figure 2. In Salah oilfield stores CO2 in its deep saline layer, with an average annual storage capacity of 3 Mt. Jingbian oilfield is the first CCUS full process project in China, with a storage depth of 1500 m and an average storage capacity of 59,000 tons. The Ketzin pilot is the first organization in the world with a relatively perfect monitoring system for CO2 geological storage. The reservoir is a saltwater aquifer with a depth of about 650 m, with an average annual storage of 60,000 tons. Among them, the In Salah sequestration area is located in the Sahara Desert with no vegetation coverage and the proportion of bare land is 100%. Hence, its S F V C score is one. The Jingbian oil field is located in western China and is dominated by low vegetation coverage with an FVC less than 0.3. The final S F V C score was 0.794 after multiplying the proportion of the three surface types by the corresponding S F V C score. In contrast, Germany’s Ketzin sequestration area is more complex, with a large proportion of medium and high vegetation coverage leading to an S F V C score as low as 0.409, which affects the applicability of InSAR monitoring.

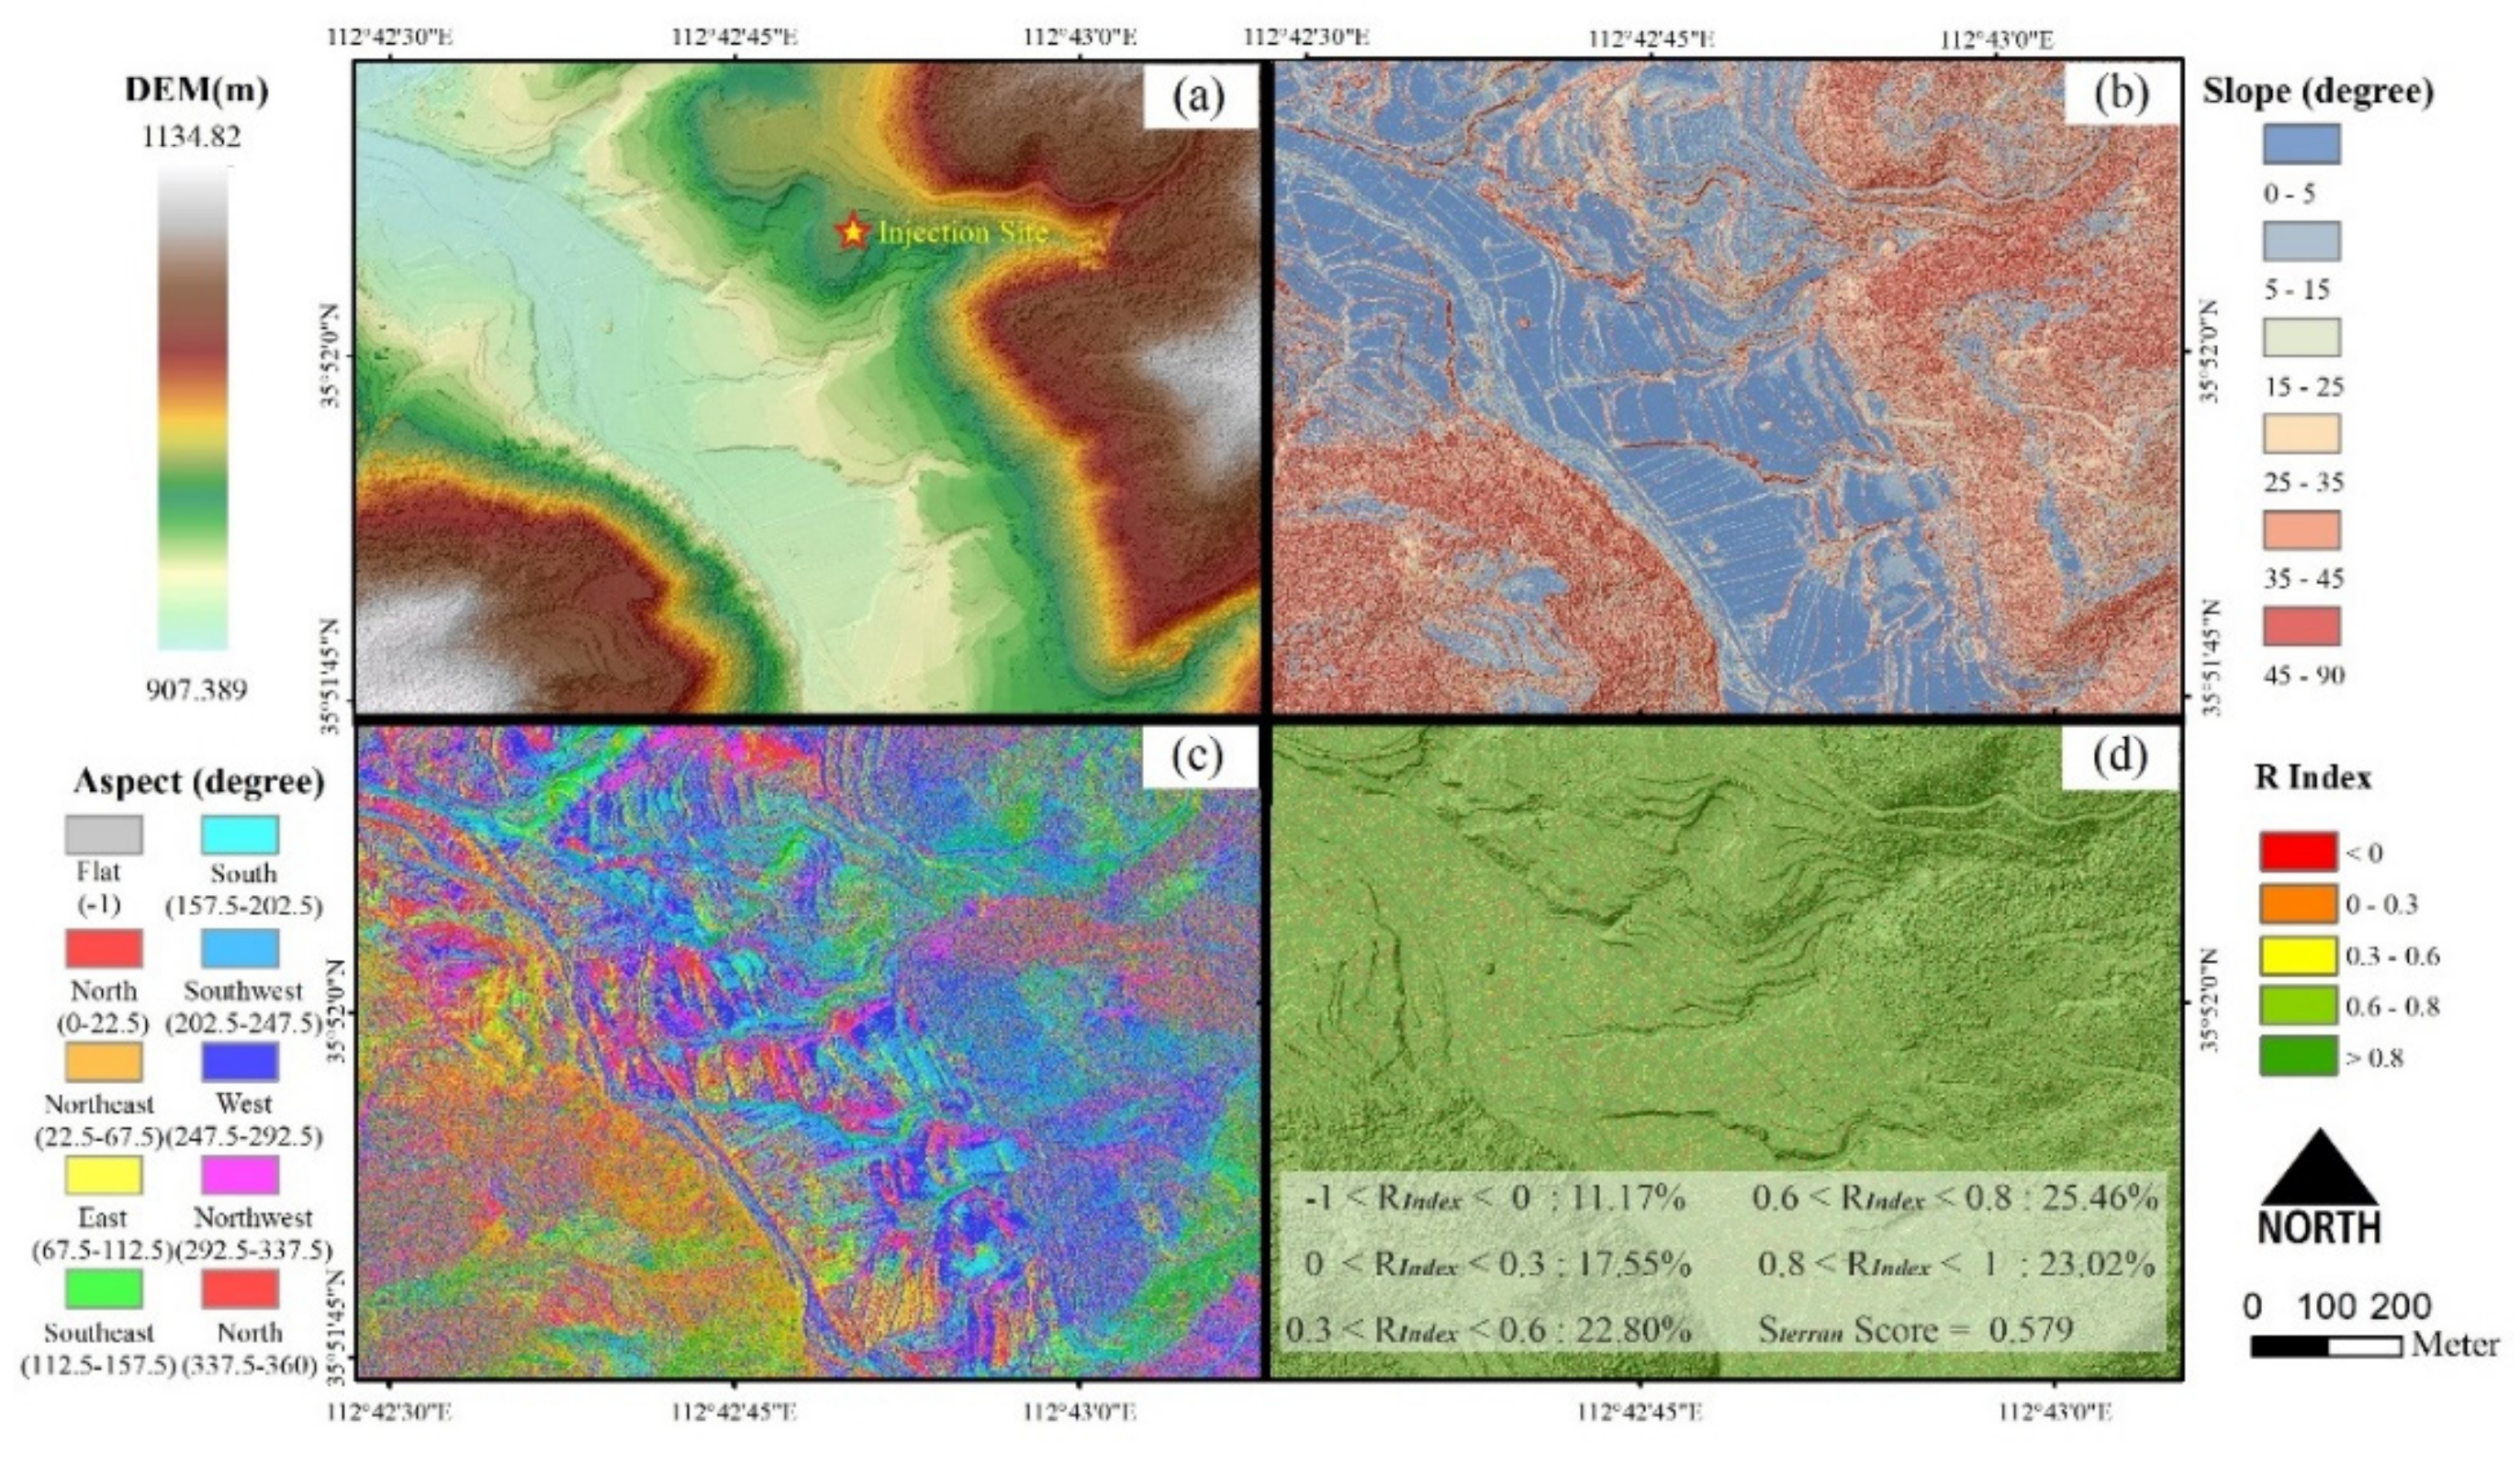
3.2. Topographic Factor

The imaging principle of SAR requires that the image be expressed on an oblique anomaly surface. Therefore, in SAR images, when the slope of ground surface scene is too large, different ground target points with the same oblique distance will be mapped into the same range-doppler unit, and their reflected echoes will overlap. This will result in an aliasing of the corresponding SAR image and the InSAR interference phase, which is called the layout [26]. Steep terrains will also block the back slope area, leading to some object points being shaded. Hence, the radar cannot receive the corresponding surface echo information, resulting in dark areas in the SAR image, and this phenomenon is called the shadow [27]. The presence of overlay and shadow will cause the area to be incorrectly unwrapped.
The R-index, which indicates the ratio between the pixel size in slant and the ground range geometry or the “pixel compression factor”, was proposed in 2011 [28]. The R-index quantifies the effect of terrain on radar imaging, and its calculation equation is as follows:
R I n d e x = sin arctan tan S · sin A α θ
where S is the slope derived from the digital elevation model (DEM), A α is the aspect derived from DEM and correct with angle from north of the satellite track, and θ is the incident angle of the line of sight (LOS). The higher the R-index, the flatter the terrain, with less shadow and layout. The factor scores corresponding to the R-index are listed in Table 2. The score of the topographic factors in a sequestration area was calculated by adding the percentage of each R class multiplied by the corresponding scoring factors.
The CCS-ECBM pilot of Shizhuang, Shaanxi Province, China was selected to illustrate the calculation method of the S t e r r a i n score. Shizhuang pilot data were DEM generated from unmanned aerial vehicle (UAV) images, and the slope and aspect parameters were extracted from the DEM to calculate the corresponding R I n d e x . The raster proportion of the R I n d e x was multiplied by the corresponding S t e r r a i n score to finally obtain the S t e r r a i n score of the sequestration area, as shown in Figure 3.

3.3. Reservoir Location

Currently, CCS sequestration forms are primarily divided into geological sequestration and marine sequestration, among which geological storage is the mainstream, while marine storage has more application potential. Geological sequestration techniques can be roughly divided into three categories: (1) oil and gas reservoir sequestration [29], (2) unrecoverable coal seam sequestration [30], and (3) deep saltwater sequestration [31]. All of these sequestration forms will cause changes in the surface elevation due to changes in the underground pressure. Marine sequestration is the direct injection of CO2 into the ocean at high pressure after CO2 capture, which can be divided into: (1) shallow sea dissolution sequestration (200–300 m), (2) deep-sea clathrate sequestration (>500 m), and (3) deep-sea clathrate hydrate sequestration (>3000 m) [32]. After centuries of atmospheric isolation, dissolved and dissipated CO2 becomes part of the global carbon cycle and is an ideal way to potentially achieve large-scale and long-term CO2 sequestration [33].
Obviously, with the InSAR technique, there is no way to observe marine sequestration. Therefore, we utilized the sequestration form as a prerequisite for the application of the InSAR technology. The onshore sequestration score was one, and the offshore sequestration score was zero, which was multiplied with all the other factor scores as a coefficient, as shown in Table 3.

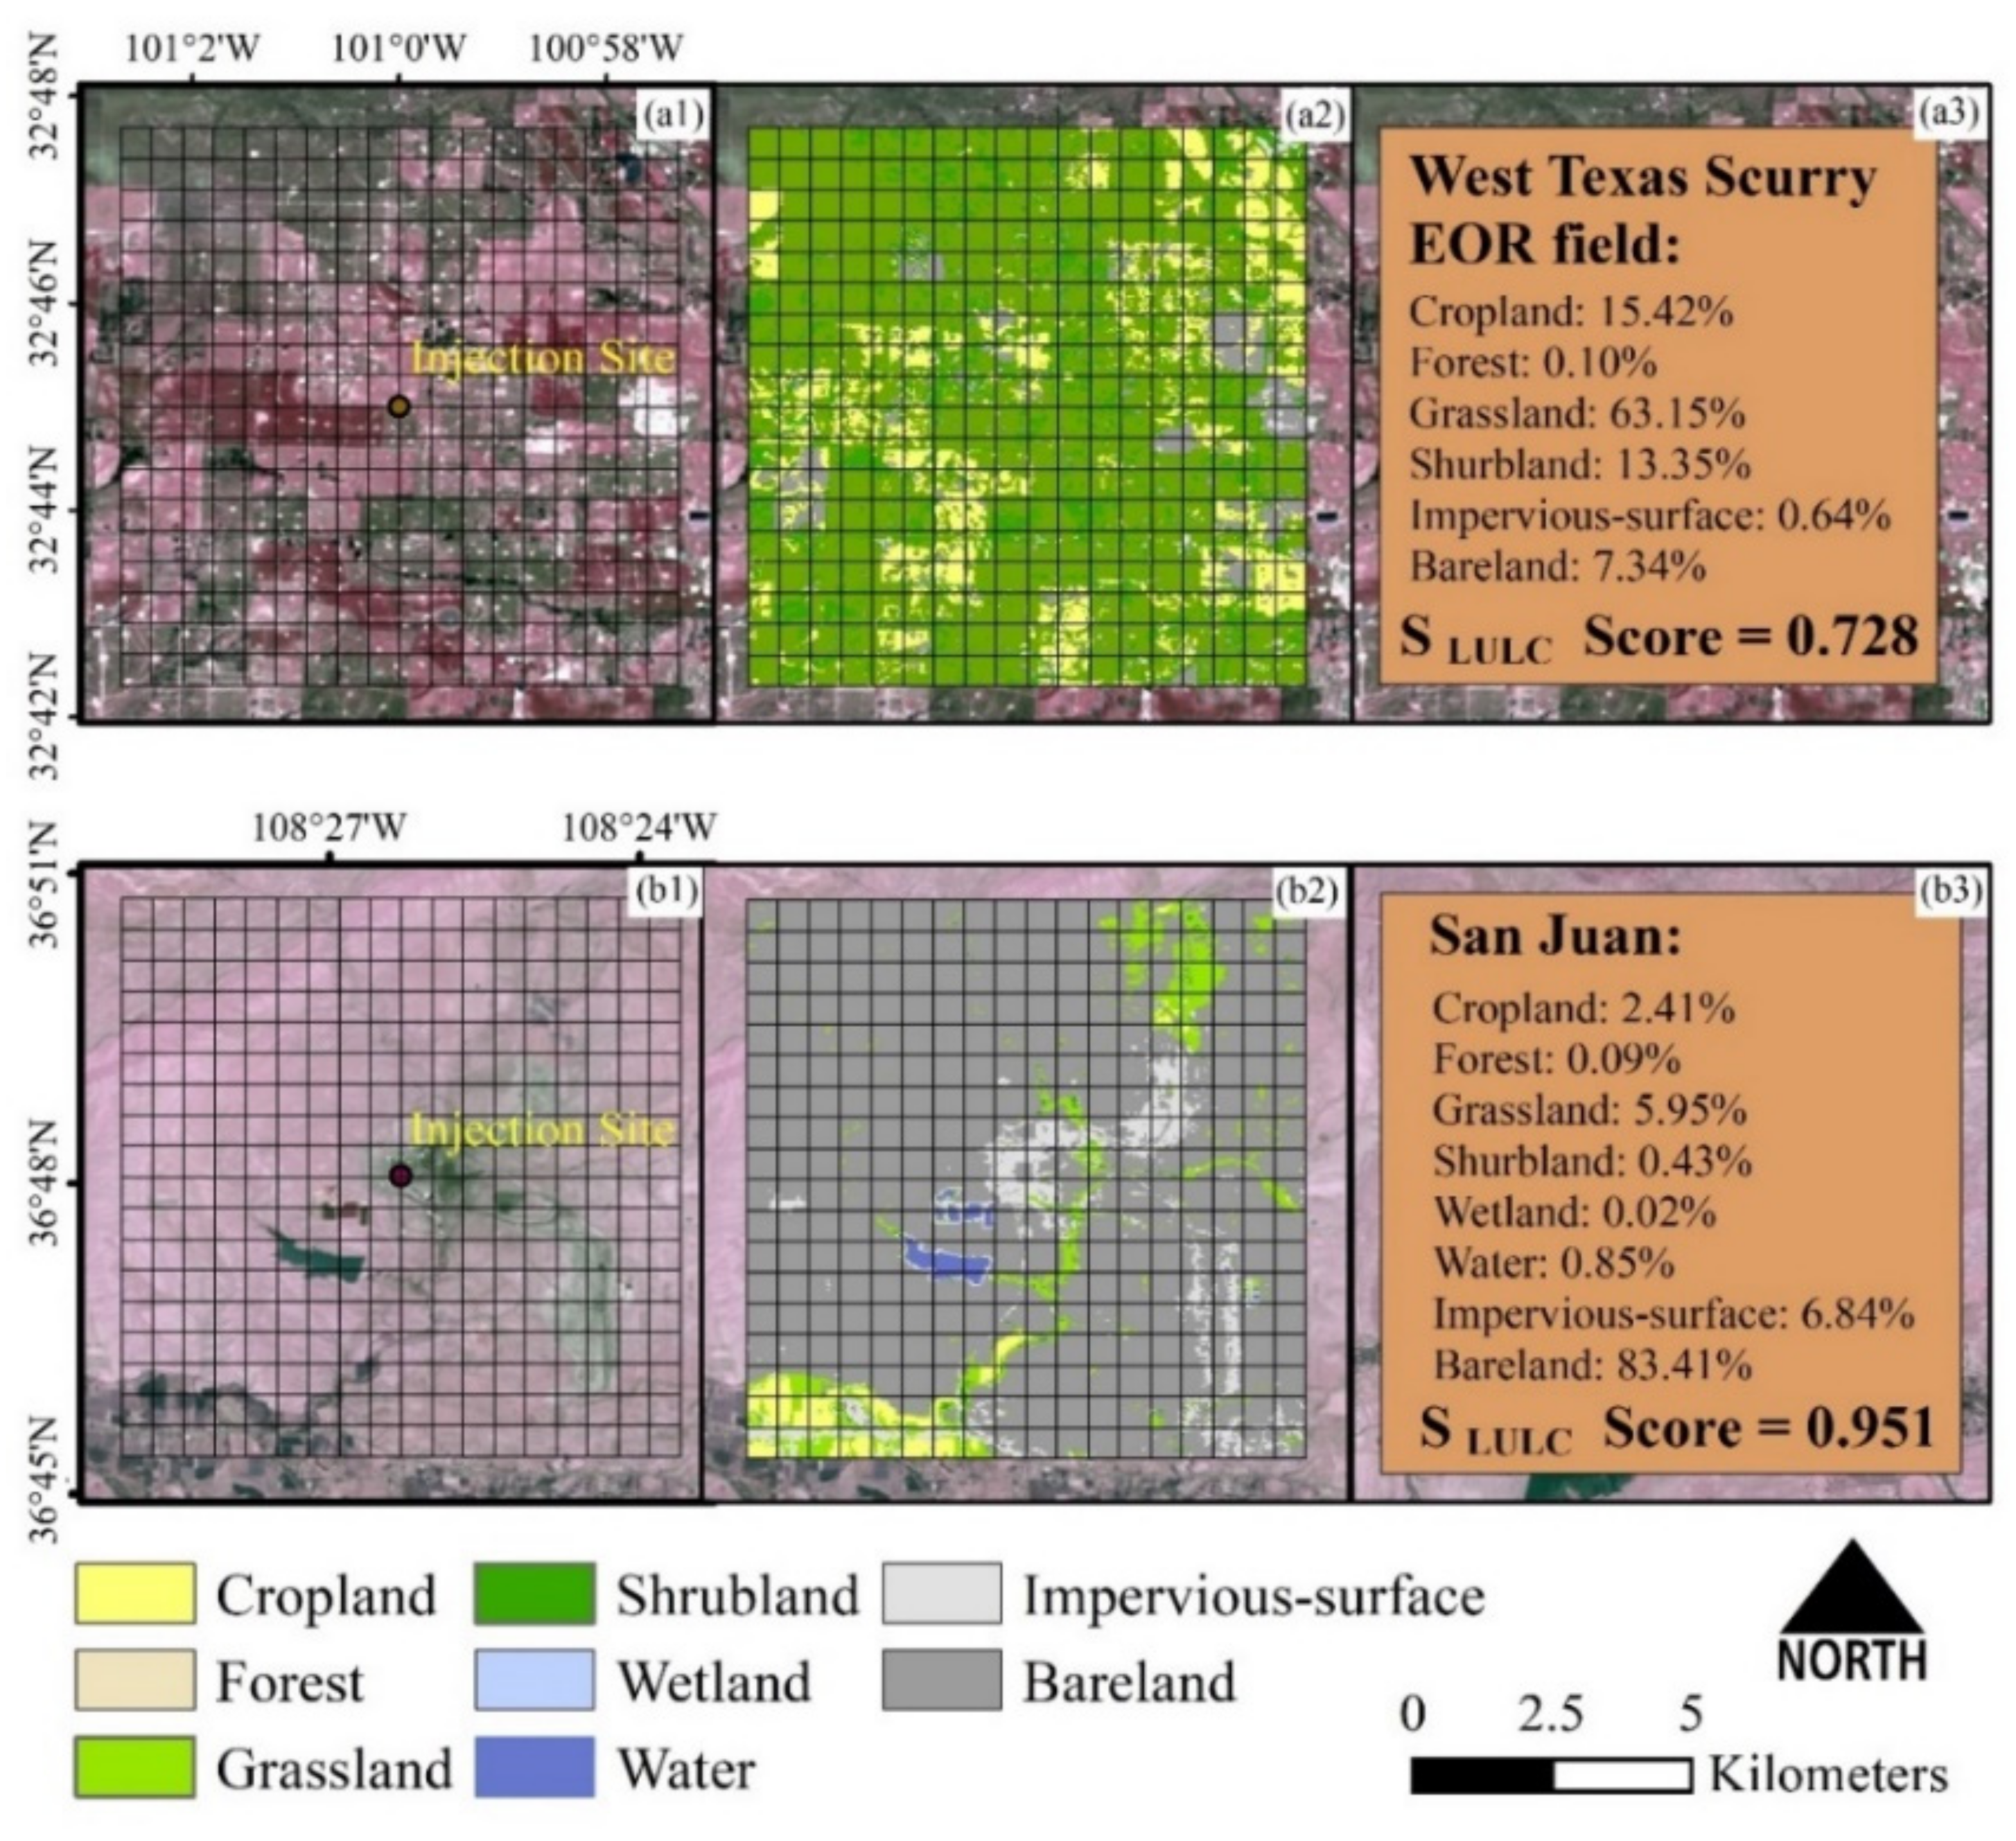
3.4. Land Use/Land Cover

InSAR technology is unable to detect large magnitudes of deformation or large changes in the surface due to incoherent reasons, such as human activity images in intense areas. Therefore, distinguishing the surface environment of different sequestration areas is an important factor for the InSAR technique.
The land use and land cover (LULC) is an important indicator for the effective observation of global surface types [34]. The 30 m resolution LULC data published by the National Remote Sensing Center of China (NRSCC) in 2017 have been validated and widely used all over the world [35]. Among the 10 categories defined by the NRSCC, there are 5 categories of natural vegetation, 2 categories of land use and land mosaic, and 3 categories of land without plant growth [36]. In InSAR monitoring, the overall situation of the surface is only required. Hence, we combined similar categories. Bare land is an ideal site for monitoring InSAR technology due to its good coherence caused by an abundance of bare land surfaces [37]. Since InSAR can be monitored in a long time series according to a fixed season, monitoring can be conducted when seasonal plants wilt to ensure coherence, which makes the location of seasonal vegetation an appropriate location for InSAR monitoring [38]. With regard to urban areas and croplands, anthropogenic activities greatly disturb the surface change, so it is also necessary to conduct an analysis or experiment according to the specific site situation. However, for water bodies and wetlands, there are too many factors that affect their changes, which is why InSAR technology is not applicable to monitor elevation changes caused by CO2 injection. The specific factor scores of the classifications are presented in Table 4.
The Scurry and San Juan oilfields were used to introduce the calculation of the S l u l c score. Similarly, a rectangular buffer of 10 km at the injection point was selected as the calculation area. The total S l u l c score of the sequestration area was obtained by calculating the proportion of the different types of grids and multiplying by their S l u l c score, as shown in Figure 4. The Scurry storage area consisted primarily of grassland and shrubland, which accounted for 76% of the buffer, and the S l u l c score was 0.728, which may have different effects on InSAR monitoring with seasonal changes. The San Juan oilfield was primarily bare land, accounting for 83% of the buffer. Hence, its S l u l c score reached 0.951, which was more suitable for InSAR monitoring from the perspective of the LULC.

3.5. Injection Rate

The injection rate is the primary factor that affects the formation pressure and stress. In a low-velocity injection, the fluid can move through the formation at a lower differential pressure and the formation pressure rises slowly. With an increase in the injection rate, it becomes more difficult for the fluid to flow and diffuse in the formation, and the required driving pressure increases [39]. According to the numerical simulation, a good linear relationship between the surface deformation and injection velocity was obtained when the injection rate was low (30–150 m3/day), while a quadratic relationship was obtained when the injection rate was high (>2000 m3/day) [40].
The obvious deformation is very beneficial for InSAR monitoring, and the factor scores are listed in Table 5. However, it should be noted that if the vertical displacement rate of the surface is too large, the fracture expansion of the stratum will increase, and the probability of fault activity will increase. This will lead to geological disasters on the surface and damage to the ecological environment on the surface. Therefore, it is necessary to control the injection rate according to the bottom hole pressure to ensure that the surface deformation rate is within a reasonable range.

3.6. Injection Quantity

During the process of CO2 sequestration, the matrix injection (injection pressure lower than the fracture pressure of the reservoir) is used to prevent leakage caused by the fracture of the cap rock. Matrix injection causes the reservoir pressure to build up, reducing the effective stress and causing reservoir swelling. This, in turn, lifts the cap rock and the ground surface. The total injection quantity is one of the important factors that determine the internal pressure of formation. A small amount of CO2 injection can result in surface changes that are not obvious or concentrated near the injection well, making it difficult to be monitored using the InSAR technique. Therefore, factor scores have been formulated according to the amount of storage, as presented in Table 6. The effect of a small amount of CO2 injection is not obvious, but it does not mean that it is completely unfeasible, and it needs to be determined in conjunction with the depth and lithology of the formation. Hence, the minimum factor score utilized in this study is not zero.

3.7. Reservoir Depth

Surface deformation caused by carbon dioxide injection needs to be gradually transferred from the injection layer to the surface; so, the depth of injection is also an important factor for the success of InSAR monitoring [41]. Theoretically, the shallower the storage is, the better the surface deformation effect. However, the minimum depth for supercritical CO2 is 800 m, and the cap rock thickness is also required; hence, most of the storage thickness is between 0.8 and 5 km at present [42]. However, the factors that determine the sealing depth are the porosity, saturation, and other physical properties of the reservoir and also the integrity and thickness of the cap rock. Hence, the selection of the reservoir depth is restrictive. Based on an analysis of successful InSAR monitoring cases and expert experience, a relatively universal classification method is proposed, as presented in Table 7. The 0.5–1.5 km depth reservoir is primarily the coal field depth. With shallow strata, a small overburden pressure, and a fast deformation response, it is easy to realize InSAR observations. Oil and gas fields at depths of 1.5–2.5 km are the areas where commercial injection is concentrated. During the production process, the change in the formation pressure makes the surface deformation obvious, which can be clearly observed using InSAR technology. When the overburden pressure on the surface is greater than 2.5 km, it is no longer easy to cause surface deformation, so the fraction decreases with depth.

3.8. Monitoring Duration

Surface deformation changes caused by CO2 injection require a certain amount of accumulation and response time, while the deformation response caused by fluid migration is even more delayed. Therefore, InSAR monitoring needs to be observed continuously for several years from the beginning of injection [43]. According to the review of the cases successfully monitored using InSAR, it was found that the surface deformation showed obvious changes between one and two years after injection. However, a phenomenon that cannot be ignored is that, after the injection was stopped, the underground pressure and stress were rebalanced, resulting in a decline in the surface deformation. The stratum subsidence lasted primarily for half a year after the injection was stopped, and the rate of subsidence after half a year was nearly negligible. With an increase in the injection years, the surface deformation will accumulate, and the recovery rate of the surface deformation will also decrease. According to Zheng’s study, the surface recovery rate was 35.3% one year after injection, and only 6.7% when the injection period was five years [40].
Based on the above reasons, we developed factor scores for different durations, as presented in Table 8. We assumed that the InSAR monitoring began with the commencement of injection. A duration of 3–5 years is ideal for InSAR monitoring because the effects of CO2 sequestration and migration on the surface deformation can be identified using accumulation and comparison over a period of time. When the duration is less than three years, the effect of the injection stoppage may be superimposed on the effect of the migration, making it difficult to identify and interpret. Conversely, a duration of more than five years of CO2 injection may no longer be the primary cause of surface change and may also cause excessive expenditure, so its factor score was also lowered.

4. InSAR Feasibility Assessment of a CCS Site

4.1. Evaluation Methods

With the gradual development of InSAR technology, its application fields have been continuously expanded, and the successful application in storage deformation monitoring has made it possible for long-term and continuous migration and leakage monitoring. However, there is no evidence that InSAR monitoring can be applied to all sequestration areas. According to the properties of InSAR technology and the characteristics of sequestration areas, a feasibility assessment method based on remote sensing was proposed for monitoring surface deformation in CO2 sequestration areas. Eight factors were selected as evaluation factors, and independent evaluation criteria and conversion scores are provided in Section 3, according to their characteristics. The final feasibility score of the study area was obtained after the converted scores were calculated in the way of equal weight. The calculation equation is as follows:
F I n s a r = S l o c a t i o n i = 1 m S i + j = 1 n S j m + n ,
where F I n s a r is the final feasibility assessment score for the sequestration area; S l o c a t i o n is the sequestration type; S i is the characteristic factor score of the InSAR technology; S j is the characteristic factor score of CO2 sequestration areas; and m and n are the numbers of two factors. m and n can be increased or decreased depending on the data acquisition capacity of the different storage areas. In this study, all the factors were collected; so, the corresponding equation is as follows:
i = 1 m S i = S F V C + S T e r r a i n ,
j = 1 n S j = S L U L C + S R a t e + S Q u a n t i t y + S D e p t h + S D u r a t i o n ,     n = 5 ,
According to the existing successful and unsatisfactory cases and combined with relevant experience, we established the corresponding classification of the feasibility score, as presented in Table 9.

4.2. Feasibility Assessment

According to the above standards, we selected 22 representative research areas all over the world as the primary evaluation objects to evaluate the feasibility of the InSAR technology, including the areas under injection and areas where injection has been completed. Sequestration areas covering as many countries as possible were evaluated in order to provide recommendations on the feasibility of InSAR monitoring. The parameters and scores of each sequestration area are presented in Table 10.
It can be seen from the evaluation that most of the sequestration areas are suitable for InSAR monitoring. Desert areas are especially advantageous for InSAR monitoring because of their flat terrain and low vegetation coverage. Based on the cases that were collected and that have been monitored using InSAR technology, the sequestration areas that have been successfully monitored were all evaluated as highly recommended or strongly applicable. In particular, a case in which InSAR did not effectively detect deformation was evaluated as applicable, which confirmed the feasibility of this evaluation method to a certain extent.

5. Discussion

A CCS project is one of the most effective methods to reduce carbon emissions. Whether it can effectively monitor storage leakage has become one of the determinants of its large-scale commercialization. Part of the CO2 storage in the geological layer is fixed in the storage layer through physical and chemical action, another part flows along the geological layer, and a small part will penetrate or leak to the soil, atmosphere, and other places along the geological defects, wells, and other parts.
CO2 storage monitoring can be divided into two types: leakage monitoring during injection and long-term migration monitoring after injection. The purpose of leakage monitoring is to prevent the ecological environment damage caused by the overflow of CO2 during the injection process. The long-term migration monitoring after injection is to explore the migration pathway of CO2 and the front of CO2 migration. In the monitoring of the injection process, the direct measurement equipment on the surface and underground is a better choice. For long-term monitoring, a spaceborne InSAR sensor is obviously a better choice due to the limitation of cost and labor.
However, InSAR technology still faces many challenges for CCS monitoring. As an indirect monitoring technology, InSAR monitoring can only detect the migration pathway of CO2 through the response of the surface. Geological data or other monitoring data will be a good supplement and verification. Therefore, on the premise of InSAR monitoring, combined with geological, logging, and other methods of joint monitoring will be the development trend of monitoring in the future. Figure 5 is a feasible multi-method monitoring system. Through underground stress analysis and a well monitoring subsystem, the distribution and migration of CO2 can be determined intuitively, but the result is point distribution. The underground fractures trend and energy distribution can be analyzed by microseismic and other surface monitoring subsystems, so as to obtain planar migration results. The aerospace monitoring subsystem of InSAR and UAV can monitor CO2 migration for a long time and obtain the overall dynamic process of CO2 migration. Various monitoring subsystems complement and confirm each other, efficiently and accurately detect the migration pathway, and realize all-round migration and leakage safety monitoring.
In this study, we selected eight factors affecting InSAR monitoring, mainly considering whether InSAR can effectively monitor the surface deformation caused by CO2 injection. The causes of surface deformation at the storage site are usually diverse. The common interference factors include deformation caused by tectonic activity, production processes, and human activities. The evaluation method we proposed includes most cases as much as possible. For the tectonic activity factors, detailed risk assessment will be conducted during the storage and site selection process. Therefore, the possibility of large-scale tectonic movement in this area is very small, and the stable small-scale surface deformation can be removed through the background value. Therefore, the deformation composed of tectonic activity will not affect the InSAR’s monitoring of surface deformation caused by CO2 injection. For different storage types, the response of surface deformation will be different due to the different lithology of reservoir and caprock, but the response of large-scale commercial storage volume is enough to be detected by InSAR. Therefore, this study only divides the storage types into onshore and offshore. For the corresponding relationship between deformation and different reservoirs, it is necessary to analyze the specific storage site. The deformation caused by the production process is characterized by short deformation time and large deformation value. It can be separated by filtering the time series results, so it will not interfere with the InSAR results. The biggest interference of human activities on InSAR deformation detection is the planting of vegetation or crops. This situation has been discussed in LULC, so it will not be mentioned again.
In addition, the possibilities of leakage are also one of the important factors determining the necessity of monitoring. Since the site selection process of CO2 storage has been carefully evaluated, geological factors are often not the main factor determining the injection leakage risk. The injection method, injection rate, and injection volume also determine the risk of leakage to a certain extent. These factors are reflected in our evaluation model, but some factors are not considered. For example, too many wells also mean more leakage risk, and the sudden change of underground stress will also lead to leakage. However, these factors are not decisive factors and are not included in this evaluation model. Therefore, it is possible to further improve the details of the model in the future.

6. Conclusions

The feasibility assessment of InSAR is a necessary and important step for CCS monitoring. We proposed a new feasibility evaluation model based on the properties of InSAR technology and the characteristics of the sequestration areas. Eight factors were selected as parameters to conduct the feasibility assessment using InSAR in an equal weight method. In addition, this study evaluated the typical completed or ongoing sequestration projects around the world and utilized the research areas that had successful sequestration for verification. Suggestions on whether InSAR technology could be used for monitoring were also provided. Based on the results presented, the following conclusions were reached:
(1)
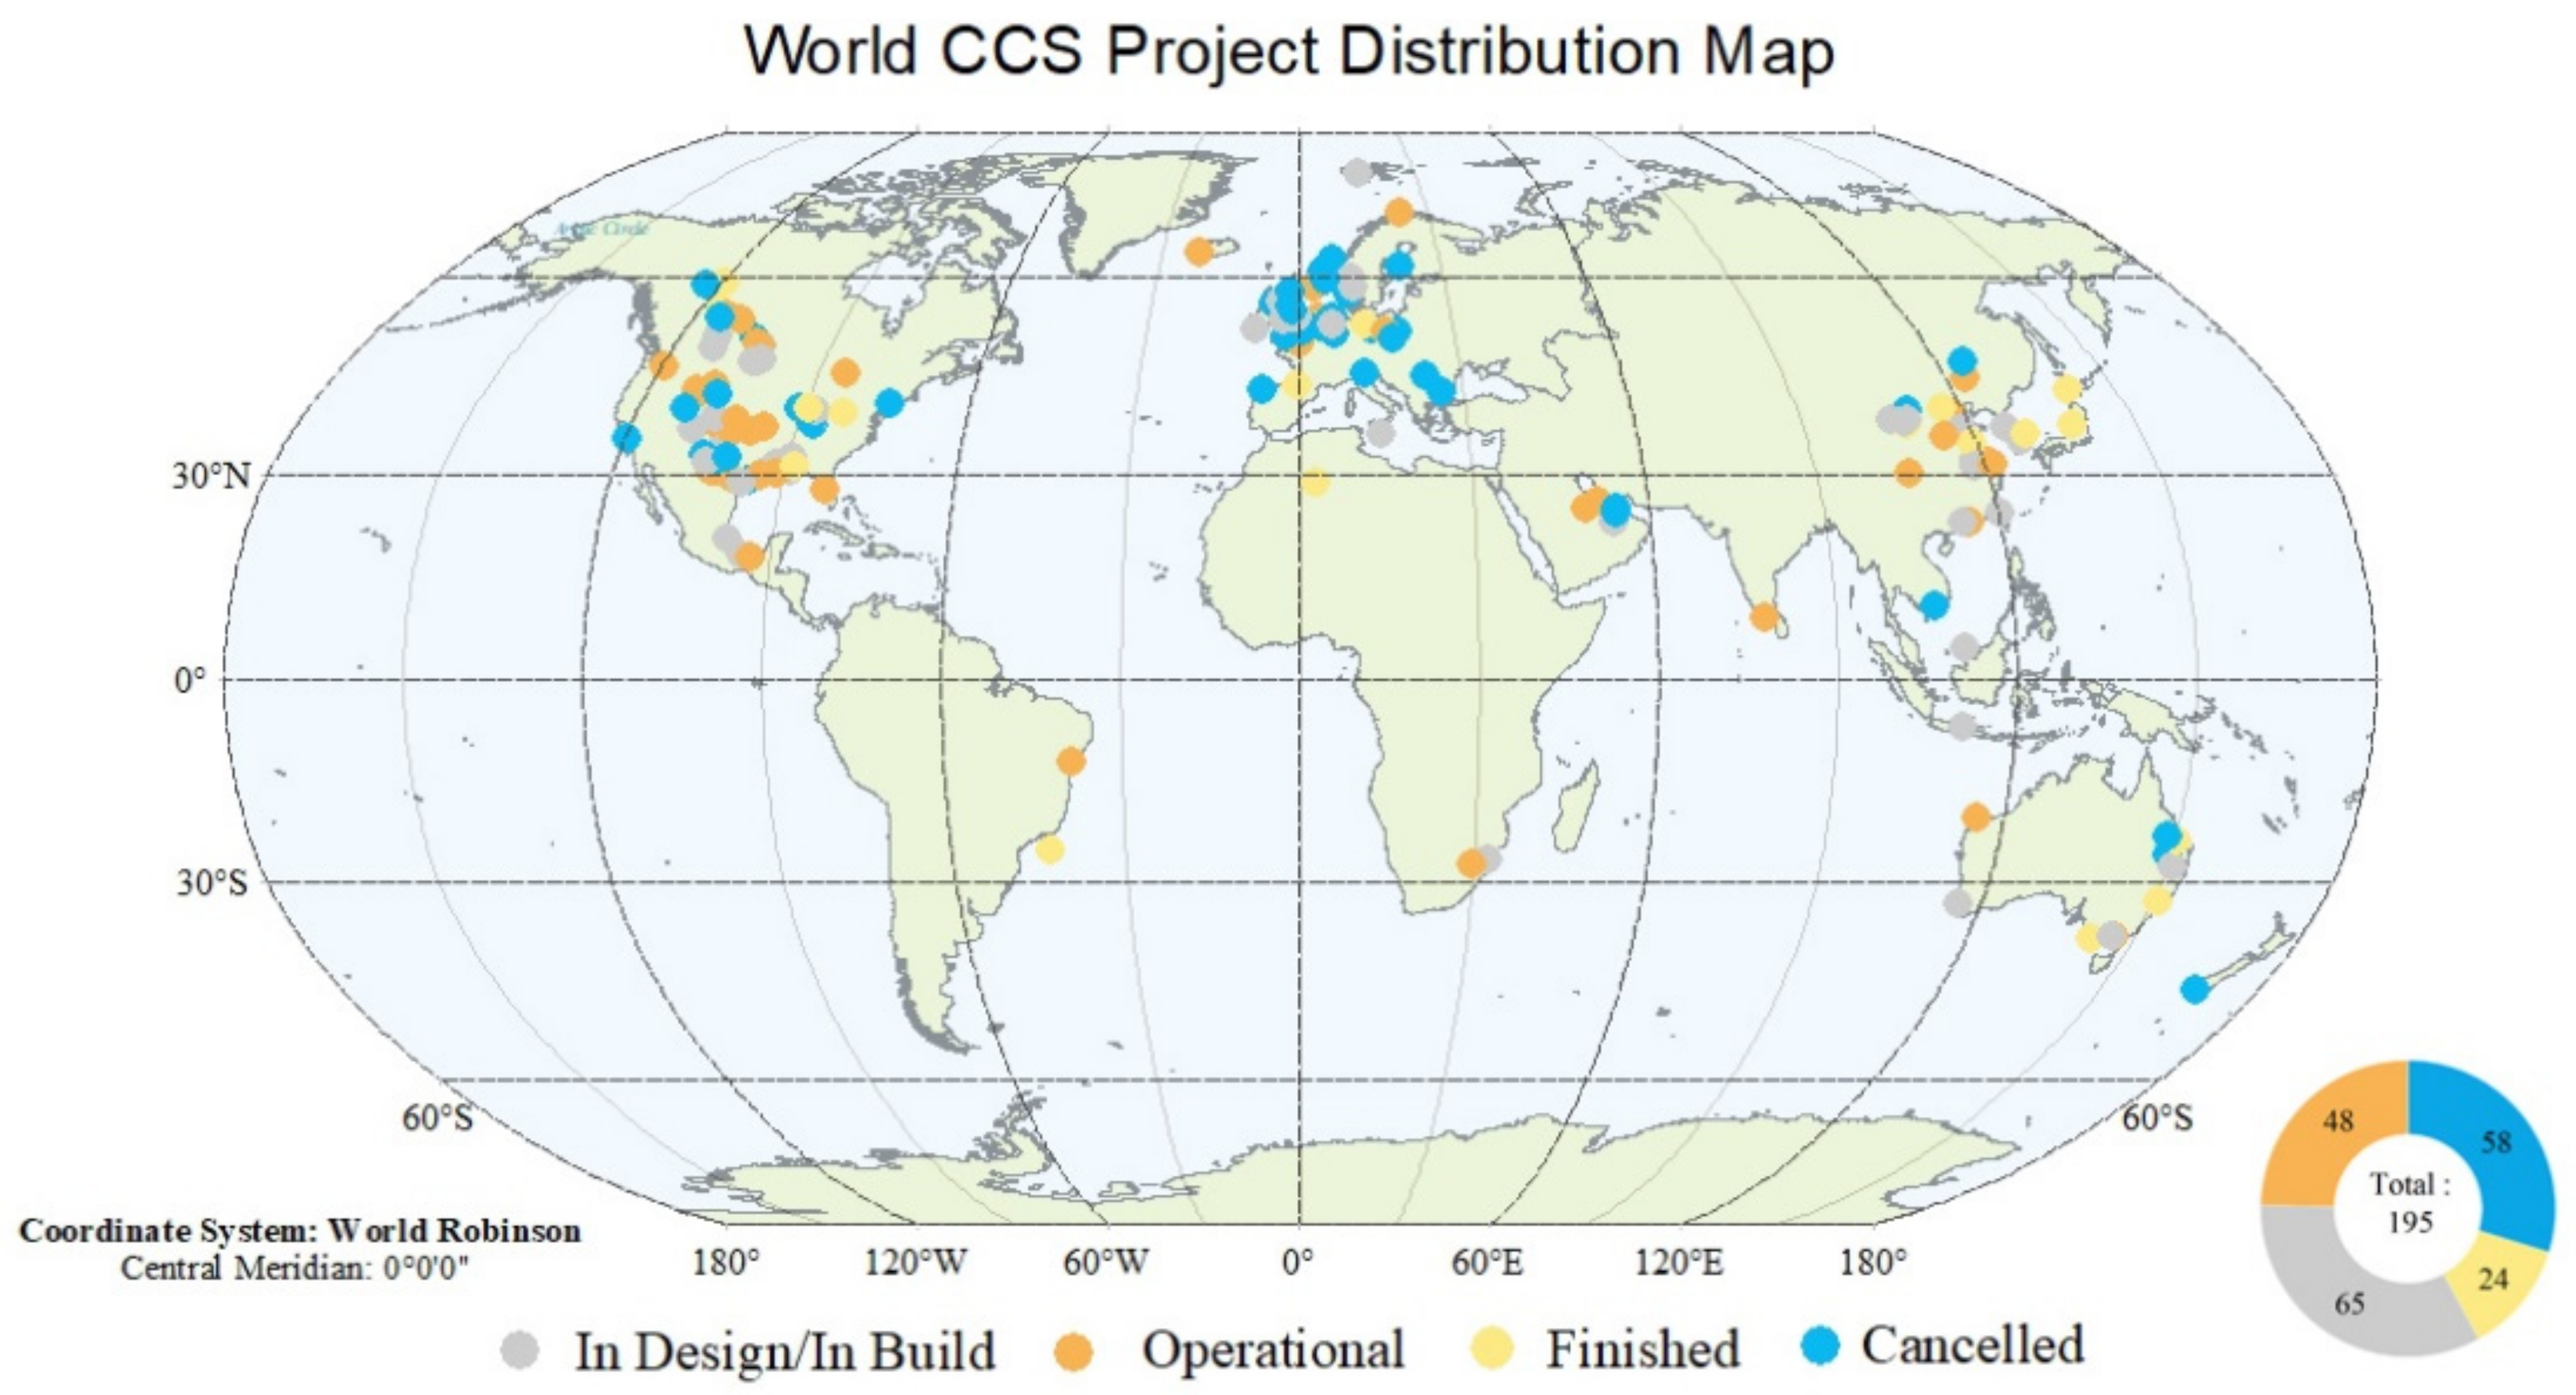
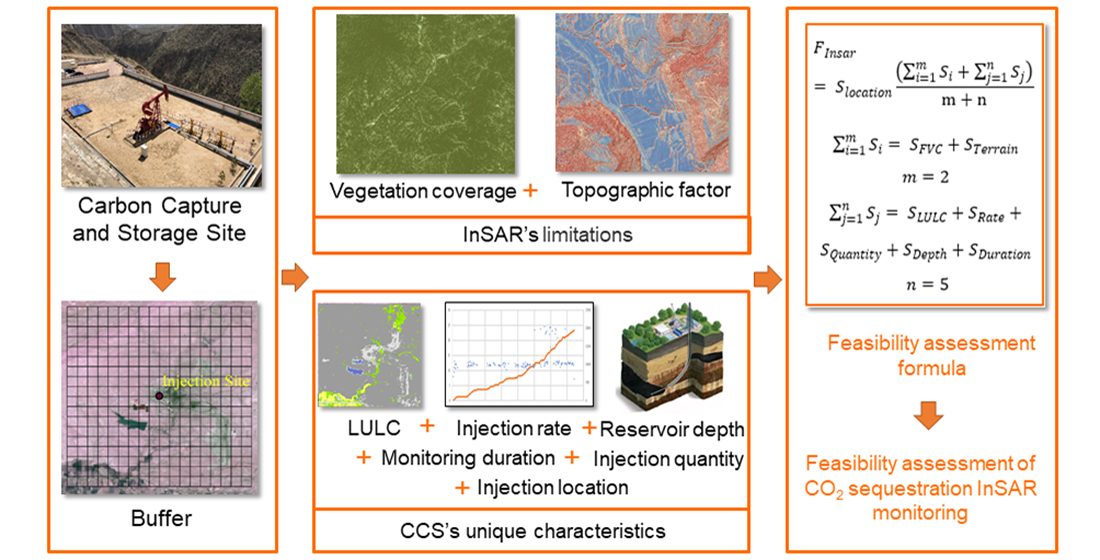
InSAR technology is a potential monitoring method for CCS sequestration leakage and migration, but it is still in its infancy. More than 130 CCS sequestration areas were utilized in this study, but less than 10 were monitored using the InSAR technique. In addition, the results were also uneven. The reasons are complex and varied, but they can be divided into the characteristic limitations of InSAR technology and the special requirements of CCS sequestration. Therefore, a parameter is required to assess whether InSAR monitoring is viable for a specific region.
(2)
InSAR technology still has technical limitations for monitoring surface deformation, especially in complex mountainous areas. Due to safety considerations, CCS storage areas are often built far away from cities, including mountains and deserts. These places are inevitably faced with layout, foreshortening, and other incoherence phenomena, resulting in the absence and inaccuracy of results. In this study, the fractional vegetation cover and R-index were selected to evaluate the influence of vegetation and topography on the results of InSAR, so as to evaluate the feasibility of InSAR.
(3)
The use of InSAR technology also has certain requirements for the injection mode and the injection area. According to limitations in the field design and the injection plan, the injection rate and injection amount of each storage area were different. However, a slow and small amount of injection had an extremely insignificant and irregular response on the surface deformation, and the regular deformation trend could not be identified. Hence, it could not be determined whether CO2 injection was the primary controlling factor of the surface deformation. Therefore, we evaluated the injection volume, injection depth, injection rate, land use/land cover, reservoir type, and monitoring duration. Given the fixed evaluation criteria, we concluded that a large amount and stable injection were suitable for deformation monitoring, so as to realize the feasibility evaluation of InSAR technology in CO2 sequestration areas.
(4)
To comprehensively evaluate the feasibility of InSAR monitoring in CO2 sequestration areas, an evaluation model of the InSAR feasibility was established according to the characteristics of InSAR and the CCS sequestration areas. For a typical injection area or under injection areas, suggestions were made on whether InSAR can be used for monitoring. In addition, the cases of successful application and failure to detect deformation were verified. The cases of successful monitoring and the cases wherein deformation was not accurately detected were both used to validate the evaluation parameters. The results demonstrated that most of the sequestration areas were suitable for the InSAR technique, and the feasibility was consistent with the collected data.
It must be noted that the feasibility assessment equation was based on the successful monitoring cases of InSAR that are currently available. Since there were few cases available for analysis, the weight of each factor requires further consideration. With improvement in the InSAR method, the evaluation method can be changed. Currently, this assessment method is generally applicable to time-series InSAR technologies, such as persistent scatterer InSAR (PS-InSAR) and small baseline subset InSAR (SBAS-InSAR). Similarly, with the improvement in SAR accuracy, different bands of radar will also affect the assessment. The corresponding evaluation model needs to be constantly updated with the technology. However, InSAR technology is worthy of popularization and has extensive application prospects in the field of CCS monitoring in the future.

Author Contributions

T.Z. designed this study. T.Z. performed the data collection, processing, and analysis. D.C. and H.G. optimized the figure for this work. R.Y. provided CCS data for this work. The corresponding author W.Z. is supervisor of this work and contributed with continuous guidance during this work. T.Z. jointly wrote this manuscript, and the manuscript was edited by W.Z. All authors have read and agreed to the published version of the manuscript.

Funding

This study was jointly financed by the National Key R&D Program of China (Grant No. 2018YFB0605603).

Acknowledgments

The authors are grateful to the anonymous reviewers for their constructive comments and suggestions to improve this manuscript.

Conflicts of Interest

The authors declare no conflict of interest.

References

  1. Friedlingstein, P.; O’Sullivan, M.; Jones, M.W.; Andrew, R.M.; Hauck, J.; Olsen, A.; Peters, G.P.; Peters, W.; Pongratz, J.; Sitch, S.; et al. Global Carbon Budget 2020. Earth Syst. Sci. Data 2020, 12, 3269–3340. [Google Scholar] [CrossRef]
  2. Tapia, J.F.D.; Lee, J.Y.; Ooi, R.E.H.; Foo, D.C.Y.; Tan, R.R. A review of optimization and decision-making models for the planning of CO2 capture, utilization and storage (CCUS) systems. Sustain. Prod. Consum. 2018, 13, 1–15. [Google Scholar] [CrossRef]
  3. Zendehboudi, S.; Khan, A.; Carlisle, S.; Leonenko, Y. Ex situ dissolution of CO2: A new engineering methodology based on mass-transfer perspective for enhancement of CO2 sequestration. Energy Fuels 2011, 25, 3323–3333. [Google Scholar] [CrossRef]
  4. Du, J.; Brissenden, S.J.; Mcglllivray, P.; Bourne, S.J.; Hofstra, P.; Davis, E.J.; Roadarmel, W.M.; Wolhart, S.L.; Wright, C.A. Mapping fluid flow in a reservoir using tiltmeter-based surface-deformation measurements. In Proceedings of the SPE Annual Technical Conference and Exhibition, Dallas, TX, USA, 9 October 2005; pp. 25–32. [Google Scholar] [CrossRef]
  5. IEAGHG. Monitoring and Modelling of CO2 Storage: The Potential for Improving the Cost-Benefit Ratio of Reducing Risk; IEAGHG Technical Report 2020–01; IEAGHG: Cheltenham, UK, February 2020. [Google Scholar]
  6. Zhang, T.; Zhang, W.; Yang, R.; Liu, Y.; Jafari, M. CO2 capture and storage monitoring based on remote sensing techniques: A review. J. Clean. Prod. 2021, 281, 124409. [Google Scholar] [CrossRef]
  7. Raziperchikolaee, S.; Cotter, Z.; Gupta, N. Assessing mechanical response of CO2 storage into a depleted carbonate reef using a site-scale geomechanical model calibrated with field tests and InSAR monitoring data. J. Nat. Gas Sci. Eng. 2021, 86, 103744. [Google Scholar] [CrossRef]
  8. Loschetter, A.; Rohmer, J.; Raucoules, D.; De Michele, M. Sizing a geodetic network for risk-oriented monitoring of surface deformations induced by CO2 injection: Experience feedback with InSAR data collected at In-Salah, Algeria. Int. J. Greenh. Gas Control 2015, 42, 571–582. [Google Scholar] [CrossRef]
  9. Peltier, A.; Froger, J.L.; Villeneuve, N.; Catry, T. Assessing the reliability and consistency of InSAR and GNSS data for retrieving 3D-displacement rapid changes, the example of the 2015 Piton de la Fournaise eruptions. J. Volcanol. Geotherm. Res. 2017, 344, 106–120. [Google Scholar] [CrossRef]
  10. Radutu, A.; Nedelcu, I.; Gogu, C.R. An overview of ground surface displacements generated by groundwater dynamics, revealed by InSAR techniques. Procedia Eng. 2017, 209, 119–126. [Google Scholar] [CrossRef]
  11. Bohloli, B.; Bjørnarå, T.I.; Park, J.; Rucci, A. Can we use surface uplift data for reservoir performance monitoring? A case study from In Salah, Algeria. Int. J. Greenh. Gas Control 2018, 76, 200–207. [Google Scholar] [CrossRef]
  12. Rutqvist, J.; Vasco, D.W.; Myer, L. Coupled reservoir-geomechanical analysis of CO2 injection and ground deformations at In Salah, Algeria. Int. J. Greenh. Gas Control 2010, 4, 225–230. [Google Scholar] [CrossRef] [Green Version]
  13. Mathieson, A.; Wright, I.; Roberts, D.; Ringrose, P. Satellite imaging to monitor CO2 movement at Krechba, Algeria. Energy Procedia 2009, 1, 2201–2209. [Google Scholar] [CrossRef] [Green Version]
  14. Vasco, D.W.; Rucci, A.; Ferretti, A.; Novali, F.; Bissell, R.C.; Ringrose, P.S.; Mathieson, A.S.; Wright, I.W. Satellite-based measurements of surface deformation reveal fluid flow associated with the geological storage of carbon dioxide. Geophys. Res. Lett. 2010, 37. [Google Scholar] [CrossRef] [Green Version]
  15. Yunjun, Z.; Fattahi, H.; Amelung, F. Small baseline InSAR time series analysis: Unwrapping error correction and noise reduction. Comput. Geosci. 2019, 133, 104331. [Google Scholar] [CrossRef] [Green Version]
  16. Onuma, T.; Ohkawa, S. Detection of surface deformation related with CO2 injection by DInSAR at In Salah, Algeria. Energy Procedia 2009, 1, 2177–2184. [Google Scholar] [CrossRef] [Green Version]
  17. Yang, Q.; Zhao, W.; Dixon, T.H.; Amelung, F.; Han, W.S.; Li, P. InSAR monitoring of ground deformation due to CO2 injection at an enhanced oil recovery site, West Texas. Int. J. Greenh. Gas Control 2015, 41, 20–28. [Google Scholar] [CrossRef] [Green Version]
  18. Guo, S.; Zheng, H.; Yang, Y.; Zhang, S.; Hou, H.; Zhu, Q.; Du, P. Spatial estimates of surface deformation and topsoil moisture in operating CO2-EOR project: Pilot environmental monitoring using SAR technique. J. Clean. Prod. 2019, 236, 117606. [Google Scholar] [CrossRef]
  19. Samsonov, S.; Czarnogorska, M.; White, D. Satellite interferometry for high-precision detection of ground deformation at a carbon dioxide storage site. Int. J. Greenh. Gas Control 2015, 42, 188–199. [Google Scholar] [CrossRef]
  20. Shi, J.; Yang, H.; Peng, J.; Wu, L.; Xu, B.; Liu, Y.; Zhao, B. InSAR Monitoring and Analysis of Ground Deformation Due to Fluid or Gas Injection in Fengcheng Oil Field, Xinjiang, China. J. Indian Soc. Remote Sens. 2019, 47, 455–466. [Google Scholar] [CrossRef]
  21. Li, Z.; Duan, M.; Cao, Y.; Mu, M.; He, X.; Wei, J. Mitigation of time-series InSAR turbulent atmospheric phase noise: A review. Geod. Geodyn. 2022, 1–11. [Google Scholar] [CrossRef]
  22. Gabriel, A.K.; Goldstein, R.M.; Zebker, H.A. Mapping small elevation changes over large areas: Differential radar interferometry. J. Geophys. Res. 1989, 94, 9183–9191. [Google Scholar] [CrossRef]
  23. Bai, Z.; Fang, S.; Gao, J.; Zhang, Y.; Jin, G.; Wang, S.; Zhu, Y.; Xu, J. Could Vegetation Index be Derive from Synthetic Aperture Radar?—The Linear Relationship between Interferometric Coherence and NDVI. Sci. Rep. 2020, 10, 6749. [Google Scholar] [CrossRef] [Green Version]
  24. Gao, L.; Wang, X.; Johnson, B.A.; Tian, Q.; Wang, Y.; Verrelst, J.; Mu, X.; Gu, X. Remote sensing algorithms for estimation of fractional vegetation cover using pure vegetation index values: A review. ISPRS J. Photogramm. Remote Sens. 2020, 159, 364–377. [Google Scholar] [CrossRef]
  25. Jia, K.; Liang, S.; Liu, S.; Li, Y.; Xiao, Z.; Yao, Y. Global Land Surface Fractional Vegetation Cover Estimation Using General Regression Neural Networks From MODIS Surface Reflectance. IEEE Trans. Geosci. Remote Sens. 2015, 53, 4787–4796. [Google Scholar] [CrossRef]
  26. Colesanti, C.; Wasowski, J. Investigating landslides with space-borne Synthetic Aperture Radar (SAR) interferometry. Eng. Geol. 2006, 88, 173–199. [Google Scholar] [CrossRef]
  27. Cigna, F.; Bateson, L.B.; Jordan, C.J.; Dashwood, C. Simulating SAR geometric distortions and predicting Persistent Scatterer densities for ERS-1/2 and ENVISAT C-band SAR and InSAR applications: Nationwide feasibility assessment to monitor the landmass of Great Britain with SAR imagery. Remote Sens. Environ. 2014, 152, 441–466. [Google Scholar] [CrossRef] [Green Version]
  28. Notti, D.; Davalillo, J.C.; Herrera, G.; Mora, O. Assessment of the performance of X-band satellite radar data for landslide mapping and monitoring: Upper Tena Valley case study. Nat. Hazards Earth Syst. Sci. 2010, 10, 1865–1875. [Google Scholar] [CrossRef]
  29. Dai, Z.; Viswanathan, H.; Xiao, T.; Middleton, R.; Pan, F.; Ampomah, W.; Yang, C.; Zhou, Y.; Jia, W.; Lee, S.Y.; et al. CO2 Sequestration and Enhanced Oil Recovery at Depleted Oil/Gas Reservoirs. Energy Procedia 2017, 114, 6957–6967. [Google Scholar] [CrossRef]
  30. Mukherjee, M.; Misra, S. A review of experimental research on Enhanced Coal Bed Methane (ECBM) recovery via CO2 sequestration. Earth-Sci. Rev. 2018, 179, 392–410. [Google Scholar] [CrossRef]
  31. Jayasekara, D.W.; Ranjith, P.G.; Wanniarachchi, W.A.M.; Rathnaweera, T.D. Understanding the chemico-mineralogical changes of caprock sealing in deep saline CO2 sequestration environments: A review study. J. Supercrit. Fluids 2020, 161, 104819. [Google Scholar] [CrossRef]
  32. Li, Q.; Wu, Z.; Li, X. Prediction of CO2 leakage during sequestration into marine sedimentary strata. Energy Convers. Manag. 2009, 50, 503–509. [Google Scholar] [CrossRef]
  33. Xiong, Z.; Li, T.; Crosta, X.; Algeo, T.; Chang, F.; Zhai, B. Potential role of giant marine diatoms in sequestration of atmospheric CO2 during the Last Glacial Maximum: δ13C evidence from laminated Ethmodiscus rex mats in tropical West Pacific. Glob. Planet. Change 2013, 108, 1–14. [Google Scholar] [CrossRef]
  34. Ren, Y.; Lü, Y.; Comber, A.; Fu, B.; Harris, P.; Wu, L. Spatially explicit simulation of land use/land cover changes: Current coverage and future prospects. Earth-Sci. Rev. 2019, 190, 398–415. [Google Scholar] [CrossRef]
  35. NRSCC. Global Ecosystems and Environment Observation Analysis Report Cooperation (GEOARC) 2017; NRSCC: Beijing, China, 2017. [Google Scholar]
  36. Cao, D.; Zhang, J.; Xun, L.; Yang, S.; Wang, J.; Yao, F. Spatiotemporal variations of global terrestrial vegetation climate potential productivity under climate change. Sci. Total Environ. 2021, 770, 145320. [Google Scholar] [CrossRef]
  37. Sreejith, K.M.; Agrawal, R.; Agram, P.; Rajawat, A.S. Surface deformation of the Barren Island volcano, Andaman Sea (2007–2017) constrained by InSAR measurements: Evidence for shallow magma reservoir and lava field subsidence. J. Volcanol. Geotherm. Res. 2020, 407, 107107. [Google Scholar] [CrossRef]
  38. Abdel-Hamid, A.; Dubovyk, O.; Greve, K. The potential of sentinel-1 InSAR coherence for grasslands monitoring in Eastern Cape, South Africa. Int. J. Appl. Earth Obs. Geoinf. 2021, 98, 102306. [Google Scholar] [CrossRef]
  39. Teng, Y.; Liu, Y.; Lu, G.; Jiang, L.; Wang, D.; Song, Y. Experimental Evaluation of Injection Pressure and Flow Rate Effects on Geological CO2 Sequestration Using MRI. Energy Procedia 2017, 114, 4986–4993. [Google Scholar] [CrossRef]
  40. Zheng, Y.; Liu, J.; Zhang, B. The Influence of Geological Storage of Carbon Dioxide on Deformation of Ground Surface in Depleted Reservoirs. J. Hebei Geo Univ. 2019, 2, 1–6. [Google Scholar] [CrossRef]
  41. Schaef, H.T.; McGrail, B.P.; Owen, A.T. Basalt reactivity variability with reservoir depth in supercritical CO2 and aqueous phases. Energy Procedia 2011, 4, 4977–4984. [Google Scholar] [CrossRef] [Green Version]
  42. Murdoch, L.C.; Germanovich, L.N.; DeWolf, S.J.; Moysey, S.M.J.; Hanna, A.C.; Kim, S.; Duncan, R.G. Feasibility of using in situ deformation to monitor CO2 storage. Int. J. Greenh. Gas Control 2020, 93, 102853. [Google Scholar] [CrossRef]
  43. Hannis, S.; Lu, J.; Chadwick, A.; Hovorka, S.; Kirk, K.; Romanak, K.; Pearce, J. CO2 Storage in Depleted or Depleting Oil and Gas Fields: What can We Learn from Existing Projects? Energy Procedia 2017, 114, 5680–5690. [Google Scholar] [CrossRef]
Figure 1. CCS project distribution map.
Energies 15 00672 g001
Figure 2. The graphs show the vegetation coverage of Salah, Jingbian, and Ketzin. The base map is the true color composite image of LANDSAT 8 OLI. (a1c1) show the location of the injection wells and their buffers in the study area. (a2c2) show their corresponding FVC index with a resolution of 500 m. (a3c3) illustrate the proportion of the vegetation coverage classification in each study area, and their S F V C scores.
Energies 15 00672 g002
Figure 3. The graphs show the topographic parameters of Shizhuang, Shaanxi Province, China. (a) shows the DEM extracted using a UAV. (b) and (c) show the slope and aspect parameters extracted from the DEM. (d) illustrates the R I n d e x of the injection area and the S t e r r a i n score calculated from the distribution.
Energies 15 00672 g003
Figure 4. The graphs show the LULC of Scurry and San Juan. The base map is the true color composite image of LANDSAT 8 OLI. (a1,b1) show the location of the injection wells and their buffers in the study area. (a2,b2) show their LULC classification with a resolution of 30 m. (a3,b3) illustrate the proportion of the LULC classification in each study area, and the calculated S L U L C score.
Energies 15 00672 g004
Figure 5. A multi-method monitoring system.
Energies 15 00672 g005
Table 1. The assessment rules for the fractional vegetation cover (FVC).
FVCSurface Type S F V C Score
0–0.1Barren1.0
0.1–0.3Low coverage0.8
0.3–0.45Medium-low coverage0.6
0.45–0.6Medium coverage0.4
0.6–1High coverage0.2
Table 2. The assessment rules of the R I n d e x .
R I n d e x Classes Pixel Compression S T e r r a i n Score
≤0Layout/foreshortening 0
0–0.3High–bad slope0.25
0.3–0.6Medium slope0.5
0.6–0.8Low good slope0.75
>0.8Very low good slope1
Table 3. The assessment rules of the reservoir location.
Reservoir Location S l o c a t i o n Score
Onshore1
Offshore0
Table 4. The assessment rules of the land use/land cover (LULC).
Applicability of InSAR TechniqueNRSCC Classification S l u l c Score
Very suitableBare land 1.0
SuitableGrassland0.8
Impervious surface
Suspectable/As appropriateForest0.5
Tundra
Cropland
Shrubland
Not suitableWater0
Wetland
Snow and Ice
Table 5. The assessment rules of the injection rate.
Injection Rate (m3/Day) S R a t e Score
<300.2
30–1500.4
150–20000.6
2000–80000.8
>80001
Table 6. The assessment rules of the injection quantity.
Total Injection Quantity (Mt) S Q u a n t i t y Score
<0.010.2
0.01–0.10.4
0.01–0.050.6
0.05–1.00.8
>1.01
Table 7. The assessment rules of the reservoir depth.
Reservoir Depth (km) S D e p t h Score
0.5–1.51
1.5–2.50.8
2.5–40.6
>40.4
Table 8. The assessment rules of the monitoring duration.
Duration (Year) S D u r a t i o n Score
<10.5
1–30.8
3–51.0
>50.8
Table 9. The assessment rules of feasibility.
F I n s a r Score Feasibility
0Not applicable
0.1–0.3May be applicable
0.3–0.6Applicable
0.6–0.9Strongly applicable
0.9–1.0Highly recommended
Table 10. Typical global CCS area parameters and feasibility assessment.
Project NameReservoir LocationVegetation CoverageTopographic FactorLULCInjection Rate (m3/Day)Total Injection (Mt)Reservoir Depth (km)Duration (Year)CountryScaleStatus F I n s a r
Al ReyadahOnshore
(54.47, 24.32)
Medium-low coverageVery low good slopeBare land1,170,0001.62.52United Arab EmiratesCommercialOperational0.912
FrioOnshore
(−94.80, 30.00)
Medium-low coverageVery low good slopeForest87,2001.41.54USACommercialFinished0.881
Shizhuang ECBM PilotOnshore
(112.71, 35.87)
Low coverageMedium slopeCropland54500.0250.72ChinaPilot Operational 0.718
In SalahOnshore
(2.82, 28.64)
BarrenVery low good slopeBare land1,792,00014.01.87AlgeriaCommercialFinished0.993
KetzinOnshore
(12.87, 52.49)
High coverageLow good slopeCropland54,5000.060.73GermanyPilotFinished0.756
Lanxes Newcastle Onshore
(29.97, −27.78)
BarrenVery low good slopeBare land92,6500.121.02South AfricaPilot Operational 0.930
Lotte CCUS ProjectOffshore
(−1.11, 54.58)
///////UKPilot In Design0
Otway BasinOnshore
(150.63, −24.33)
Low coverageLow good slopeImpervious surface81,7500.0752.010AustraliaPilotFinished0.842
PEMEX EOR PilotOnshore
(−94.56, 18.00)
Medium coverageMedium slopeImpervious surface50,0000.51.81MexicoCommercialIn Design0.522
Ras Laffan Onshore
(51.54, 25.91)
BarrenLow good slopeBare land300,0002.11.01QatarCommercial Operational0.656
RECOPOLOnshore
(16.84, 51.47)
Medium-low Medium slopeCropland5100.00011.11PolandPilot Operational0.699
ROADOffshore
(4.02, 51.96)
///////Netherlands PilotFinished 0
San JuanOnshore
(−108.44, 36.80)
BarrenVery low good slopeBare land21000.1040.85USACommercial Finished 0.815
Shenhua Ordos PilotOnshore
(110.15, 39.33)
Low coverageLow good slopeImpervious surface60,0000.32.73ChinaPilotFinished0.632
SleipnerOffshore
(3.00, 58.41)
///////NorwayCommercialFinished 0
Tomakomai CCS ProjectOffshore
(141.65, 42.63)
///////JapanCommercialFinished0
LacqOnshore
(−0.67, 43.44)
Low coverageVery low good slopeGrassland109,0000.0124.52FranceCommercialOperational0.843
Uthmaniyah EOR ProjectOnshore
(49.36, 24.80)
BarrenVery low good slopeBare land1,274,0004.03.65Saudi ArabiaPilot Operational 0.883 
West Texas Scurry fieldOnshore
(−101.09, 32.07)
Low coverageLow good slopeGrassland90,00055.02.035USACommercial Finished 0.712
Weyburn CO2 ProjectOnshore
(−103.68, 49.51)
BarrenLow good slopeGrassland7,085,00025.01.515CanadaCommercialOperational0.832
Yangchang Jingbian Onshore
(108.91, 37.42)
Low coverageMedium slopeGrassland70000.0053.05ChinaPilotFinished0.694
Youngil Bay Offshore
(129.46, 36.06)
///////South KoreaPilot Finished 0
Publisher’s Note: MDPI stays neutral with regard to jurisdictional claims in published maps and institutional affiliations.

