Article

Effects of Cofiring Coal and Biomass Fuel on the Pulverized Coal Injection Combustion Zone in Blast Furnaces

1
Green Materials and Processes R&D Group, Korea Institute of Industrial Technology, Ulsan 44413, Korea
2
School of Mechanical Engineering, Pusan National University, Busan 46241, Korea
*
Authors to whom correspondence should be addressed.
These authors contributed equally to this work and should be regarded as co-first authors.
Energies 2022, 15(2), 655; https://doi.org/10.3390/en15020655
Submission received: 27 December 2021 / Revised: 13 January 2022 / Accepted: 14 January 2022 / Published: 17 January 2022

Abstract

:
CO2 emissions are a major contributor to global warming. Biomass combustion is one approach to tackling this issue. Biomass is used with coal combustion in thermal power plants or with blast furnaces (BFs) because it is a carbon-neutral fuel; therefore, biomass provides the advantage of reduced CO2 emissions. To examine the effect of co-firing on pulverized coal injection (PCI) in BFs, two coals of different ranks were blended with the biomass in different proportions, and then their combustion behaviors were examined using a laminar flow reactor (LFR). The PCI combustion primarily functions as a source of heat and CO to supply the upper part of the BF. To create a similar PCI combustion environment, the LFR burner forms a diffusion flat flame with an oxygen concentration of 26% with a flame temperature of ~2000–2250 K at a heating rate of 105 K/s. The combustion characteristics, such as the flame structure, burning coal particle temperature, unburned carbon (UBC), and CO and CO2 emissions were measured to evaluate their effect on PCI combustion. With the increase in the biomass blending ratio, the brightness of the volatile cloud significantly increased, and the particle temperature tended to decrease. The fragmentation phenomenon, which was observed for certain coal samples, decreased with the increase in the biomass blending ratio. In particular, with an increase in the biomass blending ratio, the optimum combustion point occurred, caused by the fragmentation of coal and volatile gas combustion of biomass.

1. Introduction

At the 2015 Paris Conference of the Parties on Climate Change, the South Korean government joined most countries in agreeing to reduce greenhouse emissions (GHGs) [1]. South Korea committed to a 37% reduction in GHGs from business-as-usual (BAU) levels by 2030. The steel and thermal power generation industries are the largest energy-consuming industries worldwide. Because of their high energy consumption, these industries are consistently affected by issues regarding fuel consumption and CO2 emissions. CO2 emissions occur during the reduction of iron ore in blast furnaces (BFs), and the complete combustion of coal occurs in thermal power plant boilers. The operators of one Korean thermal power plant are attempting to reduce CO2 emissions using various methods such as combusting biomass, reducing the fuel consumption ratio, and increasing the renewable energy ratio. Among these technologies, biomass is extensively used in thermal power plants. Five thermal power plants in South Korea use a 3–5% biomass mix with coal to reduce CO2 emissions; this technology is known as co-combustion. Because biomass fuel is carbon neutral, the co-combustion of biomass is an important technology for reducing CO2 emissions in thermal power plants and BFs [2,3]. Biomass (such as wood) absorbs CO2 during growth, which is subsequently released during combustion. Therefore, blending coal with biomass fuels can reduce CO2 emissions. As per a previous study [4,5], using a high-quality fuel and a large BF volume can reduce CO2 emissions and costs. Multiple studies explored biomass charcoal injection via tuyeres to replace the pulverized coal. Charcoal injection was employed in small charcoal pieces in Brazil with an injection rate of 100–190 kg/tHM [6,7]. Solid biomass is a potential substitute for coals and can be partially used for pulverized coal injection (PCI) without increasing the CO2 emissions in the atmosphere. However, biomass has a lower energy density and higher moisture content compared to coal. Moreover, it is difficult to pulverize because of its lignocellulosic nature. The energy for grinding coal can be saved if torrefied biomass and biochar are used for the PCI. Du et al. [8] examined the utility potential of pretreated biomass in BFs and their fuel properties, including the fuel ratio and ignition temperature, using bamboo, oil palm, and rice husks. Intensifying the extent of pretreatment significantly increased the fuel ratio and ignition temperature of biomass but decreased burnout. Researchers concluded that biomass torrefied at 300 °C or carbonized at temperatures of <500 °C can be blended with coals for PCI. Bridgeman et al. [9] examined raw and torrefied willow exposed to a methane–air flame and reported that the torrefied fuel was more rapidly ignited than raw fuel. Wijayanta et al. [10] reported that biochar required a longer raceway than the reference coal and that controlling the particle size could increase combustibility. The volatile matter PCI combustion produced high amounts of CO2 gas and affected the coal or char reactivity. Many researchers [11,12,13,14,15,16] examined the coal or char reactivity in CO2 diluents. Saastamoinen et al., Rathnam et al., Borrego et al., Žajdlík et al., and Rathnam et al. [11,13,14,15] explored the positive roles of CO2 diluents. CO2 plays a significant role under low O2 levels and high temperature conditions, and it promotes the development of micropores. These resulted in significant carbon loss in the following char–CO2 reaction; however, certain researchers [12,16] reported the negative roles of CO2. They suggested that the O2 diffusion rate in particles is low, the volatile consumption rate is low because of the relatively low diffusivity of volatiles in CO2, and the char temperature is reduced because of the endothermic effect of char.
This study aims to examine the effect of blends of coal and biomass and char–CO2 gasification reactivity in PCI system environments. In this study, the pulverized coal combustion environment within the BF was simulated in terms of reaction temperature and oxygen concentration. The combustion characteristics of coal particles, as per the change in residence time, were analyzed in a laminar-flow reactor (LFR). The experimental conditions for this study were as follows: oxygen concentration (26%) and flame temperature (~2000–2250 K). Coal and biomass particles with a size of 75–90 µm were then injected, and changes in the residence time, particle temperature, and CO and CO2 gas productions were measured. In addition to the effect of co-firing on the BF, two types of differently ranked coals and biomass blending cases were examined. Considering the contemporary steelworks trends on the recent diversification of fuels in blast furnaces, this study can provide a guide for the use of coal-biomass cofiring in blast furnaces.

2. Experimental Section

2.1. Coal and Biomass Samples Preparation
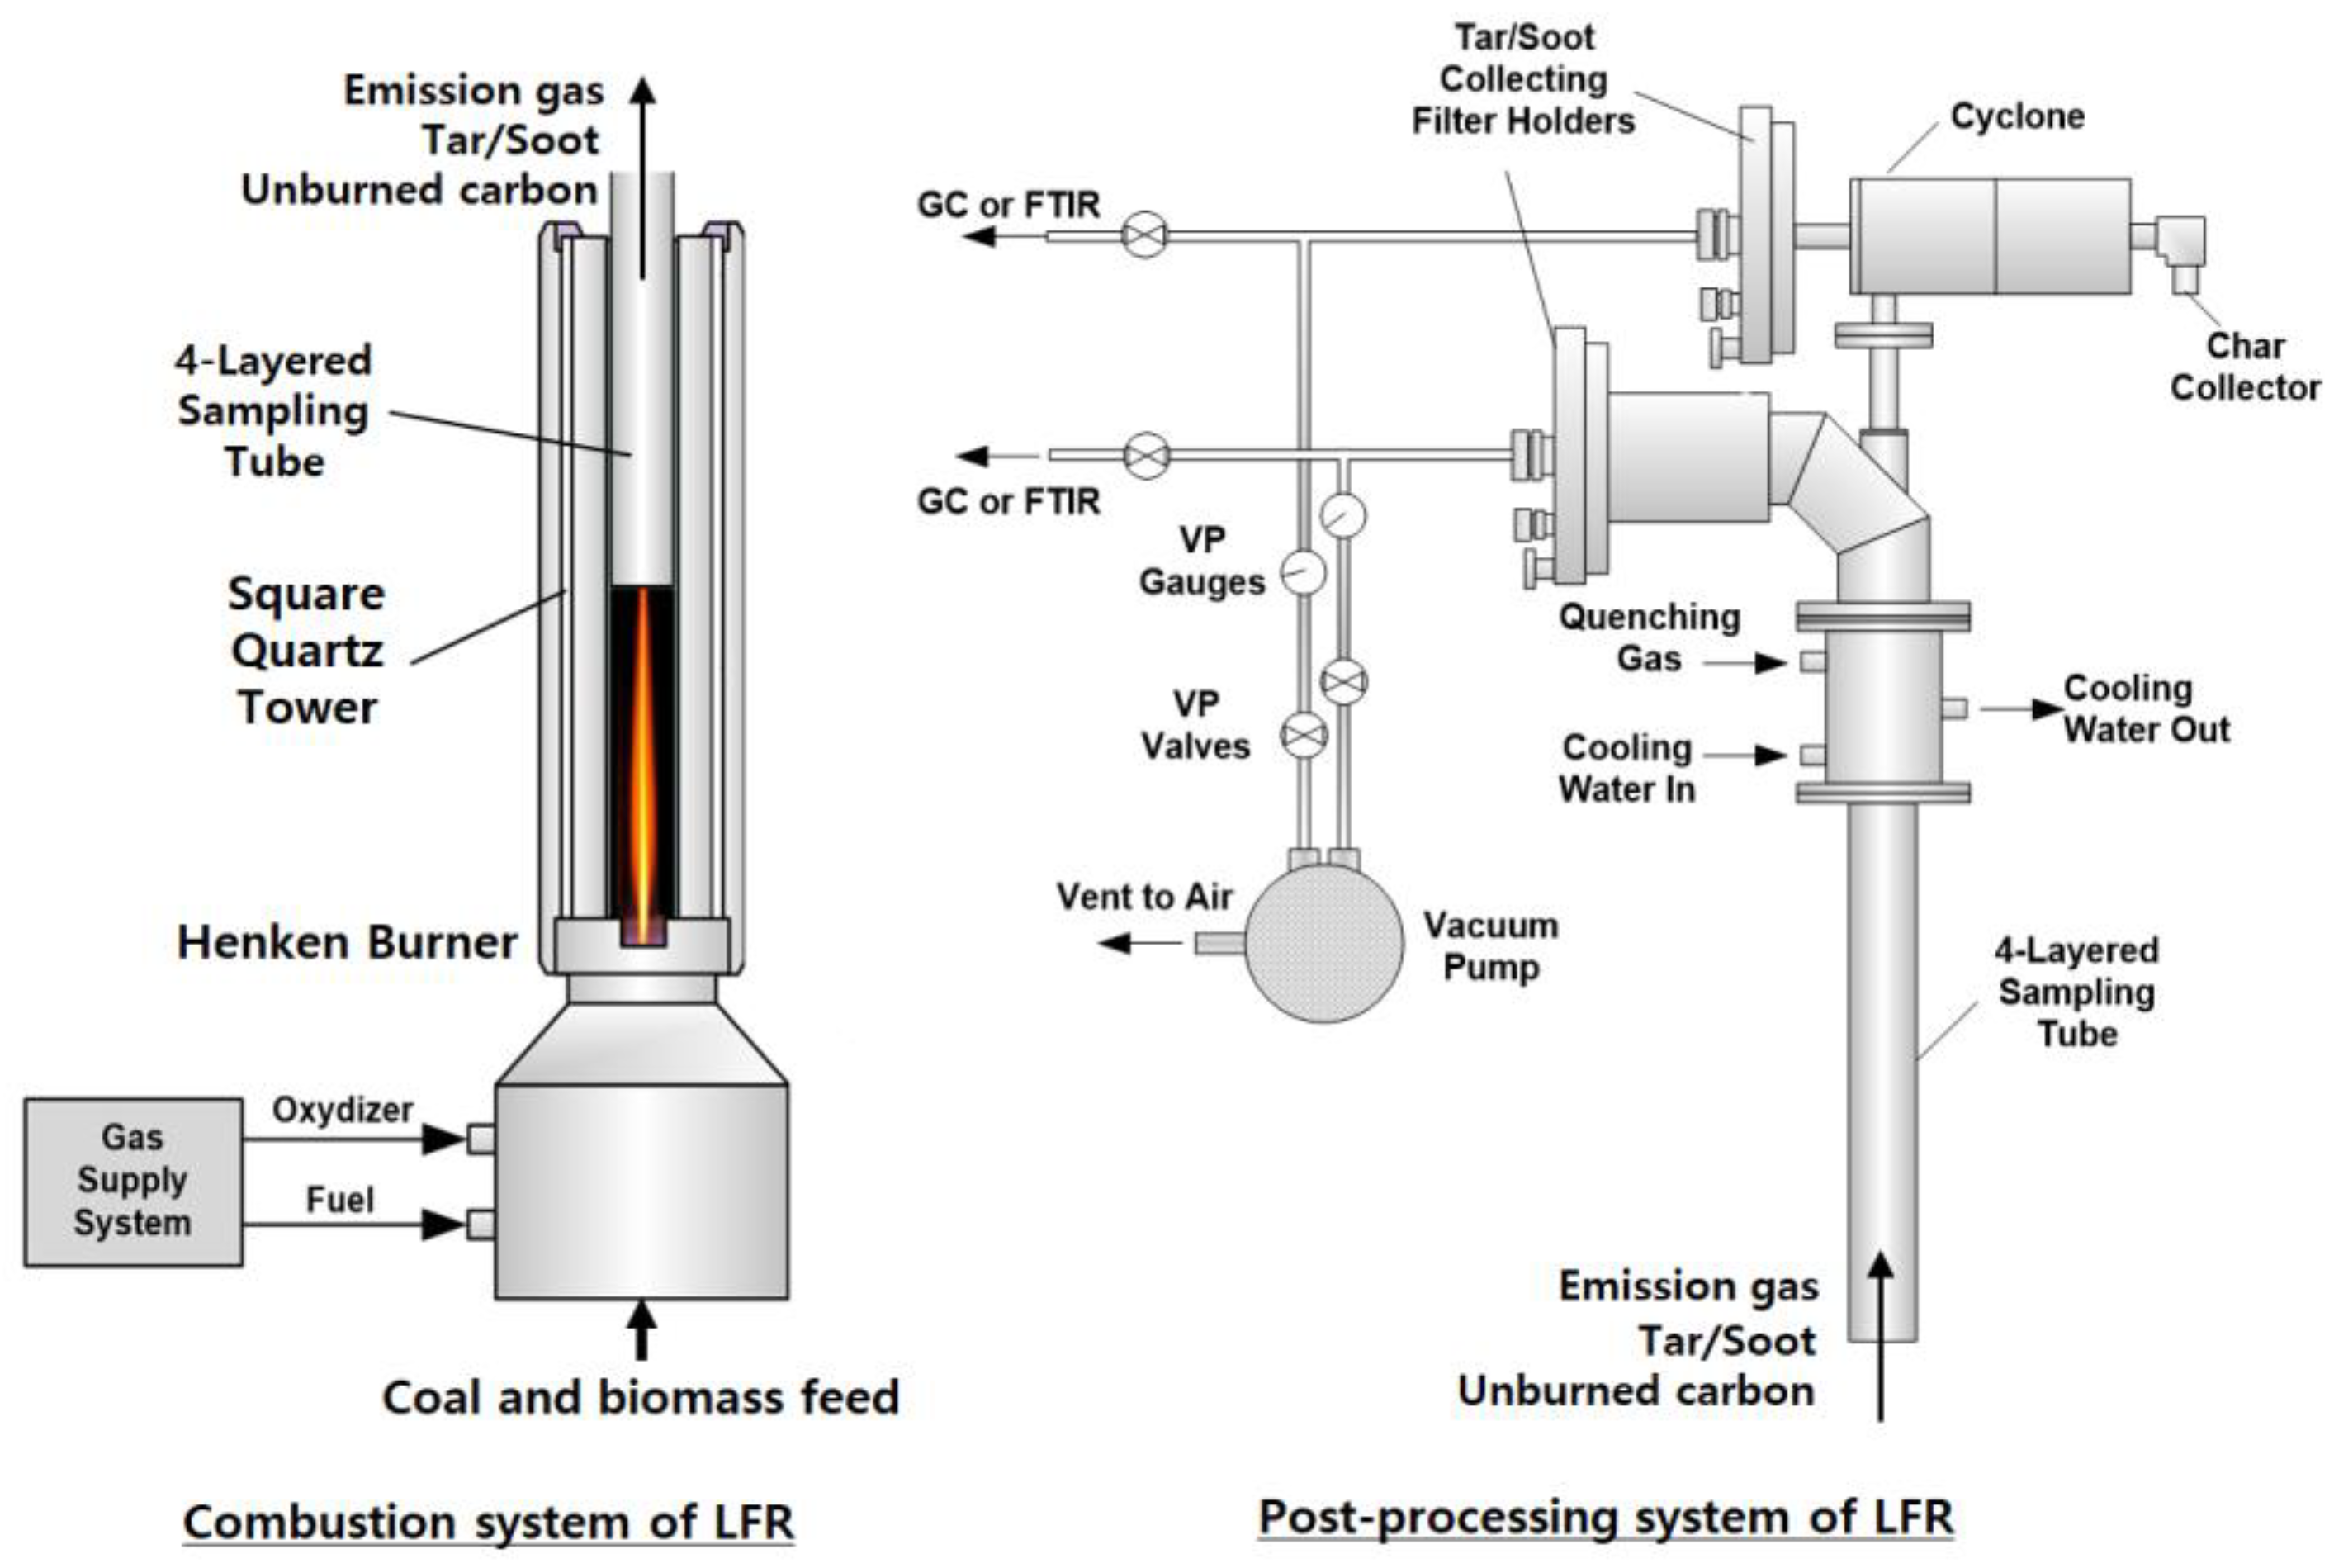
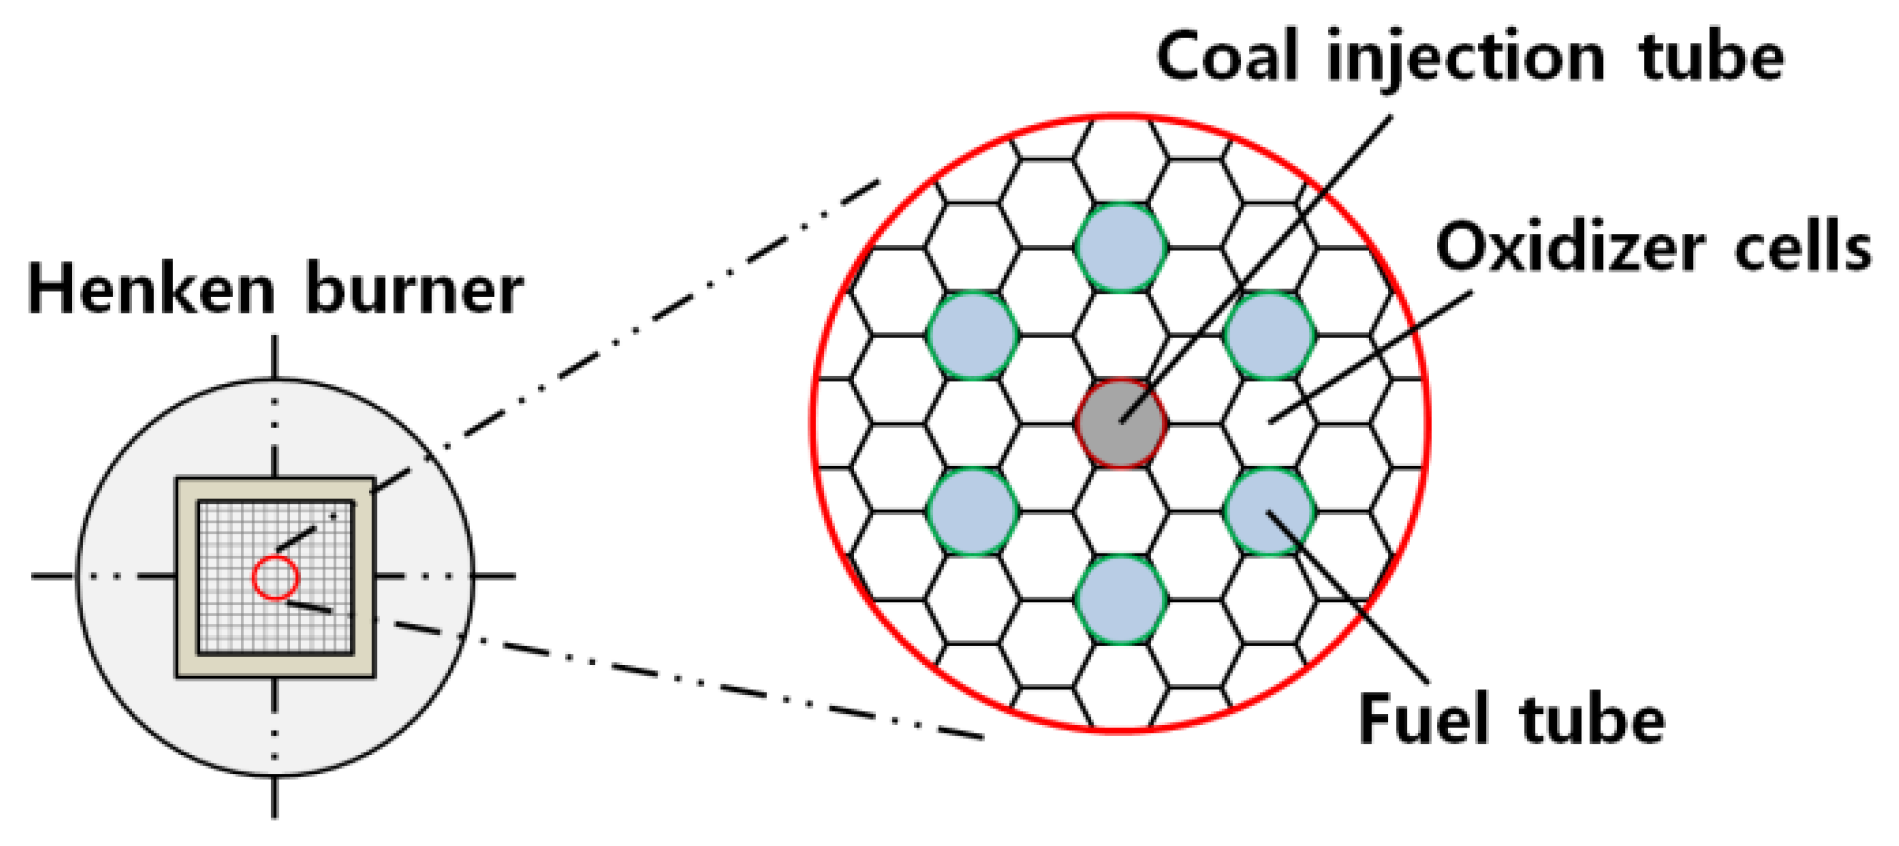
Two types of coal were chosen for this study, an Indonesian sub-bituminous coal (Coal A), an Australian bituminous coal (Coal B) and Malaysian wood pellet biomass was used. The samples after the drying procedure were pulverized using a vibratory disc mill (RS 200, Retsch GmbH, Haan, Germany) and sorted by size using a sieve shaker (AS 200, Retsch GmbH, Haan, Germany) to produce a particle size of 75 to 90 μm. Proximate analysis was conducted on a 5 g sample using a thermogravimetric analyzer (TGA 701, LECO Co., St. Joseph, MI, USA). The ultimate analysis using a commercial element analyzer was conducted (Leco-TruSpec Micro CHNS, LECO Co., St. Joseph, MI, USA).

2.2. LFR

The experiments were performed in an LFR system designed and fabricated by Pusan Clean Coal Center (PC3) in the Pusan National University [17]. An LFR is a device that can simulate a PCI system environment in a BF in terms of high temperature and rate of temperature increase. Figure 1 shows a schematic of the LFR. The LFR system comprises three parts: a Henken burner, square quart tower, and sampling probe. The Henken burner is responsible for forming the combustion environment for coal particles by generating a flat flame with a high heating rate and temperature. Stainless steel tubes (i.d. = 0.6 mm) were installed within the hexagonal honeycomb cell matrix, as shown in Figure 2. These tubes were used to supply gas fuel such as CO and H2. A coal-based feeding tube was installed at the center of the Henken burner. Other void honeycomb cells were used for oxidizer channels for N2 and O2. The LFR burner generates diffusion flat flame with an oxygen concentration of 26% and a flame temperature of ~2000–2250 K at a heating rate of 105 K/s. Coal particles were injected on the diffusion flat flame formed on the top surface of the burner. A square quartz tower acted as the reactor, thus allowing for the observation of the burning coal particle flame, measurement of the burning coal particle temperature using a two-color pyrometer, and prevention of surrounding air intrusion. At the top of the quartz tower where the sample trapping probe was installed, tar/soot and char samples could be collected. The probe could be shifted up and down to set the residence time.

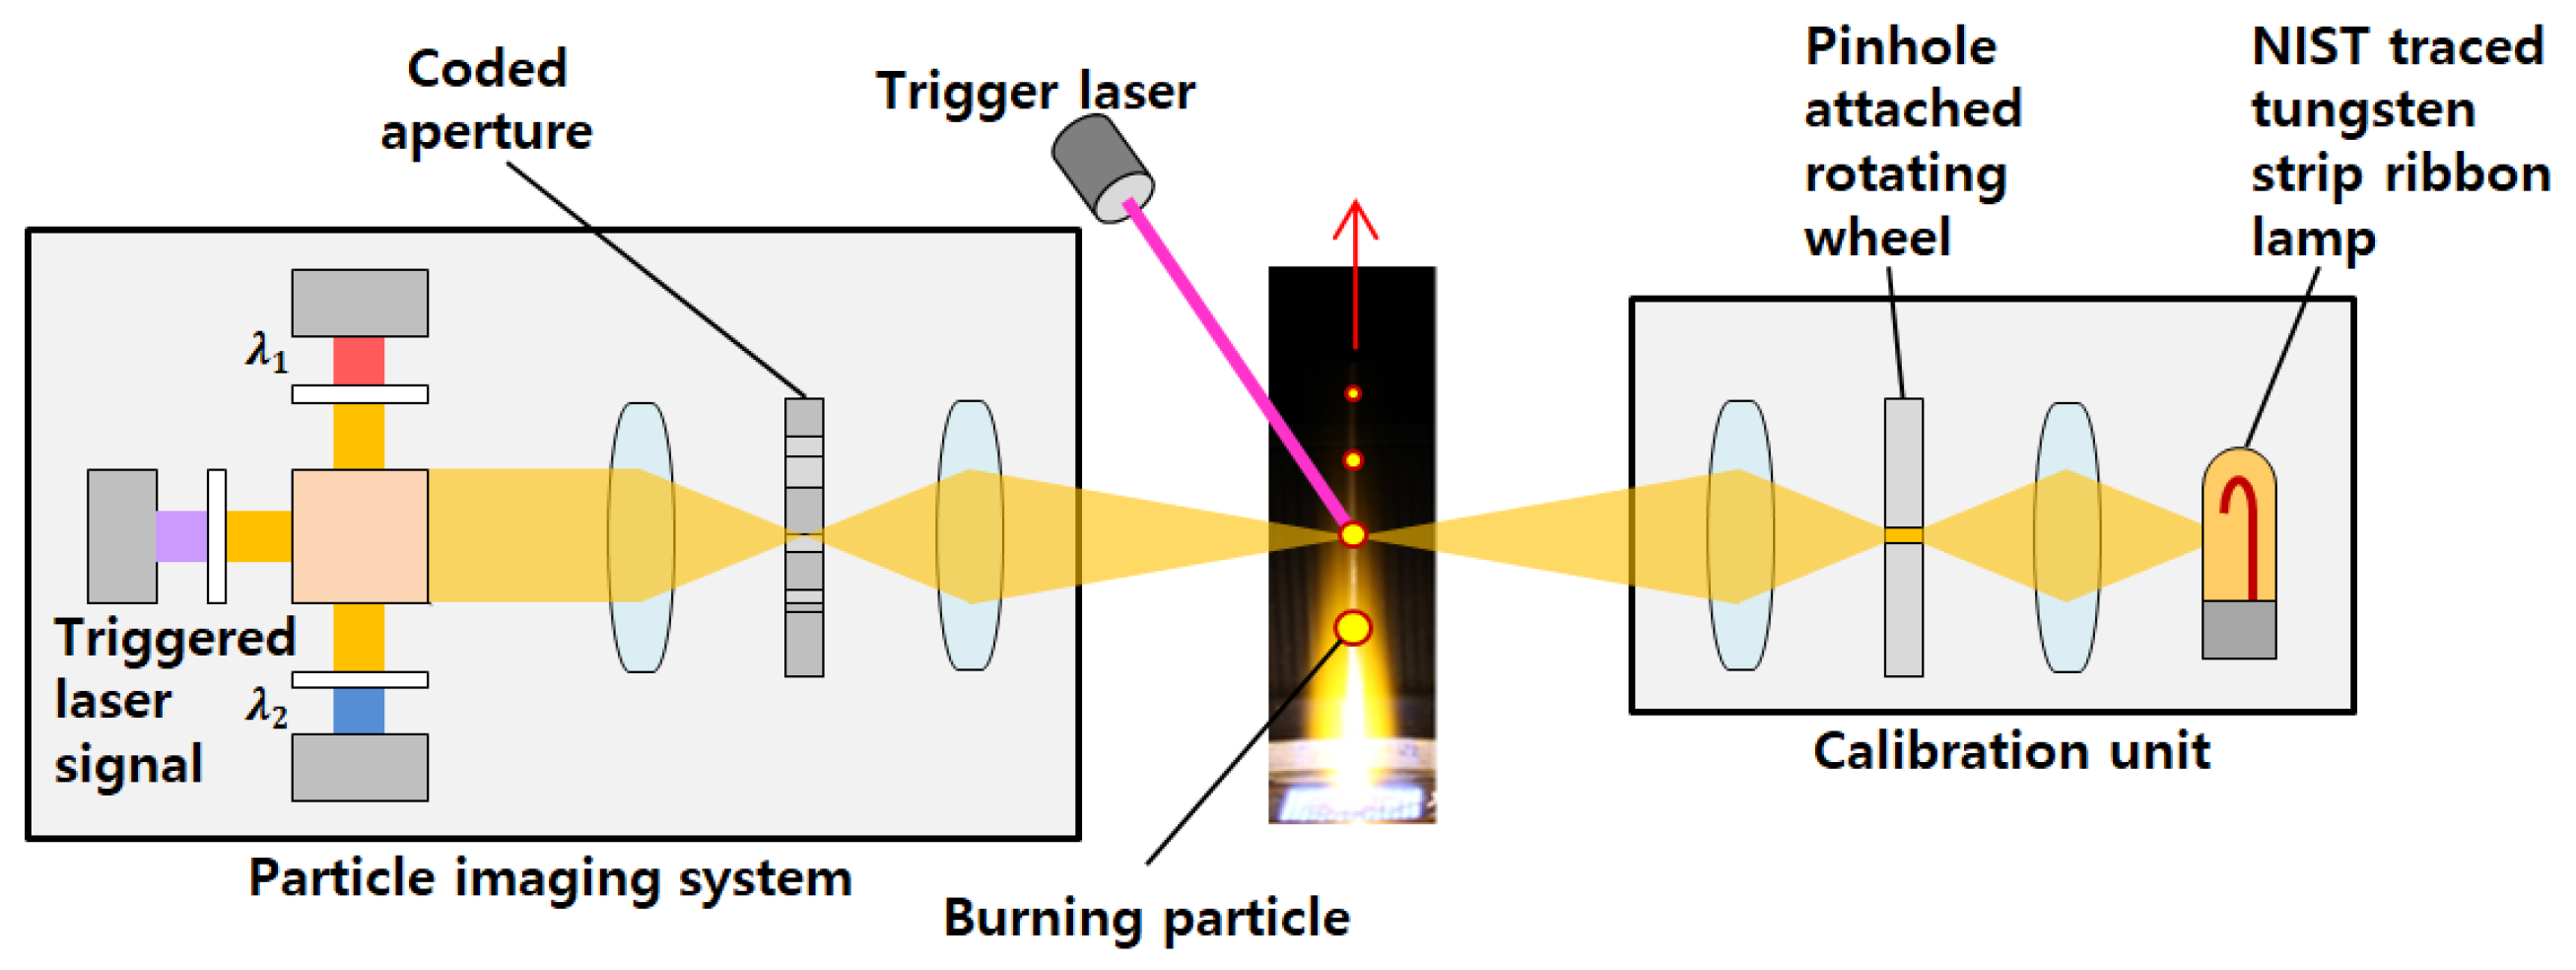
2.3. Measurement of the Burning Coal Particle Temperature and Gas Emission

In this study, to measure the high temperatures of incandescent objects, two-color pyrometry method was adopted [17,18], as shown in Figure 3. The intensity of the luminescent object was measured at two separate center wavelengths of 650 nm and 700 nm with a full width half maximum (FWHM), and the temperature was calculated from the intensity ratio by applying Planck’s Law, assuming that the emissivity was not a function of the wavelength, as expressed below.
T = C 1 ( 1 λ B 1 λ A ) ln I A I B ln C
where C1 is Planck’s radiation constant with a value of 1.44 cm·K, Ii are the measured signal intensities, and λi are the wavelengths for the two channels. The trigger laser beam was employed to avoid any probability of detecting invalid signals when a particle was out of focus; only in-focus particles would scatter this laser beam light.
Fourier transform infrared spectroscopy (FT-IR, Nicoler 6700, Thermo Fisher Scientific, Pittsburgh, PA, USA) was conducted to measure emission gases such as CO and CO2. The combustion of coal particles was completed at the sampling probe entrance, and char or ash particles and the emission gases passing by the sampling probe were discharged to the FT-IR analyzer using a suction pump. The sample of the gas (CO, CO2) varied depending on the probe height, which determined the residence time of coal particles. The sample was then collected while adjusting the probe height.

2.4. Experimental Conditions

CO, H2, N2, and O2 gases were supplied to make a flat flame for the combustion of coal particles. CO, H2, O2, and N2 gas flows were 9.0, 0.4, 9.1, and 3.9 slm, respectively. To create a similar combustion environment within the PCI in the BF, an oxygen concentration of 26% and a flame temperature of 2000 K were applied. The gas temperature in the reactor was measured using an R-type thermocouple with a bead diameter of 0.3 mm. Then, the measured gas temperature was corrected for radiative loss. The temperature of the produced flame was measured from a distance of 20–240 mm from the burner’s bottom in 20 mm sized intervals. Figure 4 shows the measured flame temperature distribution results along the centerline of the reactor. The measurements were performed without feeding the fuel particles.
The coal-feeding system was modified using a previous study [19,20]. A vibrator was attached to the urethane rubber cap to exert vibrations on the syringe. Then, particles floating in N2 gas were entrained through the feeding tube by the carrier gas. The coal-feeding mass flow rate was examined by weighing the mass. For the same fuel particle sizes (75–90 µm) and flow rates, all fuel was supplied at an equivalent supply time. The feed rate of fuel particles, as per the plunger on the syringe pump, was set to be equivalent to 7 mg/min. The total amount of feeding fuel was ~140 mg. Although the biomass blending ratio increased, the total supplied fuel weight was constant. The structures of the burning fuel particle flame image, the burning coal particle surface temperature, and the CO and CO2 emission gases were then analyzed.
If only coal combustion occurred, the unburned carbon (UBC) ratio can be easily derived using the ash-tracer method for the ash and UBCs, which are combustion residues. However, when biomass is co-fired, it is difficult to distinguish whether the carbon contained in UBCs is coal-derived carbon or biomass carbon. Thus, in this study, carbon dating was performed for deriving the unburned carbon ratio of coal and biomass through an accelerator mass spectrometer (AMS).

3. Results and Discussion

3.1. Coal and Biomass Samples Properties

The fuel sample used in this experiment comprised two different types of coal: Coal A, Coal B, and biomass. Table 1 lists the proximate and the ultimate analysis results. The results indicated that Coal A and Coal B are differently ranked coals. An Indonesian Coal A exhibits typical sub-bituminous coal rank characteristics, while an Australian Coal B exhibits bituminous coal rank characteristics. Coal A has a fuel ratio of 1.11, 40.27% of volatile matter, and 44.83% of fixed carbon. Coal B has a fuel ratio of 5.61 and 72.84% of fixed carbon. Biomass imported from Malaysia is composed of 79.68% volatile matter and 45.54% oxygen. These biomass fuel characteristics, which are high in volatile matter and oxygen content, were confirmed by the results. The biggest difference between coal and biomass is the oxygen content and volatile matter. For this study, biomass is blended with Coals A and B at 5%, 10%, and 15%, respectively.

3.2. Image of the Burning Coal Particle Flame

As shown in Figure 5, the coal and biomass blending fuel particle flame images were measured by a Canon 600D digital camera during combustion. When fuel particles were exposed to high-temperature flames, the coal combustion started; each coal type has a different flame structure depending on its characteristics. The volatile matter was released after it was burned at the initial stage: a large volume of volatile materials was emitted with the rapid heating of fuel particles. The volatile matter cloud was approximately four times as large as the particle size [17]. The gas temperature and combustion efficiency within the BF were mostly affected by the volatile matter content of the coal [21]. In the volatile combustion region, the combustion of the volatile matter begins at the burner surface and ends when the volatile matter cloud is at its widest. The volatile matter content determines the length, thickness, and brightness of the volatile matter cloud. Coal A exhibited an ordinary coal flame structure and a high volatile matter content, thus showing a wide and long, volatile matter cloud. However, when the Coal B particle was injected into the burner, the coal particle broke into small particles, thus resulting in small-particle combustion, which is known as the “fragmentation phenomenon”. Coal A had enough volatile matter content (40.27%); however, it was difficult to observe the volatile matter cloud for Coal B because of the fragmentation phenomenon. Generally, high-volatile and low-fixed-carbon coal produces a shorter overall flame than low-volatile and high fixed-carbon coal. However, although Coal B exhibits a low volatility and a high, fixed carbon content, it shows a similar flame length as Coal A because of the fragmentation effect. The fragmentation phenomenon produced smaller particles and affected the combustion rate; therefore, devolatilization occurred in a short time period, and the char oxidation process occurred at an early stage. As per Pohlmann et al. [22], the fragmentation phenomenon results in a decrease in the particle size in the early stage of the heterogeneous ignition and results in strong luminescence of the coal particles, along with a high combustion rate.
Coal A and Coal B exhibited similar volatile matter increasing ratios as the blending ratio of the biomass increased. The flame structure for Coal B, however, was significantly affected by the variation in the biomass blending ratio. The increase in the biomass blending ratios did not affect the flame structure of Coal A. With the increase in the biomass blending ratio, the volatile matter content increased from 40.27% to 46.18%. The difference was only 6%, which indicates that the volatile matter clouds exhibited similar shapes. The flame structure of Coal B, however, was affected by an increase in the biomass blending ratio. The volatile matter content increased from 12.99% to 22.99%. With increase in the biomass blending ratio, the fragmentation phenomenon disappeared or weakened. Moreover, the volatile matter cloud was more clearly observed.
All of these parameters, including the fragmentation phenomenon and biomass blending, affected the coal particle temperature, CO/CO2 emissions, and UBC.

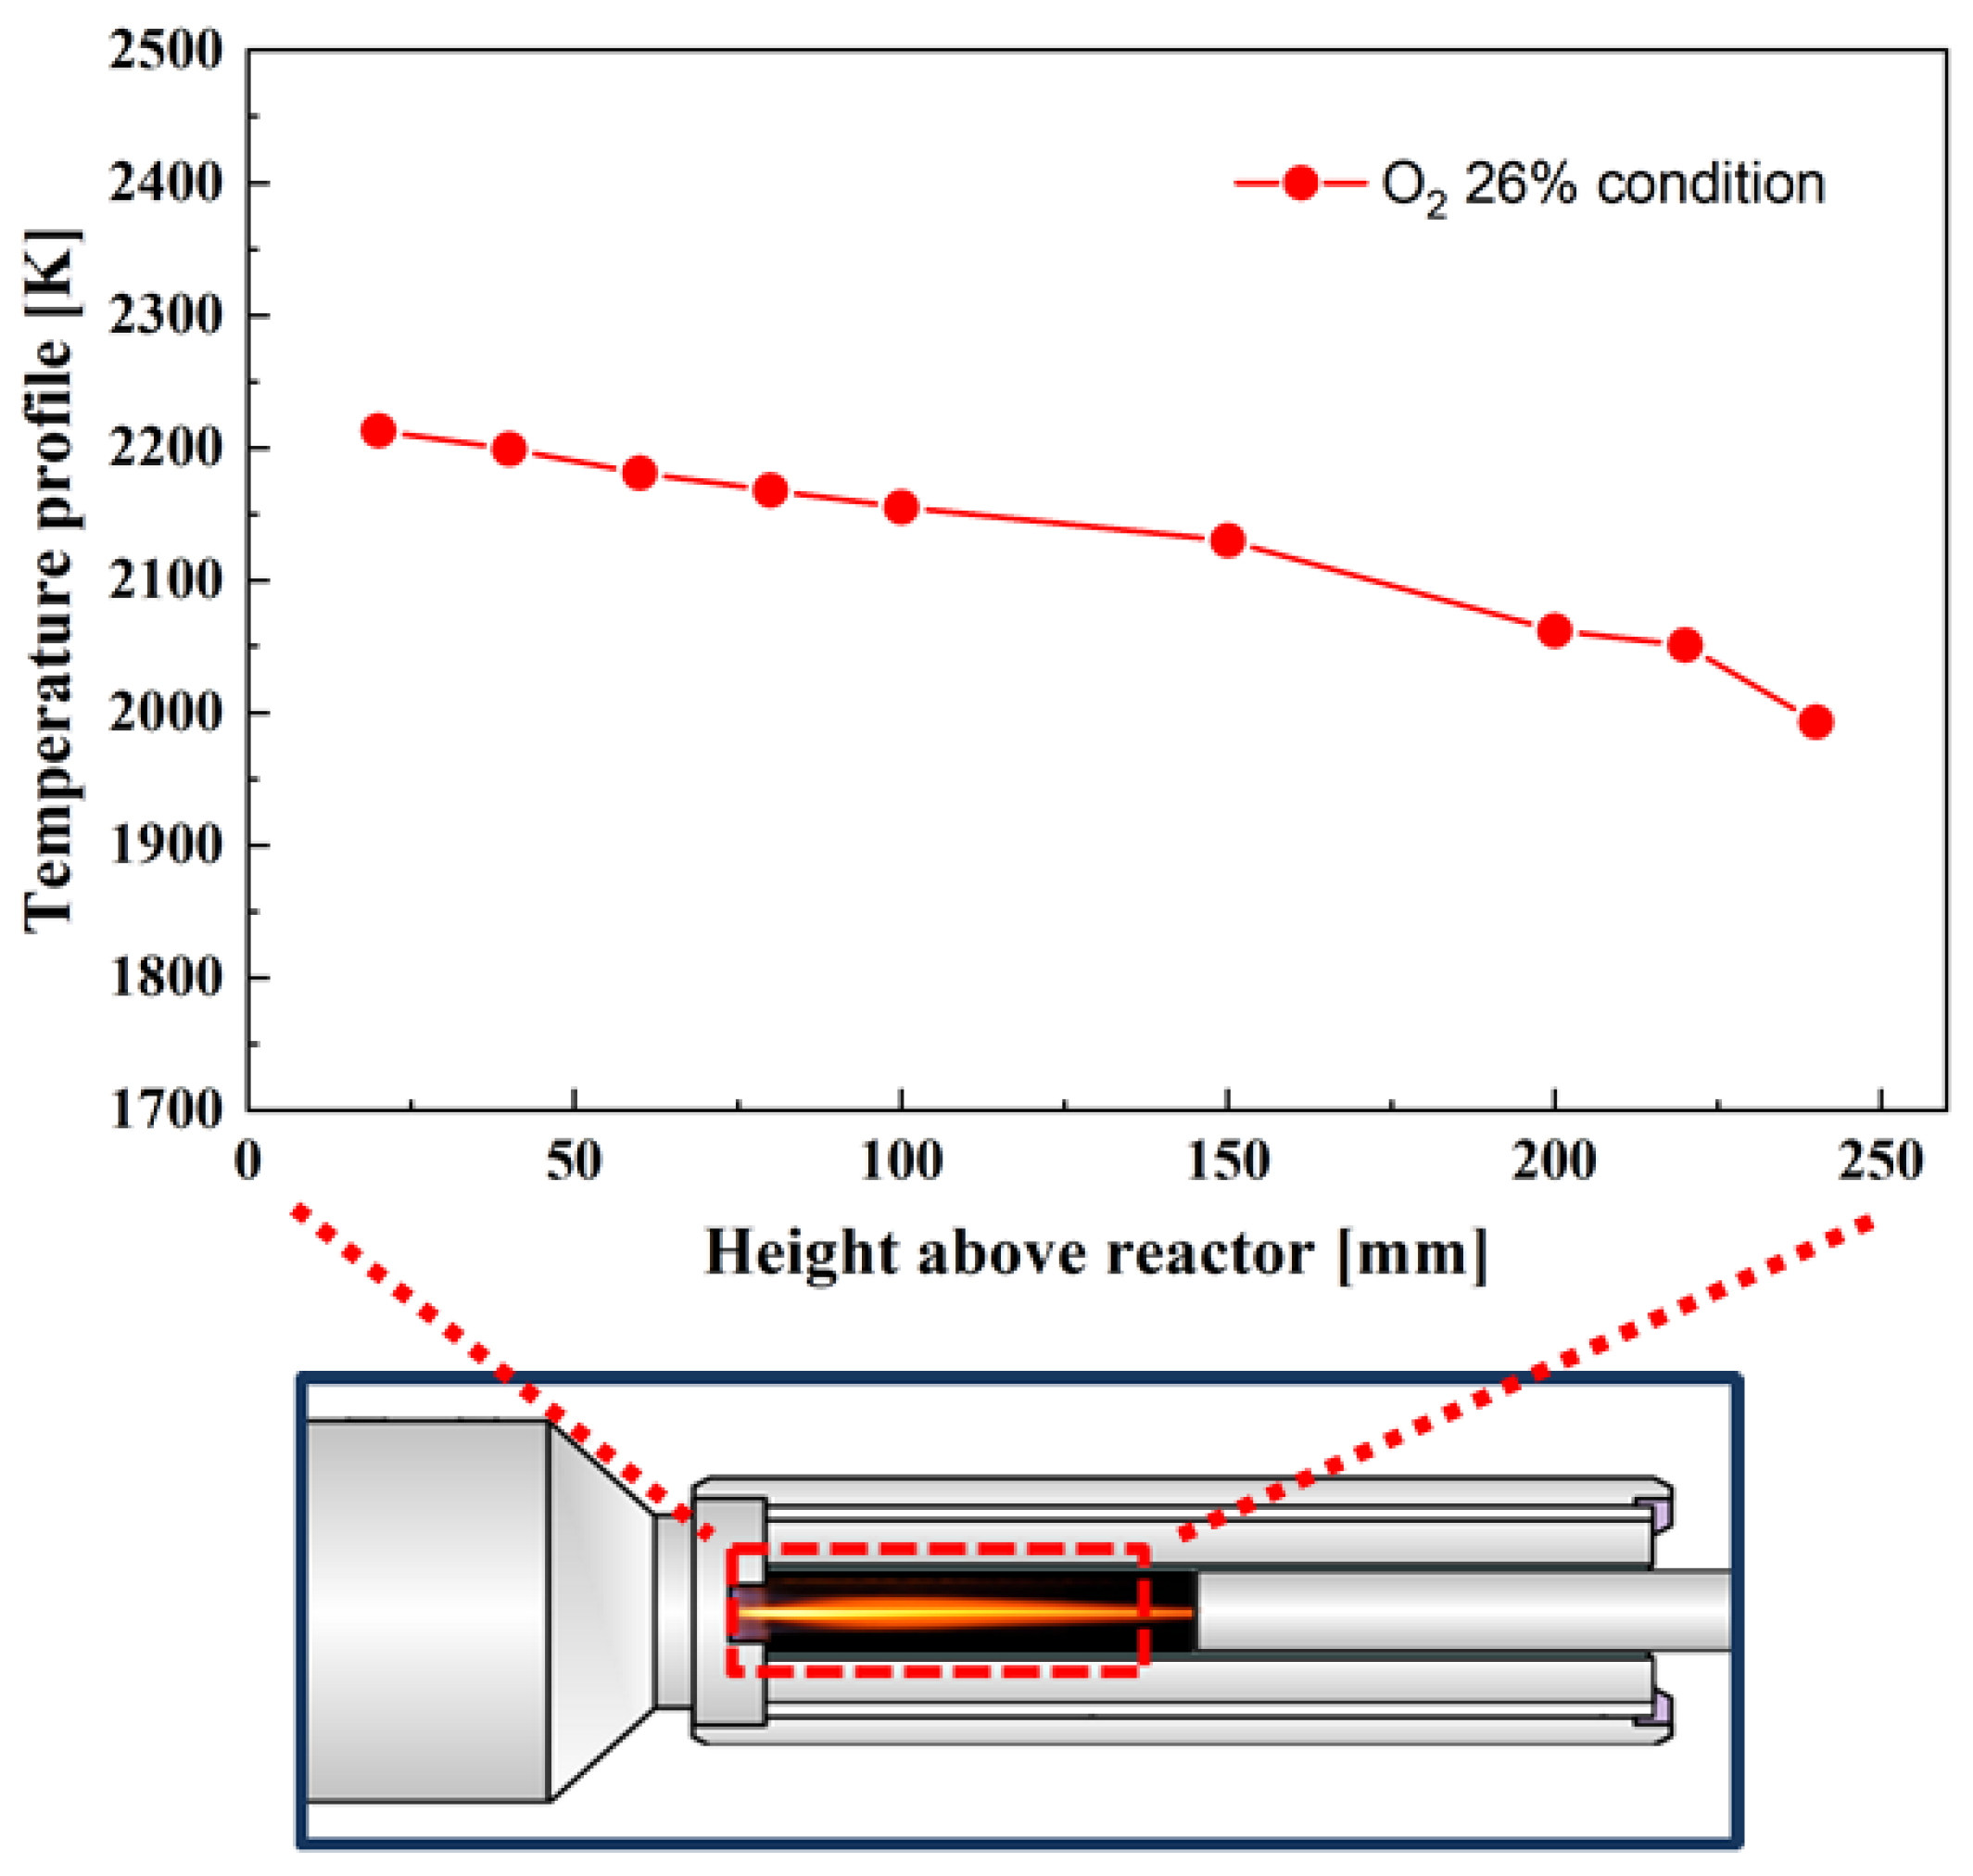
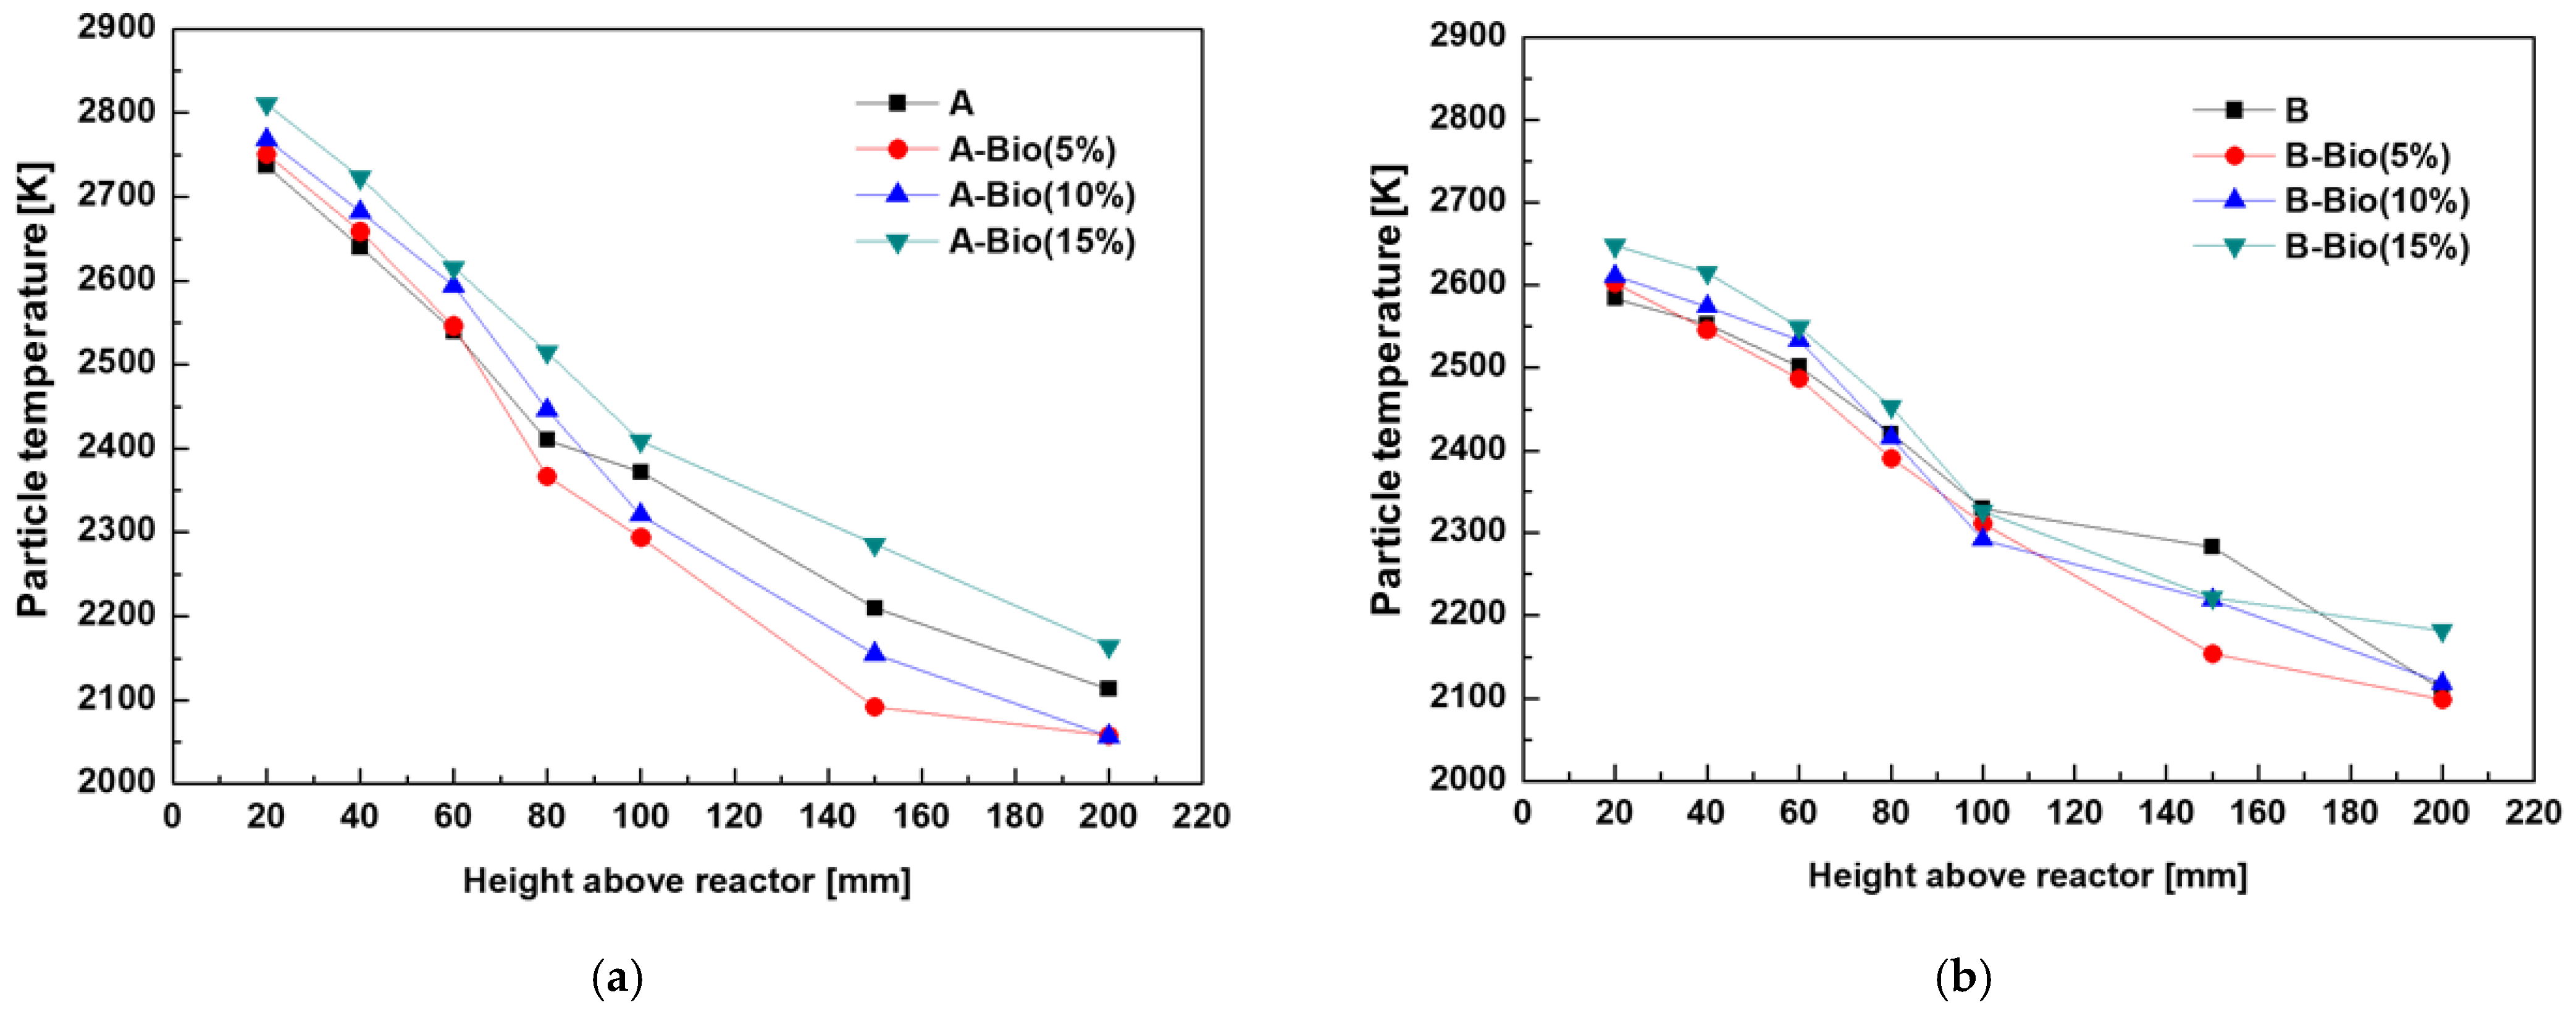
3.3. Distribution of the Burning Coal Particle Temperature

The BF internal temperature distribution and CO/CO2 gas were important factors influencing the pig iron output and BF efficiency. All these parameters were affected and controlled using the PCI system design and supplied pulverized coal characteristics. The PCI system installed at the bottom of the BF could supply high-temperature heat and CO/CO2 gases for the reduction of iron ore. Therefore, one of the methods for estimating suitable coal combustion characteristics for using a PCI system may be used to measure pulverized coal temperatures.
Figure 6 shows the results for the particle temperature distribution along the height above the reactor. Although the difference in the particle temperature between coal and coal with biomass blending is small, the particle temperature was >50 K at a certain height above the reactor when the biomass blending ratios increased. At the initial stage, the order of the particle temperature in Coal A was A-Bio (15%) > A-Bio (10%) > A-Bio (5%) > A, while that in Coal B was B-bio (15%) > B-Bio (10%) > B-Bio (5%) > B. Using these results, we can understand that the volatile matter content is an important factor in the initial stage of coal combustion. The temperature drop between the initial stage of coal combustion and final stage is larger in Coal A than Coal B. The particle temperature decreased by ~700 K in Coal A and its blending case. However, in Coal B and its blending case, the temperature only decreased by ~500 K. This comparatively low decrease is attributed to the fragmentation phenomenon. Small particles were produced from the fragmentation, thus providing an advantage for the combustion behavior. The particle–temperature distribution tendency changes between 80 and 100 mm above the reactor. In most of the biomass blending cases, a lower particle temperature than those for Coal A and Coal B is exhibited.

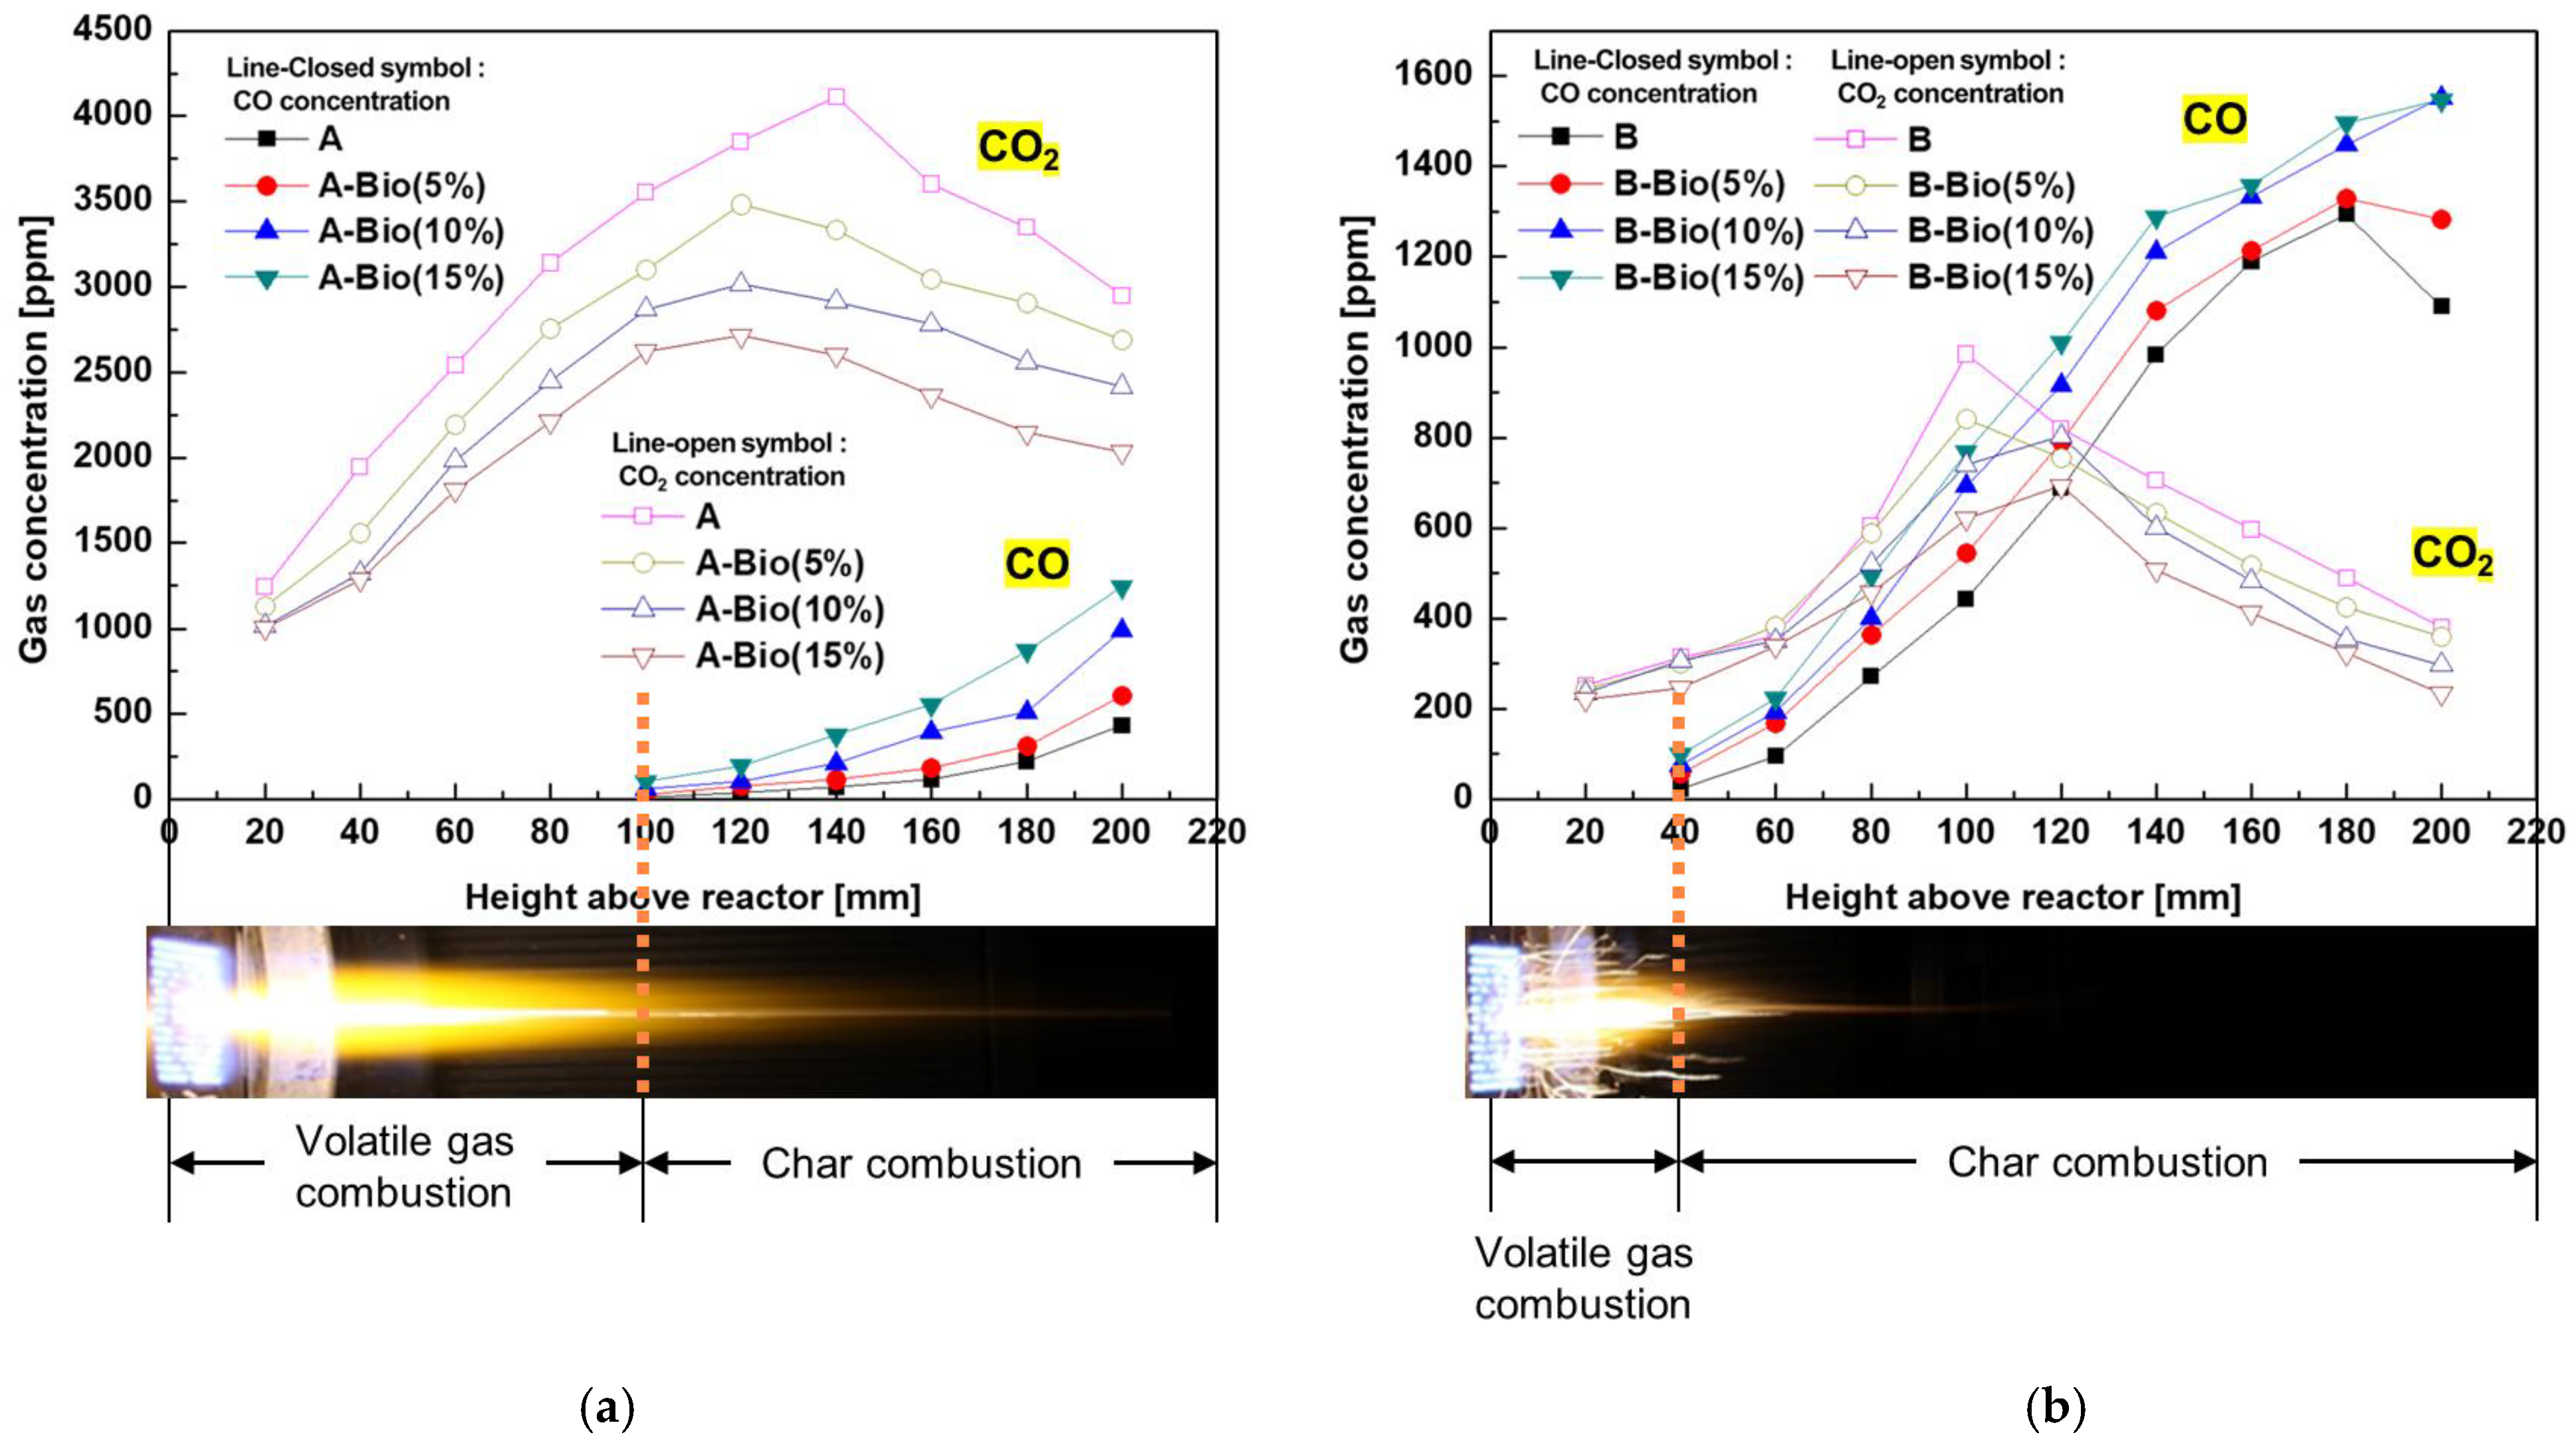
3.4. CO/CO2 Emission Characteristics

The emission gas is an important parameter in BFs because of its relation to the BF efficiency. CO and CO2 gas are particularly important in BFs. CO gas, which is a major reduction agent, is reacted with primary iron oxides, such as hematite (Fe2O3) or magnetite (Fe3O4) in the indirect reduction region at the top of the BF. Figure 7 shows that the CO/CO2 emission gas concentration distribution was measured along the height above the reactor. The CO/CO2 gas was analyzed every 20 mm from the burner, starting at 20 mm and ending at 220 mm, using an FT-IR analyzer. All fuel samples exhibited different properties and combustion characteristics. The CO/CO2 emissions were measured for every fuel sample. When coal particles were injected in the high-temperature flame, they reacted with oxygen and produced CO2 gas during the devolatilization process. The char combustion process generated CO, while the CO2 emissions decreased. The measured position of CO gas was different for Coal A and Coal B because of the different char-oxidation positions. Volatile combustion ended at 100 mm above the reactor for Coal A and at 40 mm for Coal B. In terms of the fragmentation effect, Coal B exhibited a high combustion rate; therefore, its char combustion occurred at an early stage (~40 mm). However, Coal A exhibited a volatile matter content of ~40%. Consequently, the char combustion occurred after the completion of the devolatilization process, which was at a height of 100 mm. When comparing the yield of CO gas from Coals A and B, additional CO gas was generated for Coal A than Coal B. The production rate of CO2 gas for Coal B, however, was three times higher than that for Coal A. With the increase in the biomass blending ratios, additional CO gas was generated, while the CO2 gas content decreased. As per a previous study [23], the CO/CO2 emission characteristics could be explained using the single-film model. The single-film model theory could be applied under conditions of particle size under 100 µm and particle temperature over 1000 K, such as the conditions of a BF. This model requires certain assumptions: the particles are consumed via oxygen, and there is no reaction occurring in the boundary layer. If the conditions include particle temperatures of >1273 K and particle sizes of <100 µm, the primary gaseous product is CO. This experiment produced a reaction temperature of ~2100 K and particles with sizes of <90 µm. Thus, from the single-film model theory, the primary product gas was established to be CO.

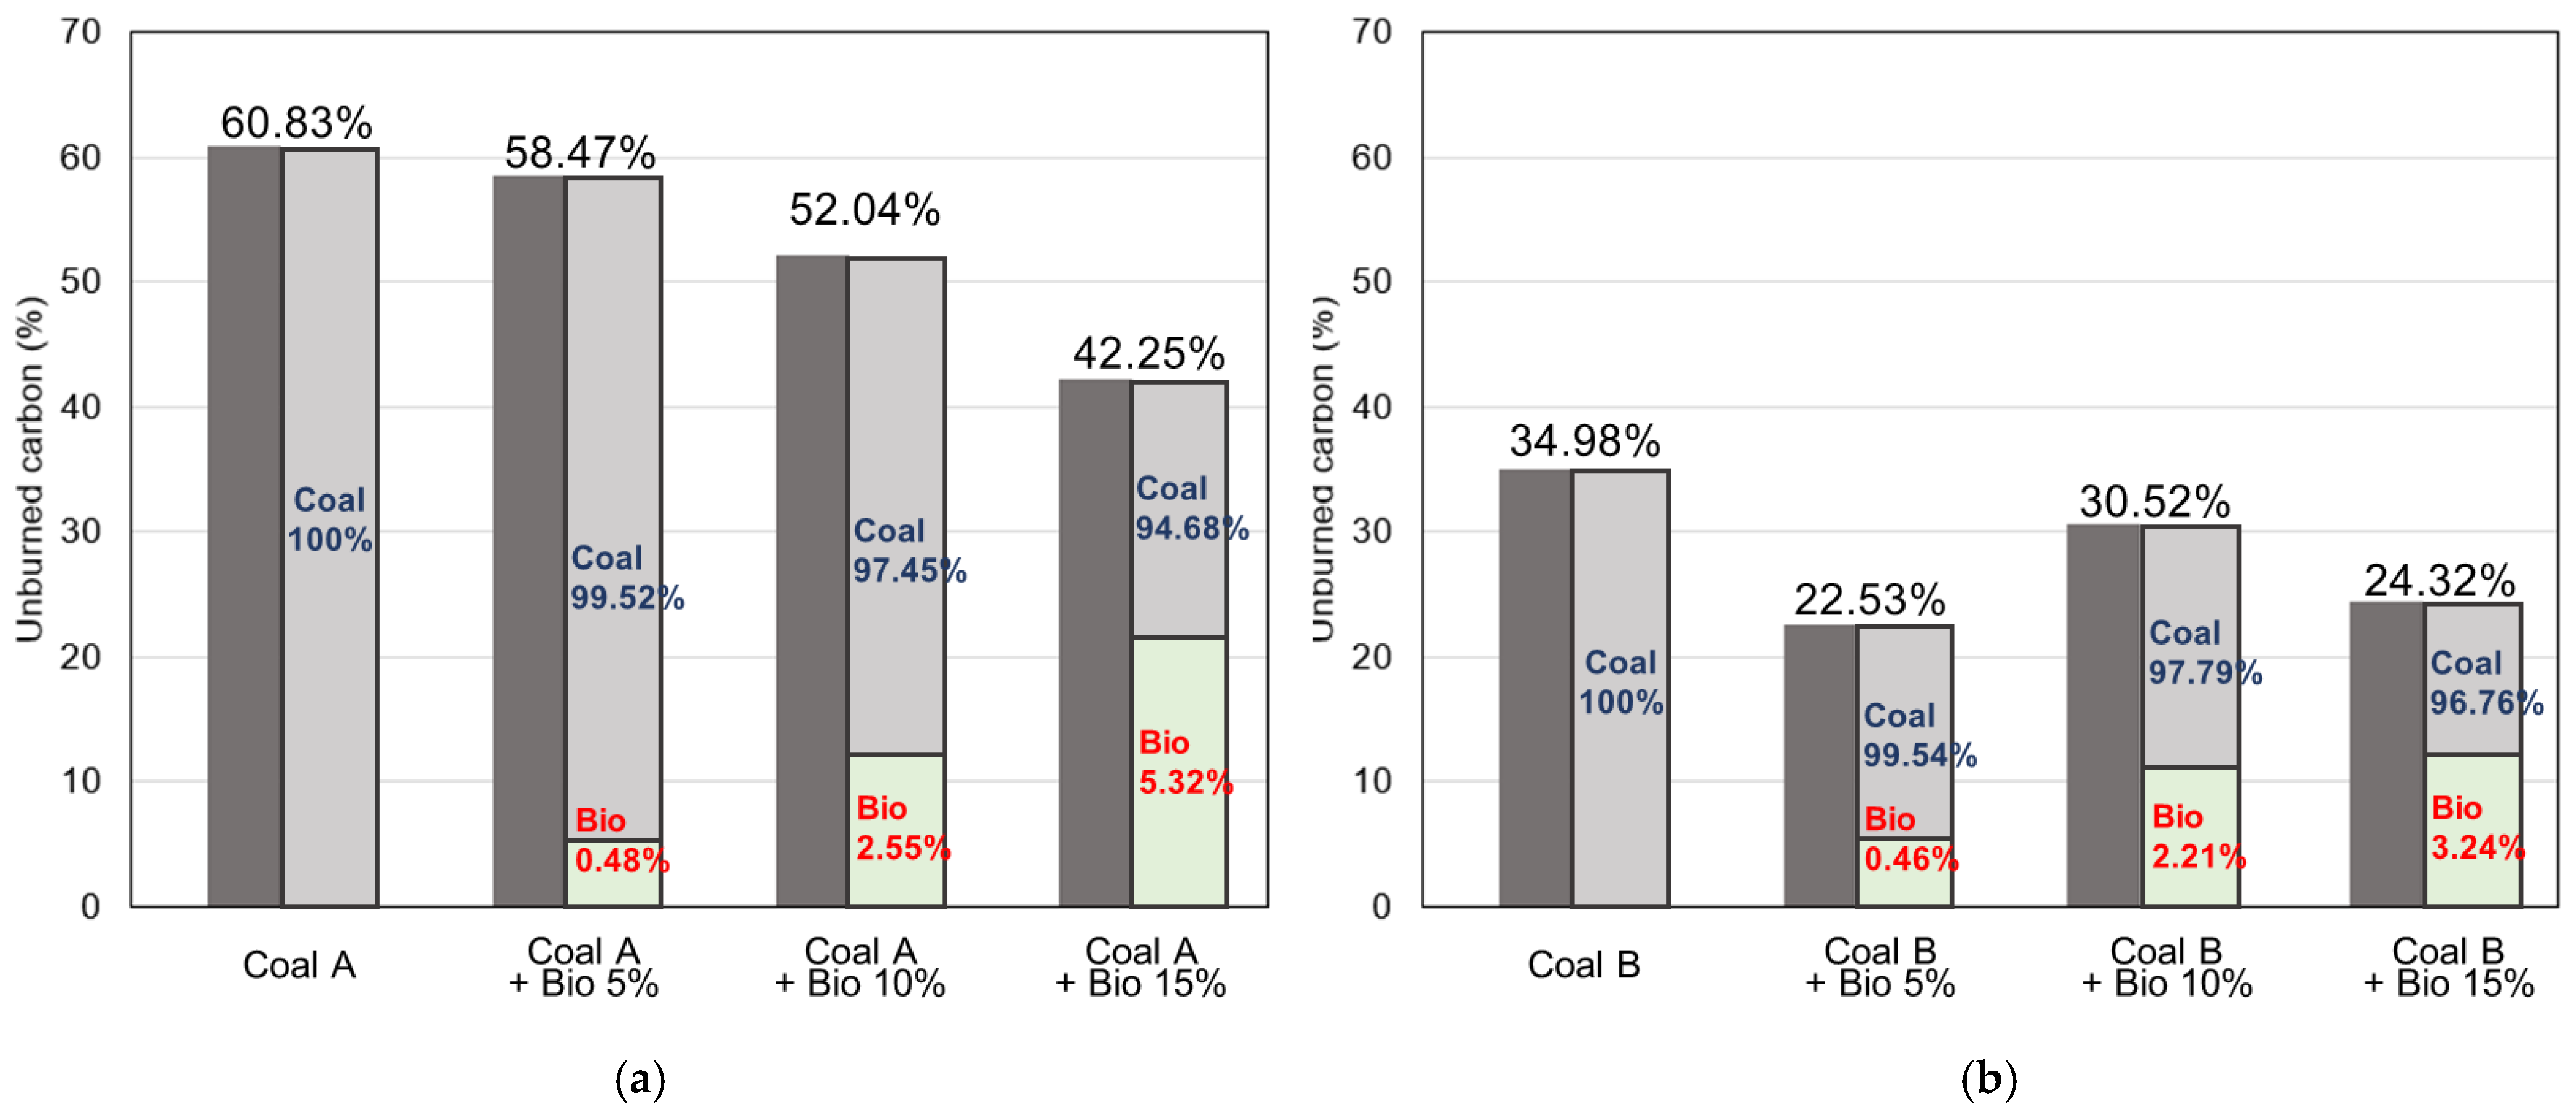
3.5. Char–CO2 Gasification Reaction

UBC was determined by a thermogravimetric analysis, as shown in Figure 8, and the UBC results were to confirm the effect of the CO2 gasification reaction. Here, the radiocarbon dating technique was used to distinguish the unburned carbon ratio between coal and biomass, and the results are presented in Table 2. pMC denotes the percentage of modern carbon, and the year 1950 was set as a standard. Further, δ13C denotes the relative error for the 13C/12C ratio of 13C to the 13C/12C ratio of the standard material. Due to the effect of atmospheric nuclear tests conducted since 1950, the concentration of 14C in the atmosphere is exhibiting a rapidly increasing and then decreasing trend compared to before 1950; currently, it is higher than before 1950. To correct this, the biomass carbon content was defined by multiplying the pMC value by 0.95 [24]. With the increase in the biomass blending ratio, UBC decreased in Coal A. This might be caused by the gas phase combustion promotion phenomenon and CO2 gasification of char particles at the beginning of combustion caused by volatile matter contained in biomass itself. The results are related to the particle temperature and CO/CO2 emission results. With the increase in CO gas content, the CO2 gas content decreased because the char particles reacted with the CO2 gas. The particle temperature decreased because the gasification of the char particle was an endothermic process. There are debates in terms of the reactivity of coal combustion under CO2 diluent atmospheres. Certain researchers [12,16] reported that the CO2 gasification of char induces low char particle temperatures, which result in a decrease in char reactivity. However, in this study, the best char reactivity is achieved under a CO2 atmosphere, and this can be explained as follows, although the CO2 gasification is an endothermic reaction, the particle temperature is sufficiently high for the reaction; thus, the endothermic reaction does not significantly affect the char reactivity. The increase in the development of micropore gasification conditions results in a significant carbon loss in the char–CO2 reaction. In terms of the char–CO2 reaction, it is not clearly known whether the gasification reaction is good. Although this study shows positive outcomes, there are still multiple negative outcomes. Coal B and its biomass blending case exhibited irregular UBC tendencies because of the fragmentation phenomenon. When compared to Coal A combustion, it can be observed that Coal B generates CO rapidly as a result of the char–CO2 gasification reaction by the effect of increasing the surface area according to the fragmentation of coal particles. In the Coal B case, it could be observed that the particle temperature at the reactor bottom was lower than that of the Coal A combustion case, and that the particle temperature was lowered by the rapid gasification, which was an endothermic reaction. This can be seen as a CO emission trend. The UBC was significantly improved due to this phenomenon. In the case where 5% biomass was added to the initial Coal B, it can be seen that the flammability was improved due to the fragmentation effect of coal particles and the increase in the initial gas combustion rate, according to the increase in volatile matters in the biomass. In the combustion case where 10% biomass was added, it can be confirmed that the coal no longer had the advantage of fragmentation and the rapid degradation of the fragmentation phenomenon reduced qualitatively. The coal did not receive the thermal shock due to the amount of heat received from the flat flame of the ladle, which refined the furnace burner at the initial stage of combustion. The gas phase combustion of the volatile matter occurred first; therefore, it appeared as a decrease in the fragmentation tendency and an increase in the cloud volume in the flame shape. It could be observed that the reduction in fragmentation tendency and the consumption of oxidized gas according to the rapid combustion of the volatile gas caused the UBC increase, since the effective contact surface area of the oxidized gas required for solid char combustion decreased. In the case of the combustion case where 15% biomass was added, the effect of fragmentation was remarkably reduced, and in the end, similar to the case where the Coal A and biomass were co-fired, showed that the UBC was reduced by the promotion of gas phase combustion due to the volatile matter of biomass in the early stage of combustion. It can be confirmed that the biomass ratio inside the UBC did not increase significantly when compared with the case in which 10% biomass was co-fired in the Coal B. This result confirmed that, although the 5% biomass was added and combusted, a higher proportion of biomass contributed to the combustion.

4. Conclusions

This study was performed to analyze the characteristics of the PCI combustion zone as a function of the increase in biomass blending ratios within a BF. Two types of coal were chosen for this study, an Indonesian sub-bituminous coal (Coal A) and an Australian bituminous coal (Coal B), and Malaysian wood pellet biomass was used. The flame structure, particle combustion temperature, CO/CO2 gas emissions, and UBC were measured. The flame structure of Coal A was typical and unaffected by the increase in the biomass blending ratio. Coal B, however, exhibited fragmentation, which resulted in earlier char combustion. With the increase in the biomass blending ratio, the fragmentation phenomenon gradually disappeared. Coal B exhibited lower particle temperatures than Coal A because of the fast gasification, and with an increase in the biomass blending ratio, the combustion optimum point due to the fragmentation of coal and volatile gas combustion of biomass occurred. As per the CO/CO2 emission measurements, Coal A produced more CO2 during the devolatilization process and less CO during the char combustion process under high-temperature conditions. Because Coal B exhibited a high combustion rate because of fragmentation, it exhibited a lower UBC than Coal A. With the increase in the biomass blending ratio, the UBC of Coal A decreased because of the initial combustion promotion phenomenon and char–CO2 gasification reaction due to volatile matters possessed by biomass itself. As a result, it is necessary to derive an optimal cofiring ratio between coal and biomass through the combustion test when the coal that shows fragmentation occurs actively, and when coal and woody biomass are used together in the PCI system of a blast furnace.

Author Contributions

Conceptualization, G.-M.K. and J.H.C.; methodology, G.-M.K. and J.H.C.; validation, G.-M.K., J.H.C. and C.-H.J.; formal analysis, G.-M.K. and J.H.C.; investigation, G.-M.K., C.-H.J. and D.-H.L.; resources, G.-M.K. and J.H.C.; data curation, G.-M.K., J.H.C. and D.-H.L.; writing—original draft preparation, G.-M.K. and D.-H.L.; writing—review and editing, G.-M.K., J.H.C., C.-H.J. and D.-H.L.; visualization, G.-M.K. and C.-H.J.; supervision, C.-H.J. and D.-H.L.; project administration, C.-H.J. and D.-H.L.; funding acquisition, D.-H.L. All authors have read and agreed to the published version of the manuscript.

Funding

This research was funded by the support of the Korea Institute of Industrial Technology as “Development of eco-friendly production system technology for total periodic resource cycle” (KITECH EO-21-0014).

Institutional Review Board Statement

Not applicable.

Informed Consent Statement

Not applicable.

Data Availability Statement

Data sharing not applicable.

Acknowledgments

This study was conducted with the support of the Korea Institute of Industrial Technology as “Development of eco-friendly production system technology for total periodic resource cycle” (KITECH EO-21-0014).

Conflicts of Interest

The authors declare no conflict of interest.

References

  1. Kim, H.; Kim, M.; Kim, H.; Park, S. Decomposition Analysis of CO2 Emission from Electricity Generation: Comparison of OECD Countries before and after the Financial Crisis. Energies 2020, 13, 3522. [Google Scholar] [CrossRef]
  2. Deb Abhi, T.; Norouzi, O.; Macdermid-Watts, K.; Heidari, M.; Tasnim, S.; Dutta, A. Miscanthus to Biocarbon for Canadian Iron and Steel Industries: An Innovative Approach. Energies 2021, 14, 4493. [Google Scholar] [CrossRef]
  3. Toktarova, A.; Karlsson, I.; Rootzén, J.; Göransson, L.; Odenberger, M.; Johnsson, F. Pathways for Low-Carbon Transition of the Steel Industry—A Swedish Case Study. Energies 2020, 13, 3840. [Google Scholar] [CrossRef]
  4. Perpiñán, J.; Bailera, M.; Romeo, L.M.; Peña, B.; Eveloy, V. CO2 recycling in the iron and steel industry via power-to-gas and oxy-fuel combustion. Energies 2021, 14, 7090. [Google Scholar] [CrossRef]
  5. Lacroix, P.; Dauwels, G.; Dufresne, P.; Godijn, R.; Perini, P.G.; Stricker, K.P.; Virtala, J. High blast furnaces productivity operations with low coke rates in the European Union. Rev. Métallurgie 2001, 98, 259–268. [Google Scholar] [CrossRef]
  6. Machado, J.G.M.S.; Osório, E.; Vilela, A.C.F.; Babich, A.; Senk, D.; Gudenau, H.W. Reactivity and conversion behaviour of Brazilian and imported coals, charcoal and blends in view of their Injection into Blast Furnaces. Steel Res. Int. 2010, 81, 9–16. [Google Scholar] [CrossRef]
  7. Babich, A.; Senk, D.; Fernandez, M. Charcoal behaviour by its injection into the modern blast furnace. ISIJ Int. 2010, 50, 81–88. [Google Scholar] [CrossRef] [Green Version]
  8. Du, S.W.; Chen, W.H.; Lucas, J.A. Pretreatment of biomass by torrefaction and carbonization for coal blend used in pulverized coal injection. Bioresour. Technol. 2014, 161, 333–339. [Google Scholar] [CrossRef]
  9. Bridgeman, T.G.; Jones, J.M.; Shield, I.; Williams, P.T. Torrefaction of reed canary grass, wheat straw and willow to enhance solid fuel qualities and combustion properties. Fuel 2008, 87, 844–856. [Google Scholar] [CrossRef]
  10. Wijayanta, A.T.; Alam, M.S.; Nakaso, K.; Fukai, J.; Kunitomo, K.; Shimizu, M. Combustibility of biochar injected into the raceway of a blast furnace. Fuel Proc. Technol. 2014, 117, 53–59. [Google Scholar] [CrossRef]
  11. Borrego, A.G.; Osório, E.; Casal, M.D.; Vilela, A.C.F. Coal char combustion under a CO2-rich atmosphere: Implications for pulverized coal injection in a blast furnace. Fuel Proc. Technol. 2008, 89, 1017–1024. [Google Scholar] [CrossRef]
  12. Molina, A.; Shaddix, C.R. Ignition and devolatilization of pulverized bituminous coal particles during oxygen/carbon dioxide coal combustion. Proc. Combust. Inst. 2007, 31, 1905–1912. [Google Scholar] [CrossRef]
  13. Saastamoinen, J.J.; Aho, M.J.; Hämäläinen, J.P.; Hernberg, R.; Joutsenoja, T. Pressurized pulverized fuel combustion in different concentrations of oxygen and carbon dioxide. Energy Fuels 1996, 10, 121–133. [Google Scholar] [CrossRef]
  14. Rathnam, R.K.; Elliott, L.K.; Wall, T.F.; Liu, Y.; Moghtaderi, B. Differences in reactivity of pulverised coal in air (O2/N2) and oxy-fuel (O2/CO2) conditions. Fuel Proc. Technol. 2009, 90, 797–802. [Google Scholar] [CrossRef]
  15. Žajdlík, R.; Markoš, J.; Remiarová, Ľ.J.B. Single coal char particle combustion in the carbon dioxide atmosphere. Chem. Pap. 2000, 54, 467–472. [Google Scholar]
  16. Rodriguez, M.; Raiko, R. Effect of O2 and CO2 Content on Particle Surface Temperature and Size of Coal Char during Combustion. Proc. Finn. Swed. Flame Days 2009, 3B. Available online: http://www.ffrc.fi/FlameDays_2009/3B/RodriguezPaper.pdf (accessed on 5 July 2021).
  17. Kim, Y.-G.; Kim, J.-D.; Lee, B.-H.; Song, J.-H.; Chang, Y.-J.; Jeon, C.-H. Experimental investigation into combustion characteristics of two sub-bituminous coals in O2/N and O2/CO2 environments. Energy Fuels 2010, 24, 6034–6040. [Google Scholar] [CrossRef]
  18. Tichenor, D.A.; Mitchell, R.E.; Hencken, K.R.; Niksa, S. Simultaneous in situ measurement of the size, temperature and velocity of particles in a combustion environment. Symp. Int. Combust. 1985, 20, 1213–1221. [Google Scholar] [CrossRef]
  19. Ma, J.L. Soot Formation during Coal Pyrolysis; Brigham Young University: Provo, UT, USA, 1996. [Google Scholar]
  20. Molina, A. Evolution of Nitrogen during Char Oxidation; University of Utah: Salt Lake City, UT, USA, 2002. [Google Scholar]
  21. Du, S.-W.; Yeh, C.-P.; Chen, W.-H.; Tsai, C.-H.; Lucas, J.A. Burning characteristics of pulverized coal within blast furnace raceway at various injection operations and ways of oxygen enrichment. Fuel 2015, 143, 98–106. [Google Scholar] [CrossRef]
  22. Pohlmann, J.G.; Osorio, E.; Vilela, A.C.F.; Borrego, A.G. Reactivity to CO2 of chars prepared in O2/N2 and O2/CO2 mixtures for pulverized coal injection (PCI) in blast furnace in relation to char petrographic characteristics. Int. J. Coal Geol. 2010, 84, 293–300. [Google Scholar] [CrossRef] [Green Version]
  23. Khatami, R.; Levendis, Y.A. An overview of coal rank influence on ignition and combustion phenomena at the particle level. Combust. Flame 2016, 164, 22–34. [Google Scholar] [CrossRef] [Green Version]
  24. ASTM Standard D6866-21; Standard Test Methods for Determining the Biobased Content of Solid, Liquid, and Gaseous Samples Using Radiocarbon Analysis. ASTM International: West Conshohocken, PA, USA, 2021.
Figure 1. Schematic of an LFR system.
Energies 15 00655 g001
Figure 2. Schematic of the cross-sectional area of a Henken burner.
Energies 15 00655 g002
Figure 3. Schematic of the burning particle temperature-measuring system.
Energies 15 00655 g003
Figure 4. Gas temperature profile at the LFR center line.
Energies 15 00655 g004
Figure 5. Flame structure of the burning coal particles (O2 = 26%).
Energies 15 00655 g005
Figure 6. Particle–temperature distribution along the height above the reactor: (a) Coal A + biomass (0%, 5%, 10%, 15%) and (b) Coal B + biomass (0%, 5%, 10%, 15%).
Energies 15 00655 g006
Figure 7. CO/CO2 emission gas concentration distribution along the height above the reactor: (a) Coal A + biomass (0%, 5%, 10%, 15%) and (b) Coal B + biomass (0%, 5%, 10%, 15%).
Energies 15 00655 g007
Figure 8. Unburned carbon ratio and the ratio of coal to biomass in unburned carbon (a) Coal A + biomass (0%, 5%, 10%, 15%) and (b) Coal B + biomass (0%, 5%, 10%, 15%) (The proportions of the coal–biomass shown in the plot were rescaled to show the tendency).
Energies 15 00655 g008
Table 1. Proximate and ultimate analysis results of the samples.
FuelProximate Analysis (* db., wt.%)Fuel RatioUltimate Analysis (** daf., wt.%)
MoiVMAshFCFC/VMCHONS
Coal A5.0240.279.8844.831.1165.684.6728.430.510.71
Coal B6.7012.997.4772.845.6175.704.4618.870.830.14
Biomass2.6779.684.1913.460.1747.525.1845.541.230.53
Coal A (balance) + Biomass (blended, wt.%)
Bio 5%4.9042.249.6043.261.0264.774.7029.290.550.70
Bio 10%4.7944.219.3141.690.9463.864.7230.140.580.69
Bio 15%4.6746.189.0340.120.8762.964.7531.000.620.68
Coal B (balance) + Biomass (blended, wt.%)
Bio 5%6.5016.327.3169.874.2874.294.5020.200.850.16
Bio 10%6.3019.667.1466.903.4072.884.5321.540.870.18
Bio 15%6.1022.996.9863.932.7871.474.5722.870.890.20
* dry basis. ** dry ash-free basis.
Table 2. Radiocarbon dating results.
ParameterCoal A (Balance, wt.%)Coal B (Balance, wt.%)
Coal ABio 5%Bio 10%Bio 15%Coal BBio 5%Bio 10%Bio 15%
pMC (%)* n.a.0.512.685.60n.a.0.482.333.41
δ13C (‰)n.a.−25.63−25.03−23.98n.a.−25.84−25.21−24.72
* Not available.
Publisher’s Note: MDPI stays neutral with regard to jurisdictional claims in published maps and institutional affiliations.

