Article

A Thermohydraulic Performance of Internal Spiral Finned Tube Based on the Inner Tube Secondary Flow

School of Naval Architecture, Ocean and Energy Power Engineering, Wuhan University of Technology, Wuhan 430063, China
*
Author to whom correspondence should be addressed.
Energies 2022, 15(2), 648; https://doi.org/10.3390/en15020648
Submission received: 14 December 2021 / Revised: 13 January 2022 / Accepted: 16 January 2022 / Published: 17 January 2022

Abstract

:
In this article, the BSL k-ω model was chosen as the turbulence model to simulate the heat transfer and flow characteristics of the proposed tubes inserted with internal spiral fins when the Re was set as 3000 to 17,000. The numerical results agreed well with the empirical formula. The average deviations of Nu and f between the simulation results and empirical formula results were 5.11% and 8.45%, respectively. By means of numerical simulation, the impact of three configurational parameters on the thermal performance was studied, namely the pitch P, the height H, and the number N of the internal spiral fins. The results showed that the Nu and f of the internal spiral finned tube were 1.77–3.74 and 3.04–10.62 times higher than those of smooth tube, respectively. PEC was also taken into account, ranging from 1.038 to 1.652. When the Re was set as 3000, the PEC achieved the peak value of 1.652 under the height H of the fins at 5 mm, the number N was 8, and the pitch P was 75 mm. However, with the increase of Re, the effect of pressure drop on the comprehensive performance in the tube was stronger than that of thermal enhancement. However, the PEC gradually decreased as the Re increased from 3000 to 17,000. In addition, the velocity and temperature fields were obtained to investigate the mechanisms of heat transfer enhancement.

Graphical Abstract

1. Introduction

As heat exchange equipment, the heat exchanger plays an important role in the chemical industry, petroleum, power, food and many other industrial productions [1]. The requirements for heat exchange equipment in various fields has become more and more difficult to meet, and the demand for a heat exchanger with smaller, more compact and stronger heat exchange capacity has been put forward to adapt to more severe heat exchange situations. Therefore, the technology to enhance heat exchange attracted more and more attention.
At present, there are three common methods [2] to enhance heat transfer in tubes: active enhancement, passive enhancement and combined enhancement. Active methods improve the heat exchange capacity of heat exchange equipment by setting additional power devices to give specific excitation or disturbance to heat exchange equipment and consume additional power. For example, jet impact strengthening, surface vibration strengthening [3], electrostatic field strengthening [4], and electromagnetic field strengthening [5] were proposed. Active heat transfer enhancement technology has a demonstrable positive effect on heat transfer enhancement, but it has not been widely used in daily life because of the redundancy of equipment [6]. The other widely used method to improve heat transfer is the passive enhancement, which requires no external power [2,6]. As the most common heat transfer enhancement tool, fins attracted the extensive attention of scholars due to their high heat transfer coefficient and large heat transfer area.
Lots of paper have investigated the external finned tube, which was externally connected to the heat exchange tube. As early as the 1990s, scientists [7,8] studied the heat transfer and flow characteristics in tubes with external fins and confirmed that the hydrodynamics and temperature field were three-dimensional, and the heat transfer coefficient strongly depended on local flow conditions. In 2000, M. Ouzzane et al. [9] carried out a numerical study on an inclined tube with longitudinal outer fins. The results showed that the secondary flow caused by buoyancy had a very significant effect on the axial flow and the isotherm between fluid and solid. In 2012, Liu et al. [10] used the combination of experiment and numerical simulation to study the flow and heat transfer characteristics of finned tubes with inner and outer fins. They found that the height of fin had a strong influence on heat transfer and flow characteristics, while the effect of pitch was relatively weak. In 2021, Ding et al. [11] experimentally studied the heat dissipation characteristics of external finned tubes under the condition of non-forced convection and concluded that the height of fins had the obvious positive effect on the heat dissipation. Scholars performed lots of work to research the external finned tubes and generally came up with the conclusion that the thermal performance can be obviously improved by installing fins outside the heat transfer tubes.
In addition, owing to the simple structure and high comprehensive performance, the inner finned tube has drawn researchers’ attention. Recently, some articles generally focused on the tube with embedded fins. Embedded fins can increase the heat exchange area in the tube, so as to improve the heat exchange rate. However, at the same time, the pressure drop in the pipe can also increase. Hence, both heat transfer efficiency and pressure variation should be taken into account. In Fabbri’s paper [12], the effect of viscous dissipation on the heat transfer of laminar cooling finned tubes under the condition of external heating flow was studied by numerical simulation. The result showed that the viscous dissipation effect reduces the heat transfer efficiency of finned tubes. Al-Sarkhi and Abu-Nada [13] numerically investigated forced convective heat transfer in vertical inner finned tubes. The results showed that the velocity and temperature distribution in the tube depended on the number and height of radial fins. In order to achieve the excellent heat transfer effect, the combination of fin number and fin height was recommended. Foong et al. [14] carried out three-dimensional numerical simulation of microchannels with variable fin height ratio. It was found that the fins made the flow mixing better and the surface of heat transfer area larger. Wang [15] carried out a numerical study on the heat transfer performance of inner finned tubes with core tube blockage. The relationship between Nusselt number and friction coefficient of inner finned tubes with different shapes was obtained. The results showed that the tube with S-shaped fin and Z-shaped fin was better than the tube with V-shaped fin, and the tube with Z-shaped fin had the best performance. It was not difficult to perceive from previous studies that internal fins also played a positive role in the enhancement of thermal-hydraulic performance, and the fins embedded in the tube became research hotspots.
Furthermore, in order to improve the heat transfer performance, various tube inserts have been proposed, including twisted tape [16,17,18,19], twined coil [20,21], fin [22], baffle [23], winglet [24,25,26] and so on. The thermal performance of the plain tubes inserted with alternate clockwise and counter-clockwise twisted tapes (TA) was obtained by K. Wongcharee et al. [19]. It was found that the maximum thermal performance factor could reach 5.25 when the Reynolds number was 830 and the twist ratio was 3. Dang et al. [20] numerically investigated the convective heat transfer enhancement mechanisms in tubes with twined coil inserted. It was obtained that the maximum JF could reach 2.16 when Re = 1000. Later, Pongjet Promvonge’s research [22] concluded that the thermal performance of the new turbulator which fitted angle-finned tapes with the angle of 30° was much higher than that of the wire coil/twisted tape turbulator by experimental studies. Winglets were also studied as common inserts in their paper [26]. After experiments on several types of tubes, the results were obtained that delta-winglets had a thermal performance enhancement factor in a range of 1.82–2.0 and the optimal point was obtained when the blockage ratios was set as 1.5.
From the relevant literature, it was found that the research on the enhanced heat transfer characteristics of finned tubes has made some achievements. At the same time, the fins with better comprehensive performance and more appropriate position still need to be studied by future generations. In this article, an internal spiral finned tube is proposed to optimize the synergistic effect between the heat transfer enhancement and the pressure drop to obtain low resistance and efficient heat transfer performance. The thermohydraulic performance of the finned tube was obtained by numerical simulation. The PEC, which is widely used to quantify heat transfer devices performances [27,28], is discussed. In order to determine the optimal fin structure corresponding to the maximum PEC of the tube, three geometric parameters (such as the height, the pitch and the number of the fins) were selected as variables. In addition, the temperature, velocity and streamlines distributions of the internal spiral finned tube are discussed. Furthermore, the mechanism of heat transfer and fluid flow in the internal spiral finned tube was obtained. Among them, all the work was accomplished when the Reynolds number was in the range of 3000 to 17,000 and water was chosen as the working fluid.

2. Methodology

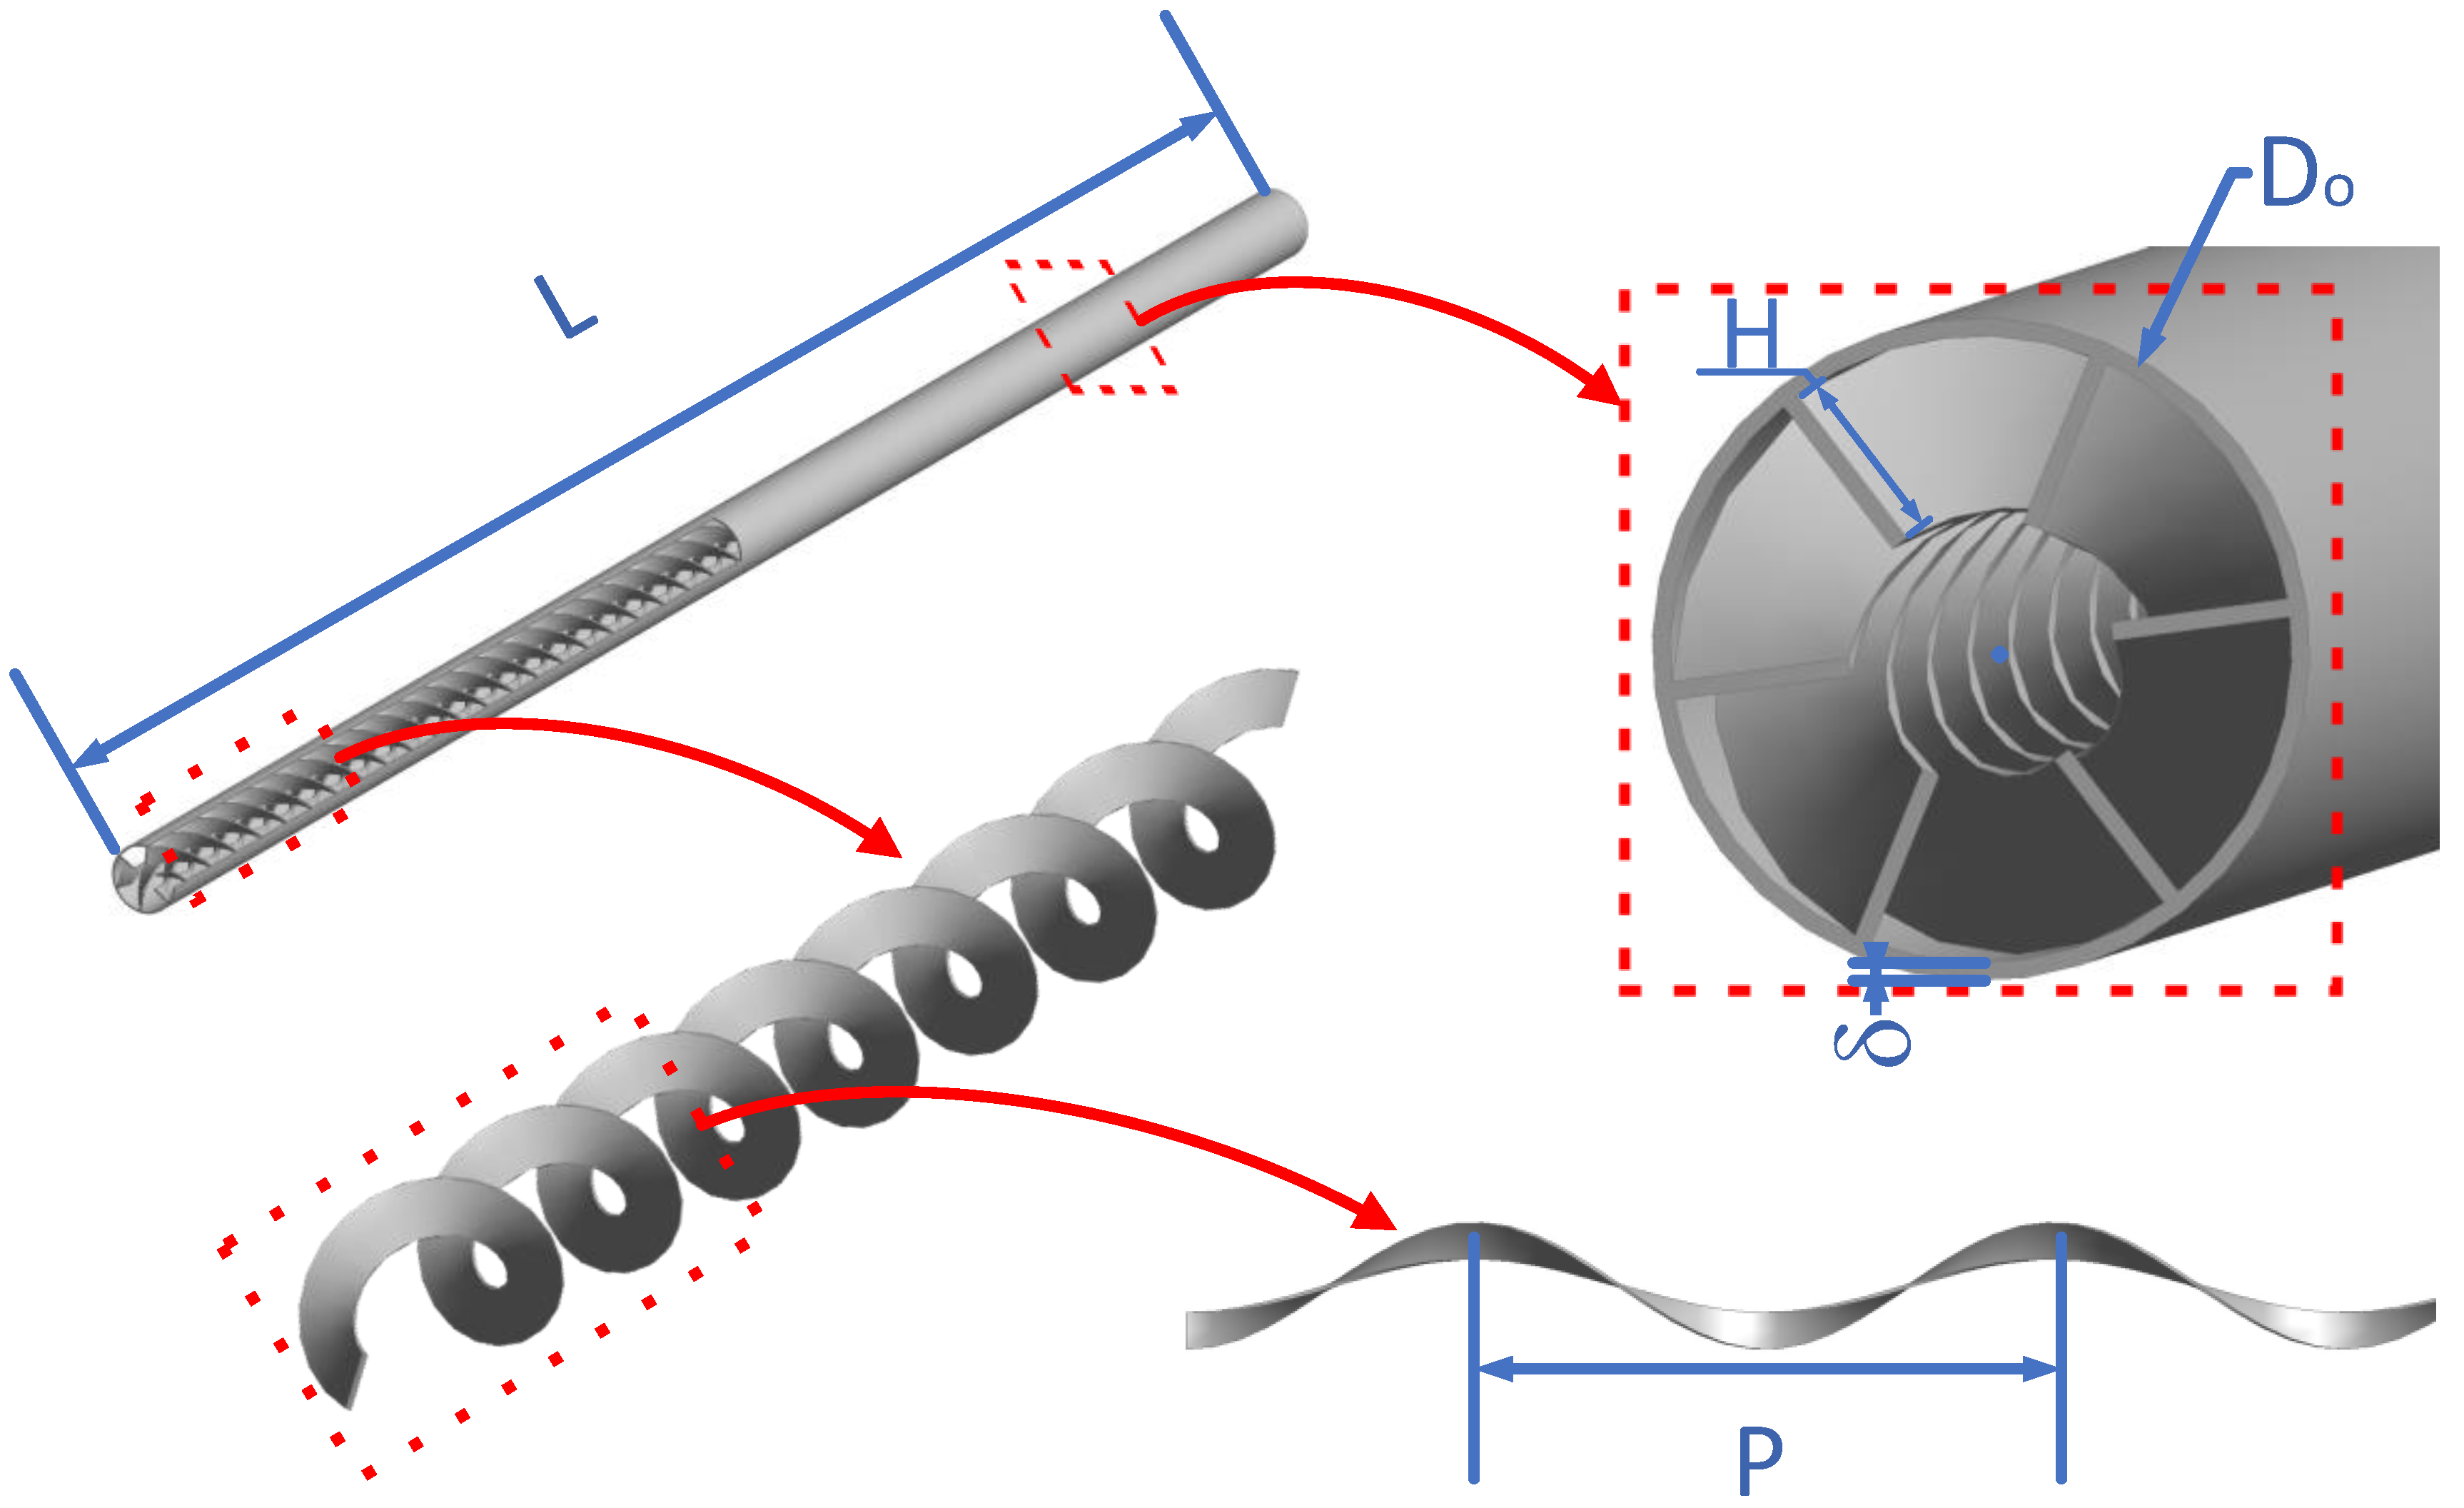
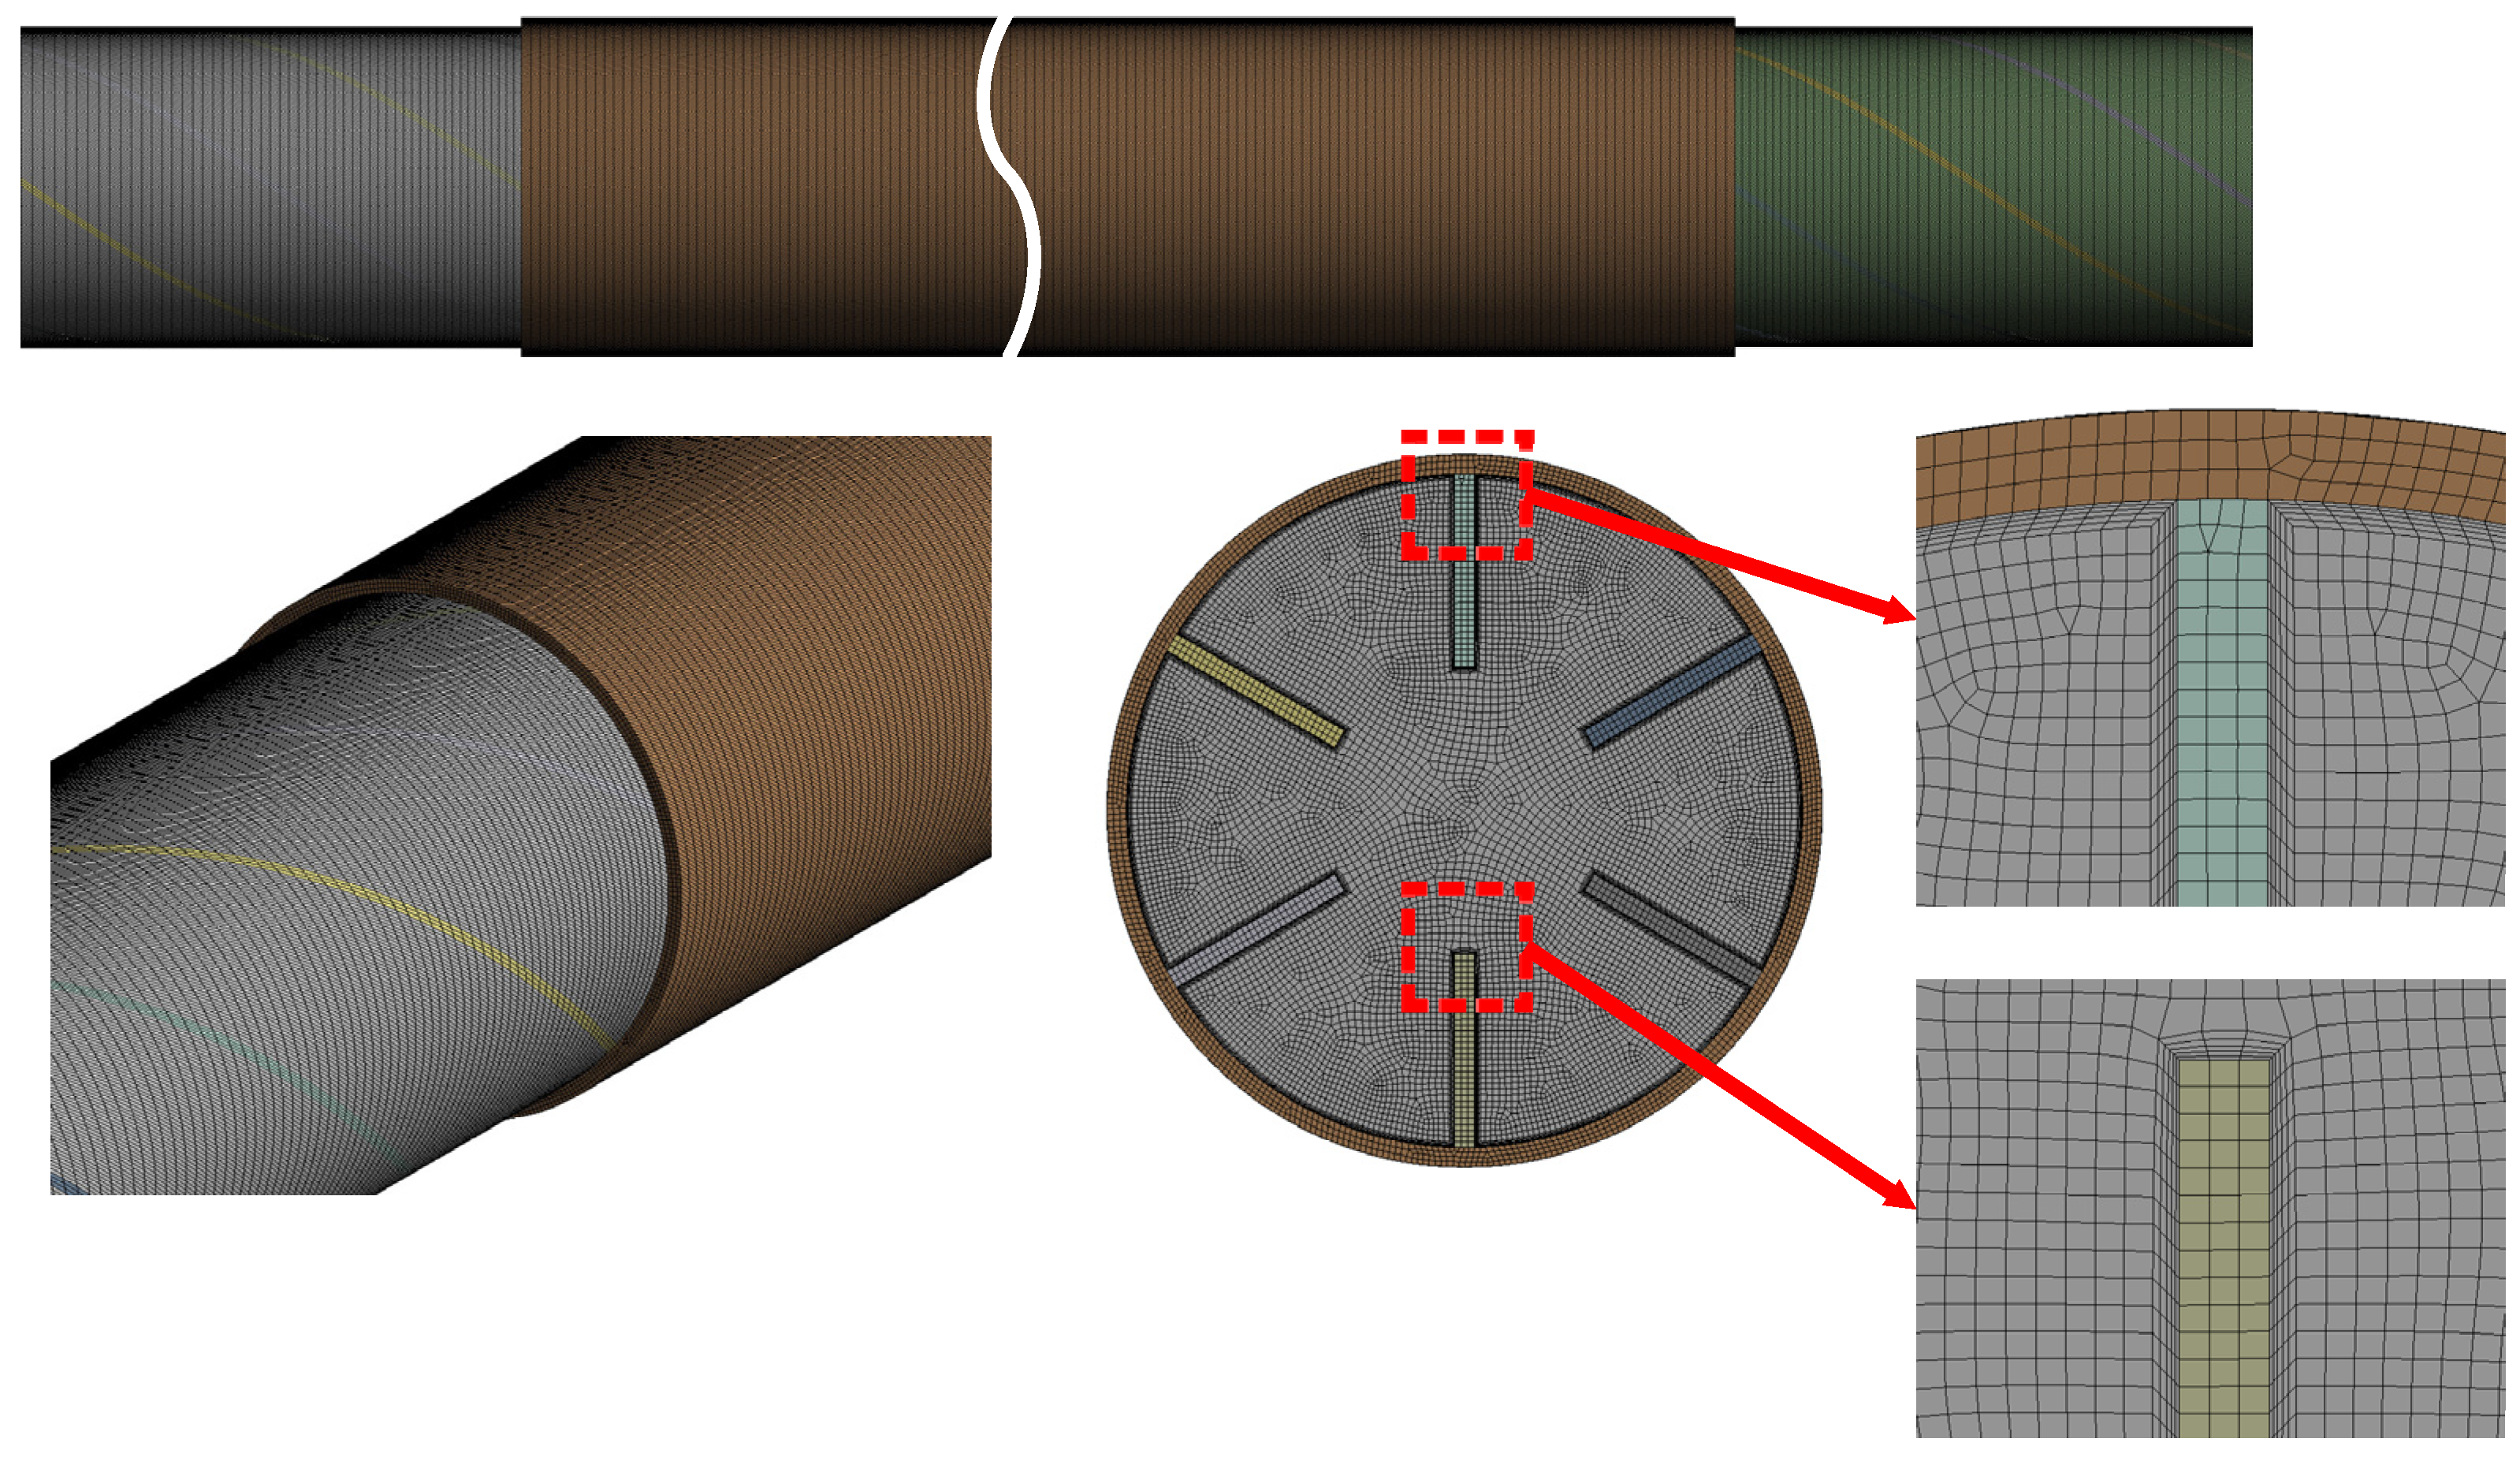
2.1. Geometry of the Model

The geometric structure of the internal spiral finned tubes proposed in this paper are shown in Figure 1. The model of the internal spiral finned tube was mainly composed of three parts: inlet section, outlet section and test section. The inlet and outlet parts were distributed at both ends of the pipe, and their lengths were 100 mm and 200 mm, respectively. As the core area of the study, the test part was embedded with multiple fins in rectangular cross-section, and the fins spiral through the whole test part. Specific parameters related to internal spiral fins can be seen in Table 1.
In this paper, 14 cases were considered to research the effect of internal spiral finned tubes on thermohydraulic performance. Geometrical parameters, including the height, the pitch, and the number of the fins, were adopted to be investigated, seen in Table 2.

2.2. Mathematical Modeling

The following assumptions were extremely necessary for the calculation of the above physical model:
(1)
The working fluid was an incompressible fluid;
(2)
The fluid flow was steady and there was no phase transition process in the tube;
(3)
The physical parameters of the working fluid were constant;
(4)
Thermal radiation was not considered.
Based on these assumptions, the governing equations of the turbulence model were as follows:
Continuity equation:
x j ( ρ u j ) = 0 ,   ( j = 1 ,   2 ,   3 )
Momentum equation:
p x i = μ x j ( u i x j + u j x i ) ,   ( i ,   j = 1 ,   2 ,   3 )
Energy equation:
ρ ( u i T ) x i = λ x j ( u i x j + u j x i ) ,   ( i ,   j = 1 ,   2 ,   3 )
where ρ represented the density of the working fluid, μ denoted the viscosity and λ was defined as the thermal conductivity.
The two-equation model was usually used as the fundamental turbulence model to explore the thermal performance of the heat exchange tubes. Choosing an agreeable turbulent model was of great significance to the results. In this paper, several simulation models (such as Standard k-ε, Realizable k-ε, Standard k-ω, BSL k-ω and SST k-ω) were used to calculate the heat transfer and flow characteristics in smooth circular tubes and compared with the empirical formulas of the predecessors. Finally, the results of Figure 2 showed that the Nu and f of the BSL k-ω and Standard k-ω turbulence model both agreed well with that of the smooth circular tube. The average errors of Standard k-ω were 5.53% and 9.33%, while the results of BSL k-ω were 5.11% and 8.45%, respectively. Therefore, the BSL k-ω was selected as the turbulence model in the internal spiral finned tube due to its outstanding accuracy.
In addition, the biggest advantage of the BSL k-ω model developed by Menter [29] was that the k-ω model in the near wall region was effectively combined with the k-ε model in the far end. In order to achieve this function, the k-ε model could be transformed into k-ω model by introducing a coefficient “ 1 F 1 ”.
The Transport Equations for the BSL k-ω Model:
ρ ( k u i ) x i = x j ( Γ k k x j ) + G k + S k + G b
Followed by:
ρ ( ω u i ) x i = x j ( Γ ω ω x j ) + G ω + S ω + 2 ( 1 F 1 ) ρ 1 ω σ ω , 2 k x j ω x j + G ω b
where G k represented the generation of turbulence kinetic energy. G ω denoted the production of ω.   Γ k = μ + μ t σ k and Γ ω = μ + μ t σ ω were defined as the effective diffusivity of k and ω, respectively.   σ k and σ ω were the turbulent Prandtl numbers for k and ω, respectively.
What needed to be noted was that the turbulence model equations could be applied in the k-ε model when the F 1 = 0 , while it could be used as k-ω model when the F 1 = 1 .
The blending function F 1   was given by
F 1 = tanh ( ϕ 1 4 )
S k   and   S ω were user-defined source terms. G b   and   G ω b accounted for buoyancy terms.   σ k , 1 = 2.0 ,   σ ω , 1 = 2.0 ,   σ k , 2 = 1.0 ,   σ ω , 2 = 1.168 , β i , 1 = 0.075 ,   β i , 2 = 0.0828 .
All other relevant parameters in fixed value were the same as those of the Standard k-ω model.

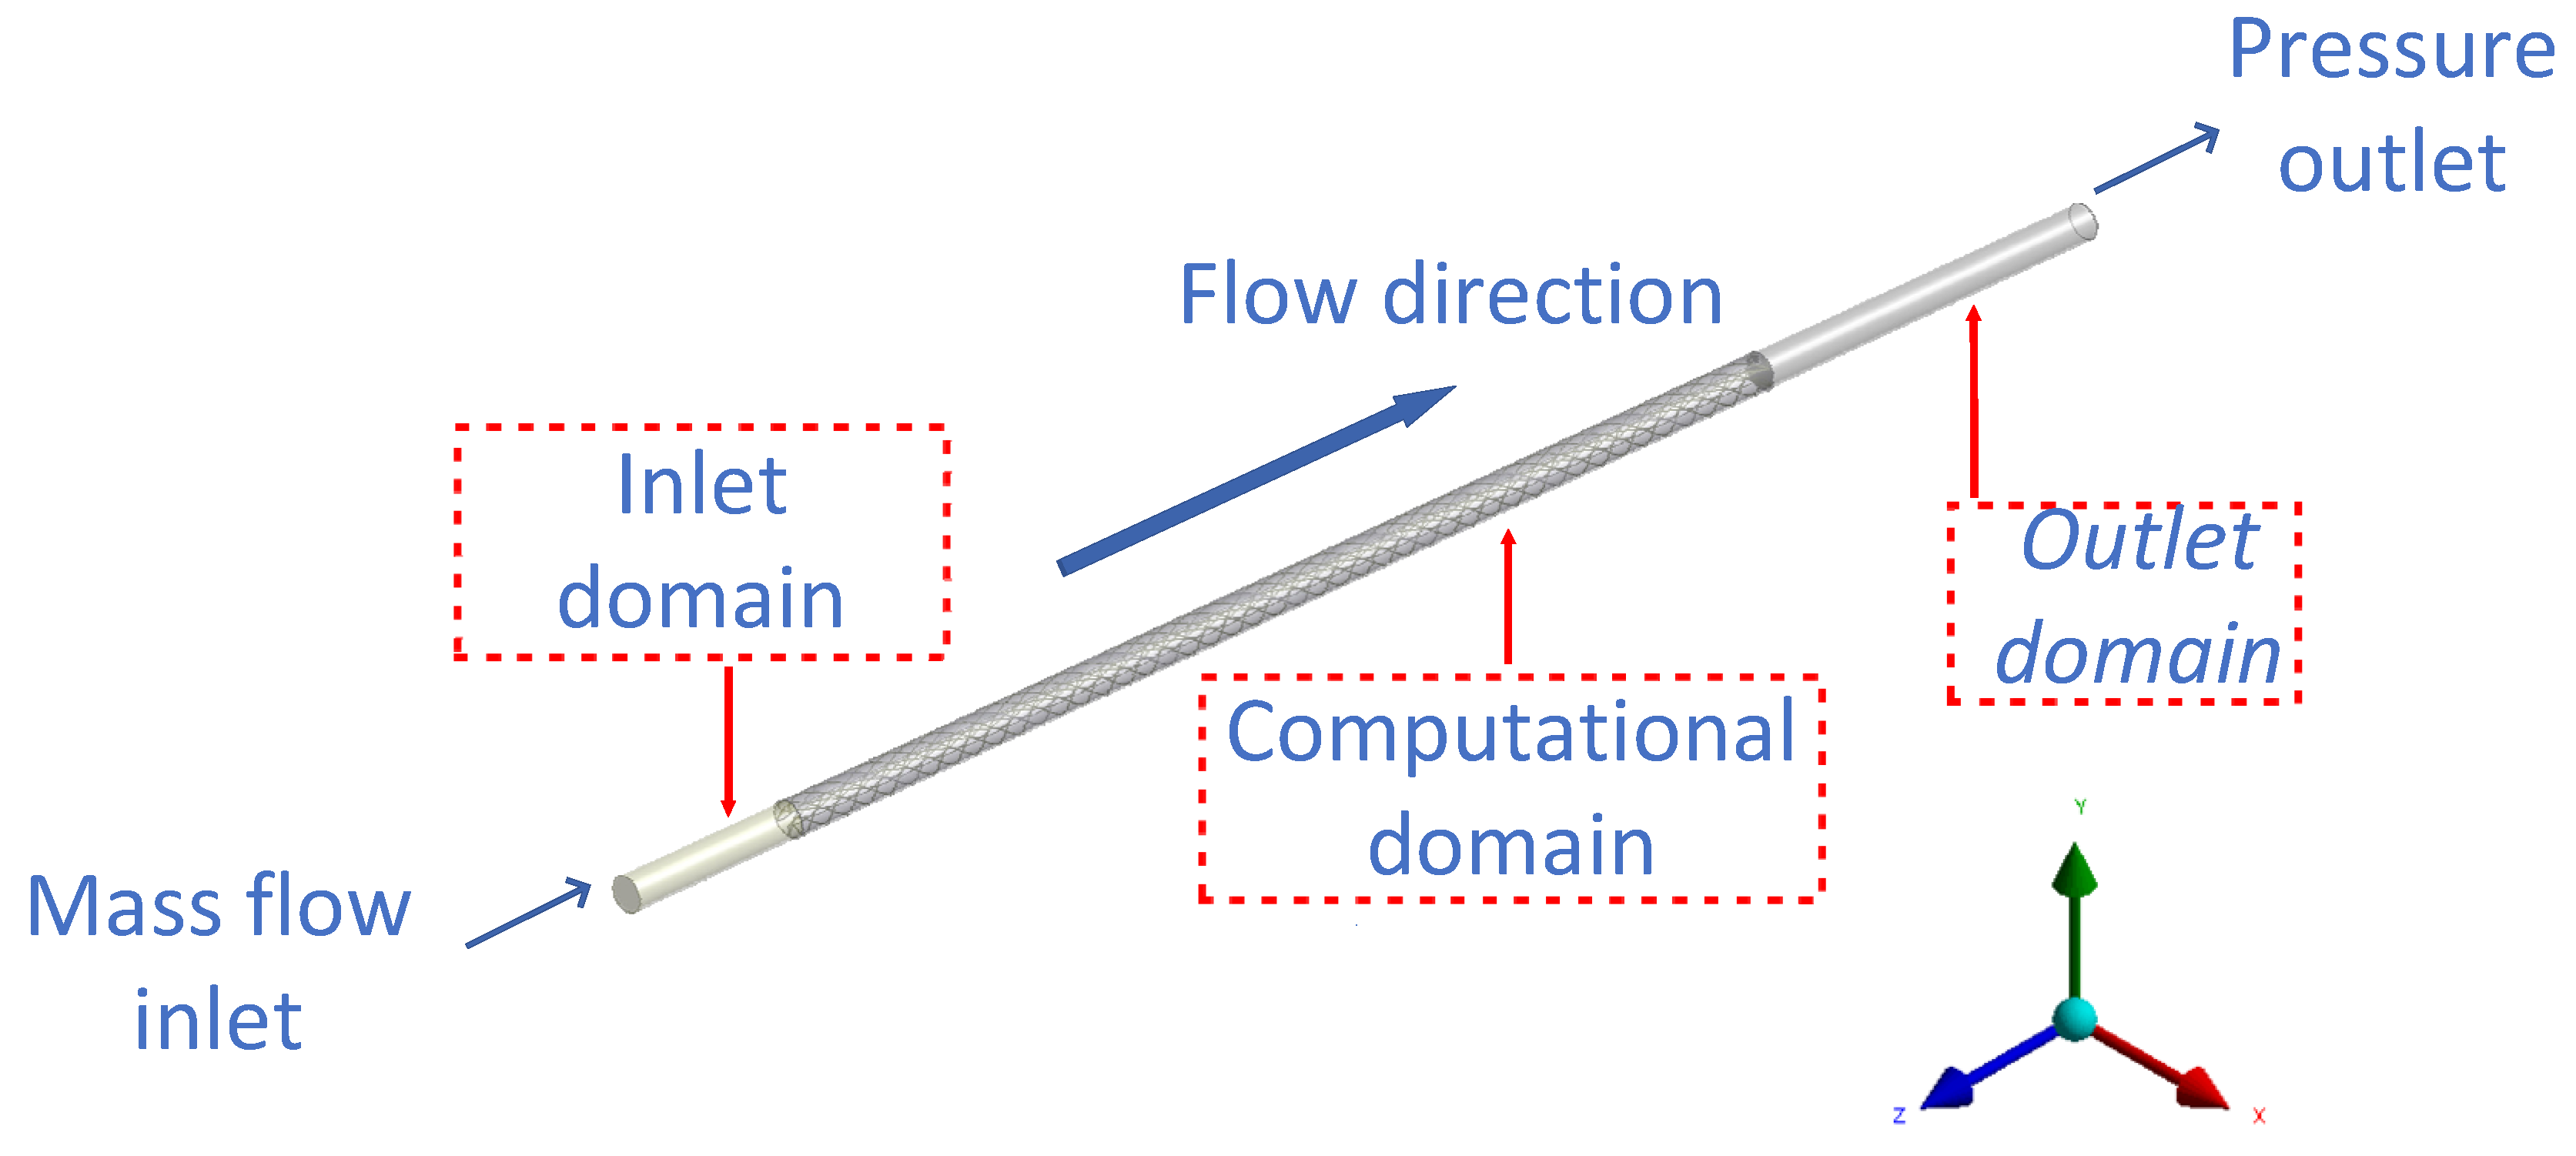
2.3. Boundary Conditions

In fact, the wall temperature distribution was not uniform. However, similar studies [30,31] showed that the uniformity of the wall temperature had little effect on the results, and the corresponding nonuniform boundary conditions were difficult to be adopted in the numerical simulation. Hence, a uniform wall temperature boundary condition was applied in the present work. In addition, the turbulence intensity boundary condition, which was applied in this paper, came from the relevant literature [32]. The boundary conditions before calculation are shown in Figure 3 and the details set as follows:
The boundary conditions of the inlet section:
g i = 0 , g j = 0 , g k = c o n s t a n t , T i n l e t = 333.15 K , I = 0.16 ( R e ) 1 / 8
The boundary conditions of the outlet section:
v i x = v j y = v k z = 0 , T z = 0 , p = 0
Wall boundary conditions:
v i = 0 , v j = 0 , v k = 0 . T w a l l = 353.15 K  
where, the mass flow g k were 0.0412, 0.0893, 0.1373, 0.1854 and 0.2334, respectively, and the corresponding turbulence intensity I were set as 5.88%, 5.34%, 5.06%, 4.87% and 4.73%, respectively. Water was selected as the working fluid in this article and thermo-physical properties of water are shown in Table 3.
The commercial CFD software FLUENT was used to solve the governing equations under the given boundary conditions, and its solution method was mainly based on the finite volume method (FVM). For internal spiral finned tubes, the main settings in the software included were as follows: The velocity–pressure coupling was calculated by coupled algorithm and the second-order upwind scheme was applied to solve the momentum and energy equations, except that the turbulent kinetic energy and specific dissipation rate equations were settled by first order upwind. As for the minimum convergence criterion, the continuity equation was set as 10−6 while the energy equation was set as 10−7.

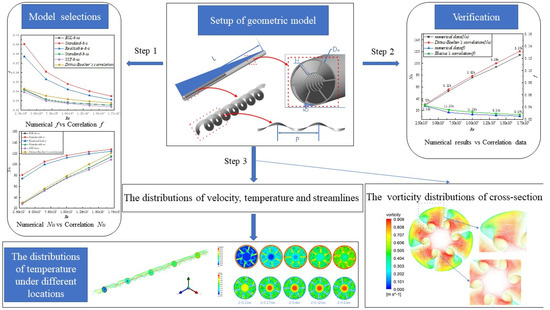
3. Computation Parameters and Its Validation

3.1. Data Reduction

Nu (Nusselt number), f (f factor) and Re (Reynolds number) [34], as the most important indexes to measure heat transfer and flow characteristics of the internal spiral finned tube, were expressed as:
N u = D h λ
f = 2 D Δ P L ρ u 2
R e = ρ D u μ
where D was the hydraulic diameter of the working fluid, h denoted the average heat transfer coefficient, Δ P = p i n p o u t represented the pressure difference between inlet and outlet, L represented the total length of pipe and u represented the velocity vector of working fluid in z-axis direction.
The mathematical expressions of the average temperature and pressure of the whole cross-section were given as:
T ¯ = A u T d A / A u d A
p ¯ = A p d A / A d A
In addition, heat transfer coefficient h, heat transfer capacity Q and logarithmic average temperature difference Δ t m were given as:
h = Q A h t Δ t m
Q = c g | t i n t o u t |
Δ t m = t m a x t m i n l n t m a x t m i n
where c, g, t i n , t o u t , A h t and Δ t m denoted specific heat capacity, mass flow, inlet temperature, outlet temperature, the area of heated wall and logarithmic mean temperature difference, respectively.
t m a x   and t m i n   were defined as:
t m a x = m a x { t 1 , t 2 }
t m i n = m i n { t 1 , t 2 }
where t 1 = | t i n t w a l l | ,   t 2 = | t o u t t w a l l | .   t i n was the temperature of the inlet section.   t o u t was the temperature of the outlet section, while t w a l l was the temperature of the wall.
The enhancement effect of heat transfer performance in the internal spiral finned tubes needed corresponding evaluation indexes for professional evaluation, the performance evaluation criterion (PEC) proposed by Webb [35,36] was selected as the index to measure the strengthening degree of internal spiral finned tube, and its expression was given as:
P E C = N u / N u 0 ( f / f 0 ) 1 / 3
where   N u 0 and   f 0 denoted the Nusselt number and friction factor, respectively, of an ordinary circular tube in the given range of Reynolds number.

3.2. Grid Independence Verification

Mesh generation was an important segment in the simulation process, and its quality played a decisive role in the final simulation results. Therefore, in order to facilitate the analysis of heat transfer and flow characteristics in the internal spiral finned tube, the main meshing methods included unstructured mesh and structured mesh. In this paper, structured meshing was adopted in the computing domain. In order to improve the accuracy of the simulation as much as possible, the grids on the tube wall and surface of internal spiral finned tube were locally densified. The solutions of the thermal and hydraulic boundary layer and the specific grid divisions are shown in Figure 4.
The change of grid number often led to a certain deviation in the simulation results. When the grid number approached a specific interval, the simulation results tended to be stable without change, which could prove that the grid number was appropriate. Hence, in order to obtain the suitable value, the grid independence test was necessary. In this paper, a total of five groups of grids were set to test the independence of grids, such as 8,065,419, 11,203,125, 14,407,200, 17,735,446 and 19,416,892, and the selected object was the internal spiral finned tubes with N = 6. According to the variation range of Nu and f, the optimal number of grids could be inferred. As the number of grids increased, it can be seen from Table 4 that the deviations of Nu and f became smaller. It is worth noting that the deviations of Nu and f tended to be constant when the element number reached 14,407,200. The proper grid system not only avoided wasting unnecessary time, but also ensured accuracy of the simulation. Hence, the grid system with 14,407,200 grid numbers was selected as the grid system for follow-up investigation.
In the process of mesh generation, the velocity and temperature boundary layers should be captured by the grids. According to the Fluent users’ guide [37], the value of non-dimensional y+ parameter should be less than 1. In this article, the value of y+ varied from 0.58 at Re = 3000 to 0.86 at Re = 17,000. It was obtained that the boundary layers of the computational domain had been well captured. In addition, local convection coefficient and Nu were two important indexes to measure the capture ability of grids.

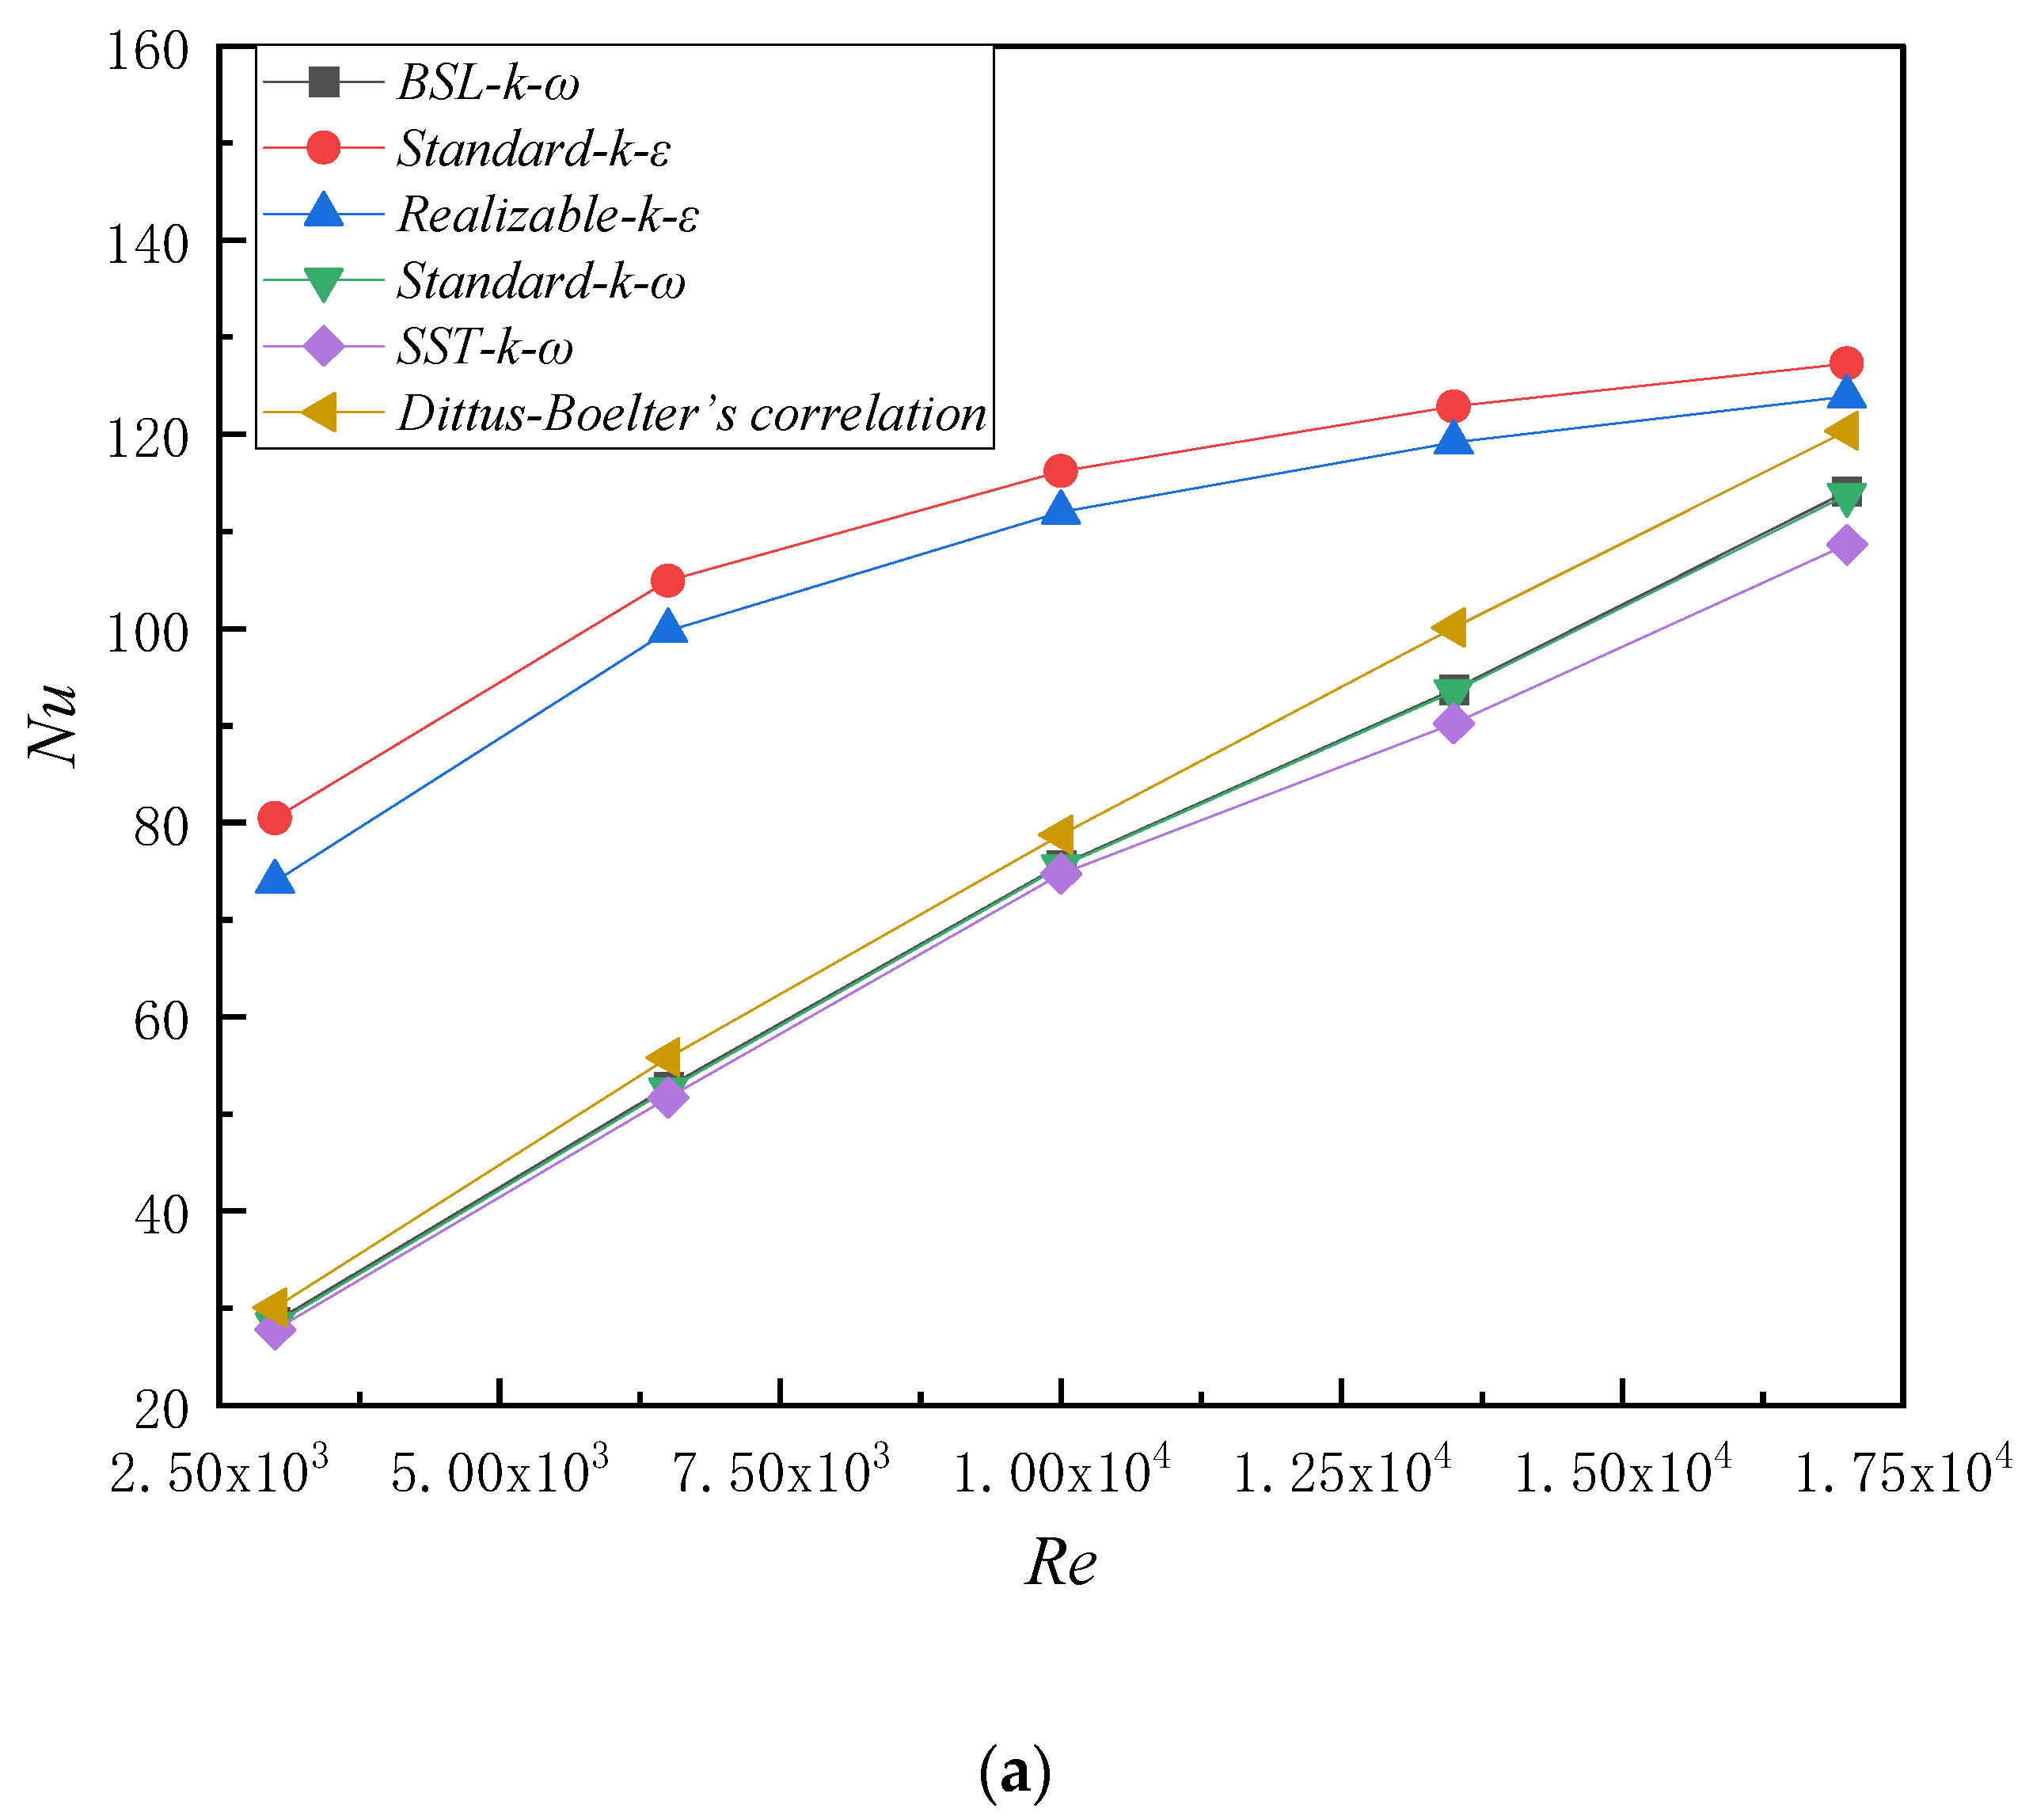
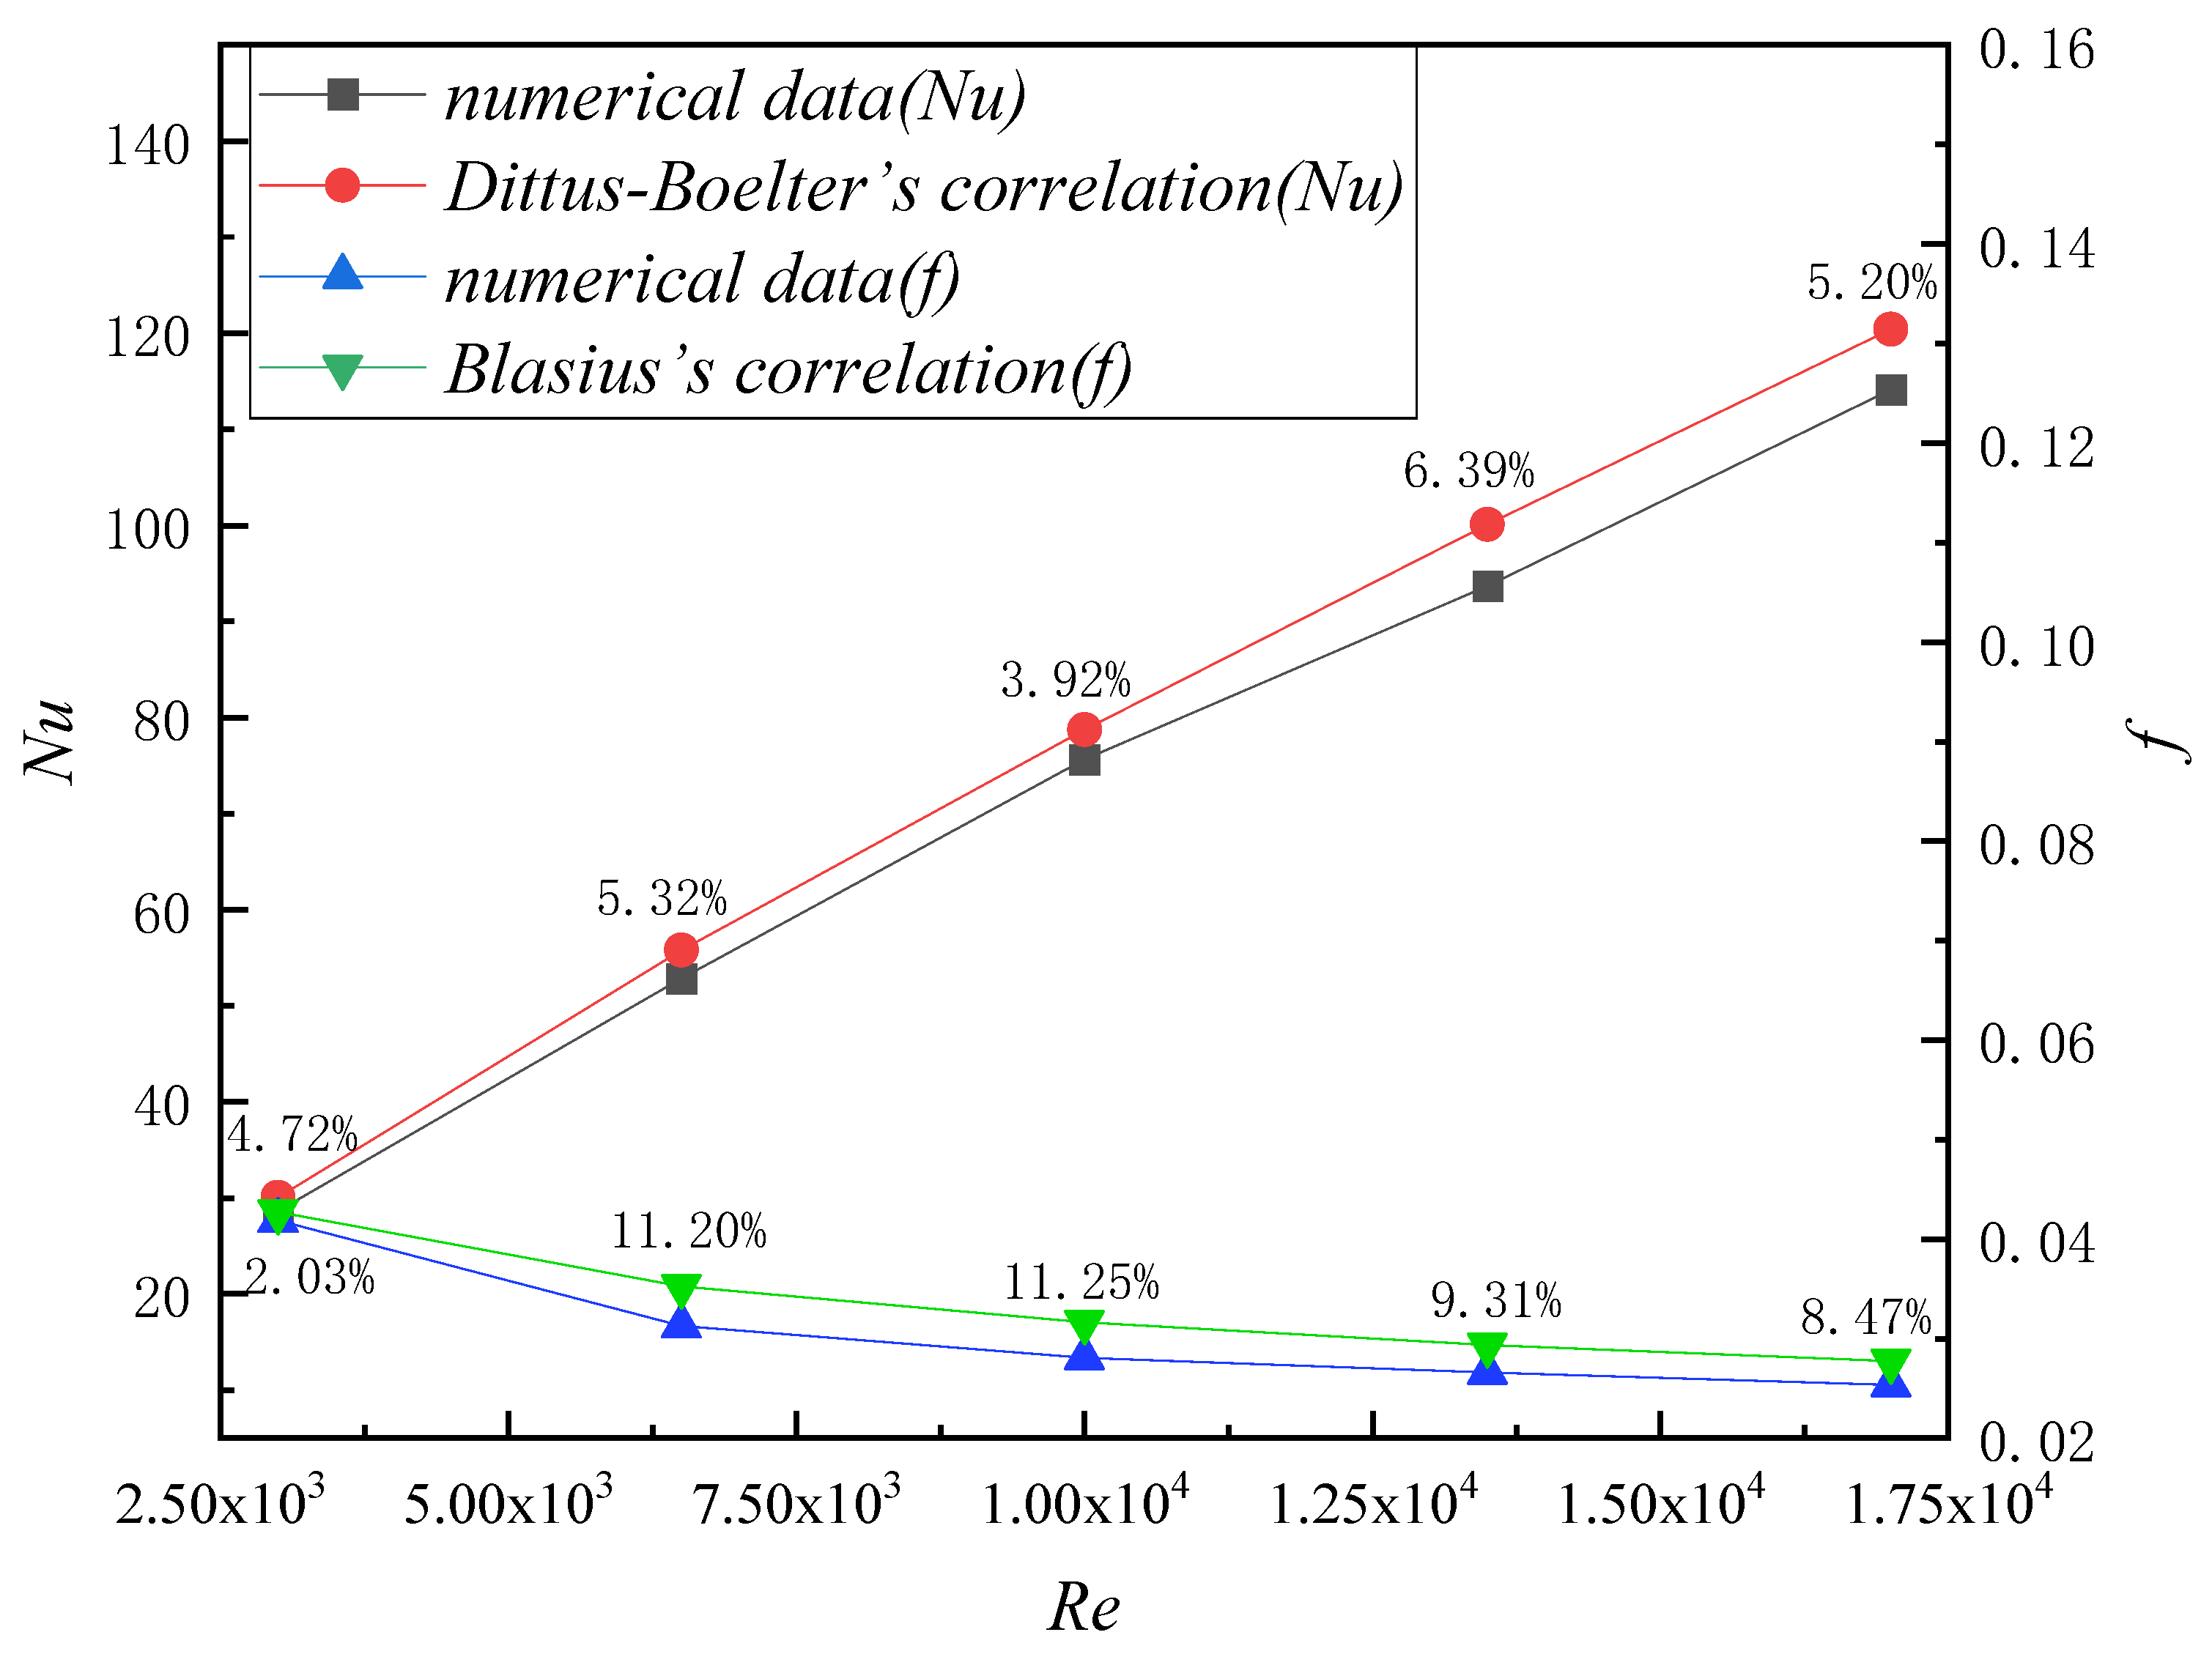
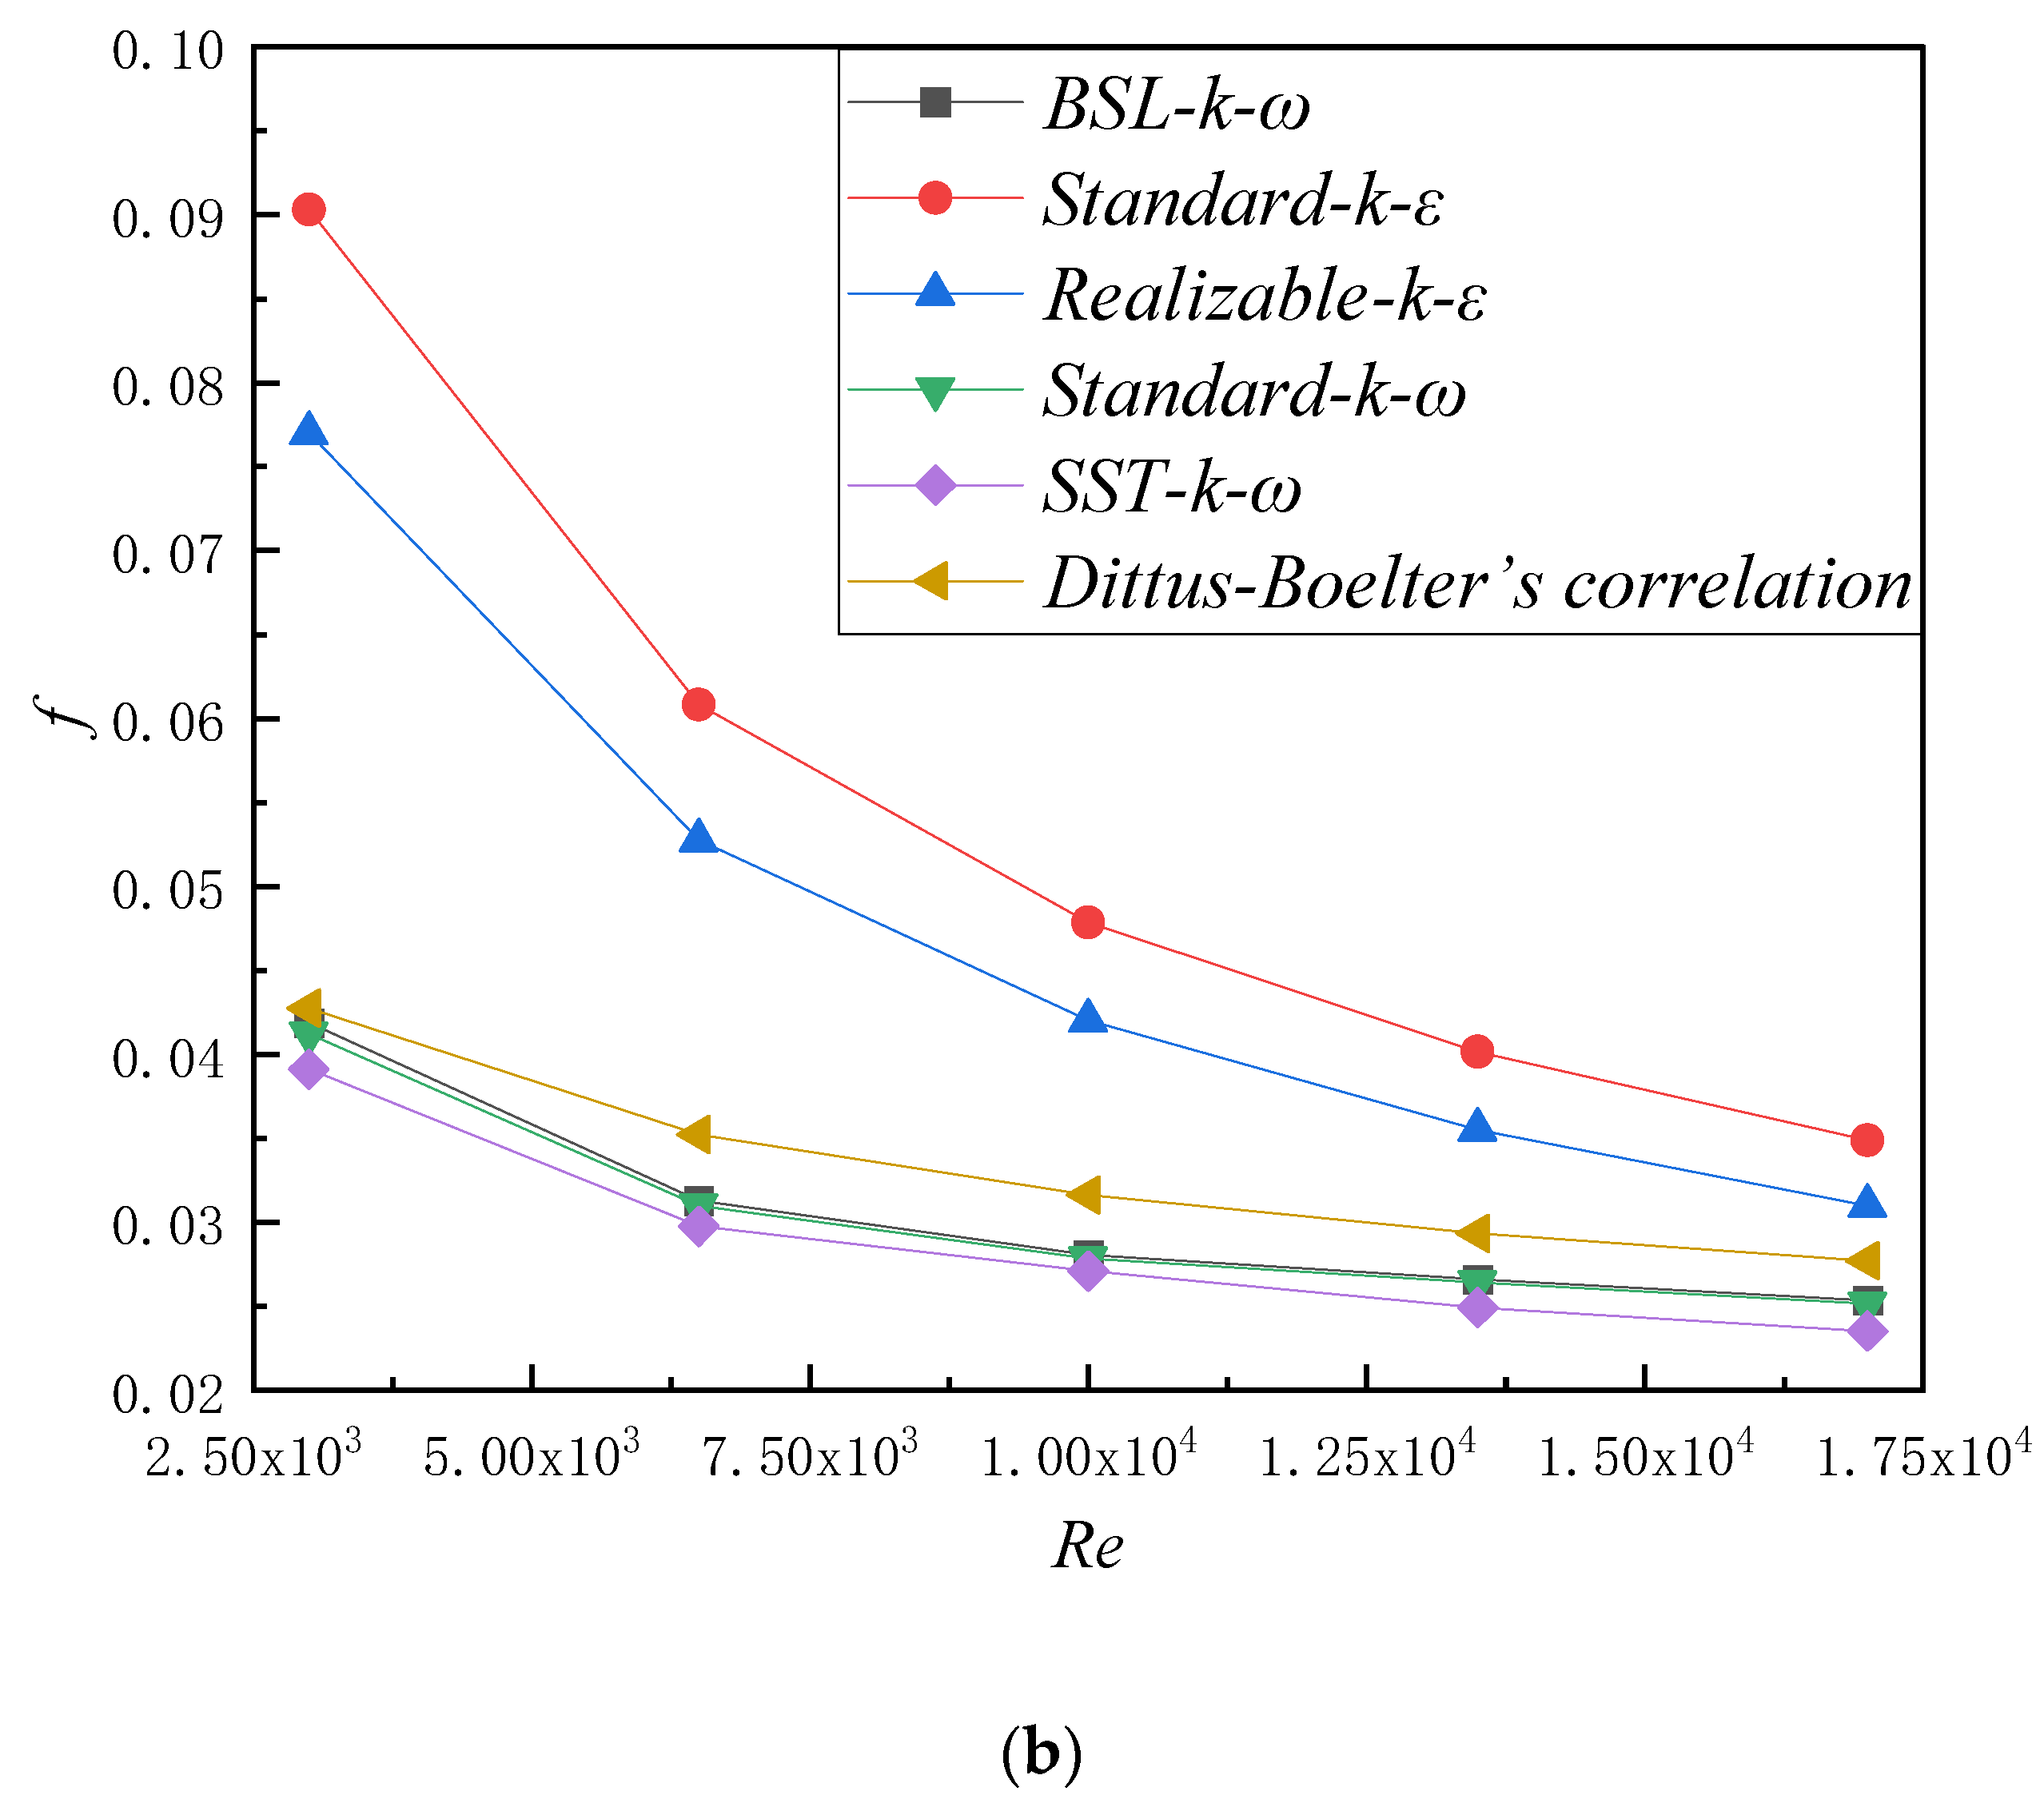
3.3. Reliability Verification of Simulation Technology

By comparing the calculated results of Nu and f with the empirical formulas proposed by predecessors, the reliability and accuracy of the simulation results were verified. This article compared the calculated result of Nu with the result predicted by Dittus–Boelter’s formula. The formula of Dittus–Boelter which was used to predict for Nu is as follows:
N u = 0.023 R e 0.8 P r 0.4
Similarly, the simulation results of f were compared with the results calculated by Blasius’s empirical formula. The formula of Blasius which was used to predict for f is as follows:
f = 0.3164 R e 0.25
for 4 × 10 3 < R e < 10 5 .
Both of these correlations were obtained from the literature for heat exchange tubes [38]. In this paper, the internal spiral finned tube (N = 6, H = 0 and no pitch), which was similar to the straight tube, was chosen to compare with the empirical formulas. The comparisons of the Nu and f between the simulated results and formulas above are displayed in Figure 5. From the line chart, it was not difficult to observe that the fitting degree of Nu and f were both rather high. In detail, the arithmetic mean errors of Nu and f were 5.11% and 8.45%, respectively. Obviously, the mean errors of both Nu and f were less than 9%, and these errors might be caused by the uncertainty of calculation parameters. In summary, the numerical method adopted in this paper was reasonable and authentic.

4. Result and Discussion

The reliability of the BSL k-ω model was verified before. As the main research object of this paper, the internal spiral fins could change the flow path of the working fluid and form a secondary flow to enhance the heat transfer and flow characteristics in the tube. The secondary flow could produce additional force because it was perpendicular to the primary flow. This hydrodynamic force was usually related to the inertial flow state. Compared with the primary flow, the secondary flow was relatively small, but it could displace the particles and affect the manipulation of the particles. Secondary flow was widely used in the mixing, trapping, focusing and separation of fluids and particles [39,40,41]. The secondary flow could greatly improve the heat transfer coefficient on the inner and outer surfaces of the tube.
In this section, the temperature, velocity and streamlines distributions in circular tube and internal spiral finned tubes were proposed and solved by commercial software FLUENT. Moreover, the present works were mainly considered from three influencing factors, namely, the pitch P, the height H and the number N of the internal spiral fins. The range of Re was set as 3000 to 17,000.

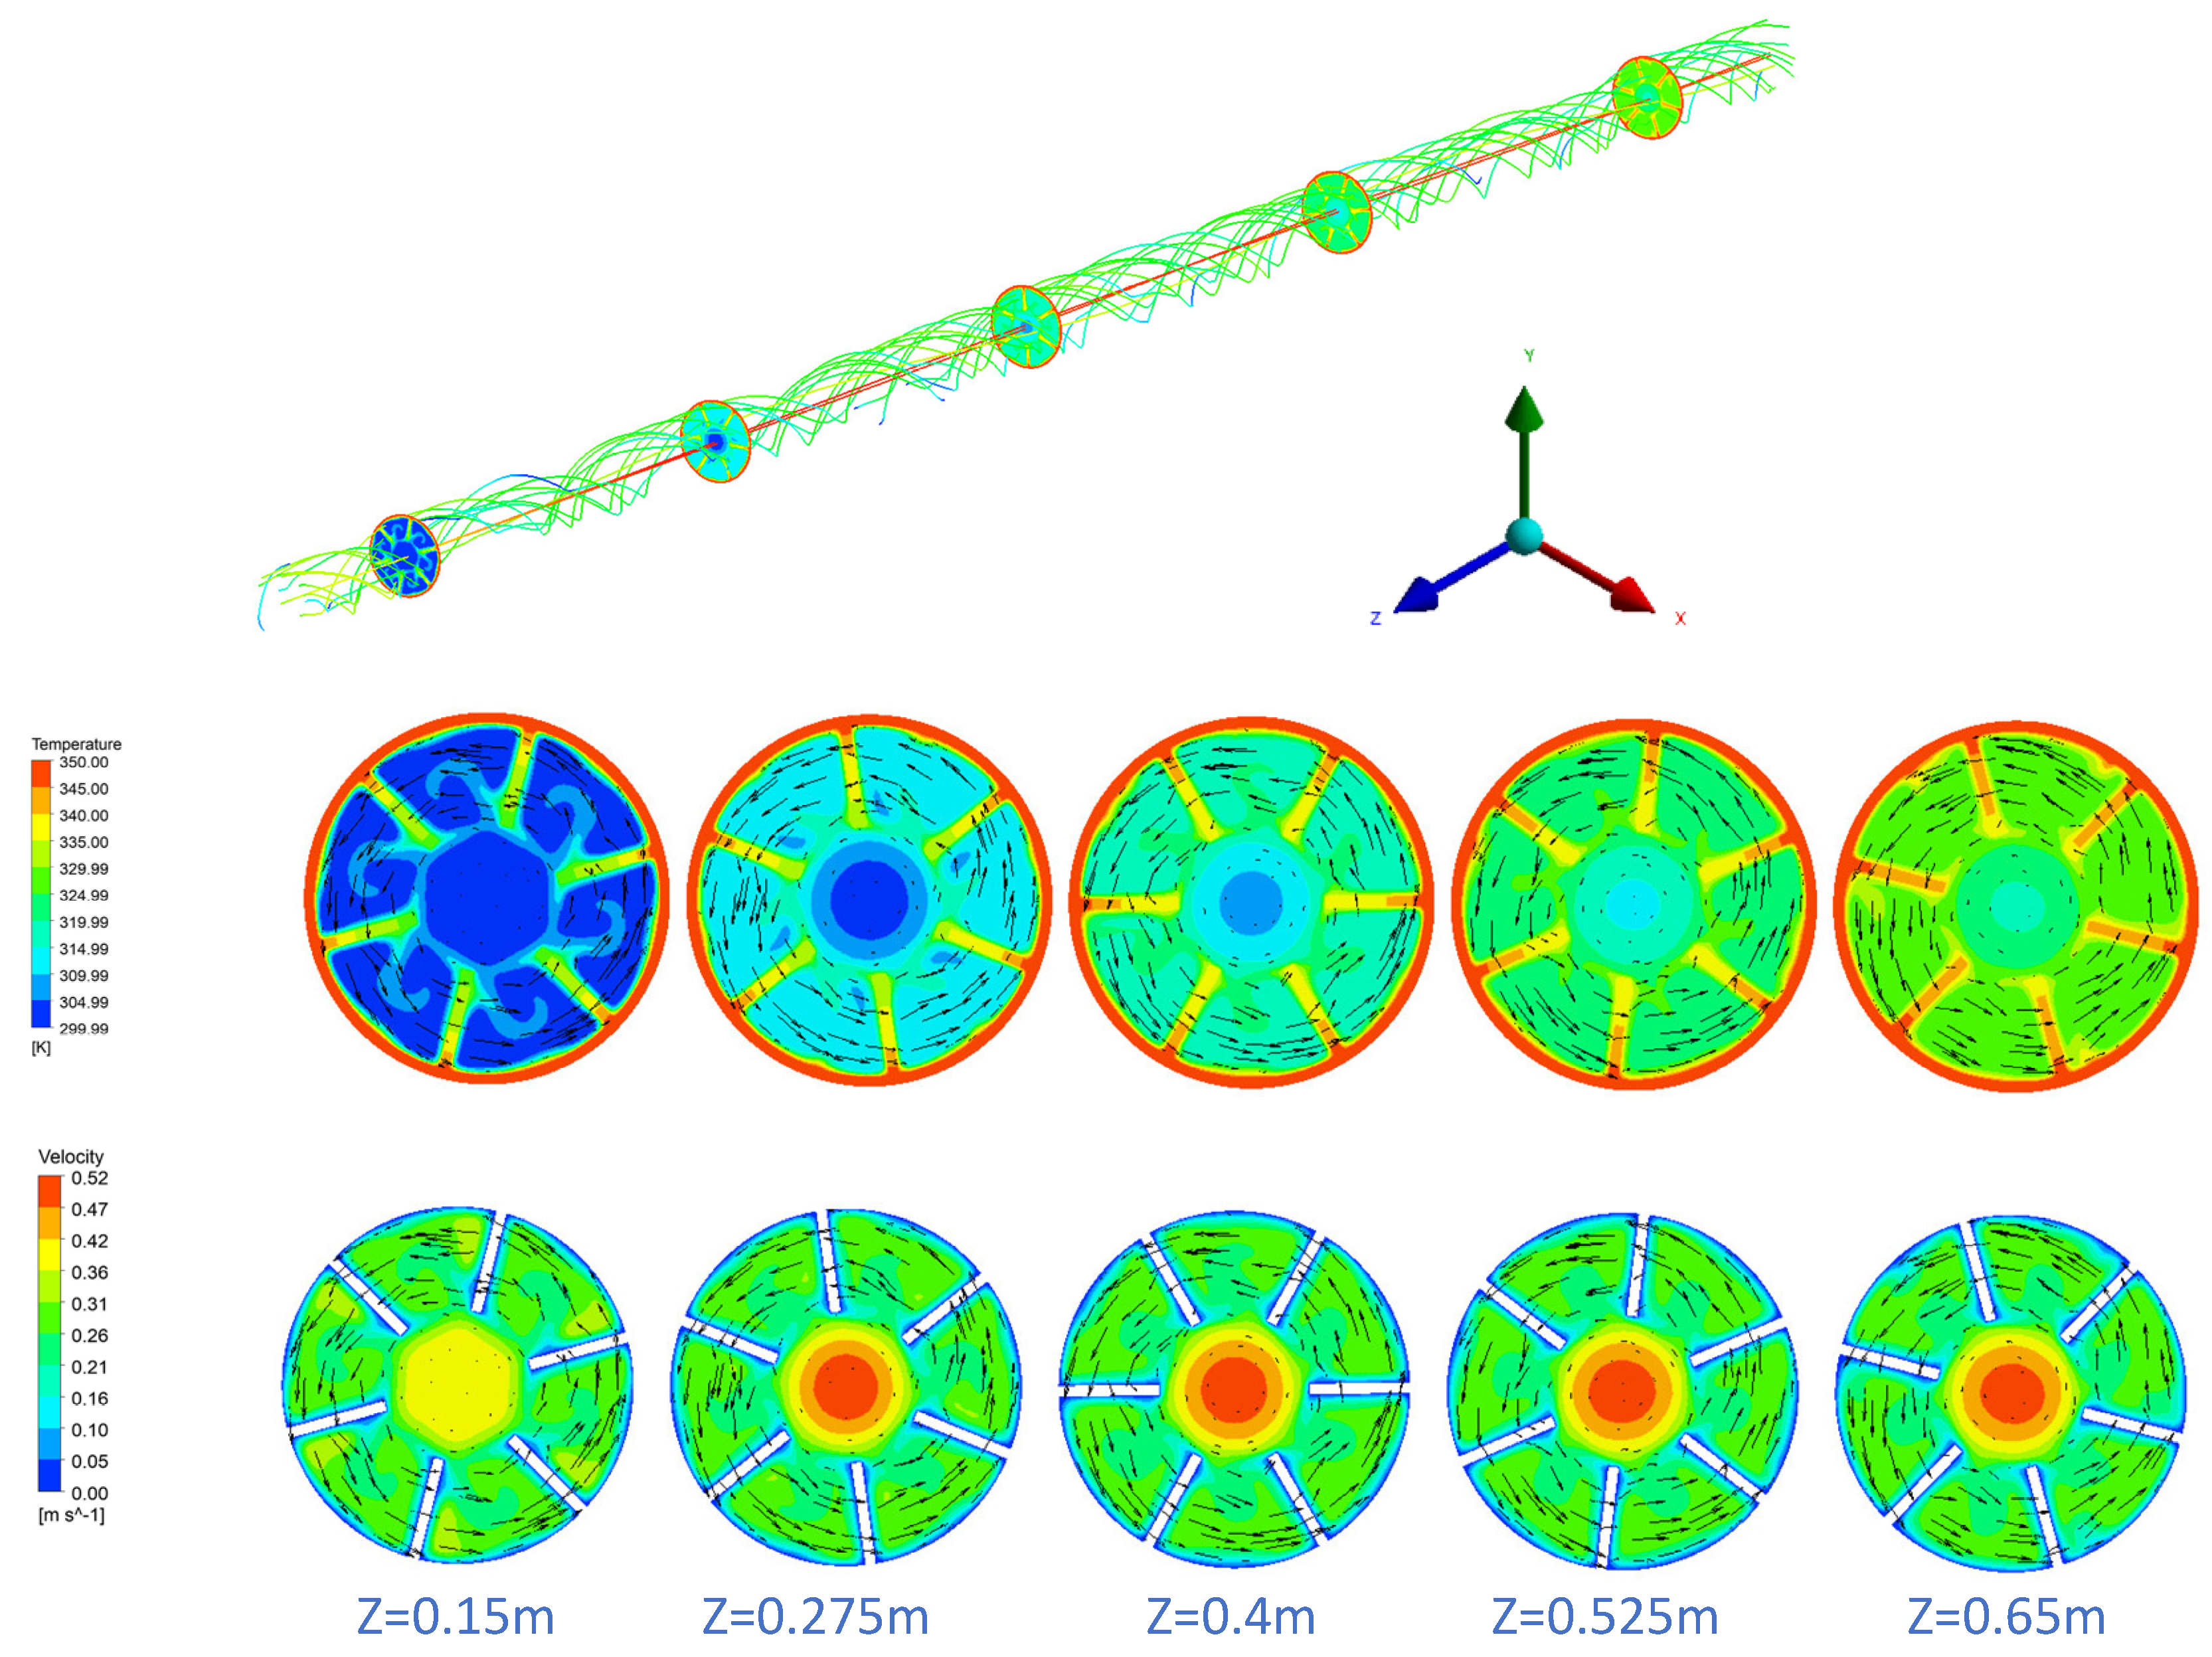
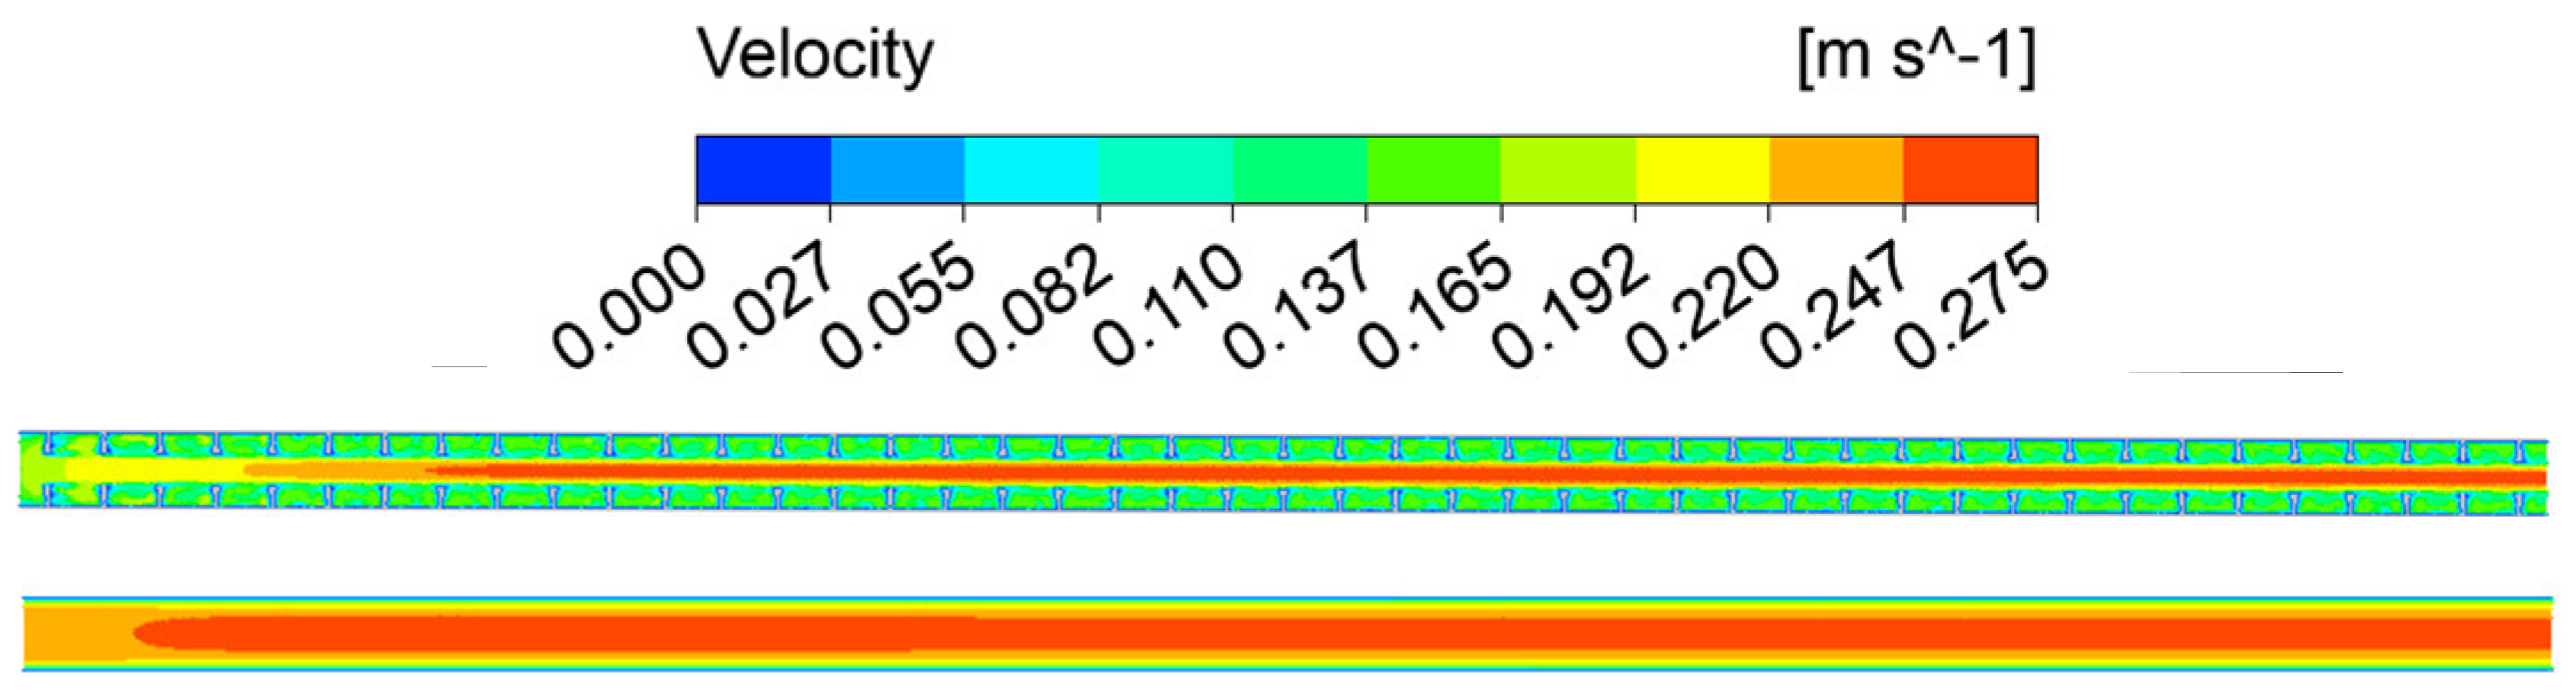
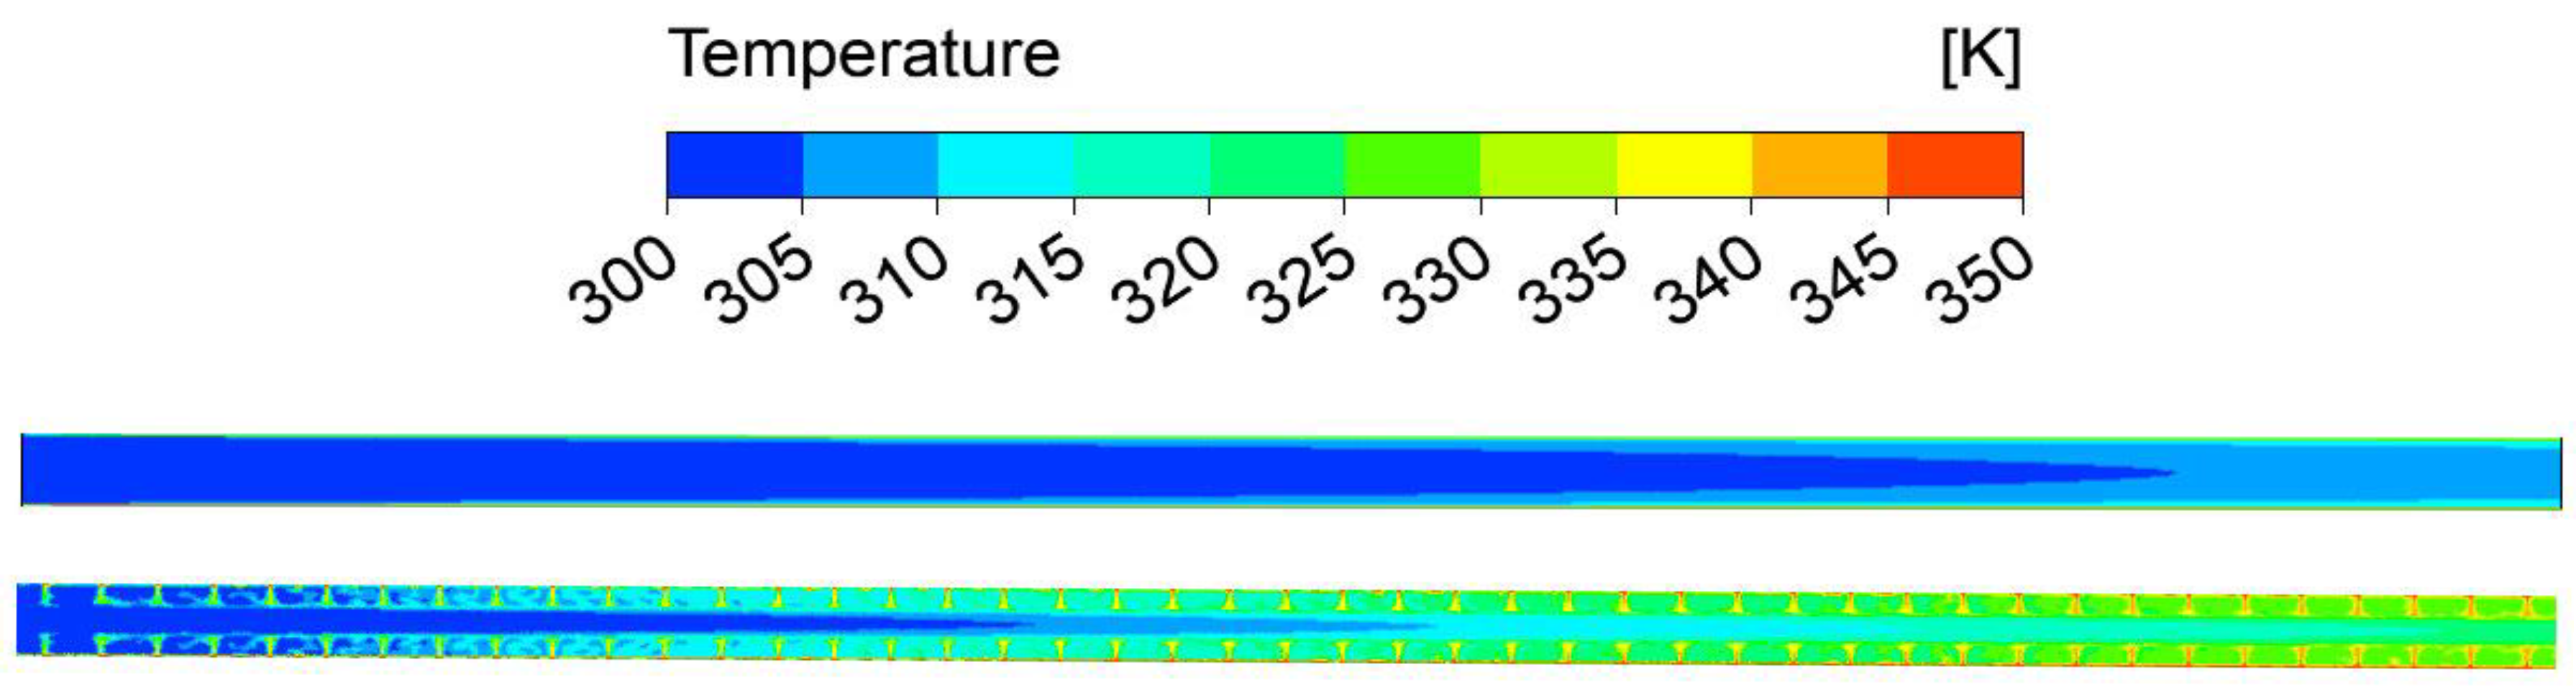
4.1. Analysis of Influence of RWVGs on Temperature and Streamlines Distributions

Figure 6 mainly shows the temperature and velocity distribution in the internal spiral finned tube when N = 6, H = 5, and P = 75. It is not difficult to obtain from the figure that the velocity distribution in the central area of the pipe was very uniform, and the velocity near the center of the circle was relatively high. The main cause of this phenomenon was that the fluid in the central region of the tube was in a complete turbulent state, which was consistent with the velocity distribution in the ordinary circular tube, as shown in Figure 7. In the spiral region, the average velocity was slightly higher than that in the central region. The velocity distribution in the spiral region was affected by the centrifugal force of the spiral flow to produce a vortex, and its velocity distribution was asymmetric.
From the five intercepted sections, it can be concluded that the average temperature of the cross-section increased gradually along the flow direction of the working fluid. The temperature distribution in the central region was relatively uniform and the temperature rose slowly, while the temperature distribution in the spiral region was affected by centrifugal force, and the thermal boundary layer on the inner wall of the pipe was destroyed, which sped up the heat exchange between the external environment and the fluid in the pipe. Its distribution was spiral, and the temperature rose fast. For the ordinary circular tube, the heat exchange of the fluid in the tube mainly came from the boundary layer, while a large number of fluids in the non-boundary layer could only exchange heat with the boundary layer fluid due to the lack of radial flow. Therefore, as shown in Figure 8, the heat transfer performance of the ordinary circular tube was relatively poor.
Furthermore, the vorticity distributions of the internal spiral finned tube are displayed in Figure 9. Owing to the internal spiral fins, the fluid in the spiral region flew counter-clockwise, while the fluid in the central region was mainly axial flow. Hence, the secondary flow could probably be formed near the boundary where the two regions contacted each other.

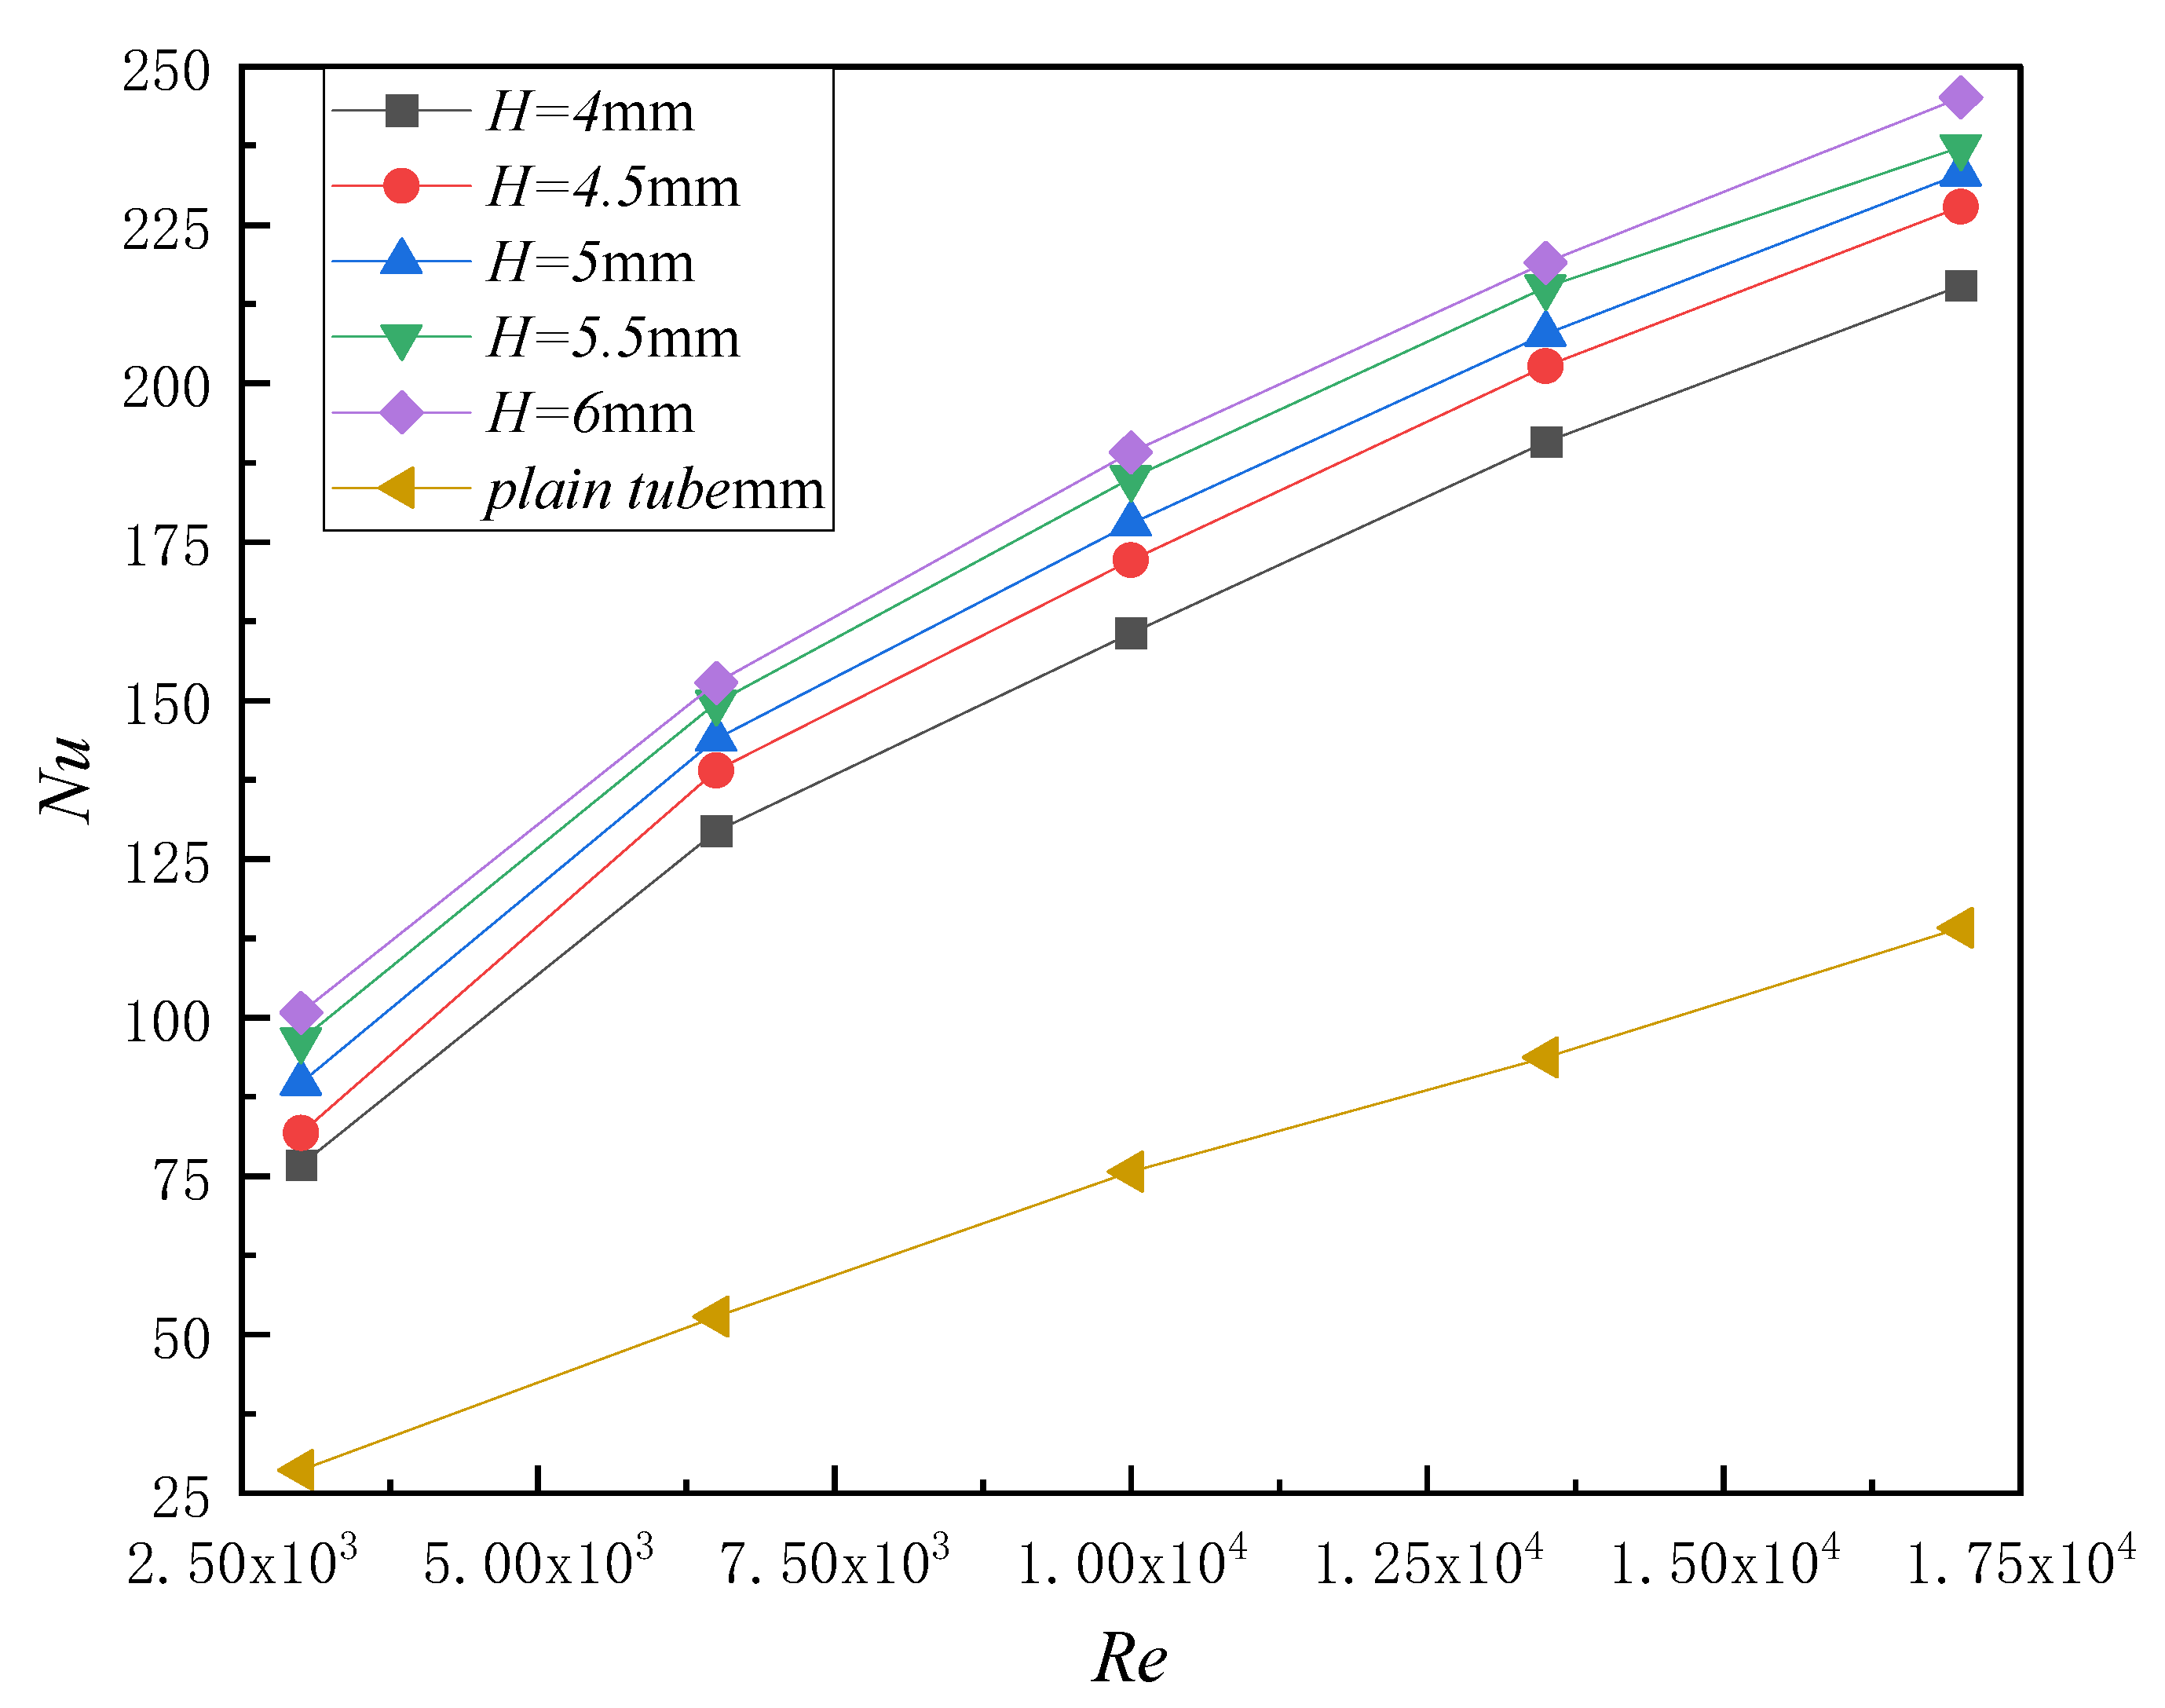
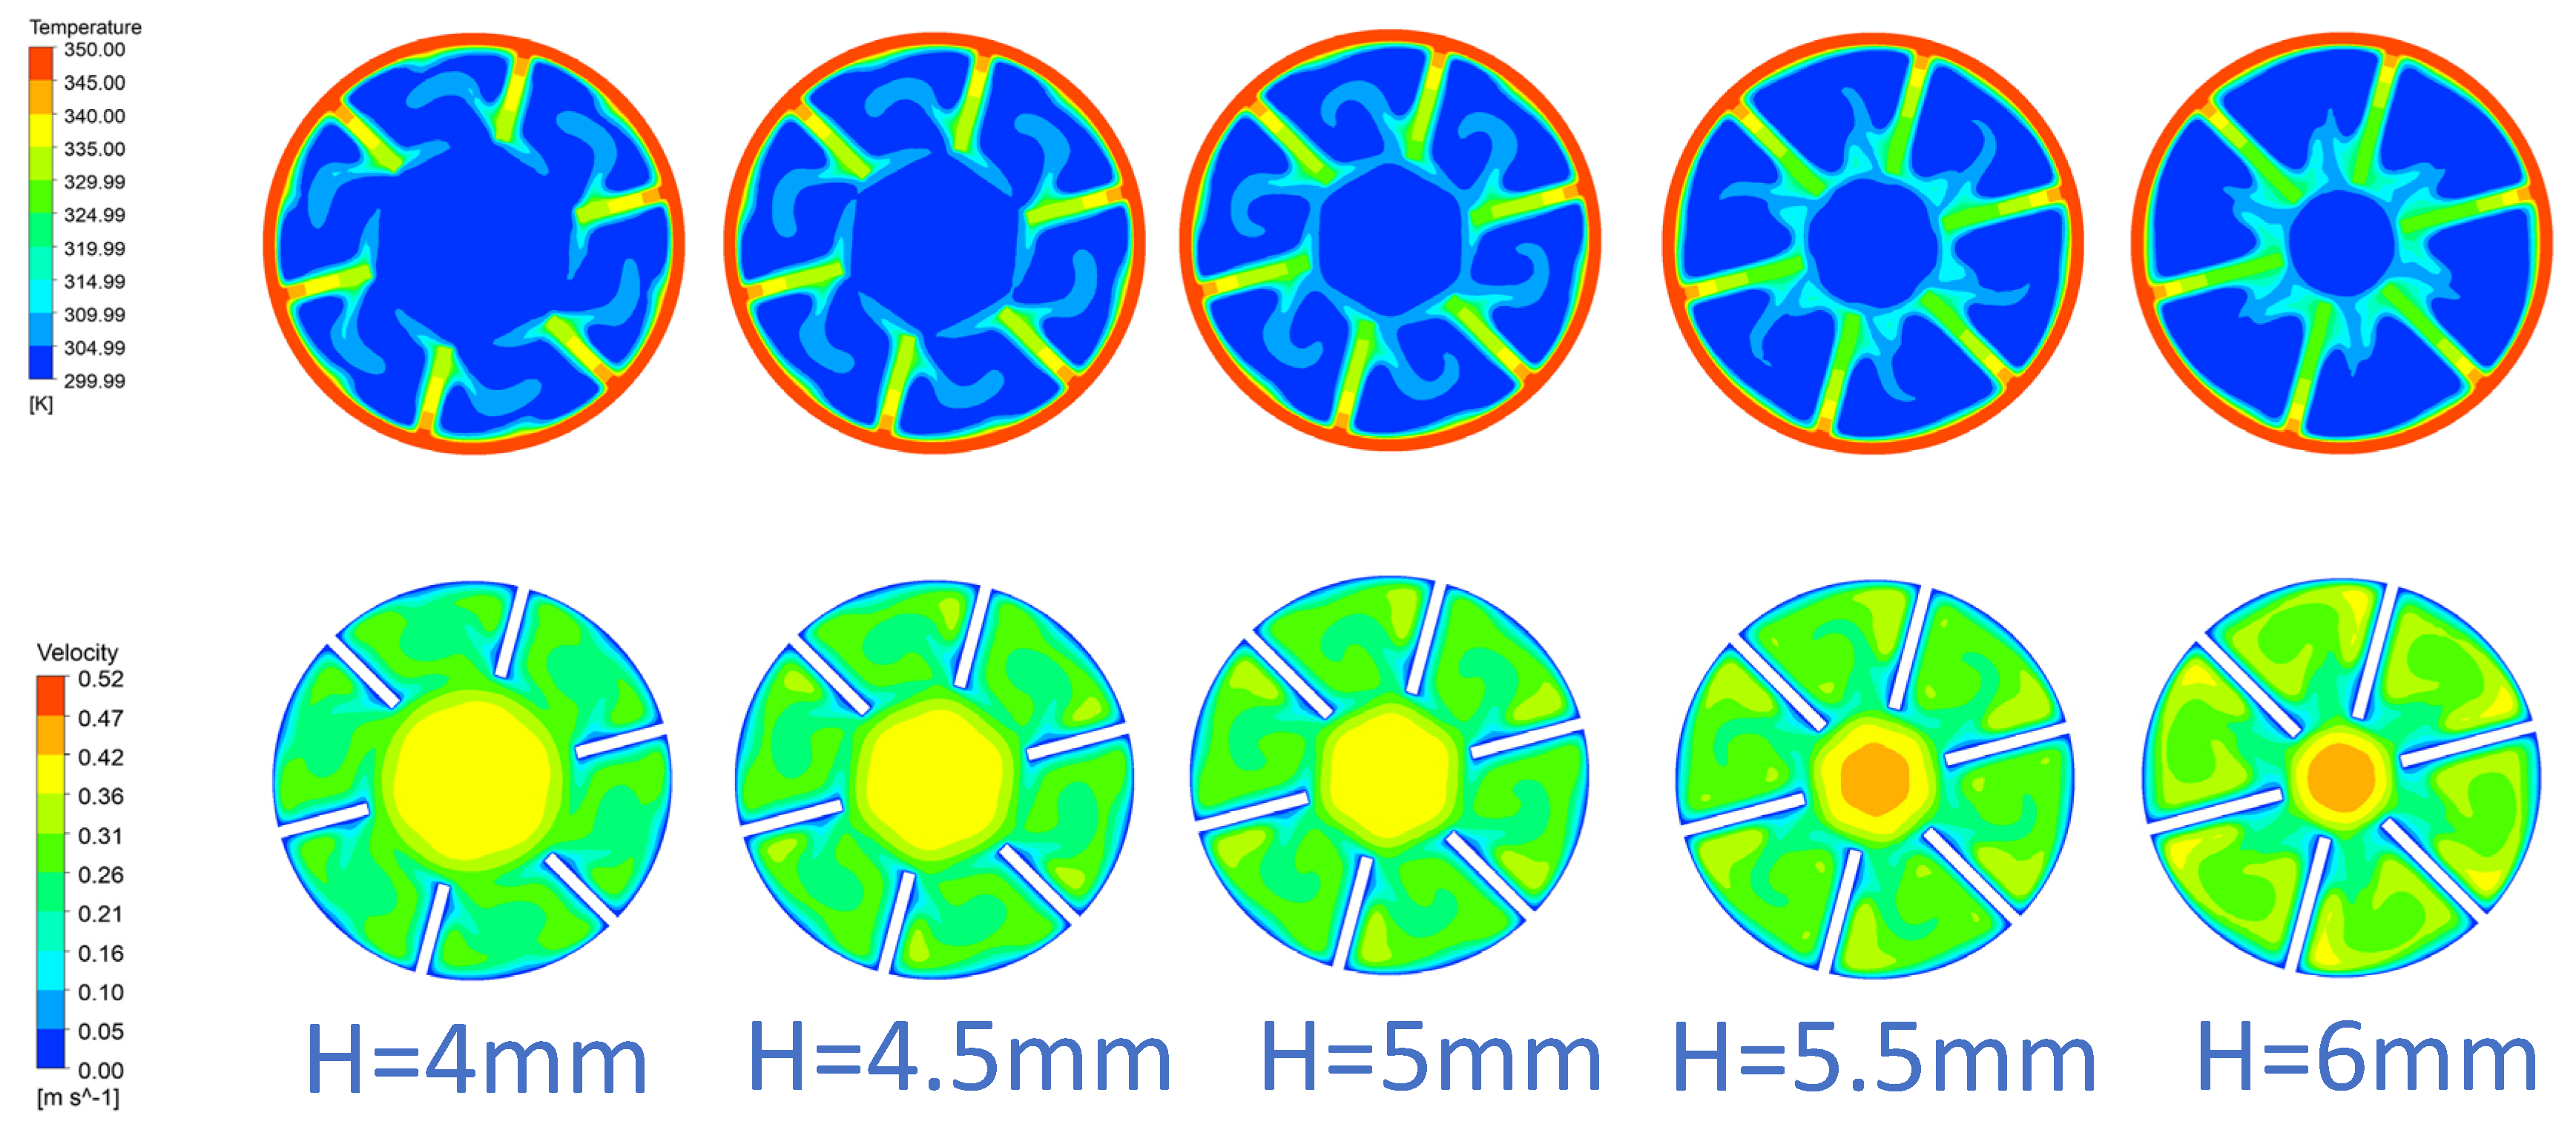
4.2. Effect of the H on Heat Transfer and Flow Characteristics

Figure 10 compares the heat transfer between ordinary circular tube and internal spiral finned tubes (H = 4, H = 4.5, H = 5, H = 5.5, H = 6). In Figure 10, the relationship between Nu and Re is presented. It can be observed from the figure that the change trend of Nu in each tube was almost the same. Moreover, the numerical relationship between Nu and Re was positively correlated when Re is in the range of 3000 to 17,000. In addition, the Nu of five different specifications tubes were much higher than that of plain tube under the same Reynolds number. This phenomenon directly reflected that the insertion of internal spiral fins greatly enhanced the heat transfer performance in the circular tube. What is more, as Figure 10 shows, with the increase of Re, the deviations of Nu between spiral finned tubes and plain tube became larger and larger. It can also be analyzed from Figure 11 that the increase of H increased the heat transfer area in the tube, the heat transfer performance in the tube was significantly improved, and the temperature of the interface between the spiral region and the central region was higher. From a physical point of view, as the height decreased, the spiral region was compressed, while the central region expanded inch by inch. Consequently, the local and on-way resistances of the spiral channels continuously decreased in the spiral region. Owing to the double strengthening effect of enhanced secondary heat transfer area and spiral structure channels in the spiral region, the enhancement of heat transfer was much more obvious.
Figure 12 shows the relationship of f and Re between five kinds of internal spiral finned tubes (H = 4, H = 4.5, H = 5, H = 5.5, H = 6) and a circular tube. In general, the change trends of f among five internal spiral finned tubes were roughly the same, while the change trend of the plain tube was relatively gentle. Generally, the values of f gradually decreased as the Re increased. In detail, as the Re increased, the downward trend of f became more and more gentle. This phenomenon could be also explained by Darcy’s theory [32]. Similar to the Nu, the f of the internal spiral finned tubes was significantly greater than that of the circular tube under the same Reynolds number. Additionally, with the increase of Re, the difference of f between the internal spiral finned tube and circular tube became smaller and smaller. Combining this phenomenon with Figure 11, it can be inferred that with the increase of H, the degree of turbulence in the spiral region of the tube gradually increased, and then most of the fluid flew through the central region, making the velocity in the central region significantly higher than that in other parts.

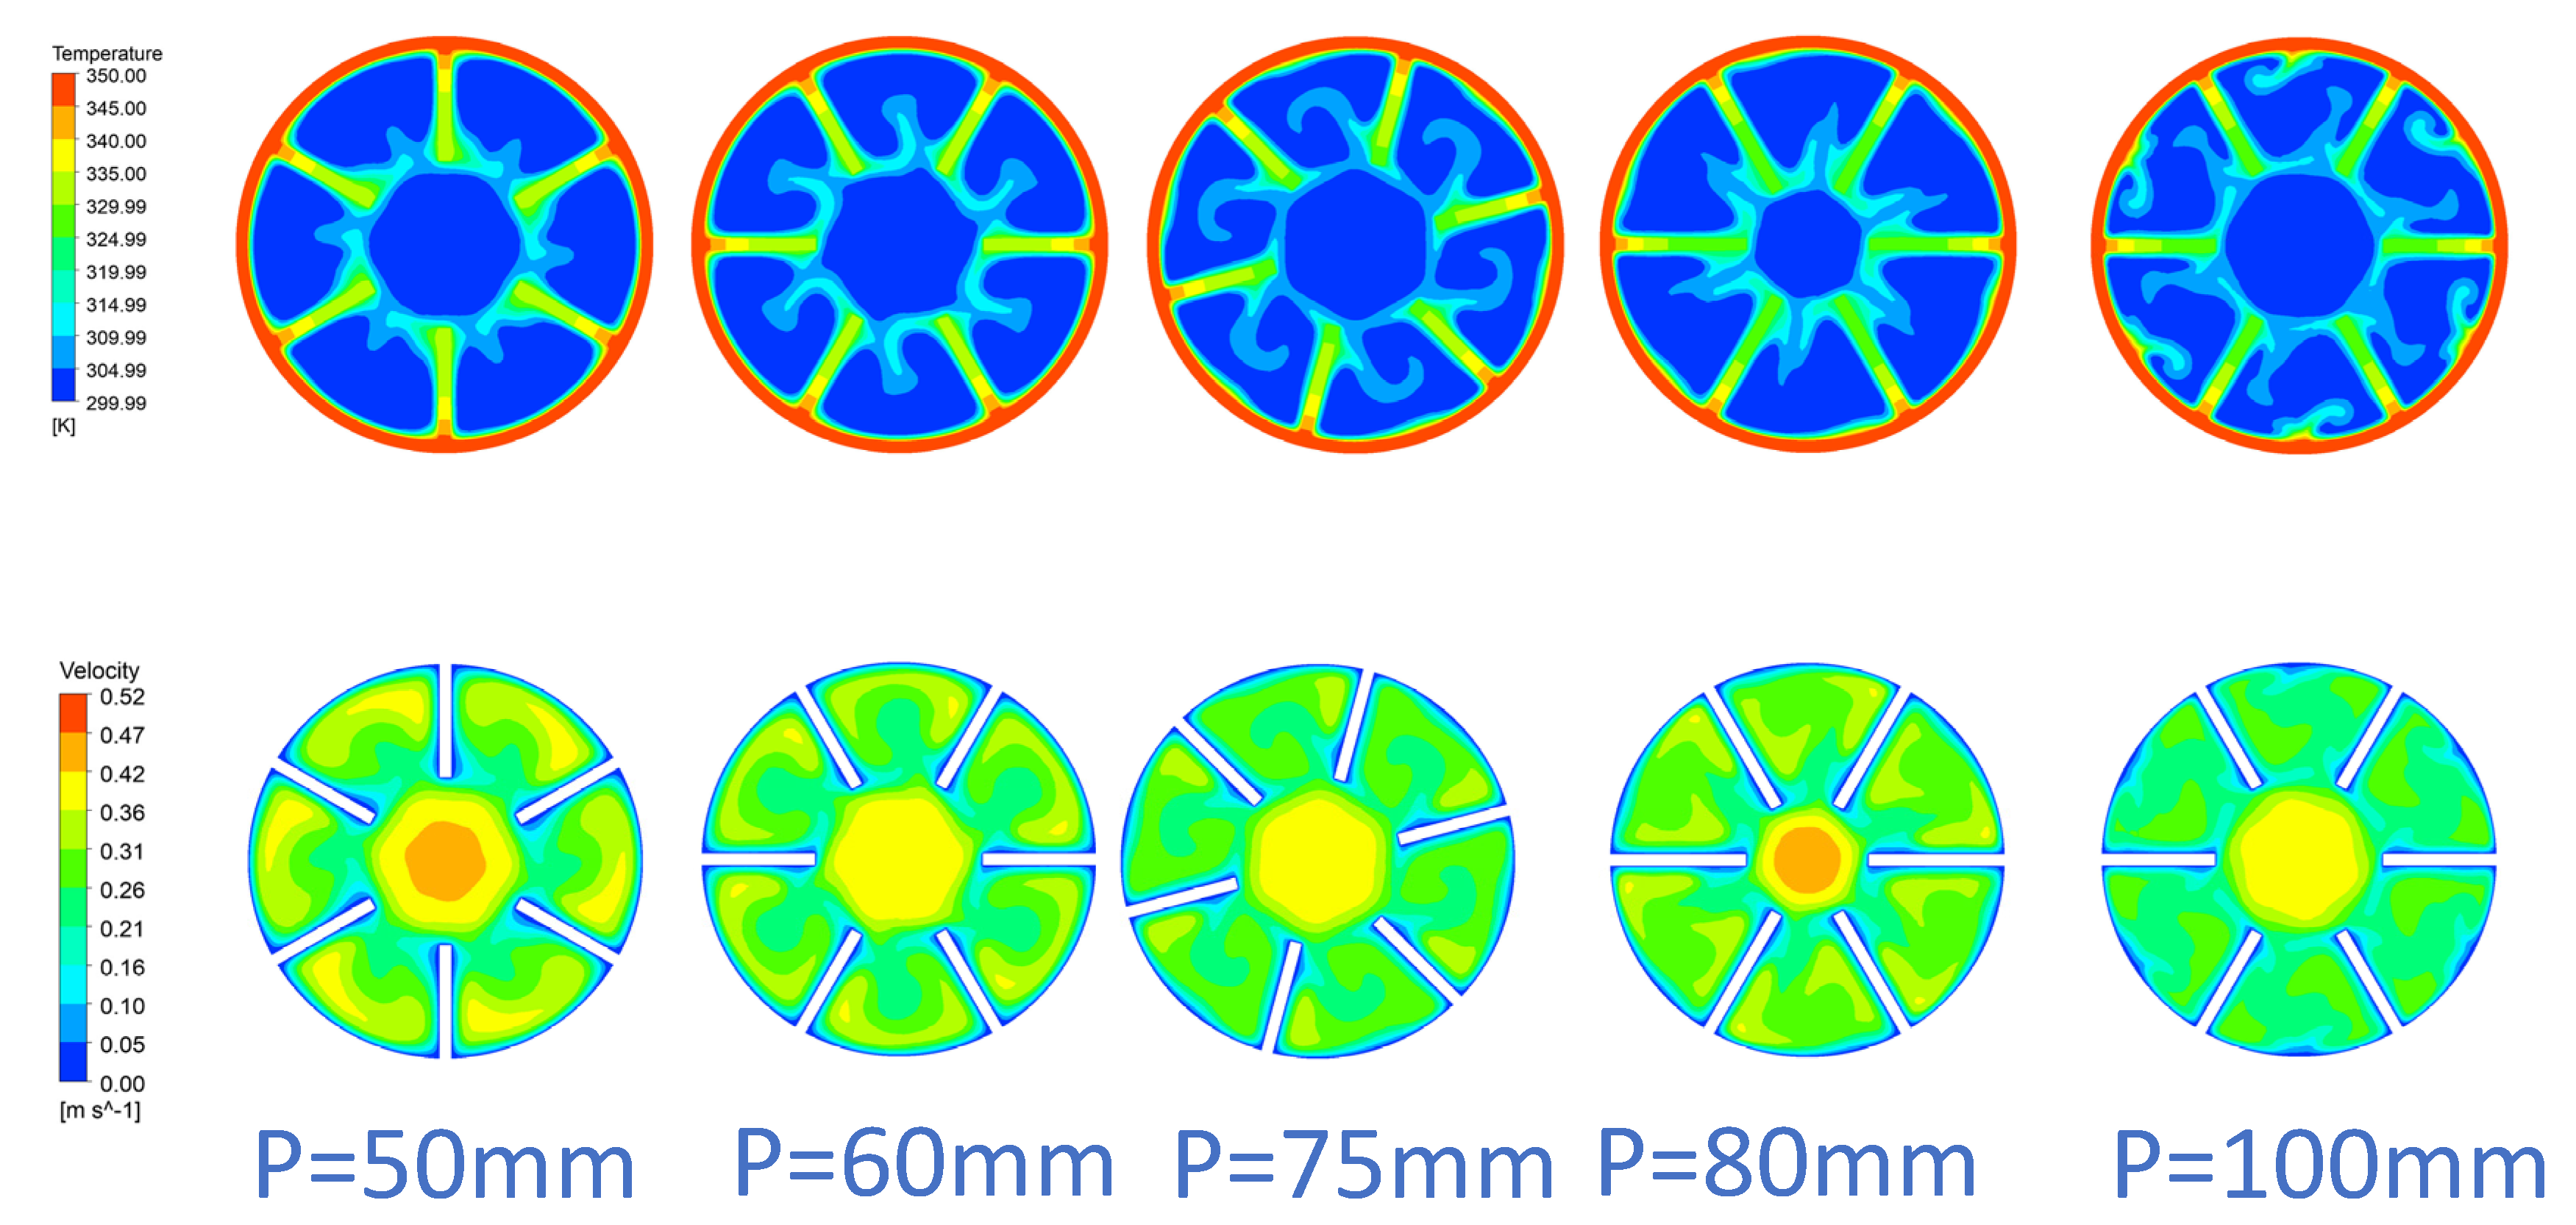
4.3. Effect of the P on Heat Transfer and Flow Characteristics

In order to investigate the effects of internal spiral fins on thermohydraulic characteristics of flow in smooth tubes, Nu and f factors are plotted in Figure 13 for a range of pitch P. The results were similar to those in Figure 10, as the Nu was nearly proportional to the Re in all the cases. The Nu and f in the spiral finned tube were 1.89–3.62 and 5.03–10.62 times higher than that in the plain tube. The deviation of Nu between internal spiral finned tubes and the plain tube was proven in that the enhancement of heat transfer was achieved in all cases with different pitches under the same Re. This was also confirmed by the temperature distribution in Figure 14. The average temperature in the tube was significantly higher than that in the flat tube. Attributed to the secondary flow formed near the boundary where the two regions contacted each other, the temperature near the boundary was extremely higher than the other parts in the tube. It should be noted that when the value of P was 80 and 100, the heat transfer performance in the tube was obviously better than other types of tubes. Furthermore, it was observed that maximum Nu and f are achieved for P = 80 and not for P = 100. The possible reasons for these phenomena were that with the increase of P, the area of secondary heat transfer gradually decreased. Although the spiral channels became wider and more fluid as they flew through the channels, the overall heat transfer performance in the tube was not significantly improved. The pitch P directly determined the spiral period and heat transfer area of the spiral region in the tube. Obviously, both of them increased with the decrease of P. When the spiral channel narrowed gradually, the flow resistance in the channel increased accordingly, resulting in most of the fluid flowing from the central area. As shown in Figure 14, the velocity in the central region increases with the decrease of P.

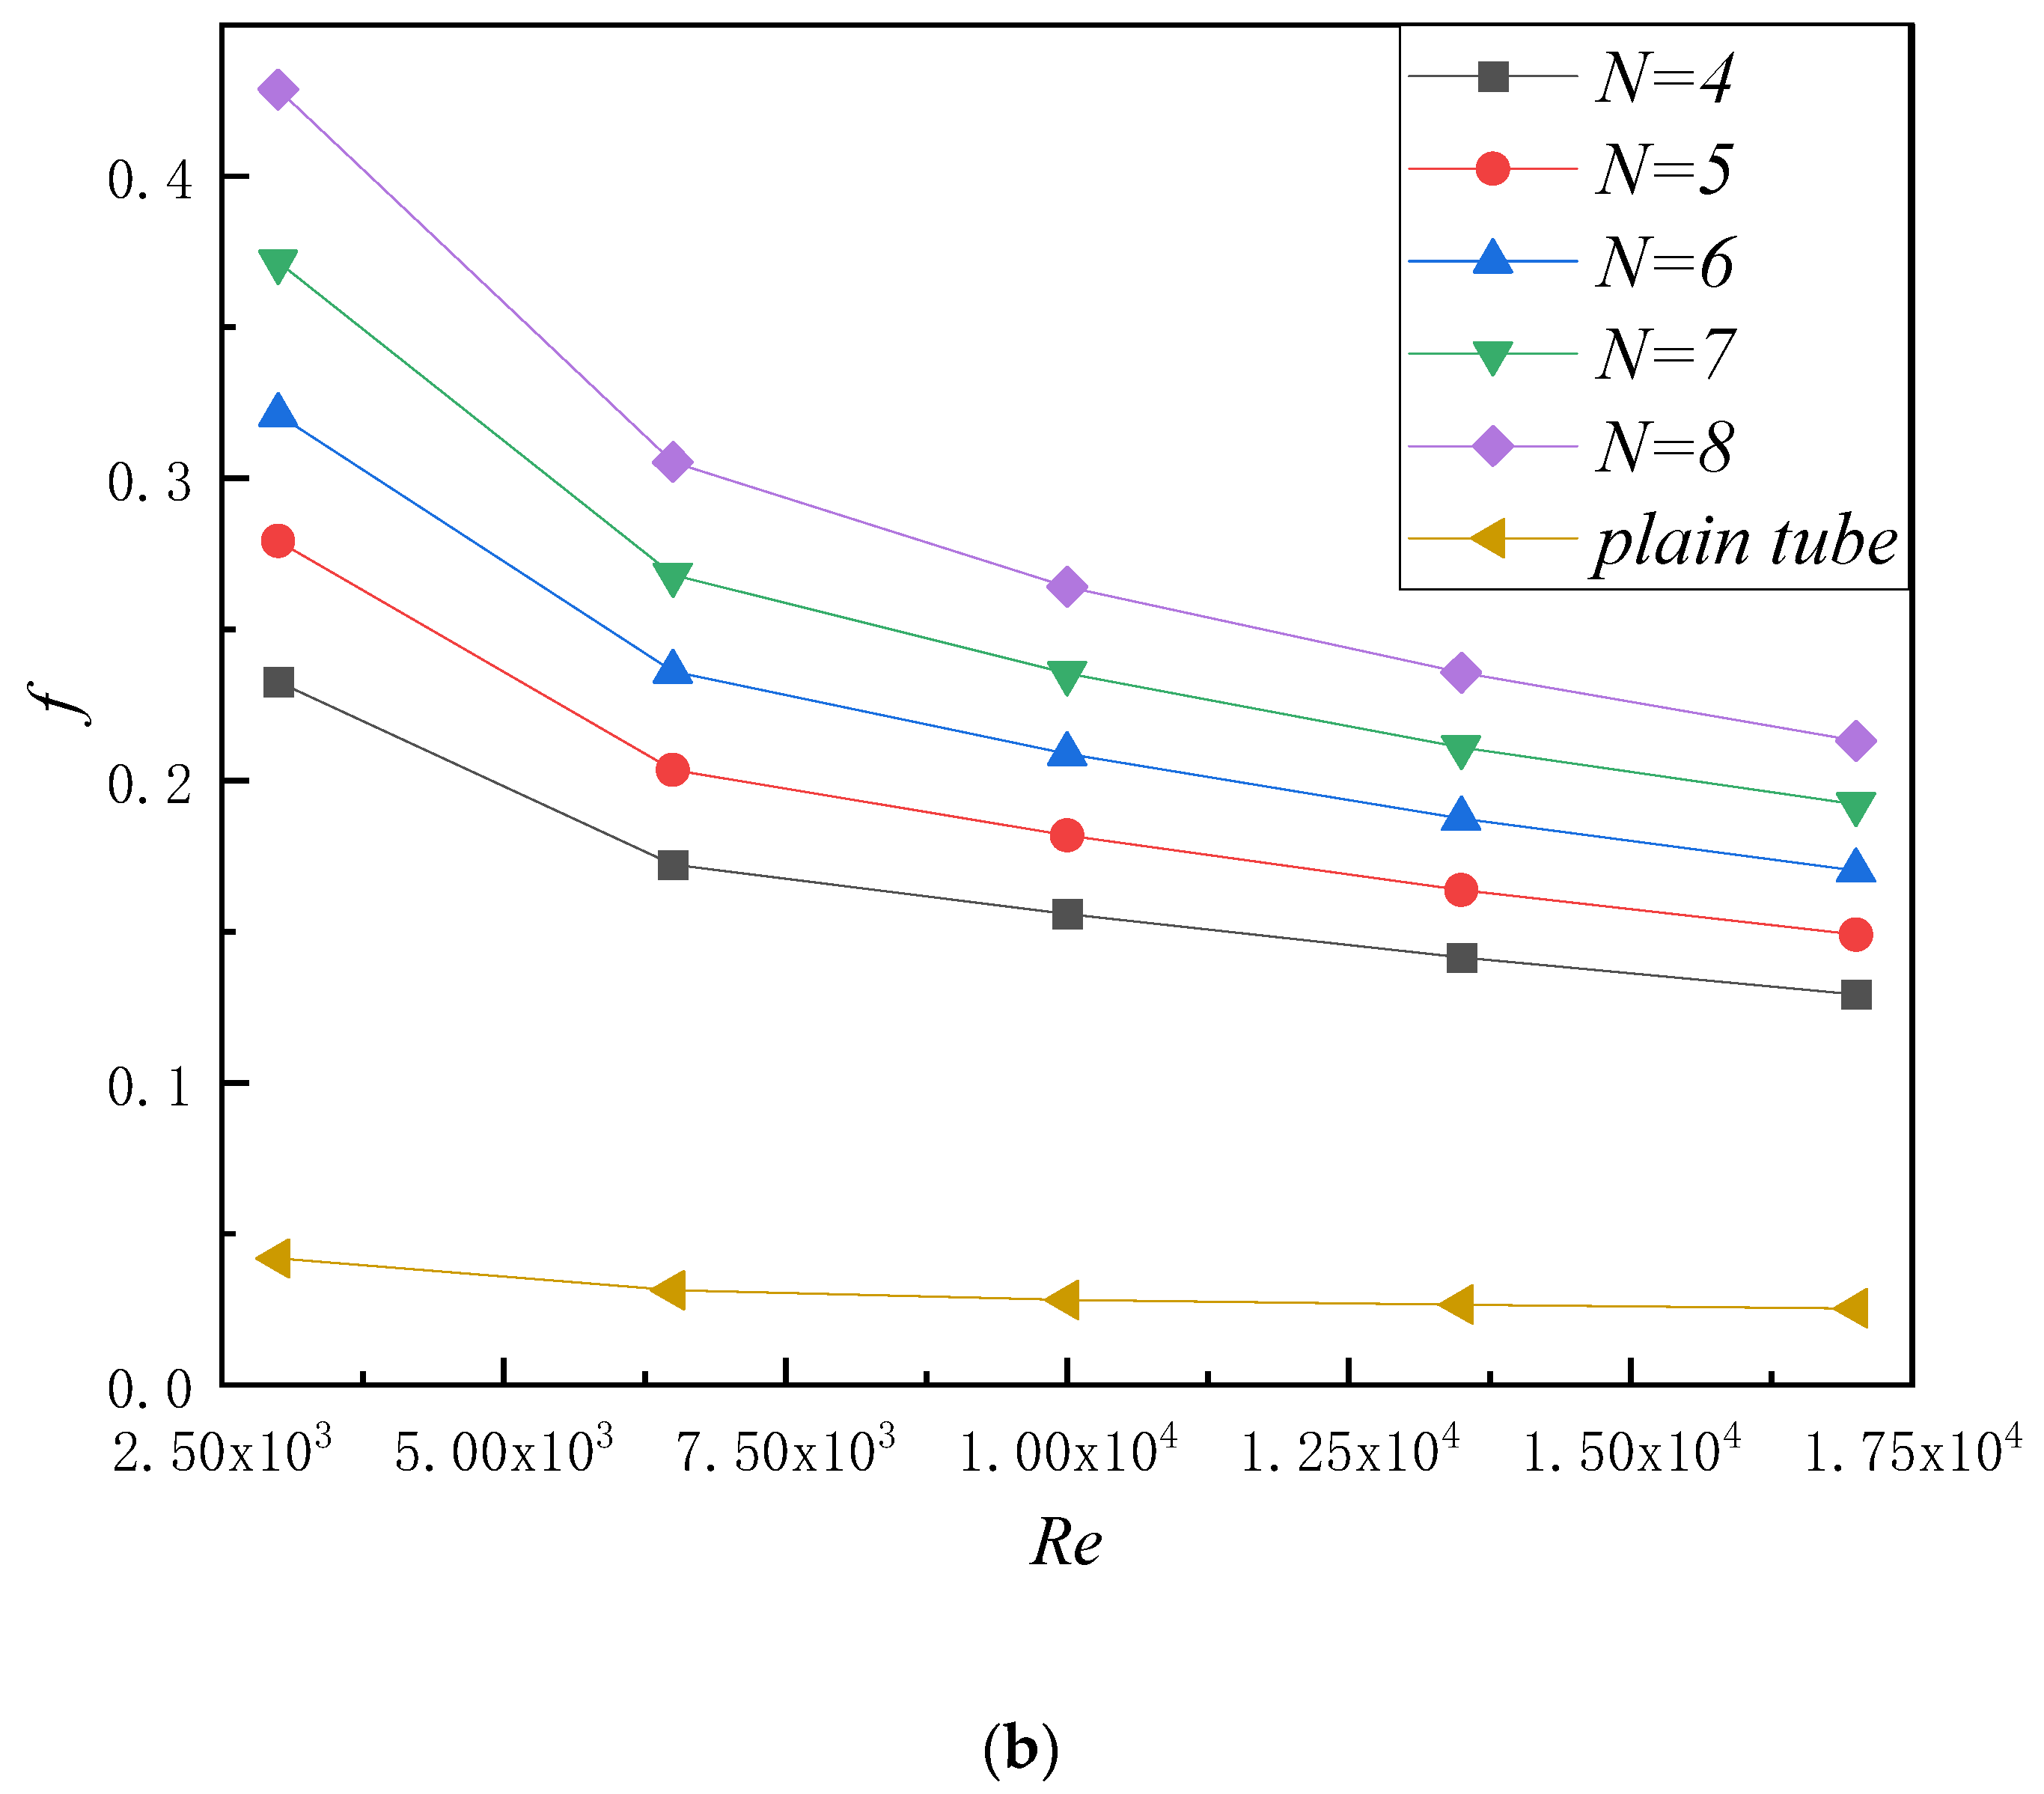
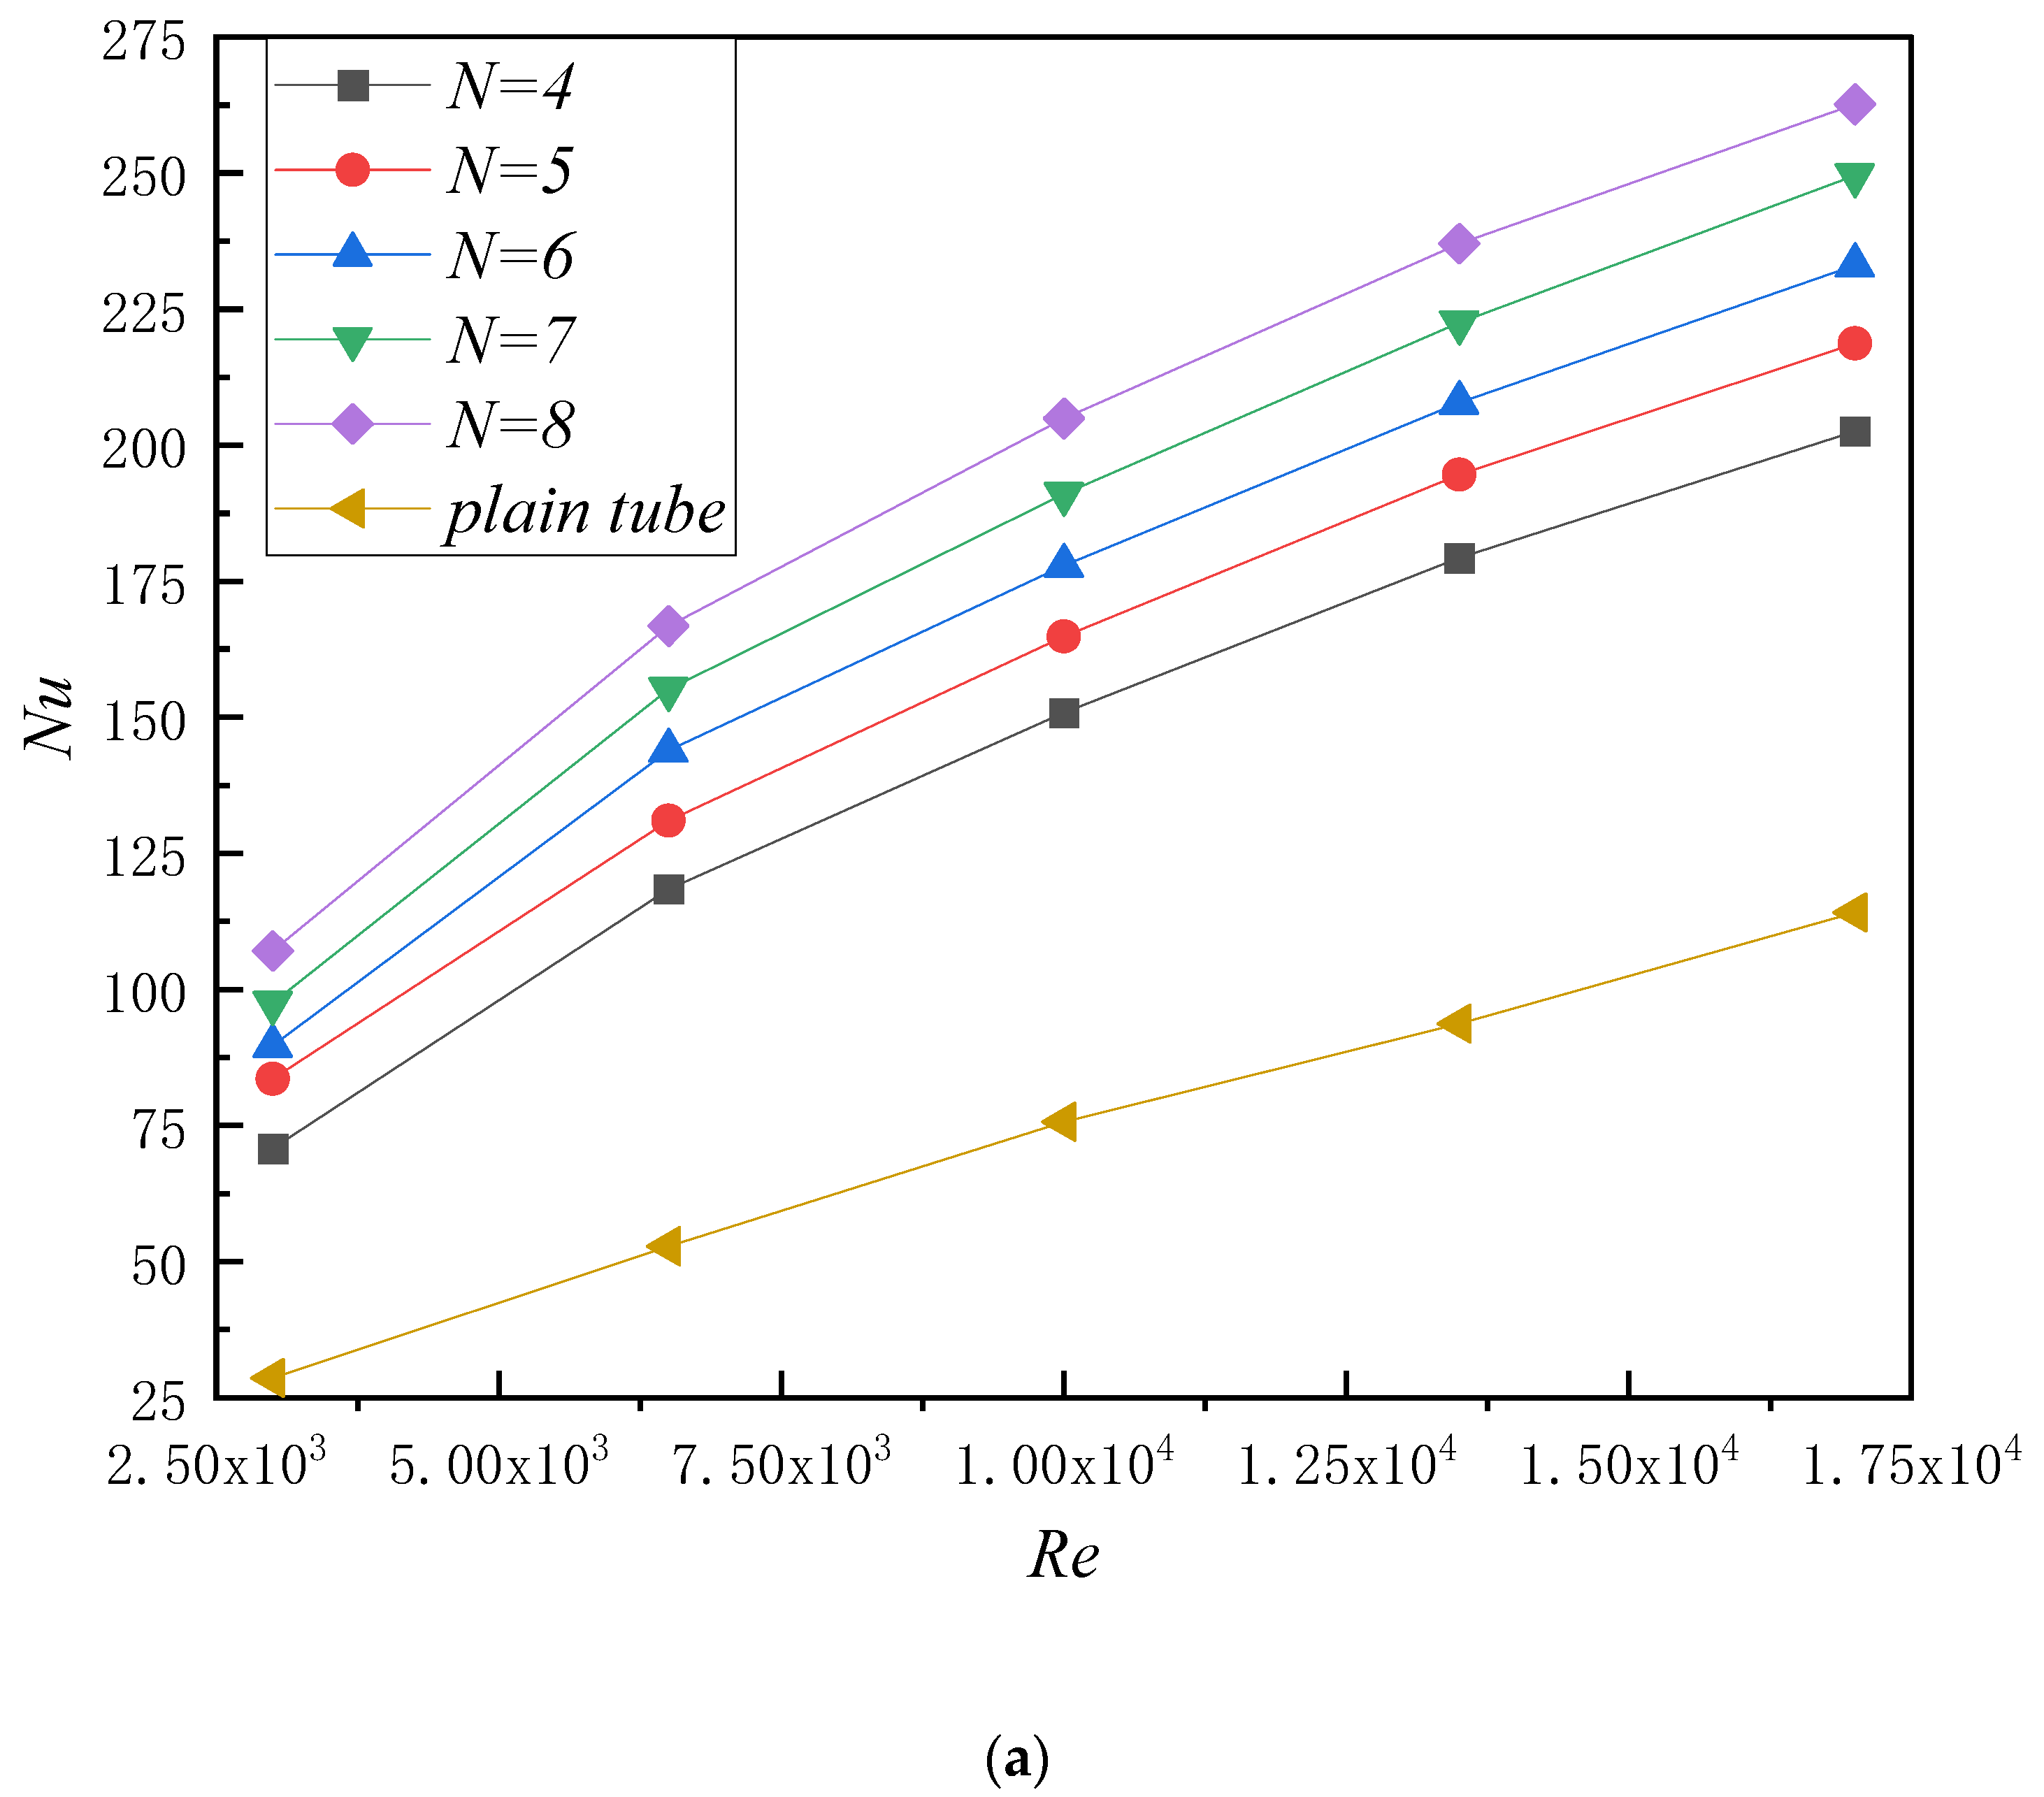
4.4. Effect of the N on Heat Transfer and Flow Characteristics

The influence of N on heat transfer and flow characteristics of internal spiral finned tubes was investigated when H = 5, P = 75. The enhancement of heat transfer in the tube was predicted. In addition, it can be seen in Figure 15 that the increase of number N caused the upward trend of Nu to be more and more pronounced, and the angle of inclination was also larger and larger. At the same time, f also increased with the increase of N. Such phenomena could be attributed to the gradual compression of the spiral region due to the increase of the number N, which increased the local resistance and on-way resistance of the region. Thus, most of the fluid would flow through the central area of the pipe, while a small part of the fluid would flow through the spiral area. In addition, the area of heat transfer in the tube was definitely enlarged with the increase of N. There was no doubt that the total heat exchange increased significantly and heat transfer performance was greatly enhanced. Naturally, it can be seen in Figure 16 that the average velocity in the central region was significantly higher than that in the spiral region. In terms of heat transfer performance, the increase of heat transfer area and the decrease of fluid in the tube significantly strengthened the heat transfer effect in the tube. Therefore, it can also be seen from Figure 16 that the average temperature in the tube increased with the increase of N.

4.5. Analysis of the Influence of Internal Spiral Fins on Heat Transfer Performance

On the basis of the previous research, Figure 17 illustrates the PEC value distribution of internal spiral finned tubes under different variables. Owing to the excellent turbulence structure in the tube, the heat transfer and flow performance of the tube under all variables had positive effects. The PEC was in the range of 1.03 to 1.652. As shown in Figure 17a, the internal spiral finned tube achieved the most ideal heat transfer performance when the value of N was 8, in this paper. In addition, H = 6 mm was recommended when the Re < 3750, while H = 4.5 mm was more appropriate when the Re > 6250, according to Figure 17b. Regarding pitch P as a key factor affecting the internal structure of internal spiral finned tubes, it can be seen from Figure 17c that when the Reynolds number was lower than 7000, the P with value of 100 had the best strengthening performance, and the strengthening trend increased with the decrease of Reynolds number. If the Reynolds number was higher than 10,000, the P with a value of 60 was more suitable to enhance the heat transfer and flow characteristics in the tube.

4.6. Comparison with Previous Work

In this section, three representative enhanced heat exchange tubes were selected to compare with the internal spiral finned tubes proposed in this paper. The references [15,42,43] were all utilized for the passive methods in the same Reynolds range. As shown in Figure 18, the three kinds of enhanced heat exchange tubes were internal finned tube [15], internal coiled square wires tube [42], and internal twisted tape tube [43], respectively. It can be obtained from the picture that the comprehensive thermal performance of the present tube was much better than that of the relevant published works, especially when the Re was less than 13,500. In general, the internal spiral fins not only effectively enhanced the heat transfer in the tube, but also brought little flow resistance, therefore the overall heat transfer performance is significantly improved.

5. Conclusions

In this paper, the internal spiral finned tube was studied by numerical simulation. The comparisons of heat transfer and flow characteristics between internal spiral finned tubes and flat tube were analyzed. The structural variables of the pipe included the height, number, and pitch of the internal spiral fins. The comprehensive performance was obtained under five different Re (Re = 3000, 6500, 10,000, 13,500, 17,000). The mechanism of heat transfer enhancement was analyzed for the internal spiral finned tube. According to the results obtained, the following conclusions can be summarized:
(1)
With the increase of Reynolds number, the Nusselt number in the tube increased, while f decreased. The Nu and f of the internal spiral finned tubes were 1.77–3.74 and 3.04–10.62 times higher than those of smooth tube, respectively. The average deviations of Nu and f between the simulation results and empirical formula results were 5.11% and 8.45%, respectively. It was illustrated that the results of the simulation agreed well with the empirical formula, and the heat transfer capacity of internal spiral finned tubes was much better than that of flat tube.
(2)
The velocity distribution in the spiral region was affected by the centrifugal force of the spiral flow to produce a vortex, and its velocity distribution was asymmetric. The temperature distribution in the spiral region was affected by centrifugal force, and the thermal boundary layer on the inner wall of the pipe was destroyed, which sped up the heat exchange between the external environment and the fluid in the pipe.
(3)
The three variables had positive effects on the enhanced heat transfer performance in internal spiral finned tubes. It was found that N was the factor that had the greatest impact on the heat transfer performance among the studied parameters. The results showed that the maximum value of PEC under the five Re numbers was 1.652, while the PEC of the pitch P and the height H were 1.581 and 1.566, respectively.
(4)
When the Re was set as 3000, the PEC achieved the highest value of 1.652 in this paper. The height H of the RWVG was 5 mm, the number N was 8, and the pitch P was 75 mm, while the PEC gradually decreased as the Re increased. The possible reason for this phenomenon might be that the effect of pressure drop on the comprehensive performance in the tube was stronger than that of thermal enhancement as the Re increased.

Author Contributions

Conceptualization, Y.L., Z.Q. and Q.W.; software, Y.L. and Q.W.; validation, Y.L. and Q.W.; resources and data, Y.L. and Q.W.; writing—original draft preparation, Y.L. and Q.W.; writing—review and editing, Y.L. and Q.W.; supervision, Z.Q.; project administration, Z.Q.; funding acquisition, Z.Q. All authors have read and agreed to the published version of the manuscript.

Funding

This research received no external funding.

Institutional Review Board Statement

Not applicable.

Informed Consent Statement

Not applicable.

Conflicts of Interest

The authors declare no conflict of interest.

Highlights

  • The flow and heat transfer of internal spiral finned tubes were investigated by numerical simulation.
  • The effects of structural parameters on the flow and heat transfer were studied.
  • The comprehensive performance was obtained and optimum parameters for the internal spiral finned tube were reported for practical applications.
  • The mechanism of heat transfer enhancement was analyzed for the internal spiral finned tube.

Nomenclature

A h t The area of heated wall ( m 2 )
c The heat capacity of working fluid ( J / kg · K 1 )
D The hydraulic diameter ( mm )
f The friction factor
g The mass flow of working fluid ( kg / s )
h The heat transfer coefficient ( W / m 2 · K )
I The turbulence intensity
kTurbulent kinetic energy ( m 2 s 2 )
L The length of flow direction ( m )
N u The Nusselt number
PPressure ( Pa )
P E C The performance evaluation
P r Prandtl number
Q The total rate of heat transfer ( w )
R e The Reynolds number
t o u t The temperature of the outlet ( K )
t i n The temperature of the inlet ( K )
T w a l l   The temperature of wall ( K )
T Temperature of the working fluid ( K )
V i The x-axis velocity of working fluid ( m / s )
V j The y-axis velocity of working fluid ( m / s )
V k The z-axis velocity of working fluid ( m / s )
u i n The velocity of working fluid ( m / s )
V Volume of working fluid ( m 3 )
Greek symbols
Δ P The pressure drops between the inlet and outlet ( Pa )
Δ t m The temperature difference ( K )
ε Dissipation rate of turbulent kinetic energy of the k-   ε model ( m 2 s 3 )
λ Thermal conductivity ( W / m · K 1 )
μ Dynamic viscosity ( kg / m · s 1 )
ν Kinematic viscosity ( m 2 · s 1 )
ρ Density of working fluid ( kg / m 3 )
Subscripts
a Air
i n Inlet
o u t Outlet
T Turbulence
w a l l Wall

References

  1. Long, R.; Bao, Y.J.; Huang, X.M.; Liu, W. Exergy analysis and working fluid selection of organic Rankine cycle for low grade waste heat recovery. Energy 2014, 73, 475–483. [Google Scholar] [CrossRef]
  2. Sheikholeslami, M.; Gorji-Bandpy, M.; Ganji, D.D. Review of heat transfer enhancement methods: Focus on passive methods using swirl flow devices. Renew. Sustain. Energy Rev. 2015, 49, 444–469. [Google Scholar] [CrossRef]
  3. Soria, J.; Norton, M. The effect of transverse plate vibration on the mean laminar convective boundary layer heat transfer rate. Exp. Therm. Fluid Sci. 1991, 4, 226–238. [Google Scholar] [CrossRef]
  4. Mizushina, T. The Electrochemical Method in Transport Phenomena. Adv. Heat Transf. 1971, 7, 87–161. [Google Scholar] [CrossRef]
  5. Ohadi, M.; Nelson, D.; Zia, S. Heat transfer enhancement of laminar and turbulent pipe flow via corona discharge. Int. J. Heat Mass Transf. 1991, 34, 1175–1187. [Google Scholar] [CrossRef]
  6. Liu, S.; Sakr, M. A comprehensive review on passive heat transfer enhancements in pipe exchangers. Renew. Sustain. Energy Rev. 2013, 19, 64–81. [Google Scholar] [CrossRef]
  7. Sparrow, E.M.; Charmchi, M. Laminar Heat Transfer in an Externally Finned Circular Tube. ASME J. Heat Transf. 1980, 102, 605–611. [Google Scholar] [CrossRef]
  8. Moukalled, F.; Kasamani, J.; Acharya, S. Turbulent convection heat transfer in a longitudinally conducting externally finned pipes. Numer. Heat Transf. Part A Appl. 1992, 21, 401–421. [Google Scholar] [CrossRef]
  9. Ouzzane, M.; Galanis, N. Numerical Analysis of Mixed Convection in Inclined Tubes with External Longitudinal Fins. Sol. Energy 2001, 71, 199–211. [Google Scholar] [CrossRef]
  10. Liu, L.; Fan, Y.; Ling, X.; Peng, H. Flowand heat transfer characteristics of finned tube with internal and external fins in air cooler for waste heat recovery of gas-fired boiler system. Chem. Eng. Process. Process Intensif. 2013, 74, 142–152. [Google Scholar] [CrossRef]
  11. Ding, Y.; Zhang, W. Experimental and numerical investigation on natural convection heat transfer characteristics of vertical 3-D externally finned tubes. Energy 2022, 239, 122050. [Google Scholar] [CrossRef]
  12. Fabbri, G. Effect of viscous dissipation on the optimization of the heat transfer in internal finned tubes. Int. J. Heat Mass Transf. 2004, 47, 3003–3015. [Google Scholar] [CrossRef]
  13. Al-Sarkhi, A.; Abu-Nada, E. Characteristics of forced convection heat transfer in vertical internally finned tube. Int. Commun. Heat Mass Transf. 2005, 32, 557–564. [Google Scholar] [CrossRef]
  14. Foong, A.J.L.; Ramesh, N.; Chandratilleke, T.T. Laminar convective heat transfer in a microchannel with internal longitudinal fins. Int. J. Therm. Sci. 2009, 48, 1908–1913. [Google Scholar] [CrossRef]
  15. Wang, Q.W.; Lin, M.; Zeng, M. Effect of lateral fin profiles on turbulent flow and heat transfer performance of internal finned tubes. Appl. Therm. Eng. 2009, 29, 3006–3013. [Google Scholar] [CrossRef]
  16. Manglik, R.; Bergles, A. Heat transfer and pressure drop correlations for twisted-tape inserts in isothermal tubes: Part I–Laminar flows. Trans. Am. Soc. Mech. Eng. J. Heat Transf. 1993, 115, 881. [Google Scholar] [CrossRef]
  17. Manglik, R.M.; Bergles, A.E. Heat Transfer and Pressure Drop Correlations for Twisted-Tape Inserts in Isothermal Tubes: Part II—Transition and Turbulent Flows. J. Heat Transf. 1993, 115, 890–896. [Google Scholar] [CrossRef]
  18. Saha, S.K.; Dutta, A.; Dhal, S.K. Friction and heat transfer characteristics of laminar swirl flow through a circular tube fitted with regularly spaced twisted-tape elements. Int. J. Heat Mass Transf. 2001, 44, 4211–4223. [Google Scholar] [CrossRef]
  19. Wongcharee, K.; Eiamsa-Ard, S. Friction and heat transfer characteristics of laminar swirl flow through the round tubes inserted with alternate clockwise and counter-clockwise twisted-tapes. Int. Commun. Heat Mass Transf. 2011, 38, 348–352. [Google Scholar] [CrossRef]
  20. Dang, W.; Wang, L.-B. Convective heat transfer enhancement mechanisms in circular tube inserted with a type of twined coil. Int. J. Heat Mass Transf. 2021, 169, 120960. [Google Scholar] [CrossRef]
  21. Sharifi, K.; Sabet, M.; Rafiei, M.; Mohammadi, A.H.; Ghaffari, A.; Asl, M.H.; Yousefi, H. A good contribution of computational fluid dynamics (CFD) and GA-ANN methods to find the best type of helical wire inserted tube in heat exchangers. Int. J. Therm. Sci. 2020, 154, 106398. [Google Scholar] [CrossRef]
  22. Promvonge, P.; Skullong, S.; Kwankaomeng, S.; Thiangpong, C. Heat transfer in square duct fitted diagonally with angle-finned tape—Part 1: Experimental study. Int. Commun. Heat Mass Transf. 2012, 39, 617–624. [Google Scholar] [CrossRef]
  23. Tandiroglu, A. Effect of flow geometry parameters on transient heat transfer for turbulent flow in a circular tube with baffle inserts. Int. J. Heat Mass Transf. 2006, 49, 1559–1567. [Google Scholar] [CrossRef]
  24. Liou, T.-M.; Chen, C.-C.; Wang, C.-S.; Wang, E.-S. Thermal-fluidic correlations for turbulent flow in a serpentine heat exchanger with novel wing-shaped turbulators. Int. J. Heat Mass Transf. 2020, 160, 120220. [Google Scholar] [CrossRef]
  25. Skullong, S.; Promvonge, P.; Thianpong, C.; Jayranaiwachira, M. Thermal behaviors in a round tube equipped with quadruple perforated-delta-winglet pairs. Appl. Therm. Eng. 2017, 115, 229–243. [Google Scholar] [CrossRef]
  26. Promvonge, P.; Skullong, S. Thermo-hydraulic performance in heat exchanger tube with V-shaped winglet vortex generator. Appl. Therm. Eng. 2019, 164, 114424. [Google Scholar] [CrossRef]
  27. Iasiello, M.; Bianco, N.; Chiu, W.K.S.; Naso, V. The effects of variable porosity and cell size on the thermal performance of functionally-graded foams. Int. J. Therm. Sci. 2020, 160, 106696. [Google Scholar] [CrossRef]
  28. Jamarani, A.; Maerefat, M.; Jouybari, N.F.; Nimvari, M.E. Thermal Performance Evaluation of a Double-Tube Heat Exchanger Partially Filled with Porous Media Under Turbulent Flow Regime. Transp. Porous Media 2017, 120, 449–471. [Google Scholar] [CrossRef]
  29. Menter, F.R. Two-equation eddy-viscosity turbulence models for engineering applications. AIAA J. 1994, 32, 1598–1605. [Google Scholar] [CrossRef] [Green Version]
  30. Liu, L.; Cao, Z.; Shen, T.; Zhang, L. Experimental and numerical investigation on flow and heat transfer characteristics of a multi-waves internally spiral finned tube. Int. J. Heat Mass Transf. 2021, 172, 121104. [Google Scholar] [CrossRef]
  31. Duan, L.; Ling, X.; Peng, H. Flow and heat transfer characteristics of a double-tube structure internal finned tube with blossom shape internal fins. Appl. Ther. Eng. 2018, 128, 1102–1115. [Google Scholar] [CrossRef]
  32. Cheng, J.; Qian, Z.; Wang, Q. Analysis of heat transfer and flow resistance of twisted oval tube in low Reynolds number flow. Int. J. Heat Mass Transf. 2017, 109, 761–777. [Google Scholar] [CrossRef]
  33. Li, Y.; Qian, Z.; Wang, Q. Numerical Analysis on Thermohydraulic Performance of the Tube Inserted with Rectangular Winglet Vortex Generators. Energies 2021, 15, 179. [Google Scholar] [CrossRef]
  34. Bharadwaj, P.; Khondge, A.; Date, A. Heat transfer and pressure drop in a spirally grooved tube with twisted tape insert. Int. J. Heat Mass Transf. 2009, 52, 1938–1944. [Google Scholar] [CrossRef]
  35. Webb, R. Performance evaluation criteria for use of enhanced heat transfer surfaces in heat exchanger design. Int. J. Heat Mass Transf. 1981, 24, 715–726. [Google Scholar] [CrossRef]
  36. Cheraghi, M.H.; Ameri, M.; Shahabadi, M. Numerical study on the heat transfer enhancement and pressure drop inside deep dimpled tubes. Int. J. Heat Mass Transf. 2020, 147, 118845. [Google Scholar] [CrossRef]
  37. ANSYS Inc. Fluent; Version 6.3; ANSYS Inc.: Canonsburg, PA, USA, 2009. [Google Scholar]
  38. Bergman, T.L.; Incropera, F.P.; DeWitt, D.P.; Lavine, A.S. Fundamentals of Heat and Mass Transfer; John Wiley & Sons: Hoboken, NJ, USA, 2011. [Google Scholar]
  39. Kim, G.-Y.; Han, J.-I.; Park, J.-K. Inertial Microfluidics-Based Cell Sorting. BioChip J. 2018, 12, 257–267. [Google Scholar] [CrossRef]
  40. Zhang, J.; Yan, S.; Yuan, D.; Alici, G.; Nguyen, N.-T.; Warkiani, M.E.; Li, W. Fundamentals and applications of inertial microfluidics: A review. Lab Chip 2016, 16, 10–34. [Google Scholar] [CrossRef] [PubMed] [Green Version]
  41. Liu, N.; Petchakup, C.; Tay, H.M.; Li, K.H.H.; Hou, H.W. Spiral Inertial Microfluidics for Cell Separation and Biomedical Applications. In Applications of Microfluidic Systems in Biology and Medicine; Tokeshi, M., Ed.; Springer: Singapore, 2019; pp. 99–150. [Google Scholar] [CrossRef]
  42. Promvonge, P. Thermal performance in circular tube fitted with coiled square wires. Energy Convers. Manag. 2008, 49, 980–987. [Google Scholar] [CrossRef]
  43. Promvonge, P. Thermal augmentation in circular tube with twisted tape and wire coil turbulators. Energy Convers. Manag. 2008, 49, 2949–2955. [Google Scholar] [CrossRef]
Figure 1. Detailed view of the internal spiral finned tube.
Energies 15 00648 g001
Figure 2. Comparisons between numerical data and correlation data: (a) comparisons of Nu; (b) comparisons of f.
Energies 15 00648 g002aEnergies 15 00648 g002b
Figure 3. Boundary conditions.
Energies 15 00648 g003
Figure 4. Grids generated for computation domain.
Energies 15 00648 g004
Figure 5. Verification between numerical result and correlation data.
Energies 15 00648 g005
Figure 6. The velocity, temperature and streamlines distributions of five intercepted sections.
Energies 15 00648 g006
Figure 7. The velocity distribution of the ordinary circular tube.
Energies 15 00648 g007
Figure 8. The temperature distribution of the ordinary circular tube.
Energies 15 00648 g008
Figure 9. The vorticity distributions of the internal spiral finned tube at Z = 50 mm.
Energies 15 00648 g009
Figure 10. The Nu of the internal spiral finned tube and plain tube under different H.
Energies 15 00648 g010
Figure 11. The temperature and velocity distributions of the internal spiral finned tube under different H.
Energies 15 00648 g011
Figure 12. The f of the internal spiral finned tube and plain tube under different H.
Energies 15 00648 g012
Figure 13. Comparison of heat transfer and flow resistance between plain tube and internal spiral finned tube in different P. (a) Nu, (b) f.
Energies 15 00648 g013aEnergies 15 00648 g013b
Figure 14. The temperature and velocity distributions of the internal spiral finned tube under different P.
Energies 15 00648 g014
Figure 15. Comparison of heat transfer and flow resistance between plain tube and internal spiral finned tube in different N. (a) Nu, (b) f.
Energies 15 00648 g015aEnergies 15 00648 g015b
Figure 16. The temperature and velocity distributions of the internal spiral finned tube under different N.
Energies 15 00648 g016
Figure 17. Effect of different factors on heat transfer and flow performance: (a) the angle α, (b) the height H, (c) the number N.
Energies 15 00648 g017aEnergies 15 00648 g017b
Figure 18. Comparisons with previous work.
Energies 15 00648 g018
Table 1. Geometrical structures and parameters used during numerical studies.
Tube ParametersUnitValue
Inner diameter of the tube (Di)mm17.44
Outer diameter of the tube (Do)mm18.44
Tube length (L)mm600
Height (H)mm4, 4.5, 5, 5.5, 6
Number (N)-4, 5, 6, 7, 8
Pitch (P)μμ50, 60, 75, 80, 100
Thickness (δ)mm0.5
Table 2. Geometrical parameters of different cases.
Case No.TypeH (mm)NP (mm)
Case 1Circular tube---
Case 2Finned tube4675
Case 3Finned tube4.5675
Case 4Finned tube5675
Case 5Finned tube5.5675
Case 6Finned tube6675
Case 7Finned tube5475
Case 8Finned tube5575
Case 9Finned tube5775
Case 10Finned tube5875
Case 11Finned tube5650
Case 12Finned tube5660
Case 13Finned tube5680
Case 14Finned tube56100
Table 3. Thermo-physical properties of water [33].
Thermo-Physical Properties Value
ρ 998.2 kg/m3
μ0.6 W/(m·K)
λ1.003 × 10⁻³ kg/(m·s)
c4182 J/(kg·K)
Table 4. Grid independence test.
Total Element NumberNuf
8,065,41920.1350.0481
11,203,12520.9430.0501
14,407,20021.9010.0514
17,735,44621.9660.0516
19,416,89221.9890.0519
Publisher’s Note: MDPI stays neutral with regard to jurisdictional claims in published maps and institutional affiliations.

