Abstract
The greatest challenge in accelerating the realisation of a sustainable and competitive bioeconomy is to demonstrate that enshrining sustainability principles at the very heart of a production line can generate value and improve its overall system. Strategies for reducing emissions, pollutants, indirect land use change or soil depreciation are all perceived as costs or necessary inconveniences to comply with stringent, climate change-focused policy frameworks. System dynamics modelling and competitive priorities are tools that can accurately and intelligently expand on the cross-value chain approach, which integrates both technical and environmental performances, to address the issue of harmonising sustainability and technical operations as one overall dimension of performance. A stock-and-flow model is developed to map a full biofuel value chain and quantitatively and coherently integrate factors of emissions, carbon, land, production, and technology. As such, environmental and operational impacts of innovative practices are measured, and subsequently linked to a qualitative framework of competitive priorities, as defined by transparency, quality, innovation and flexibility. Sustainability and productivity functions are found to reinforce each other when all competitive priorities are optimised. Equally, the framework provides a clear understanding of trade-offs engendered by value chain interventions. Advantages and limitations in the accessibility, scope and transferability of the multi-pronged analytical approach are discussed.
1. Introduction
Sustainable advanced biofuels can provide a continuous and steady flow of energy services and high-grade renewable heat [1], and as such have the potential to make way for a resource-efficient, competitive and low-carbon market [2]. However, certain biomass streams, such as food/feed crops with low yields and not cultivated as part of carbon farming practices generate high indirect land use change emissions [3,4]. In response, advanced biofuel value chains that avoid direct or indirect land use change are being developed both as a viable alternative to traditional fossil-based streams, as well as to mitigate climate and preserve natural resources. With a continuously growing stock of global atmospheric carbon [5] and renewed political commitments for net zero carbon solutions by 2050, there is an urgent need to foster novel biofuel value chains that can deliver on environmental sustainability, resource efficiency and economic competitiveness. Indeed, many innovations are possible along these value chains, for instance converting marginal, low-productivity land into net carbon sequestering production areas, implementing sustainable farming and crop management practices, or reducing processing and conversion time lag through available technological improvement. Full value chain analysis informs and empowers decision makers to optimise performance through awareness of challenges, limitations and opportunities behind operational configurations and characteristics [6]. The approach this paper takes includes full value chain analysis of advanced biofuel production as well as a combination of metrics reflecting both technical and environmental performance.
In order to display the functioning of multi-sector, integrated value chains, system dynamics modelling is employed to provide a map of all input-output interactions [7], clarify assumptions, define the topic space, and control for unexpected impacts following an intervention [8]. A deterministic, bottom-up, stock-and-flow system dynamics model is used to accurately monitor changes as defined by performance indicator-backed interventions. System dynamics modelling has been found to improve the understanding of supply chains in renewable energy [9] through visualising individual flows and stocks and whether these optimise or disturb a whole system [10]. The ‘measurable’ performance of enacted practices is then linked to competitive priorities [11] of transparency, quality, innovation, and flexibility, which are assessed qualitatively. Thus, the framework aims to equip decision makers with a tool to optimise value chain sustainability and competitiveness [12] by articulating both the biophysical assets (such as land, soil, vegetation and climate) and market factors (including competition for land and natural resources, new technologies and valorisation of end- and co-products). An umbrella indicator that all other indicators inform and that serves as a key structural guide of the system dynamics model in this paper is life cycle GHG emissions, whose calculation is based on the Recast of the Renewable Energy Directive (RED II) methodology [13]. This paper analyses how to overcome constraints inherent in the RED II framework, which is limited in including heat and electricity, advanced biofuels, up-to-date sustainability criteria for agriculture and forest biomass, avoidance of risks associated with poor forest management, and the protection of natural resources [14].
The aims of this paper are first to use a system dynamics model to assess impacts of innovative practices based on environmental, energy efficiency and technology change indicators within two advanced biofuel value chain case studies, and second to study their performance through competitive priorities. It is structured as follows: a literature review firstly isolates research gaps and needs, while a methods section then outlines two advanced biofuel case studies and their respective model data input, defines a framework combining value chain stages, performance indicators and competitive priorities, and links this framework to a set of value chain practices. Thirdly, the results and analysis present the system dynamics model and analyse quantitative results of indicators for seven (7) scenarios, which incorporate selected practices for each value chain stage in both case studies. Finally, this section also assesses how competitive priorities perform based on their qualitative ranking from indicator results.
2. Literature Review
Sectors, stakeholders or policies often pursue sustainability and efficiency goals in isolation and neglect interactions than can bring opportunities or help overcome challenges [6]. This study aims to apply advanced biofuel value chain analysis through a deterministic, stock-and-flow system dynamics model to analyse both quantitative technical/operational and environmental factors, and later define these through competitive priorities. It does so through real-world evidence to identify pathways that can optimise advanced biofuel value chains and address key challenges, including sustained and reliable production for efficient alignment with markets and investment mechanisms, improvement of biomass resource to production plant connectivity, and leveraging of existing fossil-based infrastructure [15].
The biofuel or bio-based value chain literature spans many studies seeking to harmonise sustainability and performance dimensions, with some employing innovative modelling techniques. [16] used mixed methods and multi-objective optimisation to measure trade-offs within biofuel production between costs and environmental impacts, while [17] evaluated the production of biofuel taking both carbon emissions and energy use into consideration through an advanced biofuel supply framework, including value chain costs, biofuel demand and market price. Additionally, both [18] and [19] employed interactive multi-objective closed-loop value chain models to equip decision makers with tools to optimise the inter-relation of financial and operational assets along biomass value chains.
Various studies have employed system dynamics modelling to optimise sustainability and technology pathways, however their scope remains at sectoral, regional or economy-wide level with external market, demographic or government drivers. There has been less emphasis in system dynamics literature on incorporating logistical operations and individual value chain variables to support the roll-out of biomass as a source of energy [20], which may be due to a data availability issue. [21] established a multi-layered model to determine the potential impact of biodiesel technological and supply chain development on sustainability, while [22] combined key sectors of the biofuels industry, including each value chain stage (biomass production, conversion, transport and end use distribution) to study biomass-to-energy technology and cost pathways. Ref. [23] analysed policy mechanisms supporting the market roll-out of biofuels in the transport sector, ref. [10] mapped stock-and-flow relationships among health, food security and environment sectors, and both [24] and [25] incorporated country-scale market, sustainability and demographic factors for supply chains using agricultural or forestry residues to generate electricity. Lastly, Ref. [26] modelled the impacts of government intervention, biodiesel-diesel ratio, production capacity, oil palm cultivation, population displacement, poverty and pollutant emissions on biodiesel production and [27] assessed the potential of biofuel commercialisation through both market and value chain factors.
The literature comprises to a lesser extent stock-and-flow system dynamics modelling with bottom-up data input to assess operational aspects of a bio-based value chain. Ref. [28] generated multiple scenarios detailing policy interventions on the production of fuel ethanol compared with advanced biofuels, integrating feedstock supply and logistics, conversion and end use industries, while [29] evaluated coordination strategies among various supply chain actors to optimise efficiency and profitability of bioenergy and [20] simulated value chain production of coffee pulp to produce biogas and electricity, including land use, harvest level, biomass yield, and use-efficiency of coffee by-product.
The number of studies leveraging stock-and-flow system dynamics modelling with bottom-up data input to survey both the environmental and operational aspects of a bio-based value chain is limited [9]. One simulates the impacts of increased productivity of a bioethanol value chain on water footprint [30], while another simulates carbon emissions per product to optimise management interventions and incentives behind supply chain performance through an agro-waste case study [31]. Finally [32] explores how upgrading transport and conversion technologies can impact sustainability of a feedstock that has potential to cause both direct and indirect land use change. This paper attempts to complement this body of work with an added component of linking quantitative modelling simulation to a qualitative competitive priority framework to enhance the accessibility and versatility of decision-making.
3. Materials and Methods
3.1. Value Chain Case Studies
Two value chains with advanced biofuel production characteristics and distinct climate, soil, feedstock, processing and product types are used. They are comparable to the extent that they can be simulated within near-identical system dynamics modelling configurations—Figure 1 highlights their overall similarity. The first value chain (VC 1) starts at a local forestry plantation in Northern Europe with a Continental climate, where wood is harvested and shipped to a pulp-and-paper mill, which generates a by-product of crude tall oil (CTO). This CTO is then converted into biodiesel (as blend-in or standalone fuel) at a separate conversion facility. This configuration was chosen based on the potential environmental benefits provided by the integration of forestry and biofuel industries [33]. Co-location brings a wide range of benefits, starting with the availability of the by-product (CTO) itself, to owning a profitable feedstock base, to the possibility of industrially producing a commercially viable share of biofuel [19].
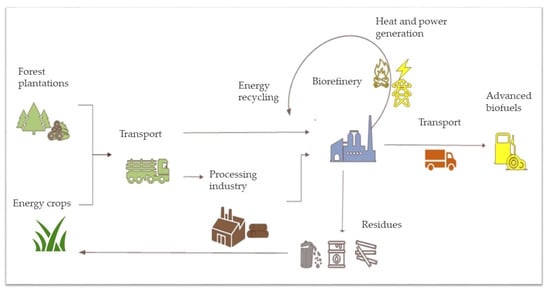
Figure 1.
Integrated advanced biofuel value chain (adapted from [38]).
The second value chain (VC 2) starts at a plot of marginal land in Southern Europe with Mediterranean climate, where miscanthus is grown, harvested and shipped to be thermochemically treated into fast pyrolysis bio-oil (FBPO). A final stage involves the conversion of FBPO into hydrocarbon fuel (or pyrolysis gasoline). The pairing of marginal land and miscanthus was based on findings that perennial lignocellulose crops can be cost efficient [34] and are more environmentally advantageous since they can be bred specifically to withstand lands with biophysical constraints (marginal lands) such as drought, salinity or cold [35,36]. Additionally, the value chain configuration offers significant socio-economic benefits [37].
Data were assembled through a robust literature review representing accurate, real-world measurements of the stated advanced biofuel value chain activities and innovative practices. They do not form an exhaustive life cycle analysis of the value chains. Overall, data originate from academic journals, industrial leaders, and research projects consulting both academic, policy and industry leaders. Appendix A includes all data variables for environmental footprint, production and energy values, logistics and consumption incorporated in the system dynamics model for both value chains under each main emission category. Variables in blue represent value chain practices—these will be described in detail in the next sub-sections.
3.2. Indicators and Competitive Priorities per Value Chain Stage
The value chains are organised by stage and respective activity as shown in Table 1 (adapted from [12]). Following this, a set of indicators is suggested that is relevant to the environmental and technical performance of the value chains, can address competitive priorities, and is based on the Specific, Measurable, Achievable & Attributable, Relevant, Timely (SMART) principle [39].

Table 1.
Indicators and competitive priorities per value chain stage (relevance of indicator per value chain stage illustrated by green background).
Advanced biofuel production begins at the land use stage, where biomass feedstock is sourced either from agricultural or forestry systems, then to biomass production, where feedstock is grown, harvested and supplied to conversion plants. Conversion consists firstly of storage, pre-treatment and processing of feedstock, followed by biochemical or thermochemical conversion. The end use stage of the biofuel value chain is defined by distribution, market uptake and acquisition by a consumer base. Transport operations are needed between each main facility, or all middle points within the value chain. Indicators are defined and impact different value chain stages as follows:
- Direct or indirect land use change (LUC) is a key environmental impact indicator measured in hectares and can evaluate the extent of avoiding either type of land use change. A low indirect LUC risk status for biofuels, bioliquids and biomass fuels as defined by the Commission Delegated Regulation (EU) 2019/807 of 13 March 2019 [40], supplementing Directive (EU) 2018/2001, is “that which is produced under circumstances that avoid indirect LUC effects, by virtue of having been cultivated on unused, abandoned or severely degraded land or emanating from crops which benefited from improved agricultural practices” [41,42]. GHG emissions associated to land use changes form part of life cycle monitoring (measured in gCO2eq/MJ).
- Productivity is used to evaluate the amount of land required to produce a final amount of bioenergy (measured in final MJ per hectare of land) and thus ties the start and end of the value chain.
- Energy is measured as cumulative energy demand through the ratio of MJ input/MJ output and is used for biomass production (to prepare soil, sowing/planting, fertilising and harvesting crops), transport logistics (to haul product between plantations, processing units and distribution outlets) and conversion operations.
- GHG emissions are based on the RED II emissions calculation and apply to land use (annualised emissions from carbon stock changes caused by land-use change, including actual and reference soil and vegetation carbon stock changes, savings from accumulated soil organic carbon through the use of innovative agriculture management and benefits of using marginal land), biomass production (extraction or cultivation of raw material, including planting, fertilisation, and harvesting), conversion (including pre-treatment processing, storage, and conversion processing), transport (including transport from biomass production to processing, processing to conversion, and conversion to fuelling stations), and end use (combustion from the fuel in use).
- Improvements in agricultural or forestry practices include adjusting the harvest level (measured as % of net annual biomass growth) to optimise either or both sustainability and productivity.
- Gains or losses in vegetation and soil carbon stock is measured in gCO2eq and concerns both land use and biomass production.
- Technological improvement is possible for the stages of biomass production, transport and conversion processes, and includes innovation such as fuel efficiency in machinery, automation, AI, state of the art applications, etc.). It is shortened to TRL for Technological Readiness Level [43].
Indicators per value chain stage can inform performance for competitive priorities, leading to optimised strategies and policy, which can maintain integrated support across value chain stages and exploit competitive advantages and specific regional characteristics [12]. The competitive priorities have been selected to articulate biophysical assets (e.g., land, soil, vegetation and climate) and market factors (e.g., competition for land and natural resources, new technologies and valorisation of end- and co-products) of the value chains and assist in delivering an overall optimised performance.
- Transparency derives from the availability of up-to-date information surrounding the state of a system [11] to maximise awareness around the benefits (and risks) in the development of biomass systems as well as to foster trust among the consumer base. It informs the first value chain stage about land use patterns, displacement impacts and growth opportunities. It is equally informed by compliance to emissions standards across the life-cycle operations of the value chain [12].
- Quality aims to improve process and product performance and compliance with industry or policy standards across the value chain [44] to mitigate potential negative impacts on people and the environment. Biophysical components of the value chain should be safeguarded and ensuring a high-quality end-product is key for driving acceptance from markets and consumers. It is relevant across the whole value chain [4,45] being informed by life cycle greenhouse gas emissions, and earlier stages through the sustainable harvest levels, and vegetation and soil carbon stock indicators.
- Innovation targets the development of novel equipment and processes [11], concerning cultivation and conversion processes, and modes of transport that can increase in efficiency. Relevant indicators include bioenergy carriers and carbon stock, which are driven by innovations in land use productivity, feedstock novelty and innovative management applications [12]. Additionally, innovations are reflected through change in energy use from efficiency, grid connectivity, and TRL.
- Flexibility is defined as the ability to expand or adjust product type, scope and function [43]. Converting raw materials into biofuel products requires ensuring a reliable supply of raw materials, adjusting modes of conversion and regulating capacity of production. Indicators that inform flexibility include bioenergy carriers as defined by their type and capacity volume, cumulative energy demand as reflected by strategic allocation of energy inputs and outputs, and technology improvement through improved types and scales of application [43,46].
3.3. Value Chain Practices
The environmental and technical performances of selected practices listed in Table 2 are evaluated for both value chains through indicators integrated within a system dynamics model, and competitive priorities. Data from Table 1 create a base simulation and basis from which introduced practices can innovate. Seven (7) scenarios are studied: (1) land use (LU), (2) LU + biomass production (BP), (3) LU + BP + transport (T), (4) LU + BP + T + conversion (C), (5) BP + T + C, (6) T + C and (7) C.
Table 2.
Practices evaluated, indicators as model inputs and outputs, and competitive priorities.
Positive or negative quantitative deviations from the base case are reflected through a colour code and respectively transcribed into a point-value system (plain colour = 0; light green = 0.5; green = 1; dark green = 1.5; red = −1) in order to assess the impact of value chain practices on competitive priorities.
3.4. System Dynamics Model
The application of a system dynamics model in this study follows best practice guidelines [52,53]: (1) a coherent mapping of value chains and practices across different sectors and entities; (2) a structuring of an endogenous and measurable model verified through a transparent, bottom-up data input-output approach with clearly defined metrics and functional equations harmonising different units of measurements; (3) the iteration of two case studies with varying configurations; and (4) the reflection of real-world dynamics through data tables, software-verified equations and a sensitivity analysis.
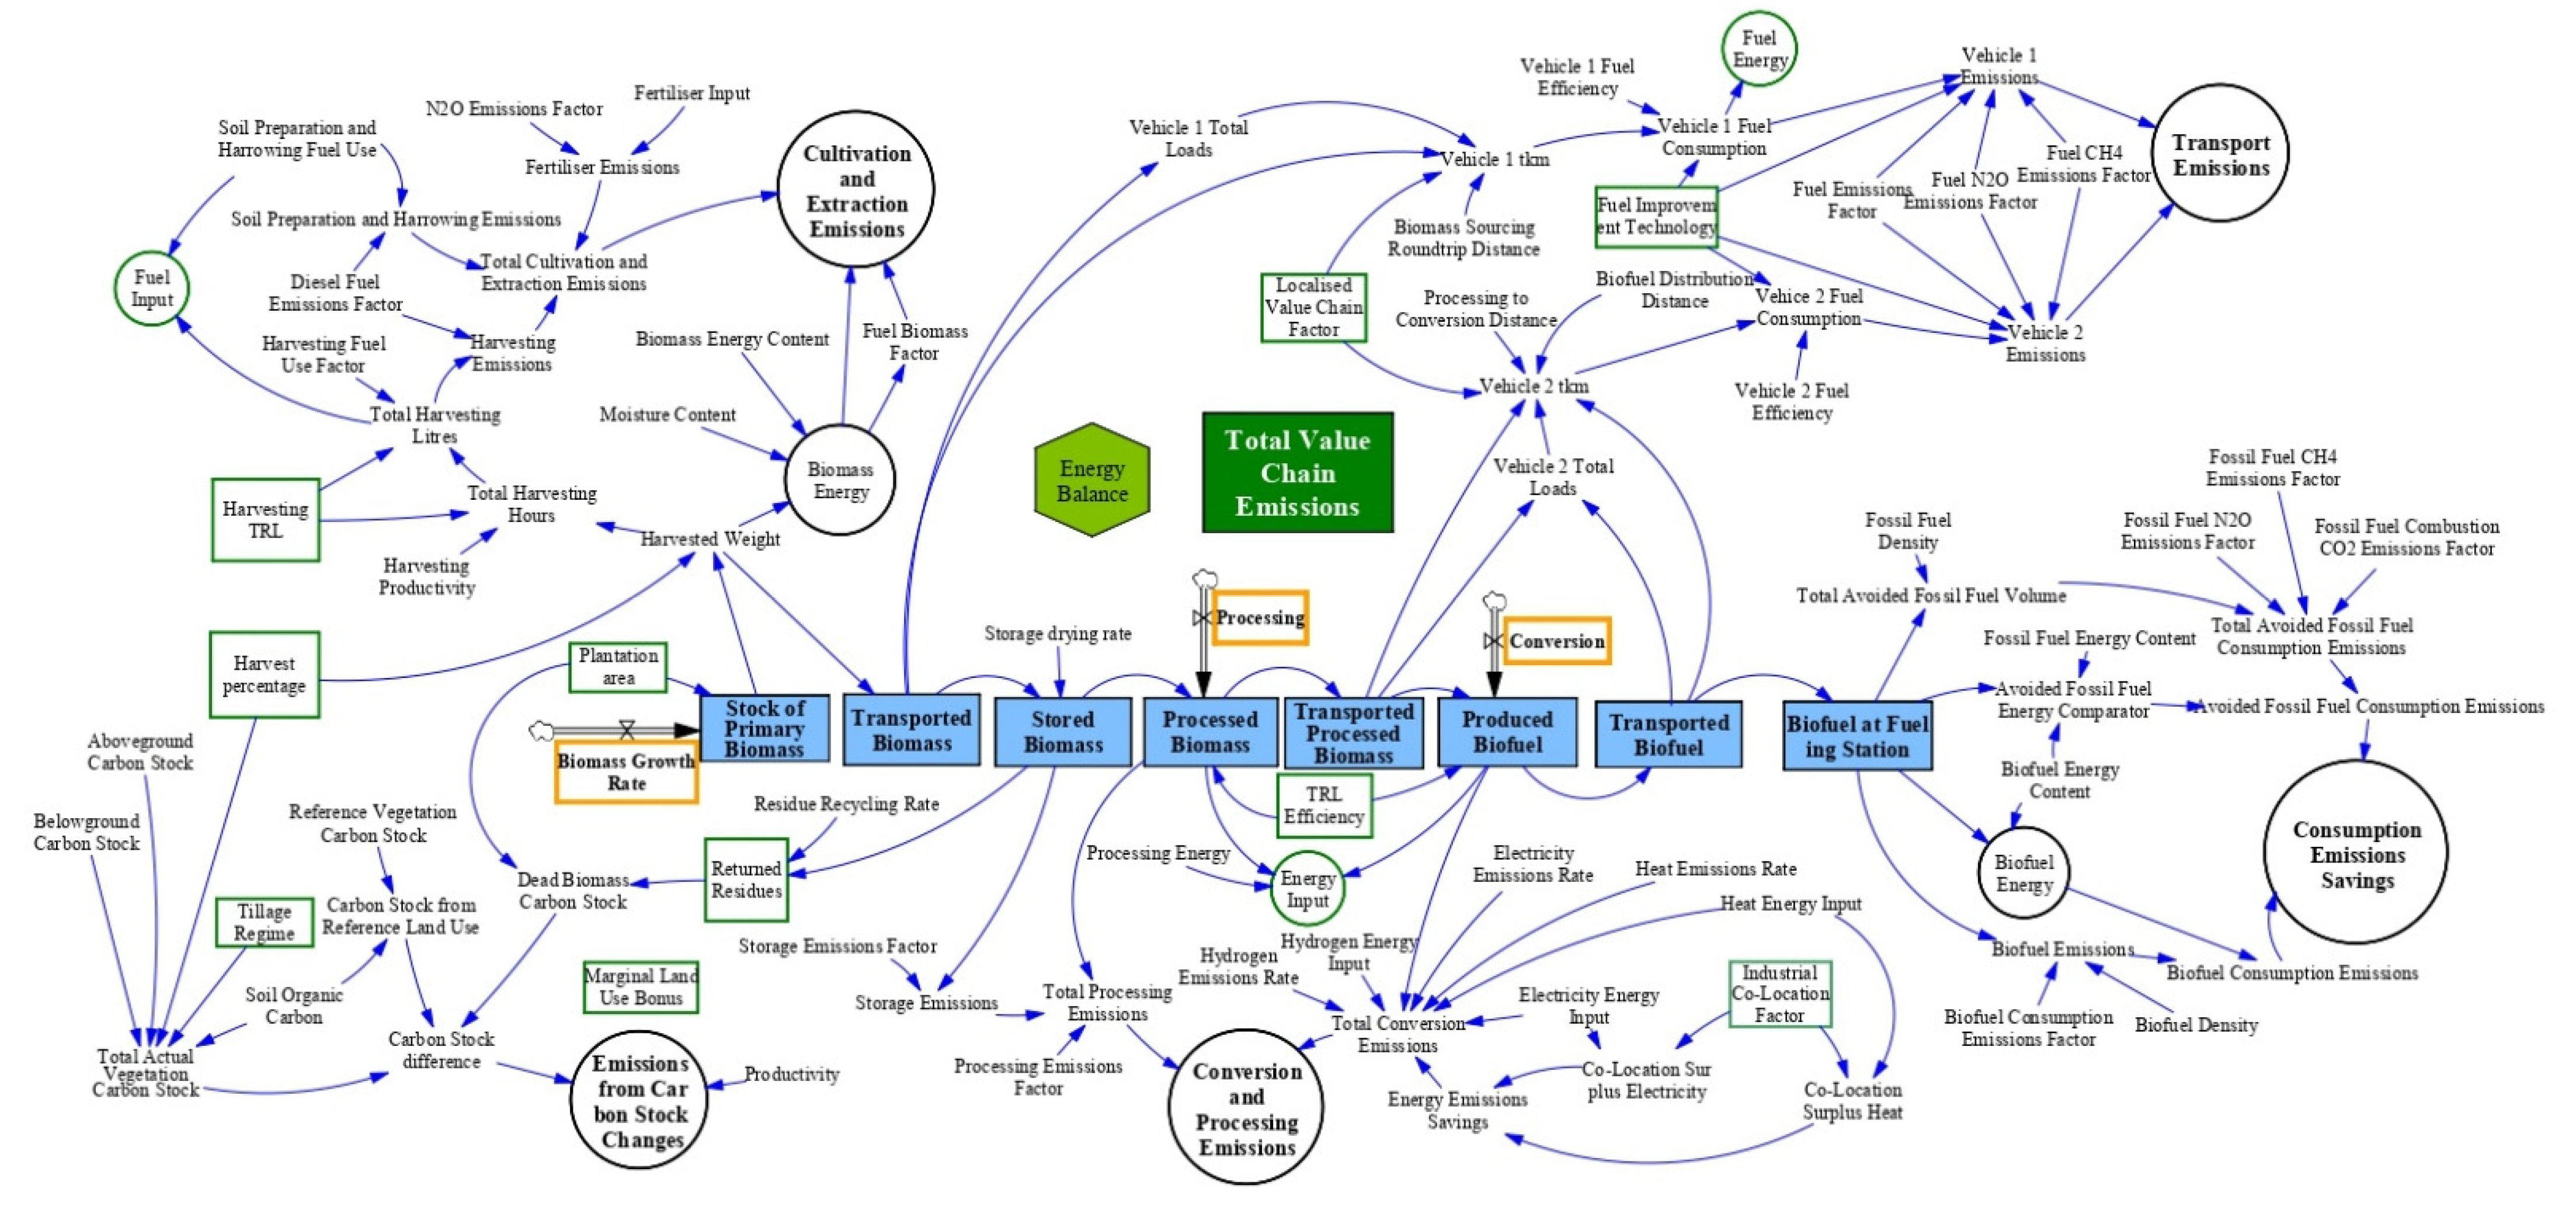
The Vensim® software (https://vensim.com, accessed on 15 September 2021) is used to design and operate a stock-and-flow system dynamics model composed of different variables harmonising various units of measurements to simulate environmental and technical impacts of practices along advanced biofuel value chains. The main value chain production stocks (biomass and biofuel) are represented by blue squares and are calculated through flows that are illustrated as black arrows. Cloud symbols represents the source of these flows whose values are externally-determined. Cloud symbols are sources of flows and stocks that lie outside of the model scope. These given rates (biomass growth and biofuel processing and conversion) are illustrated by orange boxes. Constant (e.g., coefficients) or auxiliary variables link stocks and flows through blue arrows, while light grey variables in angle brackets replicate existing variables in order to facilitate model layout. Large circles represent the stocks of emission categories, while green shapes reflect enacted practices. Repeated variables are hidden for overall legibility purposes. The full list of variables and equations can be found in Appendix A and Appendix B.
4. Results
4.1. System Dynamics Model and Quantitative Analysis
Practices are evaluated based on the order of value chain stages, combined one after another to analyse the system as a whole. Each practice targets a specific sector, stakeholder or policy, while the model (Figure 2) links all value chain stages together.
Figure 2.
System dynamics model of an advanced biofuel value chain and performance indicator pathways.
Results from Table 3 highlight that when land use area is increased by 30%, natural carbon stock increases: in the case of VC 1, with a growth of 120% (or 6,046 gCO2eq) due to converting a young forest with low canopy cover to a forest plantation, and in the case of VC 2, a growth of 33% (or 202 gCO2eq) from establishing crops on marginal land. The use of marginal lands combined with a certain crop type, such as a lignocellulosic crop, can lead to GHG emissions savings thanks to soil remediation processes and mitigation of emission-causing land use change [54]. Although production increases substantially with a larger planting area, the bioenergy carrier (in MJ/ha) indicator does not increase substantially, thus productivity remains largely unchanged.
Table 3.
Indicator-based impacts of value chain practices for 7 scenarios (BASE: no practices implemented; LU: practices implemented at the land use stage; BP: practices implemented at the biomass production stage; T: practices implemented at the transport stage; C: practices implemented at the conversion stage).
When biomass production practices (including improving harvesting efficiency, lowering the harvesting rate, incorporating residues from later processing stages back into the soil, and softening the tillage regime) are put in place, the carbon stock in VC 1 shifts from producing net emissions in the base case to significantly sequestrating carbon. Studies have shown that significant amounts of carbon can be sequestered in a no-tillage production system [55]. VC 2 demonstrates similar results with a tripling of carbon stock under biomass production practices. Forest systems (VC 1) sequester more carbon than grass systems (VC 2) under an expansion of land. However, relative to biomass practices, VC 2 sequesters more carbon due to its higher productivity.
While the energy ratio changes little, bioenergy carriers start to decline under biomass production practices. This is due to the imposition of a lower harvesting rate in favour of generating more soil carbon.
Emissions align with carbon stock trends. The relatively moderate increase of emissions in VC 1 may be due to the integrated supply factor of pairing industrial roundwood production with the extraction for biofuels [56]. Indeed, in land use and primary biomass production, a large portion of life cycle GHG emissions depends on savings from the share of biomass grown and its effect on soil carbon changes [36].
When improving transport through fuel efficiency and co-location, there are no major changes for any indicator, with the exception of a marginal improvement in emissions and energy ratio. Nie and Bi [57] demonstrate that converting biomass to biofuel before it is transported can significantly lower emissions. This requires removing the distance of biomass production to the processing plant altogether. In the model, the localisation factor was increased to 50% (total distance is reduced by half). The sensitivity analysis included in this study provides additional insights as to the impact of different reductions in distance.
Following transport, conversion improvements (increased efficiency both for processing and conversion, and industrial co-location for energy use) significantly increase productivity as well as improve the energy ratio. Site selection for new facilities is a key factor. Using existing fossil fuel infrastructure for instance can contribute to scaling-up advanced biofuel production facilities by reducing initial start-up risks [48]. Under advanced biorefinery configurations, power generation can incorporate excess electricity back into conversion processes in order to reduce GHG emissions [58]. Jin and Sutherland [25], Benavides et al. [59], and Zetterholm et al. [60] advocate for having both processing and conversion steps integrated within the same site and leveraging benefits of co-location to reduce energy demand and increase the generation of surplus electricity. In the case of VC 2, this is measured through integrating surplus electricity and non-condensable gas derived from the FBPO production process (processing stage) into the hydrocarbon production process (conversion stage). One study [61] demonstrates that a share of 5% of excess energy reduces emissions by one third in spite of a concurrent rise in efficiency and production. VC 1 is based on a co-location with a pulp and paper mill and thus includes a 30% bonus of excess energy inputs in the base case. A rise to 60% contributes to lower emissions at the processing and conversion stages. However, such practices also cause total (cross-value chain) emissions to increase by 40% for VC 1 and 30% for VC 2, due to carbon stock change emissions being calculated per MJ of biofuel product and correlating positively with productivity.
If no practice at the land use level is enacted, the potential for carbon sequestration drops. With biomass production practices removed as well, emissions increase to 50% in VC 1 and 20% in VC 2 of the base case, while carbon stock returns to its base level. However, the combination of transport and conversion practices generates the highest levels of production and efficiency. This highlights the challenge of optimising both sustainability and productivity dimensions of the value chain. Although advanced processes such as torrefaction can decrease wasted material and energy, additional feedstock is required, which potentially results in higher land use change, cultivation and storage emissions [58].
4.2. Assessment of Competitive Priorities
Through the following framework of analysis, decision-makers can be made aware of: (1) which competitive priority is optimised, (2) which value chain practice determines this optimisation, (3) which aspect (e.g., emissions, land use) defines competitive priority, and (4) which stage(s) of the value chain is concerned.
The findings from Table 4 and Figure 3 indicate that when practices are enacted across the value chain, competitive priorities (as defined by indicators of sustainability and productivity) improve. More specifically, competitive priorities working in concert lead to system-wide optimisation. For instance, higher quality or more reliable biomass will result in lower energy and material inputs needed at the conversion stage [62]. Leban et al. [63] confirm how professionals in the forestry systems care most about managing forests for several functions simultaneously within a given area and in an integrative manner.
Table 4.
Qualitative transcription of indicator results ranking competitive priorities per scenario compared to a base case (colour codes are defined as having:  : no impact;
  : a marginal positive impact;
  : a moderate positive impact;
  : a strong positive impact; and
  : a negative impact).
: no impact; : a marginal positive impact; : a moderate positive impact; : a strong positive impact; and : a negative impact).
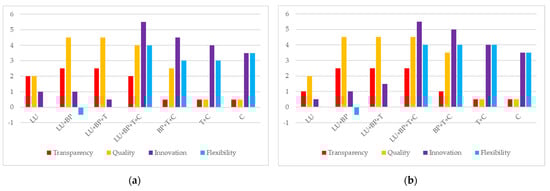
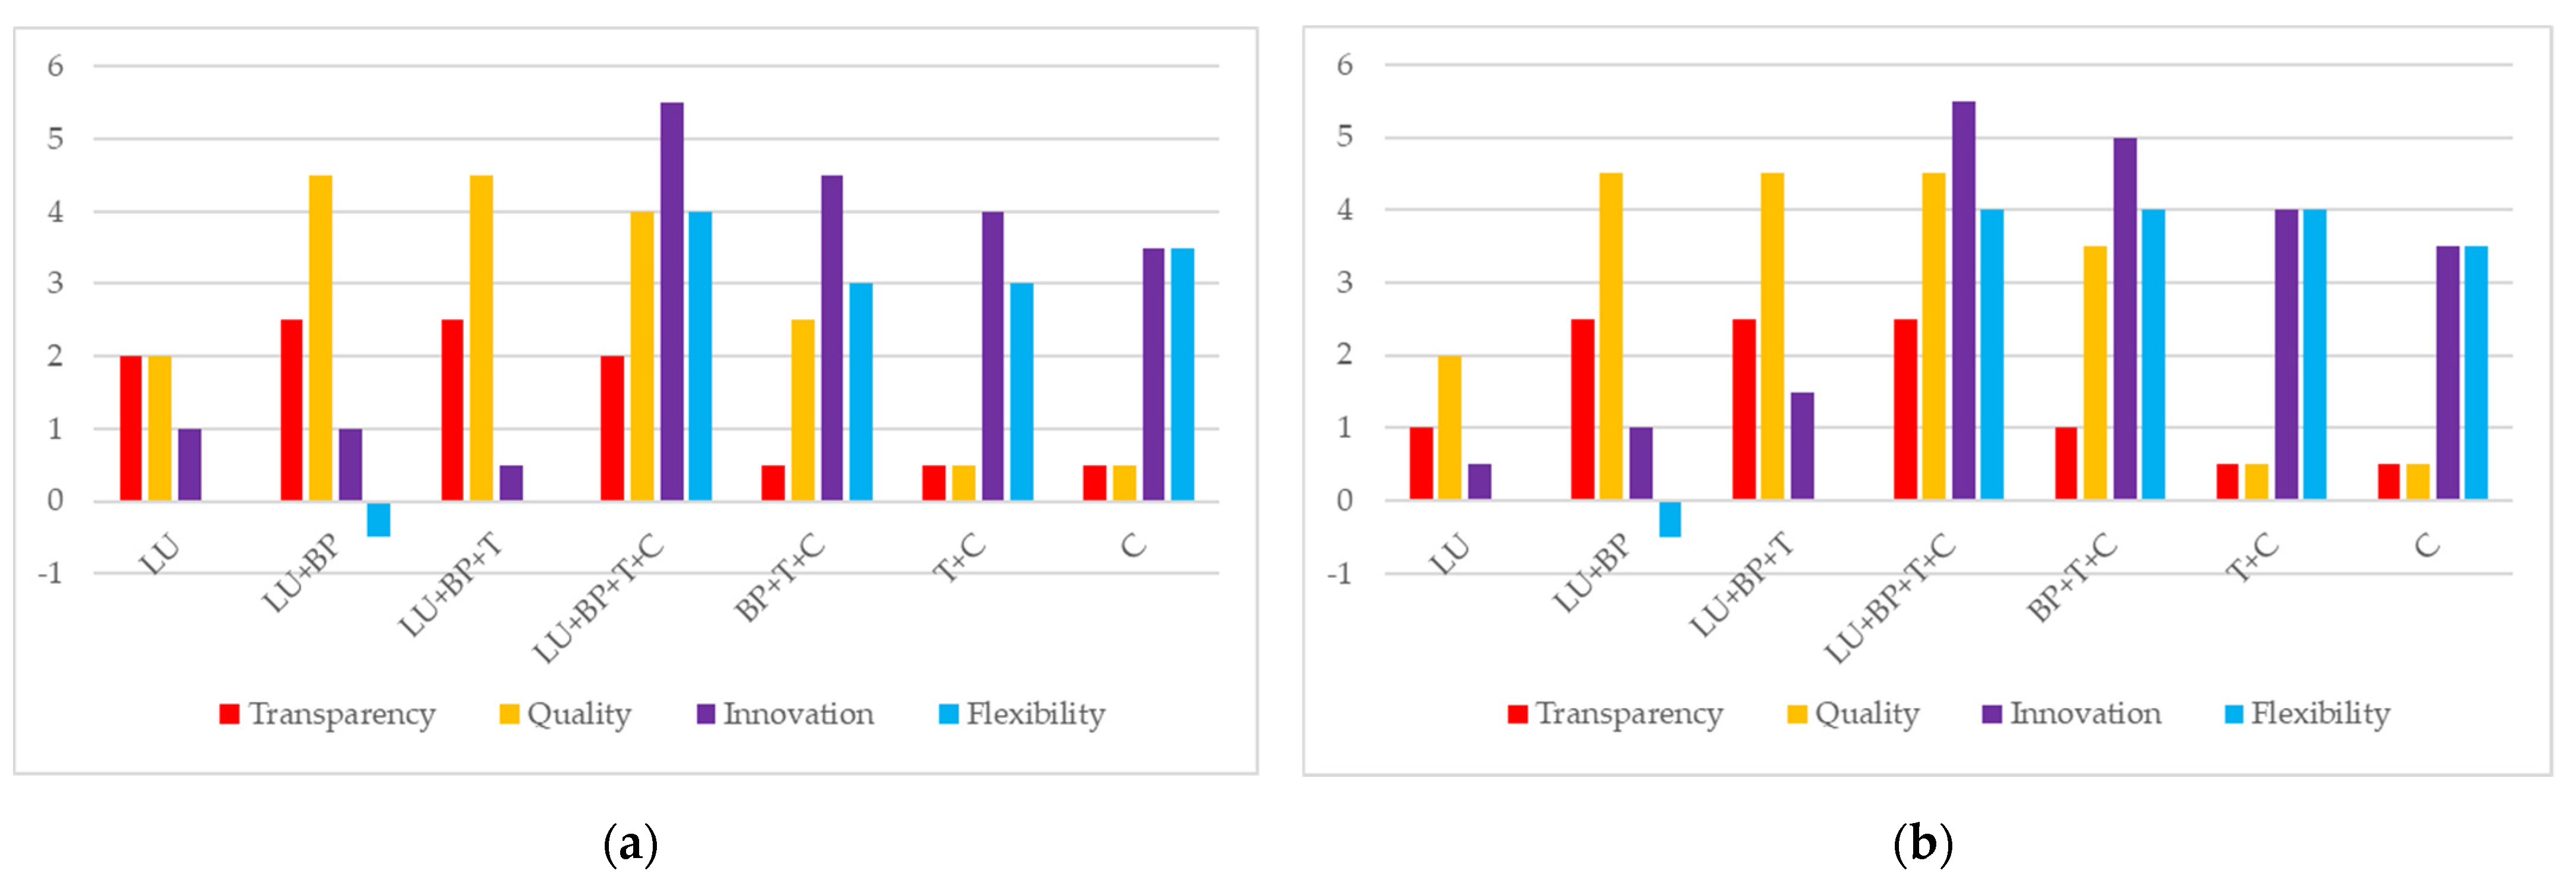
Figure 3.
Ranking of competitive priorities per scenario based on results of Table 4 (a) for VC 1; and (b) for VC 2.
When not all value chain stages are targeted, enhancements at the land use and biomass production stages contribute to stronger transparency and quality, while having a marginal effect on innovation and flexibility (land use practices on their own worsen these). Conversely, transport and conversion practices contribute to stronger innovation and flexibility, with a marginal effect on transparency and quality. This indicates that compliance with standardisation schemes and enhancing process and product performance for environmental assets are more responsive to chosen indicators of the first two stages. Indeed, for both VC 1 and 2, there is limited optimisation of innovation and flexibility from bioenergy carriers and energy ratio. Furthermore, while land use expansion, sustainable harvesting and carbon stock preservation practices lead to optimisation of transparency and quality, biomass production activities themselves generate significant emissions. Thus, land use practices alone are fundamental to optimising transparency. The discussion section further explores how decision-makers can be better equipped with additional indicators to balance land use carbon stock sequestration with cultivation emissions.
Once land use and biomass practices are removed, quality and transparency underperform. Innovation also starts to decrease, which highlights the effects that these two value chain stages have on the competitive priority (such as carbon stock growth following the introduction of a novel crop species). Overall, upgrades in conversion efficiency, proximity to infrastructure, and technological readiness level (innovation) as well as adjustment of scales of implementation and strategic allocation of energy inputs and outputs (flexibility) are more responsive to indicators of the latter two stages.
It is important to underline that results show several examples of how transparency and quality do not solely determine sustainability, and conversely, innovation and flexibility do not solely determine productivity or resource efficiency. In fact, any competitive priority can affect either or both sustainability and productivity dimensions. Key determinants of competitive priority performance are the cross-value chain approach—enacting practices that impact one or more stages across the whole value chain—and indicators defining such competitive priorities.
4.3. Sensitivity Analysis
A set of alternative practices and their impact on indicators and priorities were studied as a sensitivity exercise. These are presented in Table 5 and results similarly highlight the importance of the conversion stage for competitive priorities, however they additionally underline the innovative practices of co-location, renewable energy sourcing and residue recycling practices for the processing and conversion stage as key drivers of emissions abatement, and thus key contributors to transparency and quality optimisation. A key enduring finding is the trade-off between transparency and quality priorities and innovation and flexibility. Finally, this exercise demonstrates the various options that decision-makers can leverage to guide their focus and management of competitive priorities across the value chain.
Table 5.
Impact of alternative practices.
5. Discussion
The goal of integrating competitive priorities into a biofuel value chain framework with system dynamics is to harmonise historically disparate dimensions of management or policy focus: sustainability and operational efficiency. Decision-makers can be better equipped to optimise value chain performance when ensuring both that biomass value chains operate under a sustainable footprint while remaining robust enough to compete with conventional production streams.
While findings from both quantitative and qualitative assessments highlight trade-offs between sustainability and productivity interventions, they provide a framework that informs decision-makers of their prioritisation options. Optimisation pathways are apparent, for instance through enacting co-location, energy sourcing and residue recycling practices at the transport and conversion stages to increase both innovation and flexibility, and emissions reduction (linked to quality and transparency). In VC 2, integrating surplus electricity and non-condensable gas leads emissions to drop by one third along with a concurrent rise in efficiency and production.
The impact analysis has allowed to focus on specific opportunities for every value chain stage that can accelerate sustainable deployment of advanced biofuels in a whole systems manner. For instance, when combining land use with biomass production improvements, carbon stock actually doubles in the case of VC 1. As decision-makers incorporate additional indicators, they can find ways to ensure competitive priorities reinforce one another through cross-value chain practices. An expanded set of indicators can better define competitive priorities and more accurately represent their cross-cutting nature.
While results show that land use and biomass production practices strongly impact the competitive priorities of quality and transparency, indicators that measure consumer awareness and sustainability standards can also inform product novelty (innovation). Indicators such as ash content, ash-melting temperature, nitrogen content and chlorine content inform lignocellulosic biomass feedstock suitability for conversion processes [64] and can measure transparency and quality across the value chain. With regards to transport and conversion practices and their limited impact on quality and transparency, additional indicators or standardisation policies can help measure sustainability [6,65], including fuel which can be analysed through technical compatibility with engine technologies used in various transport sectors based on their property characteristics [66].
This model may also benefit from integrating carbon cycling mechanisms such as net primary production, local heterotrophic respiration and net ecosystem production, considered key sustainability accountability measures in biofuel value chains [67]. Ecological detail can shed light on trade-offs between technology and sustainability, such as the emissions footprint of VC 2 which suffers in light of conversion technological improvement, contrary to the footprint of VC 1, whose forest system proves more resilient under technology improvements. Decision-makers also have an opportunity to select value chain configurations and practices to address indirect LUC. In order to improve on this transparency measure, future studies employing this type of modelling can include certification and accountability systems to control for externalities. The Finnish company UPM for instance works with the Forest Stewardship Council certification to ensure that old growth trees are left alongside riverbeds and a minimum radius for deforestation is maintained [68]. Additionally, the modelling scope can be broadened by including research and development facilities, nurseries, baling/loading, construction and fuelling stations, and expanding on environmental indicators to include particulate reduction or ecological impacts on biodiversity (as a factor of indirect LUC).
Finally, system dynamics as a modelling tool can be greatly expanded beyond the scope of this study. When increasing or decreasing the co-location factor, data such as feedstock and biofuel capacity which in this study are inherently determined can be evaluated explicitly. Additionally, time horizons can be introduced to expand the real-world, dynamic factor of simulations [20,32]. Financial viability and feedstock value of recycled waste product or soil inputs in a second-generation biofuel value chain have been demonstrated through fuzzy multi-objective optimisation methods under states of uncertainty [69].
6. Conclusions
The basis of the analytical framework employed in this paper is a bottom-up system dynamics model, which structurally links value chain performance and environmental components to simulate the impact of innovative practices on competitive priorities. This approach facilitates the process of bridging historically disparate spheres of focus and performance for decision-makers. These include stages of a bio-based value chain that deal predominantly with natural resources, and others with more infrastructure-based processes, as well as broader spheres of sustainability and productivity. The clear, accurate and functional mapping of a biofuel value chain through system dynamics integrates these spheres of focus and performance to inform decisions around more integrated optimisation pathways. Furthermore, a unique linkage of quantitative indicators based on coherent and functional mathematical relationships with qualitatively ranked competitive priorities can provide decision-makers with a more versatile approach when assessing their enactment of innovative value chain practices.
The framework demonstrates that competitive priorities of transparency, quality, innovation and flexibility can reinforce one another, and that when integrated into a cohesive system, improved environmental and operational interventions can benefit each other. Additionally, in line with much of the literature, co-location, renewable energy sourcing and residue recycling practices are overall beneficial for advanced biofuel value chains. Moreover, land use and biomass production stage practices contribute to stronger transparency and quality, while transport and conversion practices contribute to stronger innovation and flexibility. Finally, trade-offs are clearly portrayed and decision-makers can leverage the cross-value chain approach to manage these.
The use of system dynamics in this paper presents both advantages and drawbacks for decision-makers looking to optimise their operational and environmental value chain performances. On the one hand, this type of modelling allows a clear and accurate mapping of all value chain activities and inter-related components. Managers can toggle a variable in the Vensim framework to simulate a value chain intervention and immediately witness the system-wide impact it engenders. System dynamics thus provides both shortcuts in handling mathematical calculations and clarity for decision-makers to work with observable value chain interventions and designs. Such visual information of quantitative variations behind key performance indicators effectively provides managers with the understanding of how different competitive priorities perform.
On the other hand, one key limitation is the bottom-up data collection process, which demands a high degree of research capacity and is often hindered by commercial data confidentiality. These data were meticulously and independently assembled to effectively build hypothetical, innovative biofuel value chains. The study demonstrates however, that it is feasible to utilise a near-identical model to compare two advanced biofuel value chains with varying characteristics and numbers. The degree of transferability is advantageous to continue simulating additional advanced bio-based value chains while expanding modelling capabilities and features to include market (e.g., cost), socio-economic (e.g., full-time jobs), and ecological (e.g., farmland birds) characteristics, time horizons and a variety of end-products (e.g., bioplastics).
Author Contributions
Conceptualization, methodology, software, validation, formal analysis, investigation, resources, data curation, writing—original draft preparation, writing—review and editing, visualization, T.C.; writing—review and editing, supervision, project administration, funding acquisition, C.P. All authors have read and agreed to the published version of the manuscript.
Funding
This research was funded by the European Commission, in ‘ADVANCEFUEL: Facilitating market roll-out of RESfuels in the transport sector to 2030 and beyond’, [H2020 Grant No 764799].
Institutional Review Board Statement
Not applicable.
Informed Consent Statement
Not applicable.
Conflicts of Interest
The authors declare no conflict of interest.
Appendix A
Input data for system dynamics model per GHG emissions category. Text in blue refers to assessed value chain practices.
| Carbon Stock Changes Emissions | Cultivation and Extraction Emissions | ||||
| Variable | VC 1 | VC 2 | Variable | VC 1 | VC 2 |
| Biomass growth rate | 3.6 t/ha/yr [70] | 17 t/ha/yr [37,71] | Biomass moisture content | 40% = 0.6 tdm/t [70,72,73] | 15–33% [74,75] |
| Plot area | 100–150 ha | 50–75 ha | Biomass energy content (LHV) | 15,000 MJ/tdm [76] | 17,500 MJ/kg [77] |
| Living biomass aboveground carbon stock | 5.11 t/ha [47] | 5 t/ha [47] | Soil preparation /harrowing fuel use | 53 L/ha [70] | 38 L/ha [73] |
| Belowground carbon stock | 1.89 t/ha | 5 t/ha | Fertiliser input | 150 kg N/ha [70] | 40 kg N/ha [37,71] |
| Carbon fraction in deadwood | 0.5 g/tdm [47] | 0.4 g/tdm [47] | Emission factor for N2O emissions from N inputs | 10,928 gCO2eq/kg N [78] | |
| Tillage regime (full, reduced, none) on soil carbon stock factor | 1.08–1.15 [47] | 1–1.1 [47] | Herbicides and other pollutants | 0 kg/ha [79] | 20,592 gCO2eq/ha [73] |
| Carbon stock from reference land use | 2–14 t/ha [47] | 3.1 t/ha [47] | Harvesting productivity | 4.3–9.9 t/ha [80,81] | 17 t/ha [73] |
| Soil organic carbon | 117 t/ha [47,82] | 38 t/ha [47] | Fuel use | 30–43 L/ha [80,81,82,83] | 23.30 L/ha [73] |
| Molecular weight of CO2 to carbon | 3.664 [13] | Technology improvement | 0–30% | ||
| Marginal land bonus | 0 gCO2eq/MJ | 0–29 gCO2eq/MJ [11] | Harvest level | 80–100% | |
| Harvesting diesel fuel factor | 2660 gCO2eq/L [84] | ||||
| Processing and conversion emissions | |||||
| Variable | VC 1 | VC 2 | |||
| Storage emissions factor | 8000 gCO2eq/tdm [85] | ||||
| Residue recycling rate | 5–50% | ||||
| Processing rate | 0.050 t/tdm [86] | 0.6–0.7 t/tdm [37,87,88] | |||
| Processing energy demand | 15,000 MJ/t [61] | 144 MJ electricity/tdm [89] | |||
| Processing emission factor(s) | 550 kgCO2eq/t [61] | 0.03 kgCO2eq/MJ electricity [61] 131 kgCO2eq/tdm N2 [61] | |||
| Co-location surplus heat and electricity | 30–60% of conversion energy inputs | 0–5% 518 MJ electricity/t FBPO [89] 1.8 t NCG/t FBPO [89] | |||
| Technology improvement | 0–30% (processing and conversion rates) | ||||
| Conversion rate | 0.54–70% [90,91] | 37% [89] | |||
| Conversion energy demand | 382 MJ electricity/t biodiesel [90] 1111 MJ heat/t biodiesel [90] 50 kg hydrogen/t biodiesel [90] | 0.5 t methane/t FBPO [89] 83 MJ electricity/t FBPO [89] 0.69 MJ/MJ hydrogen [92] | |||
| Conversion emission factor(s) | 33–66 gCO2eq/MJ electricity [90] 99 gCO2eq/MJ heat [90] 11,500 gCO2eq/kg hydrogen [90] 684 gCO2eq/MJ composite electricity + heat [93] | 2726 kgCO2eq/t methane [89] 0.03 kgCO2eq/MJ electricity [89] 28–181 gCO2eq/MJ hydrogen (renewable vs. non-renewable ex-situ) [89] | |||
| Transport emissions | Consumption emissions | ||||
| VC 1 | VC 2 | VC 1 | VC 2 | ||
| Fossil fuel emission factor | 2697 gCO2eq/l [84] | 2319 gCO2eq/l [94] | Advanced biofuel energy content | 44 MJ/kg [13] | 45 MJ/kg [11] |
| Fossil fuel energy content | 36 MJ/l | 32.55 MJ/l | Fossil fuel energy content | 43 MJ/kg [11] | |
| Transport fuel efficiency | 0.0212 l/tkm (90-ton lorry) [95,96]; 0.061 l/tkm (10-ton lorry) [97] | 0.036 l/tkm (20-ton lorry); 0.061 l/tkm (10-ton lorry) [97] | Advanced biofuel density | 0.815 t/m3 [98] | |
| Technology improvement | 0–30% | Fossil fuel density | 0.840 t/m3 [99] | 0.755 t/m3 [99] | |
| Vehicle capacity | 10, 20, 90-ton lorries (loaded capacity = 25–60% [100]) | Advanced biofuel combustion emission factor | 2,496,427 gCO2eq/m3 [94] | 0.49 gCO2eq/MJ [101] | |
| Distance | 20–50 km | 10–50 km | Fossil fuel emission factor | 2,697,197 gCO2eq/m3 [94] | 2,319,432 gCO2eq/m3 [94] |
| Localisation (reduction) factor | 10–50% | Advanced biofuel N2O emission factor | 1770 gCO2eq/m3 [102] | ||
| Fossil fuel N2O emission factor | 2.23–3.33 gCO2eq/l (HDV) [102] | 8.22–12.26 gCO2eq/l (HDV) [102] | Fossil fuel N2O emission factor | 13,990 gCO2eq/m3 [99] | |
| Fossil fuel CH4 emission factor | 0.20–0.30 gCO2eq/l [102] | 1.27–1.90 gCO2eq/l [102] | Advanced biofuel CH4 emission factor | 74.29 gCO2eq/m3 [102] | |
| Technology improvement | 0–30% (rigid vs. articulated HDV) | ||||
Appendix B
List of all variables in addition to those in Table 1 used in the model for both value chains with respective units, equations and causes.
| Variable | Unit | Equation and Cause | |
| Total Emissions from Carbon Stock Changes | Dead Biomass Stock | t/ha | (Returned Residues × Carbon Fraction)/Plantation area |
| Total Vegetation Carbon Stock | t/ha | Aboveground Carbon Stock − (Aboveground Carbon Stock × Harvest percentage) + Belowground Carbon Stock + (Soil Organic Carbon × Tillage Regime) | |
| Carbon Stock from Reference Land Use | t/ha | Soil Organic Carbon + Reference Vegetation Carbon Stock | |
| Carbon Stock Difference | gCO2eq | ((Carbon Stock from Reference Land Use − Total Actual Vegetation Carbon Stock − Dead Biomass Carbon Stock) × CO2 to carbon quotient) × Plantation area | |
| Productivity | MJ/ha | Biofuel Energy/Plantation area | |
| Emissions from Carbon Stock Change | gCO2eq/MJ | Carbon Stock difference × (1/Productivity) | |
| Total Emissions from Carbon stock changes | gCO2eq/MJ | Emissions from Carbon Stock Changes − Marginal Land Use Bonus | |
| Cultivation and Extraction Emissions | Stock of Primary Biomass | t | Biomass Growth Rate × Plantation area |
| Harvested Weight | t | Stock of Primary Biomass × Harvest percentage | |
| Total Harvesting Hours | h | Harvested Weight/(Harvesting Productivity + (Harvesting Productivity × Harvesting TRL)) | |
| Total Harvesting Litres | L | (Harvesting Fuel Use Factor − (Harvesting Fuel Use Factor × Harvesting TRL)) × Total Harvesting Hours | |
| Fuel Input | MJ | (Plantation area × Soil Preparation and Harrowing Fuel Use × Fuel Energy Content) + (Total Harvesting Litres × Fuel Energy Content) | |
| Harvest Emissions | gCO2eq | Total Harvesting Litres × Diesel Fuel Emissions Factor | |
| Soil Preparation and Harrowing Emissions | gCO2eq | Soil Preparation and Harrowing Fuel Use × Diesel Fuel Emissions Factor × Plantation area | |
| Fertiliser Emissions | gCO2eq | Fertiliser Input × N2O Emissions Factor × Plantation area | |
| Total Cultivation and Extraction Emissions | gCO2eq | Harvesting Emissions + Fertiliser Emissions + Soil Preparation and Harrowing Emissions + Herbicide Emissions | |
| Biomass Energy | MJ | Harvested Weight × Moisture Content × Biomass Energy Content | |
| Fuel Biomass Factor | Biomass Energy/Biofuel Energy | ||
| Cultivation and Extraction Emissions | gCO2eq/MJ | (Total Cultivation and Extraction Emissions/Biomass Energy) × Fuel Biomass Factor | |
| Transport Emissions | Transported Biomass | t | Harvested Weight |
| Vehicle 1 Loads | loads | Transported Biomass/Vehicle 1 Capacity | |
| Vehicle 1 tkm | tkm | (Transported Biomass + (Vehicle 1 Unloaded Capacity × Vehicle 1 Total Loads)) × (Biomass Sourcing Roundtrip Distance − (Biomass Sourcing Roundtrip Distance × Localised Value Chain Factor)) | |
| Vehicle 1 Fuel Consumption | l | Vehicle 1 tkm × (Vehicle 1 Fuel Efficiency − (Vehicle 1 Fuel Efficiency × Fuel Improvement Technology)) | |
| Fuel Energy | MJ | Fuel Energy Content × Vehicle 1 Fuel Consumption | |
| Vehicle 1 Emissions | gCO2eq | (Vehicle 1 Fuel Consumption × Fuel Emissions Factor) + ((Fuel CH4 Emissions Factor − (Fuel CH4 Emissions Factor × Fuel Improvement Technology)) × Vehicle 1 Fuel Consumption) + ((Fuel N2O Emissions Factor − (Fuel N2O Emissions Factor × Fuel Improvement Technology)) × Vehicle 1 Fuel Consumption) | |
| Transported Processed Biomass | t | Processed Biomass | |
| Transported Biofuel | T | Produced Biofuel | |
| Vehicle 2 Loads | loads | (Transported Processed Biomass/Vehicle 2 Capacity) + (Transported Biofuel/Vehicle 2 Capacity) | |
| Vehicle 2 tkm | tkm | ((Transported Processed Biomass + (Vehicle 2 Unloaded Capacity × Vehicle 2 Total Loads)) × (Processing to Conversion Distance − (Processing to Conversion Distance × Localised Value Chain Factor))) + ((Transported Biofuel + (Vehicle 2 Unloaded Capacity × Vehicle 2 Total Loads)) × (Biofuel Distribution Distance − (Biofuel Distribution Distance × Localised Value Chain Factor))) | |
| Vehicle 2 Fuel Consumption | l | Vehicle 2 tkm × (Vehicle 2 Fuel Efficiency − (Vehicle 2 Fuel Efficiency × Fuel Improvement Technology)) | |
| Vehicle 2 Emissions | gCO2eq | (Vehicle 2 Fuel Consumption × Fuel Emissions Factor) + ((Fuel CH4 Emissions Factor − (Fuel CH4 Emissions Factor × Fuel Improvement Technology)) × Vehicle 2 Fuel Consumption) + ((Fuel N2O Emissions Factor − (Fuel N2O Emissions Factor × Fuel Improvement Technology)) × Vehicle 2 Fuel Consumption) | |
| Transport Emissions | gCO2eq/MJ | (Vehicle 1 Emissions + Vehicle 2 Emissions)/Biofuel Energy | |
| Conversion and Processing Emissions | Stored Biomass | tdm | Transported Biomass × Storage drying rate |
| Returned Residues | tdm | Stored Biomass × Residue Recycling Rate | |
| Total Processing Emissions | gCO2eq | (N2 Emissions × Stored Biomass) + (Electricity Emissions Factor × Electricity Input × Stored Biomass) | |
| Processed Biomass | t | Stored Biomass × (Processing + (Processing × TRL Efficiency)) | |
| Produced Biofuel | t | Transported Processed Biomass × (Conversion + (Conversion × TRL Efficiency)) | |
| Energy Input | MJ | (Stored Biomass × Electricity Input) + (Produced Biofuel × Electricity Energy Input) + (Produced Biofuel × Heat Energy Input × Heat Energy Content 2) | |
| Co-location Surplus Electricity | MJ | (Processed Biomass × Processing Electricity Output) × Industrial Co-Location Factor | |
| Co-location Surplus Heat | MJ | (Processing Heat Output × Processed Biomass × Heat Energy Content) × Industrial Co-Location Factor | |
| Energy Emissions Savings | gCO2eq | (Co-Location Surplus Heat + Co-Location Surplus Electricity) × Composite Electricity and Heat Emissions Factor | |
| Total Conversion Emissions | gCO2eq | ((Electricity Emissions Rate × Electricity Energy Input × Produced Biofuel) + (Heat Emissions Rate × Heat Energy Input × Produced Biofuel) + (Hydrogen Emissions Rate × Hydrogen Energy Input × Biofuel Energy)) − Energy Emissions Savings | |
| Conversion and Processing Emissions | gCO2eq/ MJ | (Total Conversion Emissions + Total Processing Emissions)/Biofuel Energy | |
| Consumption Emissions Savings | Biofuel at Fuelling Stations | t | Transported Biofuel |
| Total Avoided Fossil Fuel Volume | m3 | ((Biofuel at Fuelling Station × Fossil Fuel Density)/Biofuel Density)/Fossil Fuel Density | |
| Total Avoided Fossil Fuel Consumption Emissions | gCO2eq | VC1: (Fossil Fuel Combustion CO2 Emissions Factor × Total Avoided Fossil Fuel Volume) + (Fossil Fuel N2O Emissions Factor × Total Avoided Fossil Fuel Volume) + (Fossil Fuel CH4 Emissions Factor × Total Avoided Fossil Fuel Volume) VC2: (Fossil Fuel Combustion CO2 Emissions Factor × Total Avoided Fossil Fuel Volume) + (Fossil Fuel N2O Emissions Factor × Total Avoided Fossil Fuel Volume) | |
| Avoided Fossil Fuel Energy Comparator | MJ | ((Biofuel at Fuelling Station × Fossil Fuel Energy Content)/Biofuel Energy Content) × Fossil Fuel Energy Content | |
| Biofuel Energy | MJ | Biofuel at Fuelling Station × Biofuel Energy Content | |
| Biofuel Emissions | gCO2eq | (Biofuel at Fuelling Station/Biofuel Density) × Biofuel Consumption Emissions Factor | |
| Biofuel Consumption Emissions | gCO2eq/MJ | Biofuel Emissions/Biofuel Energy | |
| Consumption Emissions Savings | gCO2eq/ MJ | Avoided Fossil Fuel Consumption Emissions − Biofuel Consumption Emissions | |
| Energy Balance | (Biomass Energy + Energy Input + Fuel Energy + Fuel Input)/Biofuel Energy | ||
| Total Value Chain Emissions | gCO2eq/MJ | (Conversion and Processing Emissions + Transport Emissions + Emissions from Carbon Stock Changes + Cultivation and Extraction Emissions) − Consumption Emissions Savings | |
References
- Slade, R.; Bauen, A.; Gross, R. Prioritising the best use of biomass resources: Conceptualising trade-offs. In Proceedings of the Bioten Conference on Biomass, Bioenergy and Biofuels 2010, Birmingham, UK, 21–23 September 2010; Bridgwater, A.V., Ed.; CPL: Newbury, UK, 2011. ISBN 9781872691541. [Google Scholar]
- Bennich, T.; Belyazid, S.; Kopainsky, B.; Diemer, A. Understanding the Transition to a Bio-Based Economy: Exploring Dynamics Linked to the Agricultural Sector in Sweden. Sustainability 2018, 10, 1504. [Google Scholar] [CrossRef] [Green Version]
- Lewandowski, I. Securing a sustainable biomass supply in a growing bioeconomy. Glob. Food Secur. 2015, 6, 34–42. [Google Scholar] [CrossRef]
- Harris, Z.M.; Alberti, G.; Viger, M.; Jenkins, J.R.; Rowe, R.; McNamara, N.P.; Taylor, G. Land-use change to bioenergy: Grassland to short rotation coppice willow has an improved carbon balance. GCB Bioenergy 2017, 9, 469–484. [Google Scholar] [CrossRef]
- NASA. Available online: https://climate.nasa.gov/evidence/ (accessed on 20 December 2021).
- Singh, A.; Christensen, T.; Panoutsou, C. Policy review for biomass value chains in the European bioeconomy. Glob. Transit. 2020, 3, 13–42. [Google Scholar] [CrossRef]
- Sterman, J.D. Business Dynamics, System Thinking and Modeling for a Complex World; Massachusetts Institute of Technology, Engineering Systems Division: Cambridge, MA, USA, 2000. [Google Scholar]
- Hoffman, M.H.G. Cognitive conditions of diagrammatic reasoning. Semiotica 2011, 186, 189–212. [Google Scholar] [CrossRef]
- Saavedra, R.M.; Fontes, C.H.D.O.; Freires, F.G.M. Sustainable and renewable energy supply chain: A system dynamics overview. Renew. Sustain. Energy Rev. 2018, 82, 247–259. [Google Scholar] [CrossRef]
- Stave, K.A.; Kopainsky, B. A system dynamics approach for examining mechanisms and pathways of food supply vulnerability. J. Environ. Stud. Sci. 2015, 5, 321–336. [Google Scholar] [CrossRef] [Green Version]
- Torjai, L.; Nagy, J.; Bai, A. Decision hierarchy, competitive priorities and indicators in large-scale ‘herbaceous biomass to energy’ supply chains. J. Biomass Bioenergy 2015, 80, 321–329. [Google Scholar] [CrossRef]
- Panoutsou, C.; Singh, A.; Christensen, T.; Pelkmans, L. Competitive priorities to address optimisation in biomass value chains: The case of biomass CHP. Glob. Transit. 2020, 2, 60–75. [Google Scholar] [CrossRef]
- European Commission. Available online: http://data.europa.eu/eli/dir/2018/2001/oj (accessed on 20 December 2021).
- Mai-Moulin, T.; Hoefnagels, R.; Grundmann, P.; Junginger, M. Effective sustainability criteria for bioenergy: Towards the implementation of the european renewable directive II. Renew. Sustain. Energy Rev. 2021, 138, 110645. [Google Scholar] [CrossRef]
- Karka, P.; Johnsson, P.; Papadokonstantakis, S. Perspectives for Greening European Fossil-Fuel Infrastructures Through Use of Biomass: The Case of Liquid Biofuels Based on Lignocellulosic Resources. Front. Energy Res. 2021, 9, 636782. [Google Scholar] [CrossRef]
- Roni, M.S.; Eksioglu, S.D.; Cafferty, K.G.; Jacobson, J.J. A multi-objective, hub-and-spoke model to design and manage biofuel supply chains. Ann. Oper. Res. 2017, 249, 351–380. [Google Scholar] [CrossRef]
- Sarkar, B.; Mridha, B.; Pareek, S. A sustainable smart multi-type biofuel manufacturing with the optimum energy utilization under flexible production. J. Clean. Prod. 2021, 332, 129869. [Google Scholar] [CrossRef]
- Sarkar, B.; Mridha, B.; Pareek, S.; Sarkar, M.; Thangavelu, L. A flexible biofuel and bioenergy production system with transportation disruption under a sustainable supply chain network. J. Clean. Prod. 2021, 317, 128079. [Google Scholar] [CrossRef]
- Garai, A.; Chowdhury, S.; Sarkar, B.; Roy, T.K. Cost-effective subsidy policy for growers and biofuels-plants in closed-loop supply chain of herbs and herbal medicines: An interactive bi-objective optimization in T-environment. Appl. Soft Comput. 2020, 100, 106949. [Google Scholar] [CrossRef]
- Ramos-Hernández, R.; Sánchez-Ramírez, C.; Mota-López, D.R.; Sandoval-Salas, F.; García-Alcaraz, J.L. Evaluation of bioenergy potential from coffee pulp trough System Dynamics. Renew. Energy 2021, 165, 863–877. [Google Scholar] [CrossRef]
- Musango, J.K.; Brent, A.C.; Amigun, B.; Pretorius, L.; Müller, H. Technology sustainability assessment of biodiesel development in South Africa: A system dynamics approach. Energy 2011, 36, 6922–6940. [Google Scholar] [CrossRef]
- Vimmerstedt, L.; Bush, B.W.; Hsu, D.D.; Inman, D.; Peterson, S.O. Maturation of biomass-to-biofuels conversion technology pathways for rapid expansion of biofuels production: A system dynamics perspective. Biofuels Bioprod. Biorefining 2014, 9, 158–176. [Google Scholar] [CrossRef] [Green Version]
- Barisa, A.; Romagnoli, F.; Blumberga, A.; Blumberga, D. Future biodiesel policy designs and consumption patterns in Latvia: A system dynamics model. J. Clean. Prod. 2015, 88, 71–82. [Google Scholar] [CrossRef]
- Liu, Y.; Zhao, R.; Wu, K.; Huang, T.; Chiu, A.S.F.; Cai, C. A Hybrid of Multi-Objective Optimization and System Dynamics Simulation for Straw-to-Electricity Supply Chain Management under the Belt and Road Initiatives. Sustainability 2018, 10, 868. [Google Scholar] [CrossRef] [Green Version]
- Jin, E.; Sutherland, J.W. An integrated sustainability model for a bioenergy system: Forest residues for electricity generation. Biomass Bioenergy 2018, 119, 10–21. [Google Scholar] [CrossRef]
- Bautista, S.; Espinoza, A.; Narvaez, P.; Camargo, M.; Morel, L. A system dynamics approach for sustainability assessment of biodiesel production in Colombia. Baseline simulation. J. Clean. Prod. 2019, 213, 1–20. [Google Scholar] [CrossRef]
- Kuo, T.C.; Lin, S.H.; Tseng, M.L.; Chiu, A.S.F.; Hsu, C.W. Biofuels for vehicles in Taiwan: Using system dynamics modeling to evaluate government subsidy policies. Resour. Conserv. Recycl. 2019, 145, 31–39. [Google Scholar] [CrossRef]
- Peterson, S.; Bush, B.; Inman, D.; Newes, E.; Schwab, A.; Stright, D.; Vimmerstedt, L. Lessons from a large-scale systems dynamics modeling project: The example of the biomass scenario model. Syst. Dyn. Rev. 2019, 35, 55–69. [Google Scholar] [CrossRef] [Green Version]
- Khoddami, S.; Mafakheri, F.; Zeng, Y. A System Dynamics Approach to Comparative Analysis of Biomass Supply Chain Coordination Strategies. Energies 2021, 14, 2808. [Google Scholar] [CrossRef]
- Trujillo-Mata, A.; Cortés-Robles, G.; Sánchez-Ramírez, C.; Blanco-Fernández, J.; Jiménez-Macías, E. System dynamics for the water footprint assessment and simulation in the bioethanol production. Int. J. Simul. Process Model. 2018, 13, 355–363. [Google Scholar] [CrossRef]
- Zhao, R.; Liu, Y.; Zhang, Z.; Guo, S.; Tseng, M.; Wu, K. Enhancing Eco-Efficiency of Agro-Products’ Closed-Loop Supply Chain under the Belt and Road Initiatives: A System Dynamics Approach. Sustainability 2018, 10, 668. [Google Scholar] [CrossRef] [Green Version]
- Zahraee, S.M.; Golroudbary, S.R.; Shiwatoki, N.; Kraslawski, A.; Stasinopoulos, P. An investigation of the environmental sustainability of palm biomass supply chains via dynamic simulation modeling: A case of Malaysia. J. Clean. Prod. 2019, 237, 117740. [Google Scholar] [CrossRef]
- de la Fuente, T.; Athanassiadis, D.; González-García, S.; Nordfjell, T. Cradle-to-gate life cycle assessment of forest supply chains: Comparison of Canadian and Swedish case studies. J. Clean. Prod. 2017, 143, 866–881. [Google Scholar] [CrossRef]
- Panoutsou, C.; Alexopoulou, E. Costs and Profitability of Crops for Bioeconomy in the EU. Energies 2020, 13, 1222. [Google Scholar] [CrossRef] [Green Version]
- Clifton-Brown, J.; Harfouche, A.; Casler, M.D.; Dylan Jones, H.; Macalpine, W.J.; Murphy-Bokern, D.; Smart, L.B.; Adler, A.; Ashman, C.; Awty-Carroll, D.; et al. Breeding progress and preparedness for mass-scale deployment of perennial lignocellulosic biomass crops switchgrass, miscanthus, willow and poplar. GCB Bioenergy 2019, 11, 118–151. [Google Scholar] [CrossRef] [PubMed] [Green Version]
- Lask, J.; Wagner, M.; Trindade, L.M.; Lewandowski, I. Life cycle assessment of ethanol production from miscanthus: A comparison of production pathways at two European sites. GCB Bioenergy 2019, 11, 269–288. [Google Scholar] [CrossRef] [Green Version]
- Panoutsou, C.; Chiaramonti, D. Socio-Economic Opportunities from Miscanthus Cultivation in Marginal Land for Bioenergy. Energies 2020, 13, 2741. [Google Scholar] [CrossRef]
- ADVANCEFUEL. Available online: http://www.advancefuel.eu/contents/reports/d42-sustainability-criteria-and-certification-for-ligno.pdf (accessed on 20 December 2021).
- Doran, G.T. There’s a S.M.A.R.T. way to write management’s goals and objectives. Manag. Rev. 1981, 70, 35–36. [Google Scholar]
- European Commission. Available online: https://eur-lex.europa.eu/legal-content/EN/ALL/?uri=PI_COM:C(2019)2055 (accessed on 20 December 2021).
- European Commission. Available online: https://eur-lex.europa.eu/legal-content/EN/TXT/?uri=pi_com%3AAres%282019%29762855 (accessed on 20 December 2021).
- European Commission. Available online: https://eur-lex.europa.eu/legal-content/en/TXT/?uri=CELEX%3A52019DC0142 (accessed on 20 December 2021).
- Mankins, J.C. Technology readiness assessments: A retrospective. Acta Astronaut. 2009, 65, 1216–1223. [Google Scholar] [CrossRef]
- Díaz-Garrido, E.; Martín-Peña, M.L.; Sanchez-Lopez, J.M. Competitive priorities in operations: Development of an indicator of strategic position. Int. J. Manuf. Sci. Technol. 2011, 4, 118–125. [Google Scholar] [CrossRef]
- Bertzky, M.; Kapos, V.; Scharlemann, J.P.W. Indirect Land Use Change from Biofuels Production: Implications for Biodiversity; JNCC: Peterborough, UK, 2011; p. 456.
- Steiner, J.J.; Lewis, K.C.; Baumes, H.S.; Brown, N.L.A. Feedstock readiness level tool to complement the aviation industry fuel readiness level tool. BioEnergy Res. 2012, 5, 492–503. [Google Scholar] [CrossRef] [Green Version]
- European Commission. Available online: https://eur-lex.europa.eu/LexUriServ/LexUriServ.do?uri=OJ:L:2010:151:0019:0041:EN:PDF (accessed on 20 December 2021).
- Panoutsou, C.; Germer, S.; Karka, P.; Papadokonstantakis, S.; Kroyan, Y.; Wojcieszyk, M.; Maniatis, K.; Marchand, P.; Landalv, I. Advanced biofuels to decarbonise European transport by 2030: Markets, challenges, and policies that impact their successful market uptake. Energy Strategy Rev. 2021, 34, 100633. [Google Scholar] [CrossRef]
- Dahmen, N.; Lewandowski, I.; Zibek, S.; Weidtmann, A. Integrated lignocellulosic value chains in a growing bioeconomy: Status quo and perspectives. GCB Bioenergy 2019, 11, 107–117. [Google Scholar] [CrossRef] [Green Version]
- de Jong, S.; Hoefnagels, R.; Wetterlund, E.; Pettersson, K.; Faaij, A.; Junginger, M. Cost optimization of biofuel production–The impact of scale, integration, transport and supply chain configurations. Appl. Energy 2017, 195, 1055–1070. [Google Scholar] [CrossRef] [Green Version]
- Johnson, T.V. Review of CO2 Emissions and Technologies in the Road Transportation Sector. SAE Int. J. Engines 2010, 3, 1079–1098. [Google Scholar] [CrossRef]
- Martinez-Moyano, I.J.; Richardson, G.P. Best practices in system dynamics modelling. Syst. Dyn. Rev. 2013, 29, 102–123. [Google Scholar] [CrossRef]
- Barlas, Y. Academics of system dynamics: Its core definition, topics and terminology. Int. J. Policy Modeling 1995, 7, 1–15. [Google Scholar]
- Gelfand, I.; Sahajpal, R.; Zhang, X.; Izaurralde, C.R.; Gross, K.I.; Robertson, G.P. Sustainable bioenergy production from marginal lands in the US Midwest. Nature 2013, 493, 514–517. [Google Scholar] [CrossRef] [PubMed]
- Follett, R.F.; Vogel, K.P.; Varvel, G.E.; Mitchell, R.B. Soil Carbon Sequestration by Switchgrass and No-Till Maize Grown for Bioenergy. BioEnergy Res. 2012, 5, 866–875. [Google Scholar] [CrossRef] [Green Version]
- de la Fuente, T.; González-García, S.; Athanassiadis, D.; Nordfjell, T. Fuel consumption and GHG emissions of forest biomass supply chains in Northern Sweden: A comparison analysis between integrated and conventional supply chains. Scand. J. For. Res. 2017, 32, 568–581. [Google Scholar] [CrossRef]
- Nie, Y.; Bi, X. Life-cycle assessment of transportation biofuels from hydrothermal liquefaction of forest residues in British Columbia. Biotechnol. Biofuels 2018, 11, 23. [Google Scholar] [CrossRef] [PubMed] [Green Version]
- Tsalidis, G.A.; Discha, F.E.; Korevaar, G.; Haije, W.; de Jong, W.; Kiel, J. An LCA-based evaluation of biomass to transportation fuel production and utilization pathways in a large port’s context. Int. J. Energy Environ. Eng. 2017, 8, 175–187. [Google Scholar] [CrossRef]
- Benavides, P.T.; Cronauer, D.C.; Adom, F.K.; Wang, Z.; Dunn, J.B. The influence of catalysts on biofuel life cycle analysis (LCA). Sustain. Mater. Technol. 2017, 11, 53–59. [Google Scholar] [CrossRef] [Green Version]
- Zetterholm, J.; Pettersson, K.; Leduc, S.; Mesfun, S.; Lundgren, J.; Wetterlund, E. Resource efficiency or economy of scale: Biorefinery supply chain configurations for co-gasification of black liquor and pyrolysis liquids. Appl. Energy 2018, 230, 912–924. [Google Scholar] [CrossRef]
- Cashman, S.A.; Moran, K.M.; Gaglione, A.G. Greenhouse Gas and Energy Life Cycle Assessment of Pine Chemicals Derived from Crude Tall Oil and Their Substitutes. J. Ind. Ecol. 2016, 20, 1108–1121. [Google Scholar] [CrossRef] [Green Version]
- Lewandowski, I.; Bahrs, E.; Dahmen, N.; Hirth, T.; Rausch, T.; Weidtmann, A. Biobased value chains for a growing bioeconomy. Glob. Change Biol. Bioenergy 2019, 11, 4–8. [Google Scholar] [CrossRef]
- Leban, V.; Malovrh, Š.P.; Stirn, L.Z.; Krč, J. Forest biomass for energy in multi-functional forest management: Insight into the perceptions of forest-related professionals. For. Policy Econ. 2016, 71, 87–93. [Google Scholar] [CrossRef]
- S2Biom. Available online: https://www.s2biom.eu/images/Events/10_Day2_S2Biom_Summer_School_Lammens_Matching_Tool.pdf (accessed on 20 December 2021).
- Bracco, S.; Tani, A.; Çalıcıoğlu, Ö.; Gomez San Juan, M.; Bogdanski, A. Indicators to Monitor and Evaluate the Sustainability of Bioeconomy. Overview and a Proposed Way Forward; Food and Agriculture Organization of the United Nations: Rome, Italy, 2019. [Google Scholar]
- Kroyan, Y.; Wojcieszyk, M.; Kaario, O.; Larmi, M.; Zenger, K. Modeling the end-use performance of alternative fuels in light-duty vehicles. Energy 2020, 205, 117854. [Google Scholar] [CrossRef]
- DeCicco, J.M.; Liu, D.Y.; Heo, J.; Krishnan, R.; Kurthen, A.; Wang, L. Carbon balance effects of U.S. biofuel production and use. Clim. Change 2016, 138, 667–680. [Google Scholar] [CrossRef] [Green Version]
- UPM. Available online: https://www.upm.com/news-and-stories/articles/2016/05/planning-fsc-certified-stands-for-harvesting-requires-a-keen-eye/ (accessed on 20 December 2021).
- Garai, A.; Sarkar, B. Economically independent reverse logistics of customer-centric closed-loop supply chain for herbal medicines and biofuel. J. Clean. Prod. 2021, 334, 129977. [Google Scholar] [CrossRef]
- González-García, S.; Bonnesoeur, V.; Pizzi, A.; Feijoo, G.; Moreira, M.T. The influence of forest management systems on the environmental impacts for Douglas-fir production in France. Sci. Total Environ. 2013, 461–462, 681–692. [Google Scholar] [CrossRef]
- SEEMLA. Available online: https://www.seemla.eu/project-deliverables/ (accessed on 20 December 2021).
- Millers, M.; Magaznieks, J.; Treija, S.; Skuja, I. Scots pine (Pinus sylvestris L.) stem wood and bark moisture and density influencing factors. In Proceedings of the Annual 18th International Scientific Conference Proceedings, Latvia University of Agriculture, Jelgava, Latvia, 16–18 May 2012. [Google Scholar]
- Laurila, J.; Lauhanen, R. Moisture content of Norway spruce stump wood at clear cutting areas and roadside storage sites. Silva Fenn. 2010, 44, 427–434. [Google Scholar] [CrossRef] [Green Version]
- Perić, M.; Komatina, M.; Antonijević, D.; Bugarski, B.; Dželetović, Ž. Life Cycle Impact Assessment of Miscanthus Crop for Sustainable Household Heating in Serbia. Forests 2018, 9, 654. [Google Scholar] [CrossRef] [Green Version]
- Nazli, R.I.; Tansi, V.; Öztürk, H.H.; Kusvuran, A. Miscanthus, switchgrass, giant reed, and bulbous canary grass as potential bioenergy crops in a semi-arid Mediterranean environment. Ind. Crops Prod. 2018, 125, 9–23. [Google Scholar] [CrossRef]
- Jäntti, T.; Parkkonen, R.; Kiuru, J. Foster Wheeler Advanced Bio CFB Technology–Kaukas 125 MWe CFB Design and Operation Experience. In Proceedings of the Power Gen Europe, Milan, Italy, 7–9 June 2011. [Google Scholar]
- Fazio, S.; Monti, A. Life Cycle Assessment of Different Bioenergy Production Systems Including Perennial and Annual Crops. Biomass Bioenergy 2011, 35, 4868–4878. [Google Scholar] [CrossRef]
- De Klein, C.; Novoa, R.; Ogle, S.; Smith, K.; Rochette, P.; Wirth, T.; McConkey, B.; Mosier, A.; Rypdal, K. N2O Emissions From Managed Soils, and CO2 Emissions From Lime and Urea Application. In Guidelines for National Greenhouse Gas Inventories; Calvo Buendia, E., Tanabe, K., Kranjc, A., Baasansuren, J., Fukuda, M., Ngarize, S., Osako, A., Pyrozhenko, Y., Shermanau, P., Federici, S., Eds.; Intergovernmental Panel on Climate Change (IPCC): Geneva, Switzerland, 2019; Volume 4. [Google Scholar]
- ArchNetwork. Available online: https://archnetwork.org/forest-management-in-finland/ (accessed on 20 December 2021).
- Zhang, F.; Johnson, D.M.; Wang, J. Life-Cycle Energy and GHG Emissions of Forest Biomass Harvest and Transport for Biofuel Production in Michigan. Energies 2015, 8, 3258–3271. [Google Scholar] [CrossRef] [Green Version]
- Handler, R.M.; Shonnard, D.R.; Kalnes, T.N.; Lupton, F.S. Life cycle assessment of algal biofuels: Influence of feedstock cultivation systems and conversion platforms. Algal Res. 2014, 4, 105–115. [Google Scholar] [CrossRef]
- METLA. Available online: http://www.metla.fi/julkaisut/workingpapers/2008/mwp100.htm (accessed on 20 December 2021).
- Palander, T.; Kärhä, K. Improving Energy Efficiency in a Synchronized Road-Transportation System by Using a TFMC (Transportation Fleet-Management Control) in Finland. Energies 2019, 12, 670. [Google Scholar] [CrossRef] [Green Version]
- Palander, T. The environmental emission efficiency of larger and heavier vehicles–A case study of road transportation in Finnish forest industry. J. Clean. Prod. 2017, 155, 57–62. [Google Scholar] [CrossRef]
- Sahoo, K.; Bilek, E.M.; Mani, S. Techno-economic and environmental assessments of storing woodchips and pellets for bioenergy applications. Renew. Sustain. Energy Rev. 2018, 98, 27–39. [Google Scholar] [CrossRef]
- Xanthopoulos, P. Building Bridges between Forestry & Chemistry: Support European Bio-Economy Programs. In Proceedings of the AgroBiotech Innovation Event Ourensen, Ourense, Spain, 26–27 November 2015. [Google Scholar]
- Van de Beld, B.; Muggen, G. EMPYRO: Implementation of a commercial scale fast pyrolysis plant in the Netherlands. In Proceedings of the 23rd European Biomass Conference and Exhibition, Vienna, Austria, 1–4 June 2015. [Google Scholar]
- Meier, D.; van de Beld, B.; Bridgwater, A.V.; Elliott, D.C.; Oasmaa, A.; Preto, F. State-of-the-art of fast pyrolysis in IEA bioenergy member countries. Renew. Sustain. Energy Rev. 2013, 20, 619–641. [Google Scholar] [CrossRef]
- Shemfe, M.B.; Whittaker, C.; Gu, S.; Fidalgo, B. Comparative evaluation of GHG emissions from the use of Miscanthus for bio-hydrocarbon production via fast pyrolysis and bio-oil upgrading. Appl. Energy 2016, 176, 22–33. [Google Scholar] [CrossRef] [Green Version]
- Fraunhofer UMSICHT. Available online: https://www.harrpa.eu/images/Publications/EU_CTO_Added_Value_Study_Fin.pdf (accessed on 20 December 2021).
- Ngcobo, N.C. Evaluating the Feasibility of Converting Crude Tall Oil and Tall Oil Fatty Acids into Biofuel. Master’s Thesis, Durban University of Technology, Durban, South Africa, 2011. [Google Scholar] [CrossRef]
- ADVANCEFUEL. Available online: http://www.advancefuel.eu/contents/reports/d45-final-2.pdf (accessed on 20 December 2021).
- ECOMETRICA. Available online: https://ecometrica.com/assets/Electricity-specific-emission-factors-for-grid-electricity.pdf (accessed on 20 December 2021).
- Environmental Protection Agency. Available online: https://www.epa.gov/sites/production/files/2020-04/documents/ghg-emission-factors-hub.pdf (accessed on 20 December 2021).
- Svenson, G. HCT trucks in Swedish forestry—Operational experiences. In Proceedings of the NB-NORD Meeting, Lappeenranta, Finland, 14–16 June 2017. [Google Scholar]
- Finnish Transport Safety Agency. Available online: https://silo.tips/download/report-on-summertime-high-capacity-transport-hct-2015 (accessed on 20 December 2021).
- European Association for Forwarding, Transport, Logistics and Customs Services (CLECAT). Available online: https://www.clecat.org/media/CLECAT_Guide_on_Calculating_GHG_emissions_for_freight_forwarding_and_logistics_services.pdf (accessed on 20 December 2021).
- UPM. Available online: www.upmbiofuels.com/products/upm-bioverno-diesel (accessed on 20 December 2021).
- European Environment Agency. Available online: https://www.eea.europa.eu/publications/emep-eea-guidebook-2019 (accessed on 20 December 2021).
- TNO. Available online: http://www.emissieregistratie.nl/erpubliek/documenten/Lucht%20(Air)/Verkeer%20en%20Vervoer%20(Transport)/Wegverkeer/TNO%20(2015)%20Composition%20and%20payload%20distribution%20of%20the%20on-road%20HD-fleet%20in%20NL.pdf (accessed on 20 December 2021).
- Pacific Northwest National Laboratory. Available online: https://www.pnnl.gov/main/publications/external/technical_reports/PNNL-23579.pdf (accessed on 20 December 2021).
- Environmental Protection Agency. Available online: https://nepis.epa.gov/Exe/ZyPURL.cgi?Dockey=P1001177.TXT (accessed on 20 December 2021).

Publisher’s Note: MDPI stays neutral with regard to jurisdictional claims in published maps and institutional affiliations. |
© 2022 by the authors. Licensee MDPI, Basel, Switzerland. This article is an open access article distributed under the terms and conditions of the Creative Commons Attribution (CC BY) license (https://creativecommons.org/licenses/by/4.0/).