
Comprehensive Analysis of the Pollutant Characteristics of Gasoline Vehicle Emissions under Different Engine, Fuel, and Test Cycles

 ,
,
Abstract
:1. Introduction
2. Materials and Methods
2.1. Test Fuel Types
2.2. Test Vehicle
2.3. Test Cycles
2.4. Instrumentation
2.5. Study Design of the Experiment
2.6. Data Quality Assurance
3. Results and Discussion
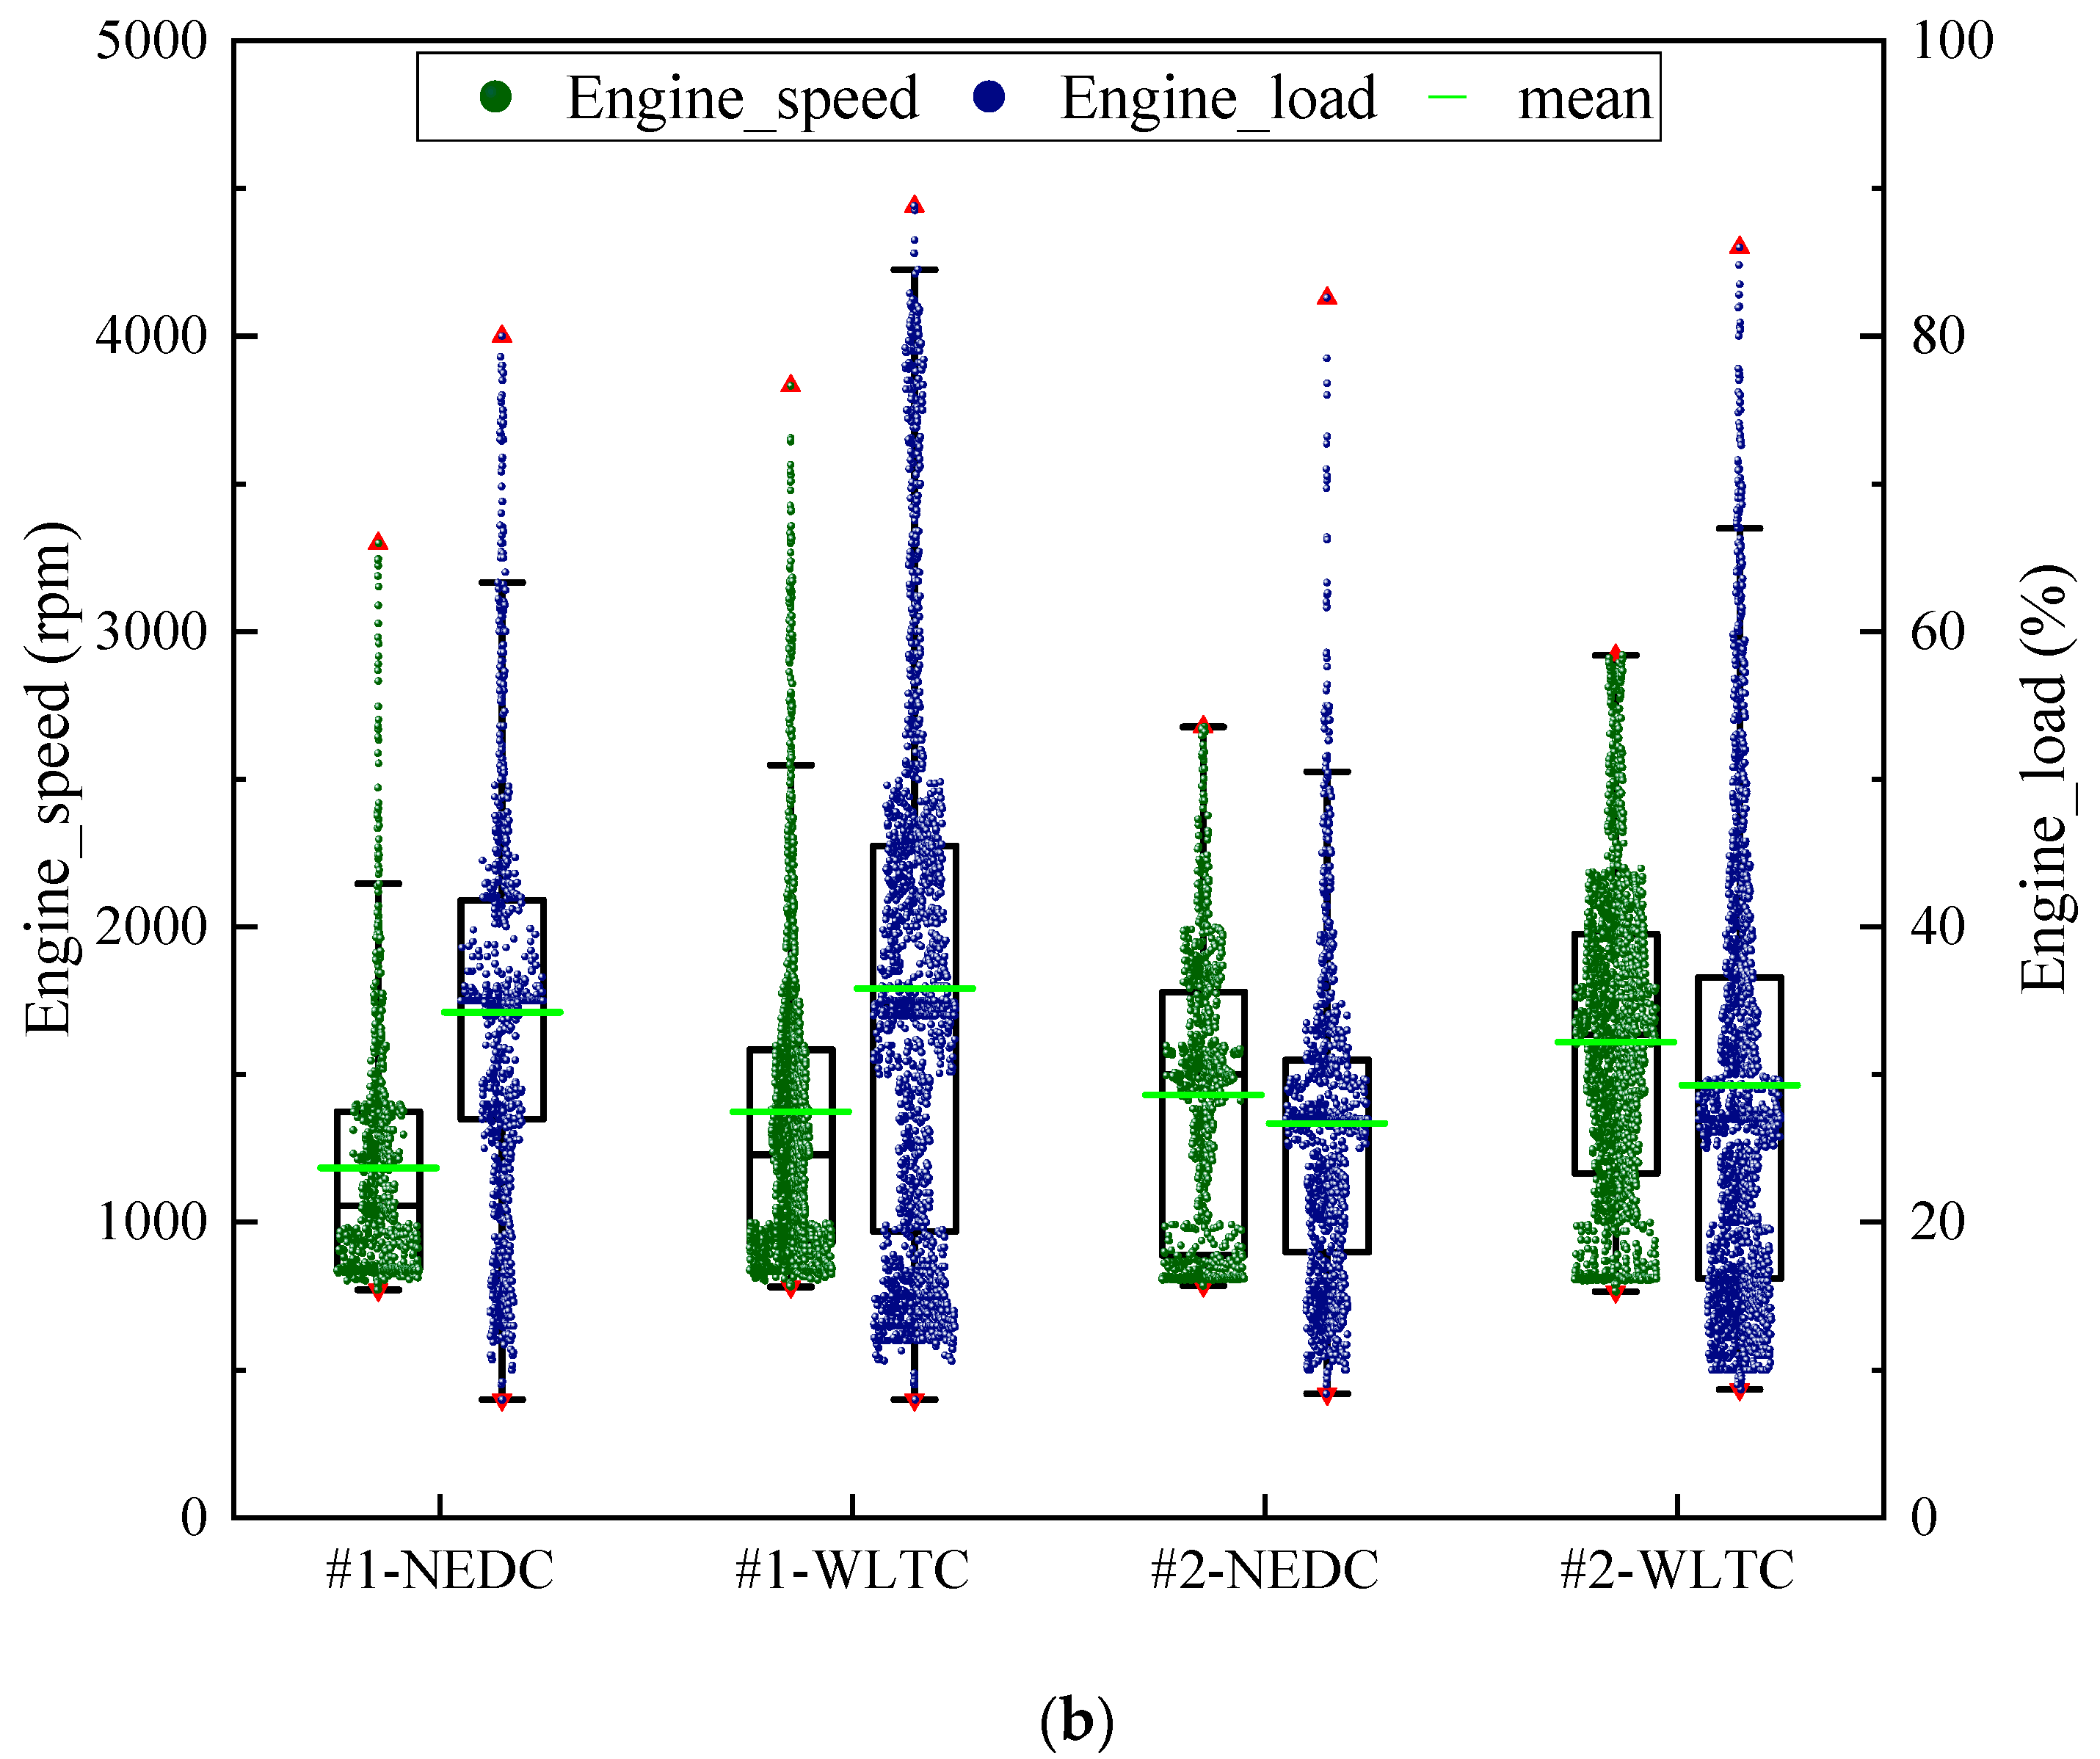
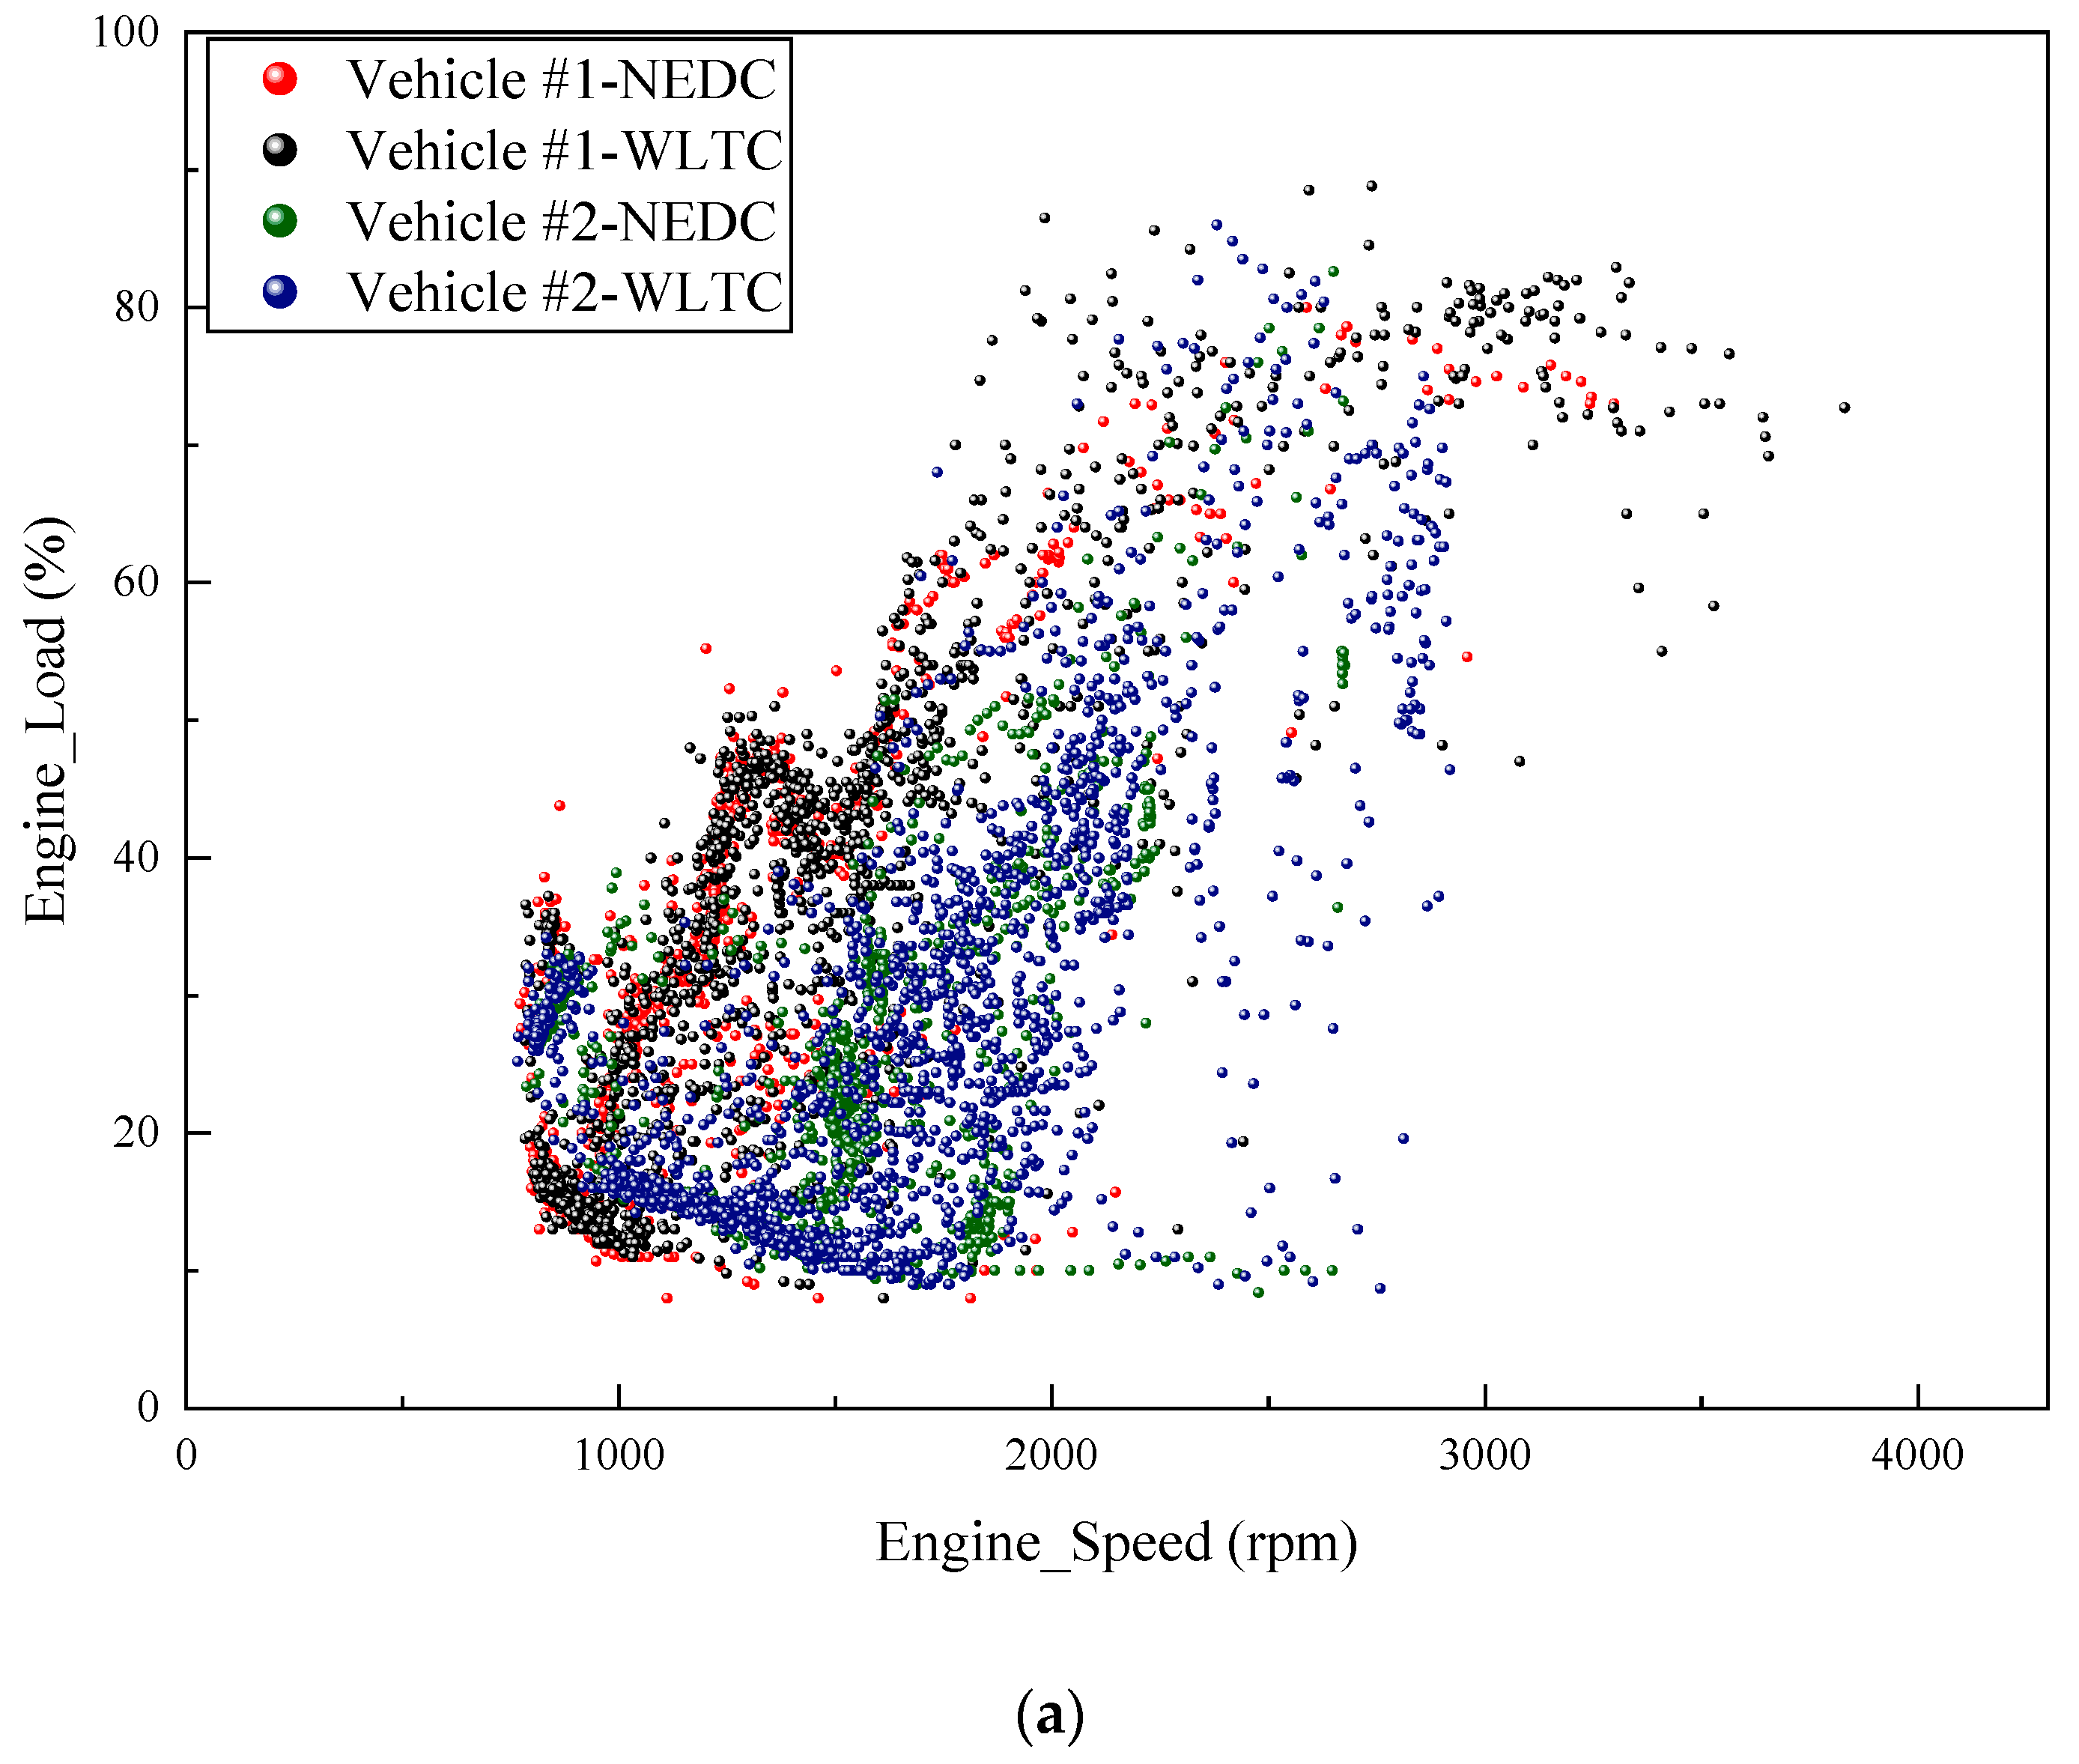
3.1. Engine Performance of the Test Vehicles
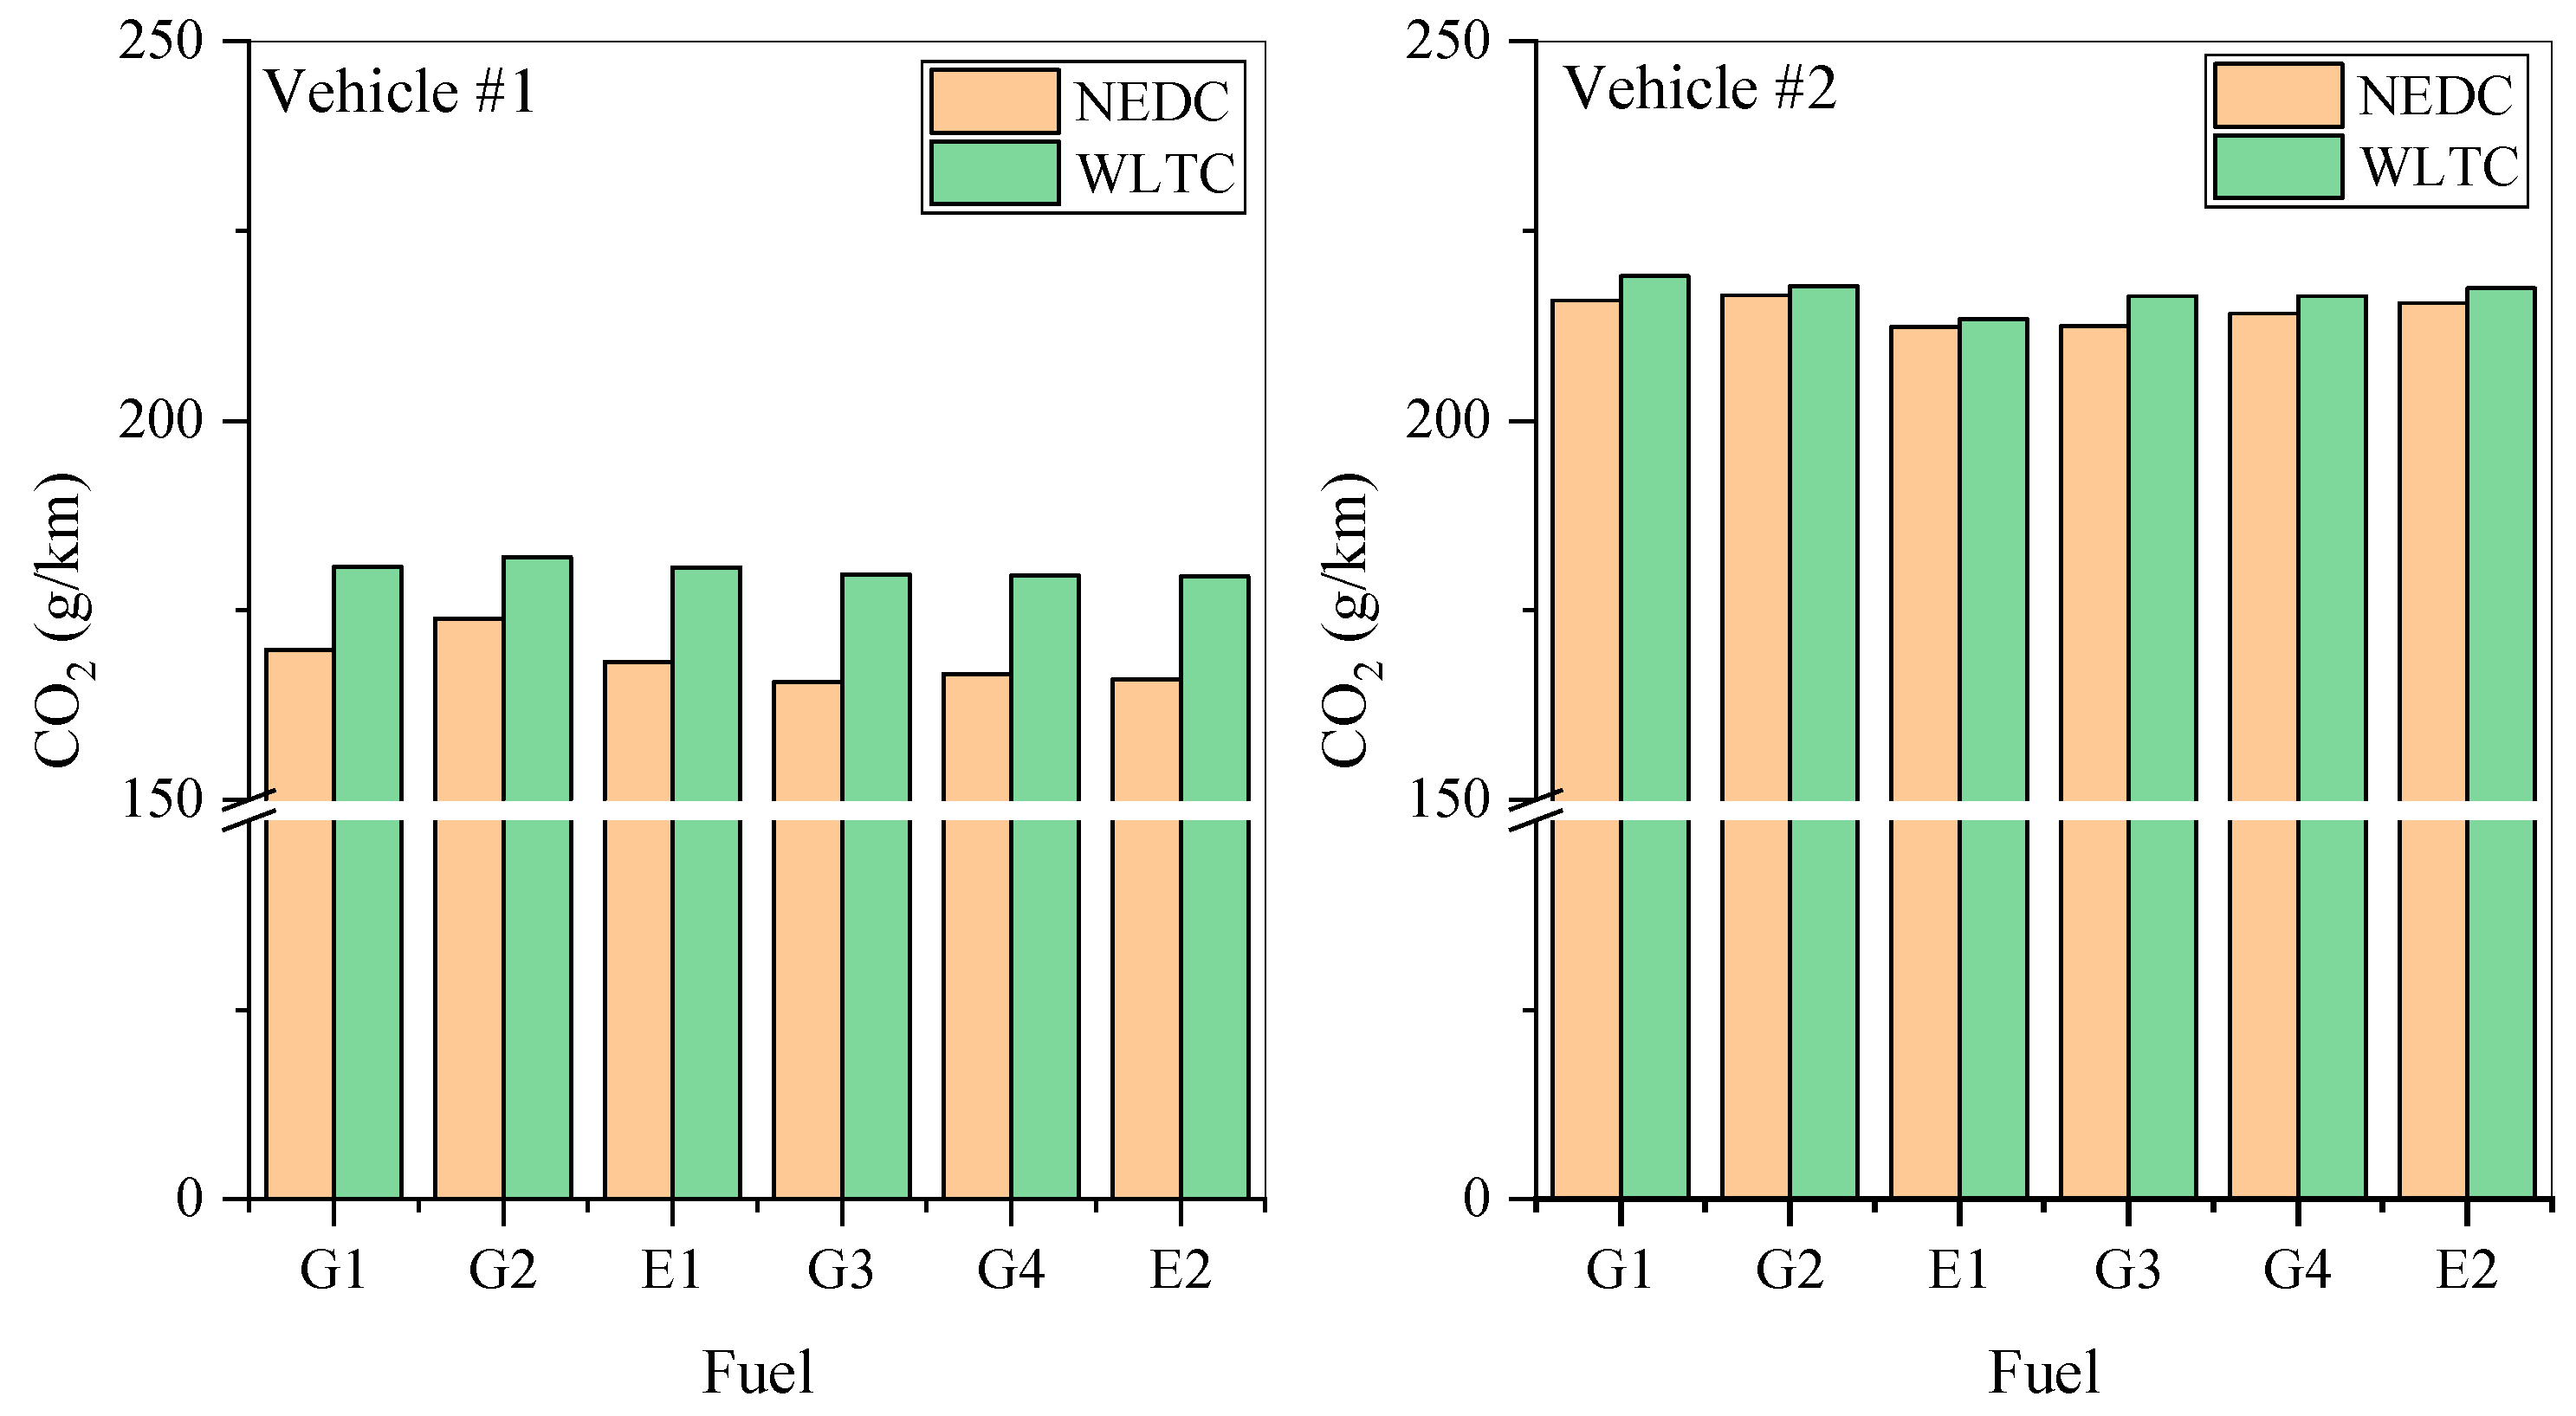
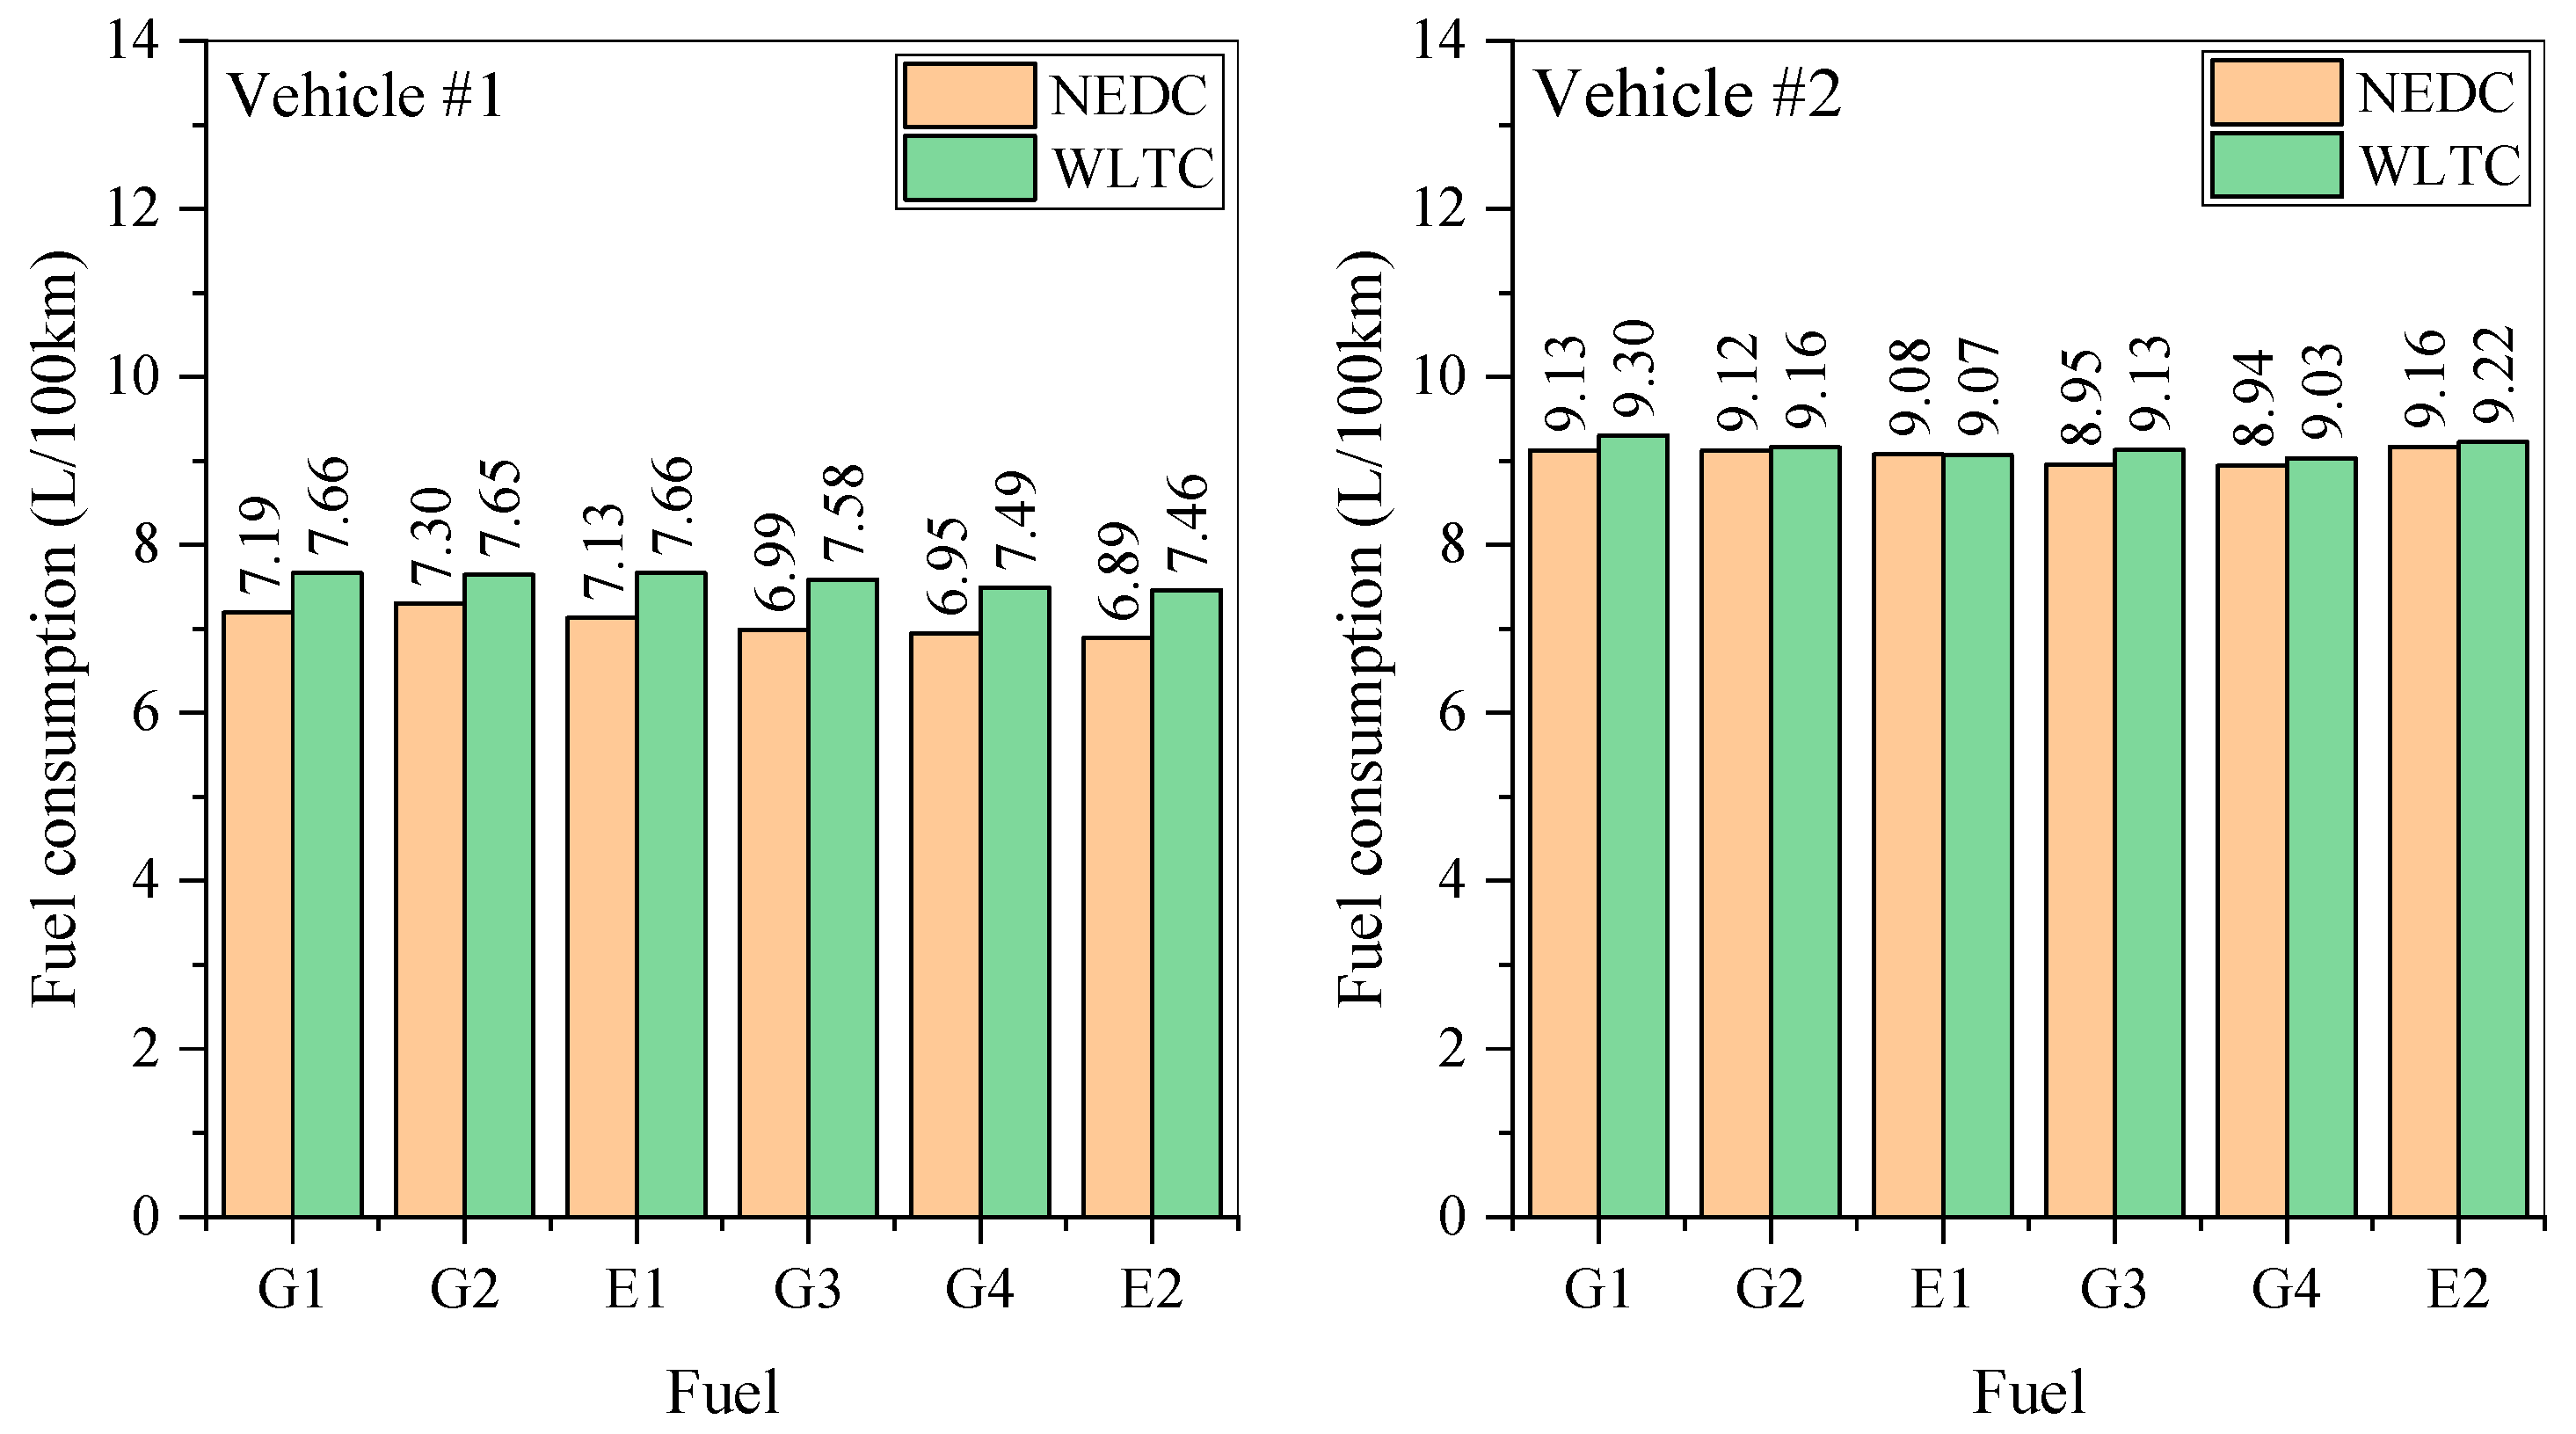
3.2. CO2 Emissions and Fuel Economy
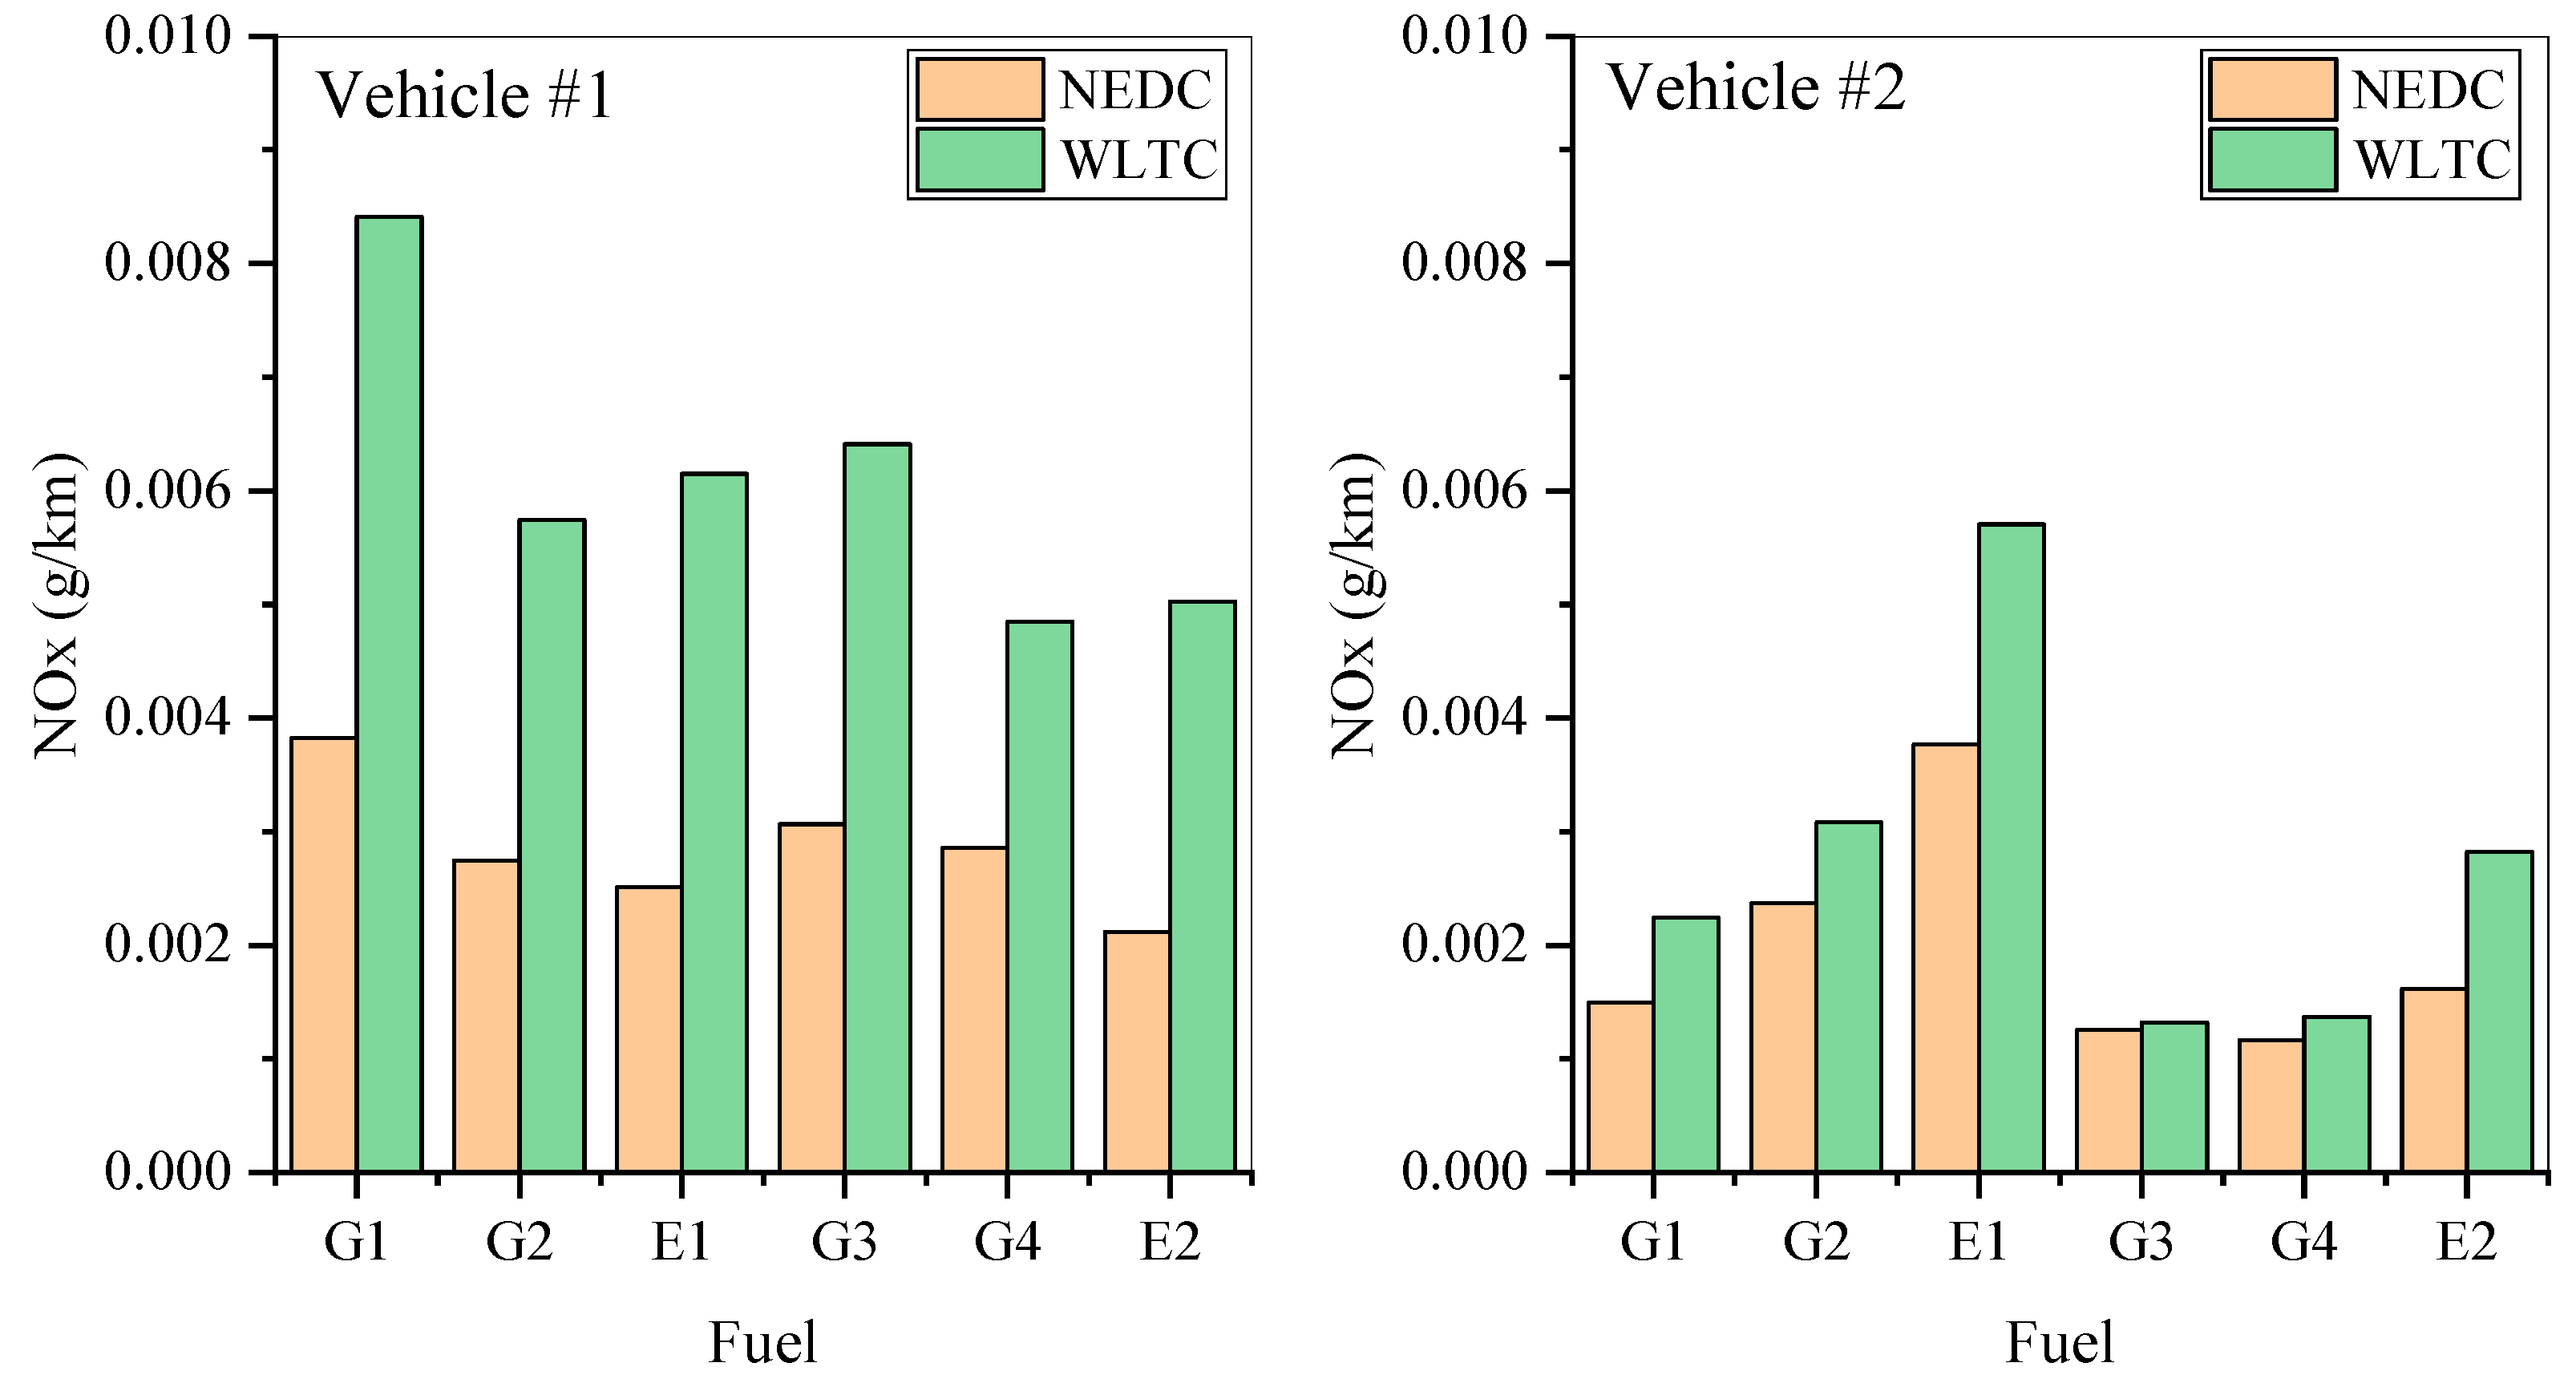
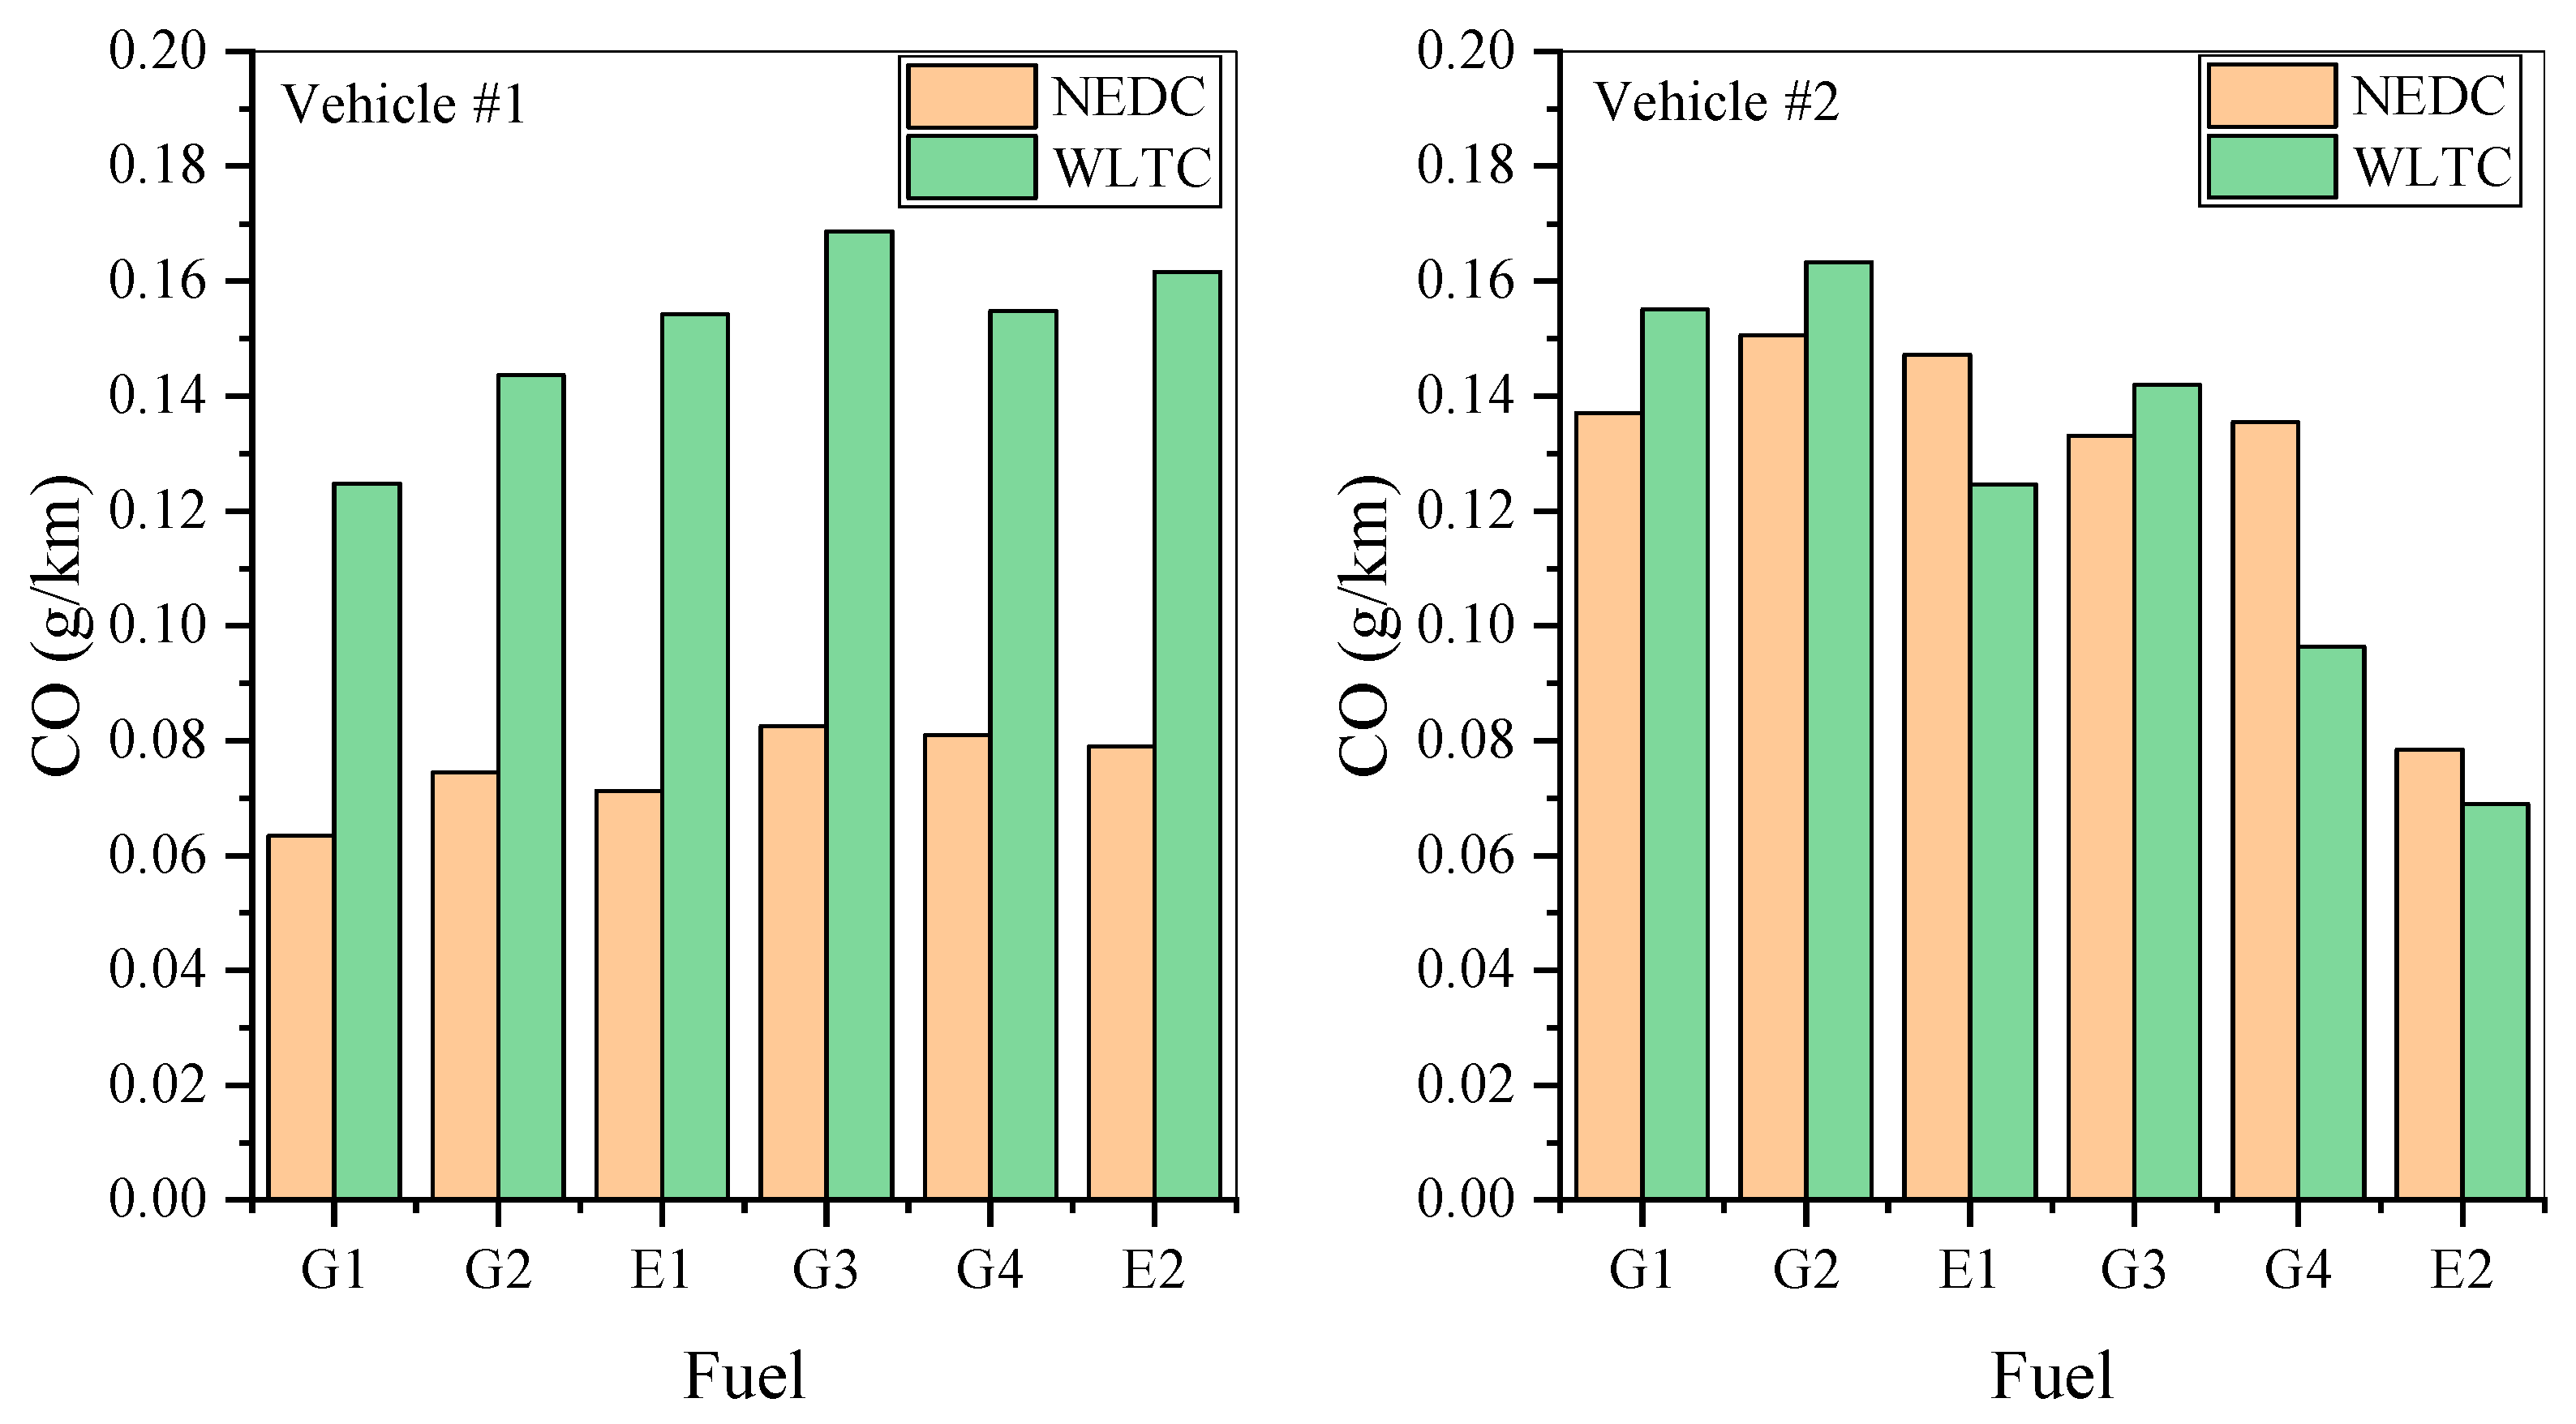
3.3. CO and NOx Emissions
3.4. Particle Number Emissions
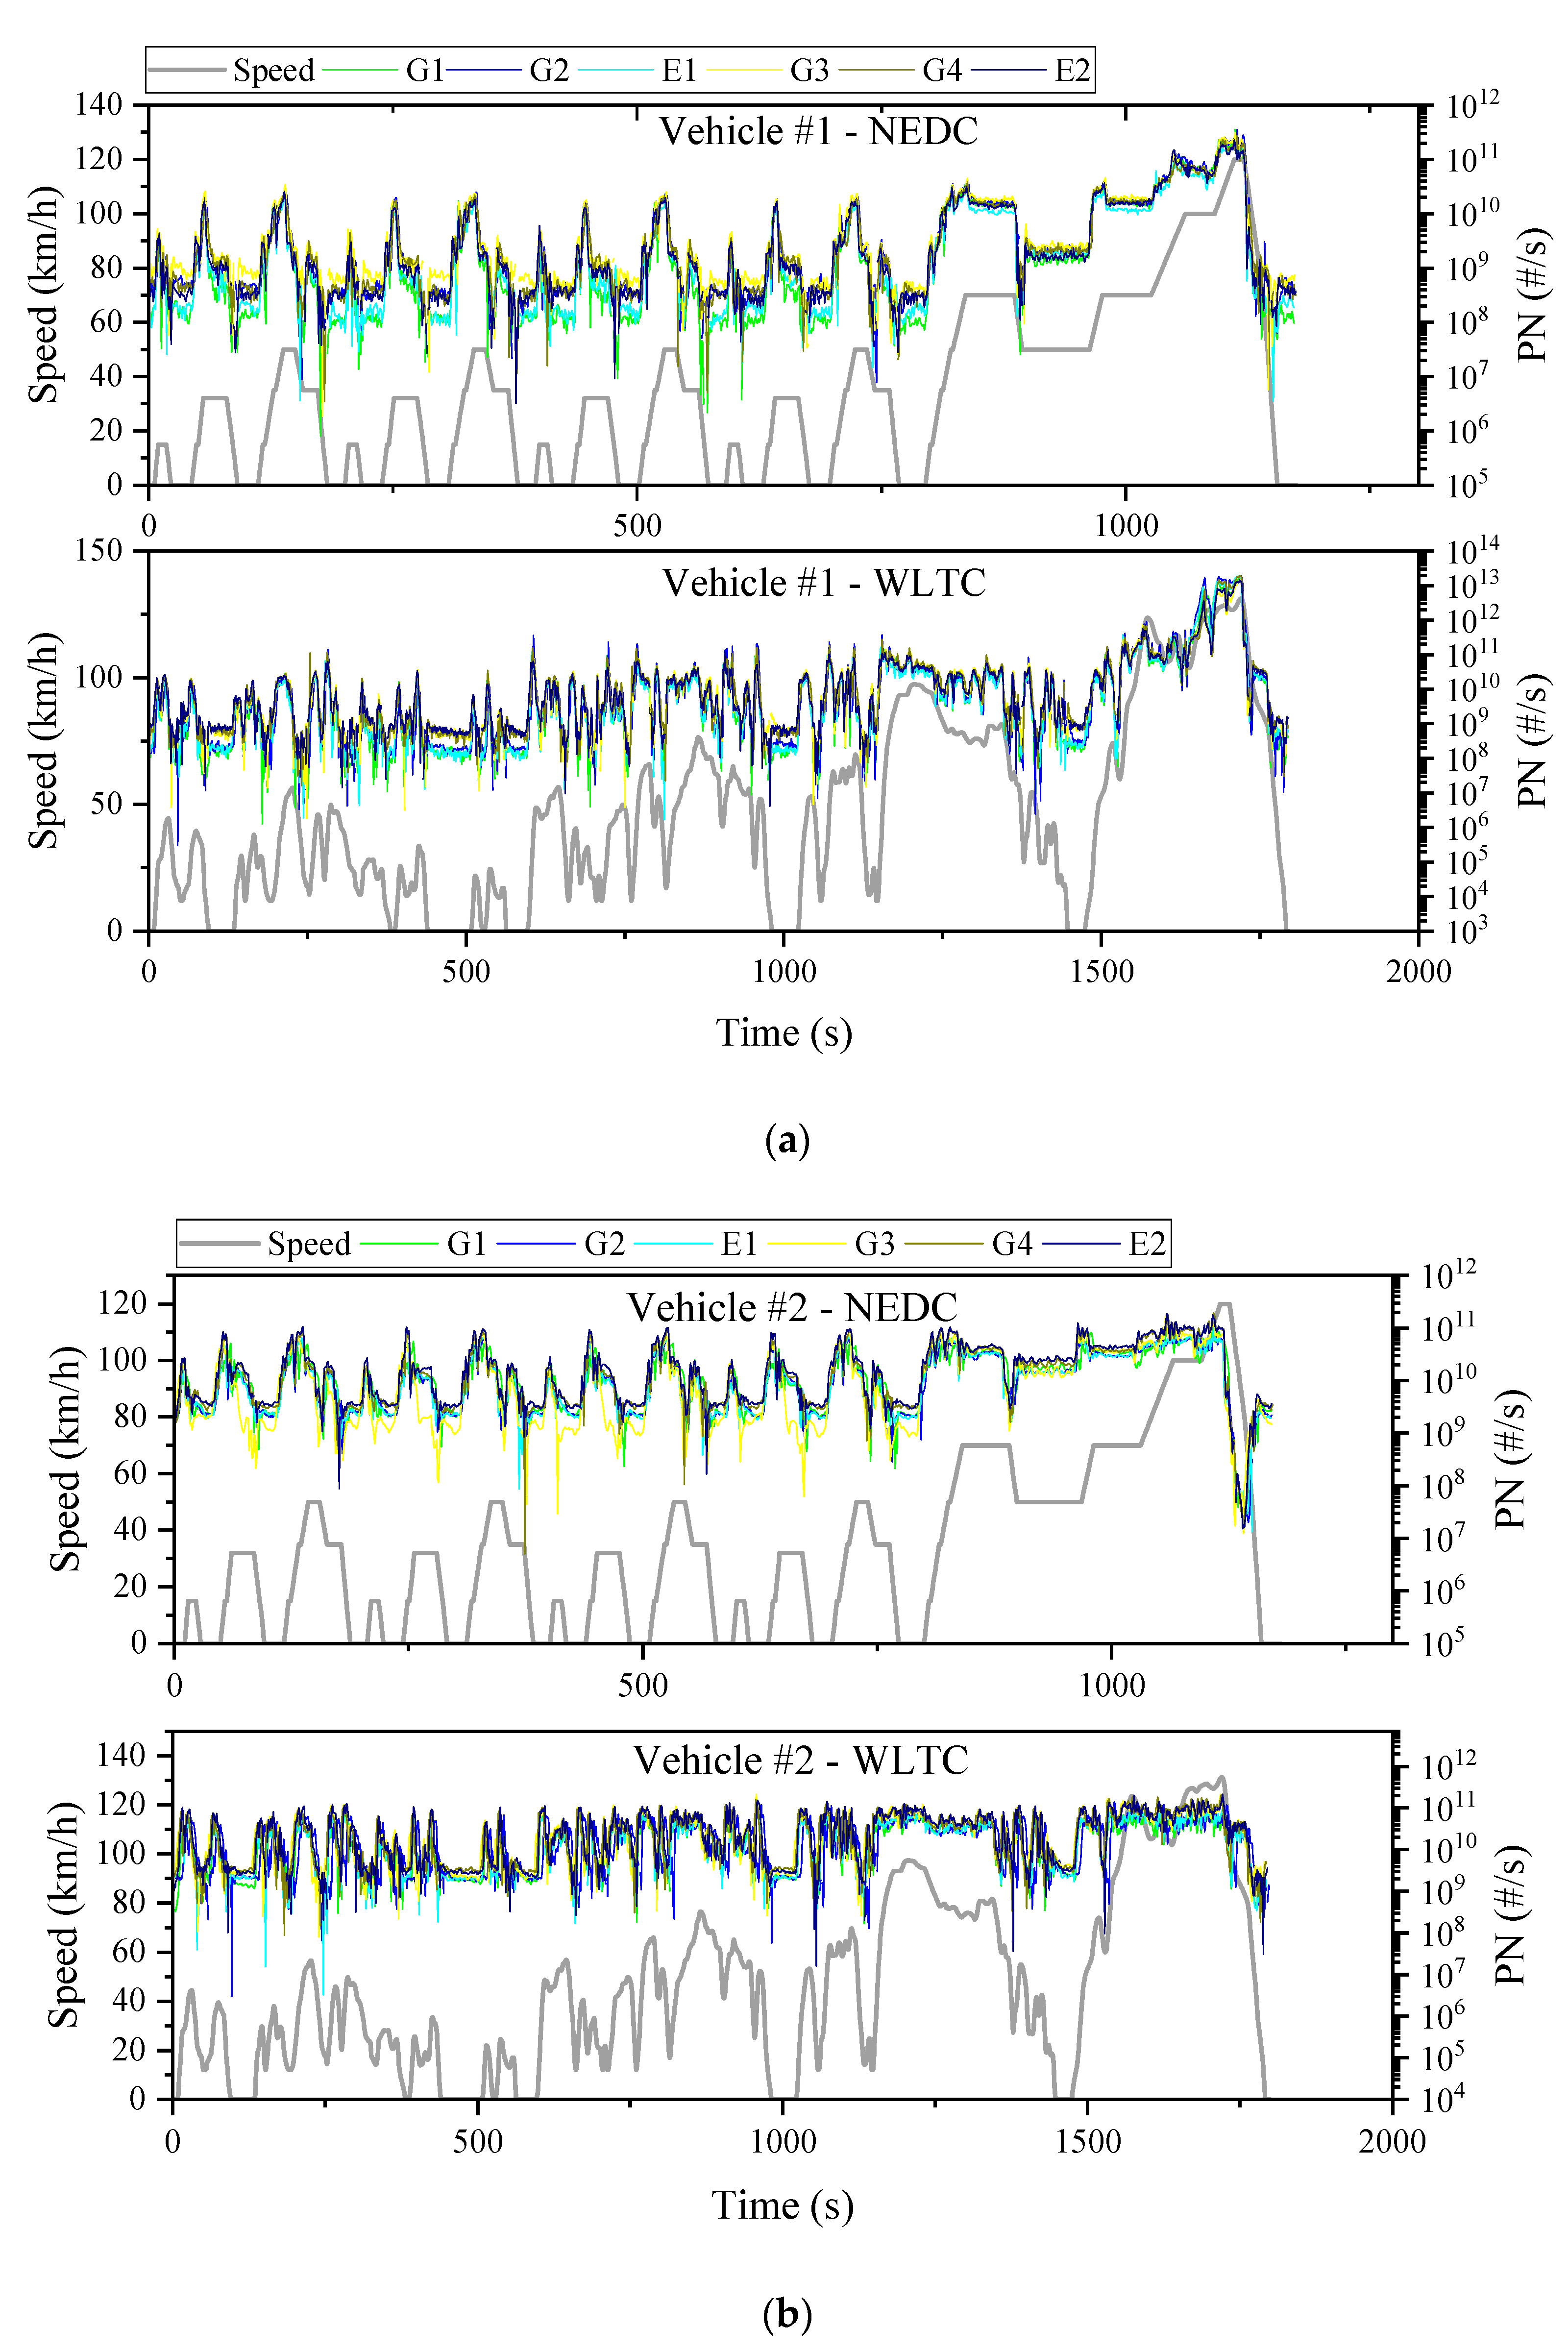
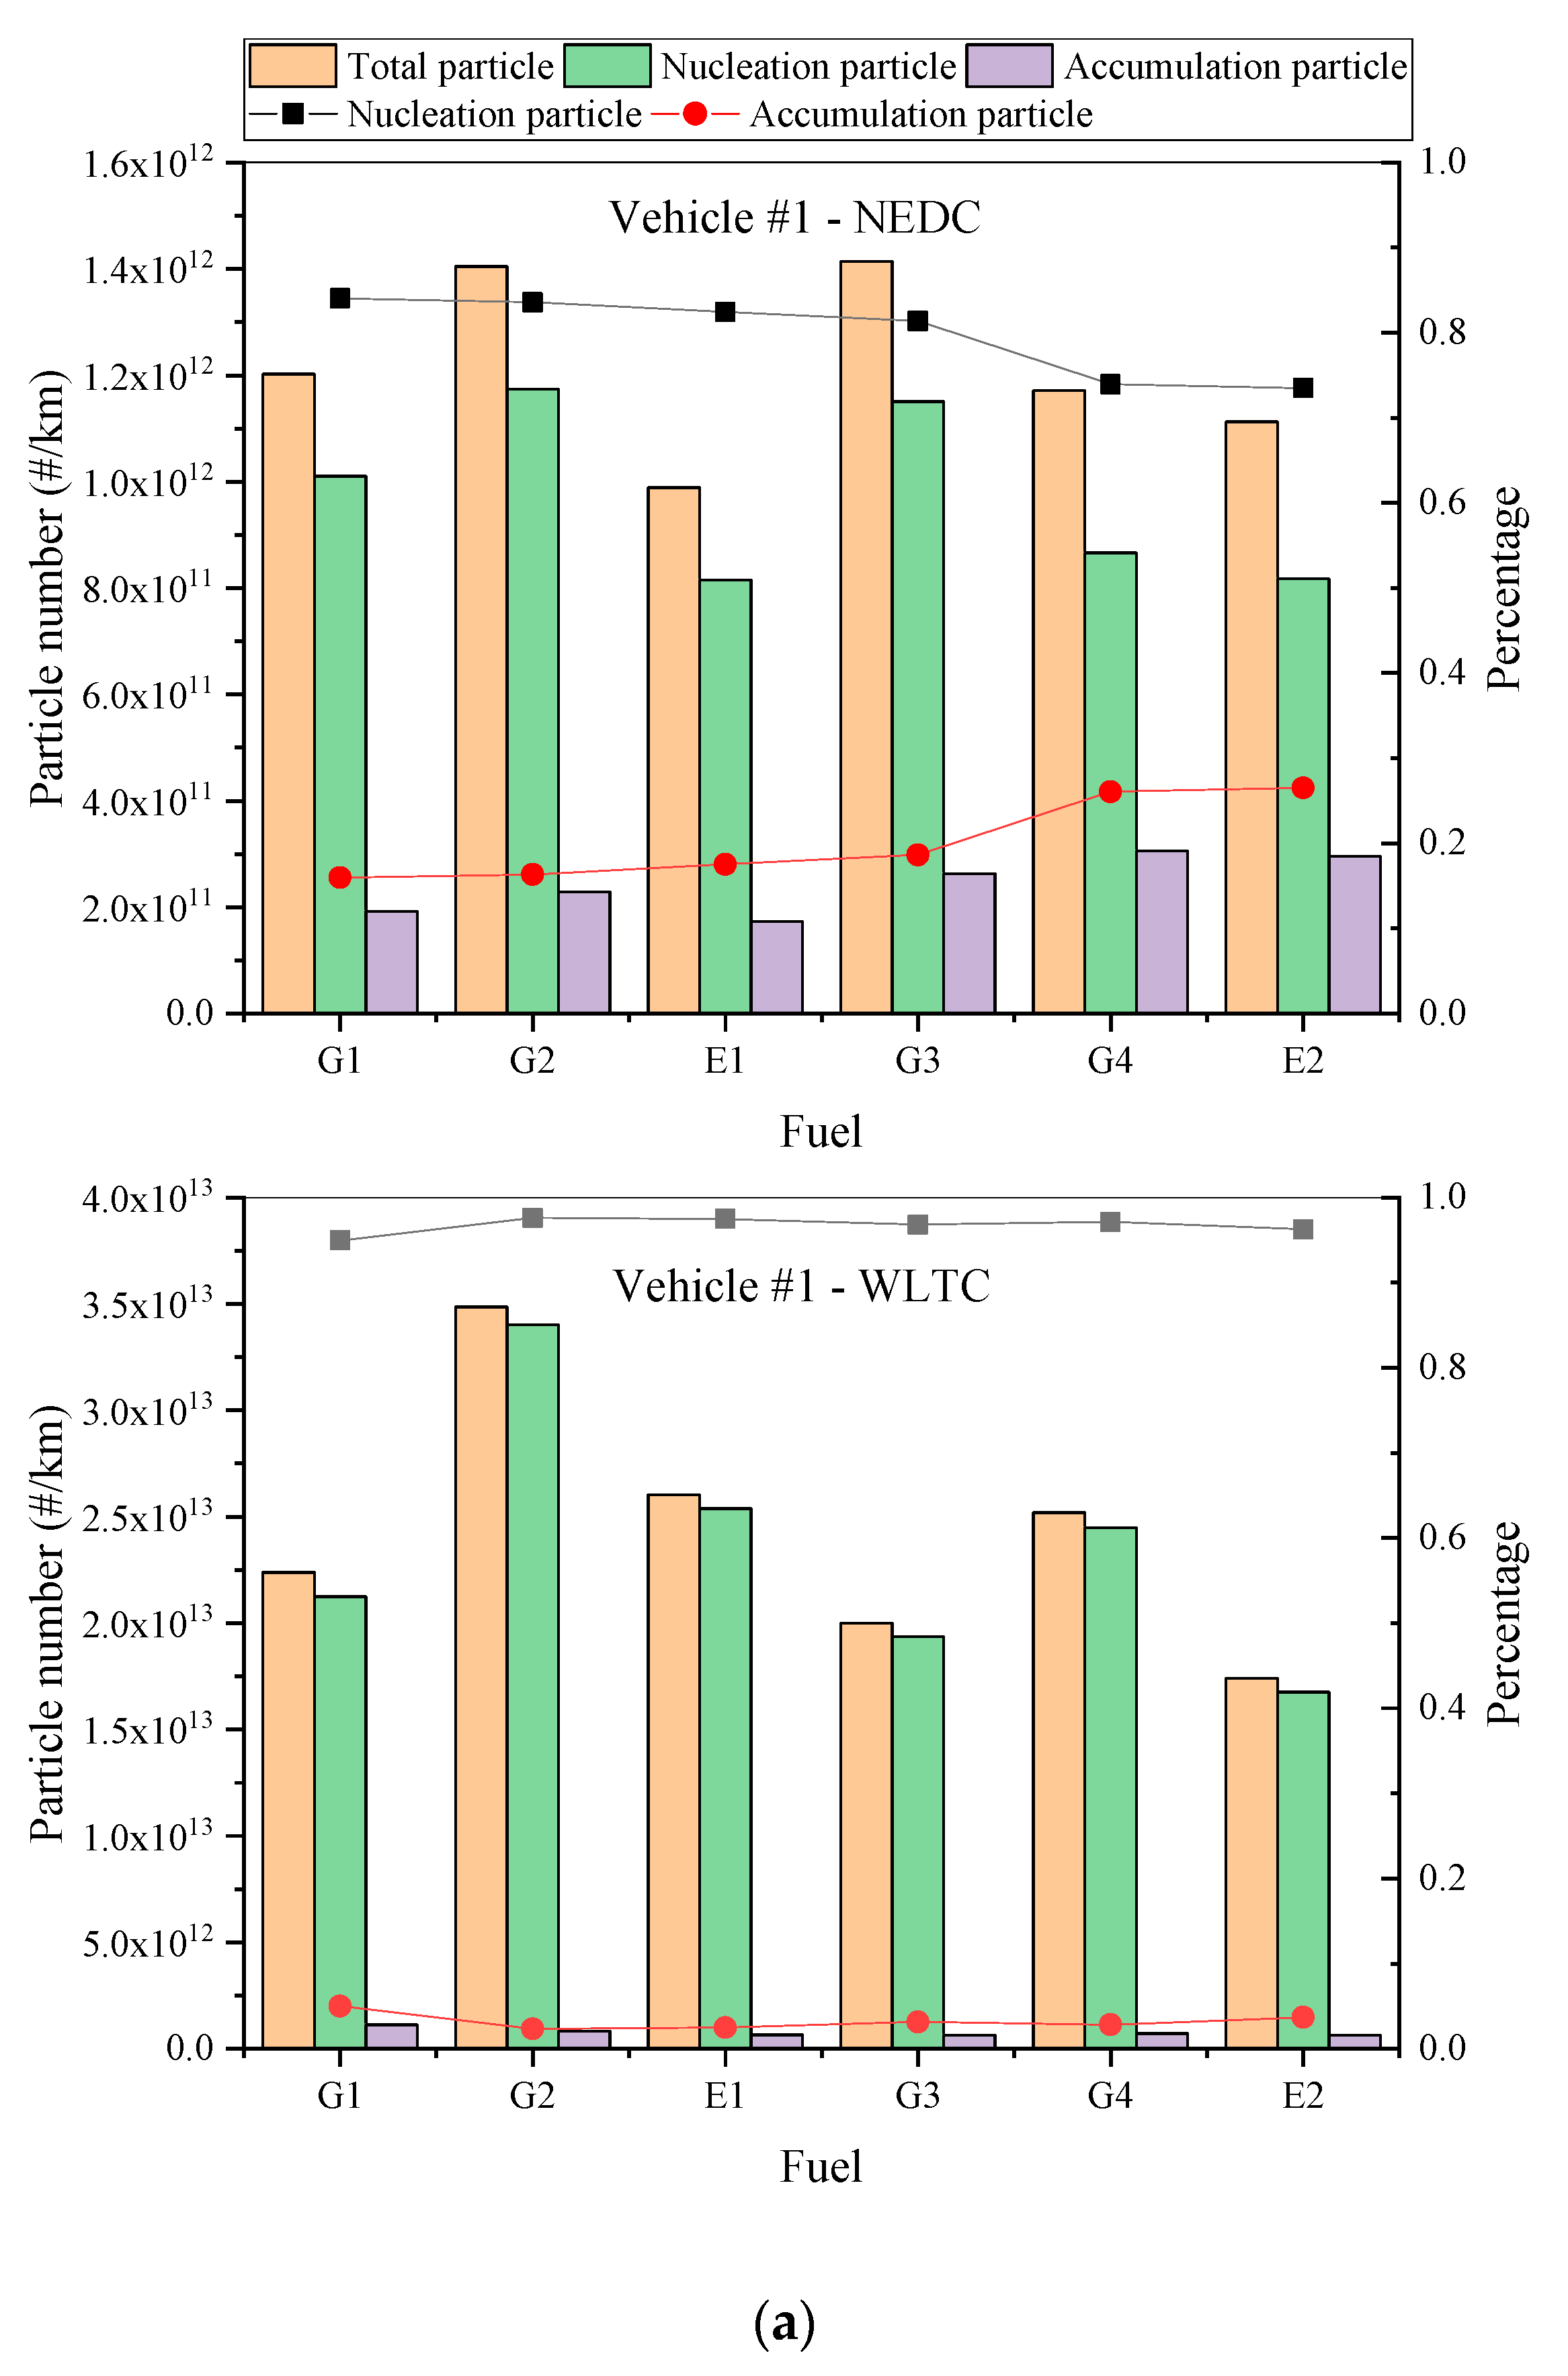
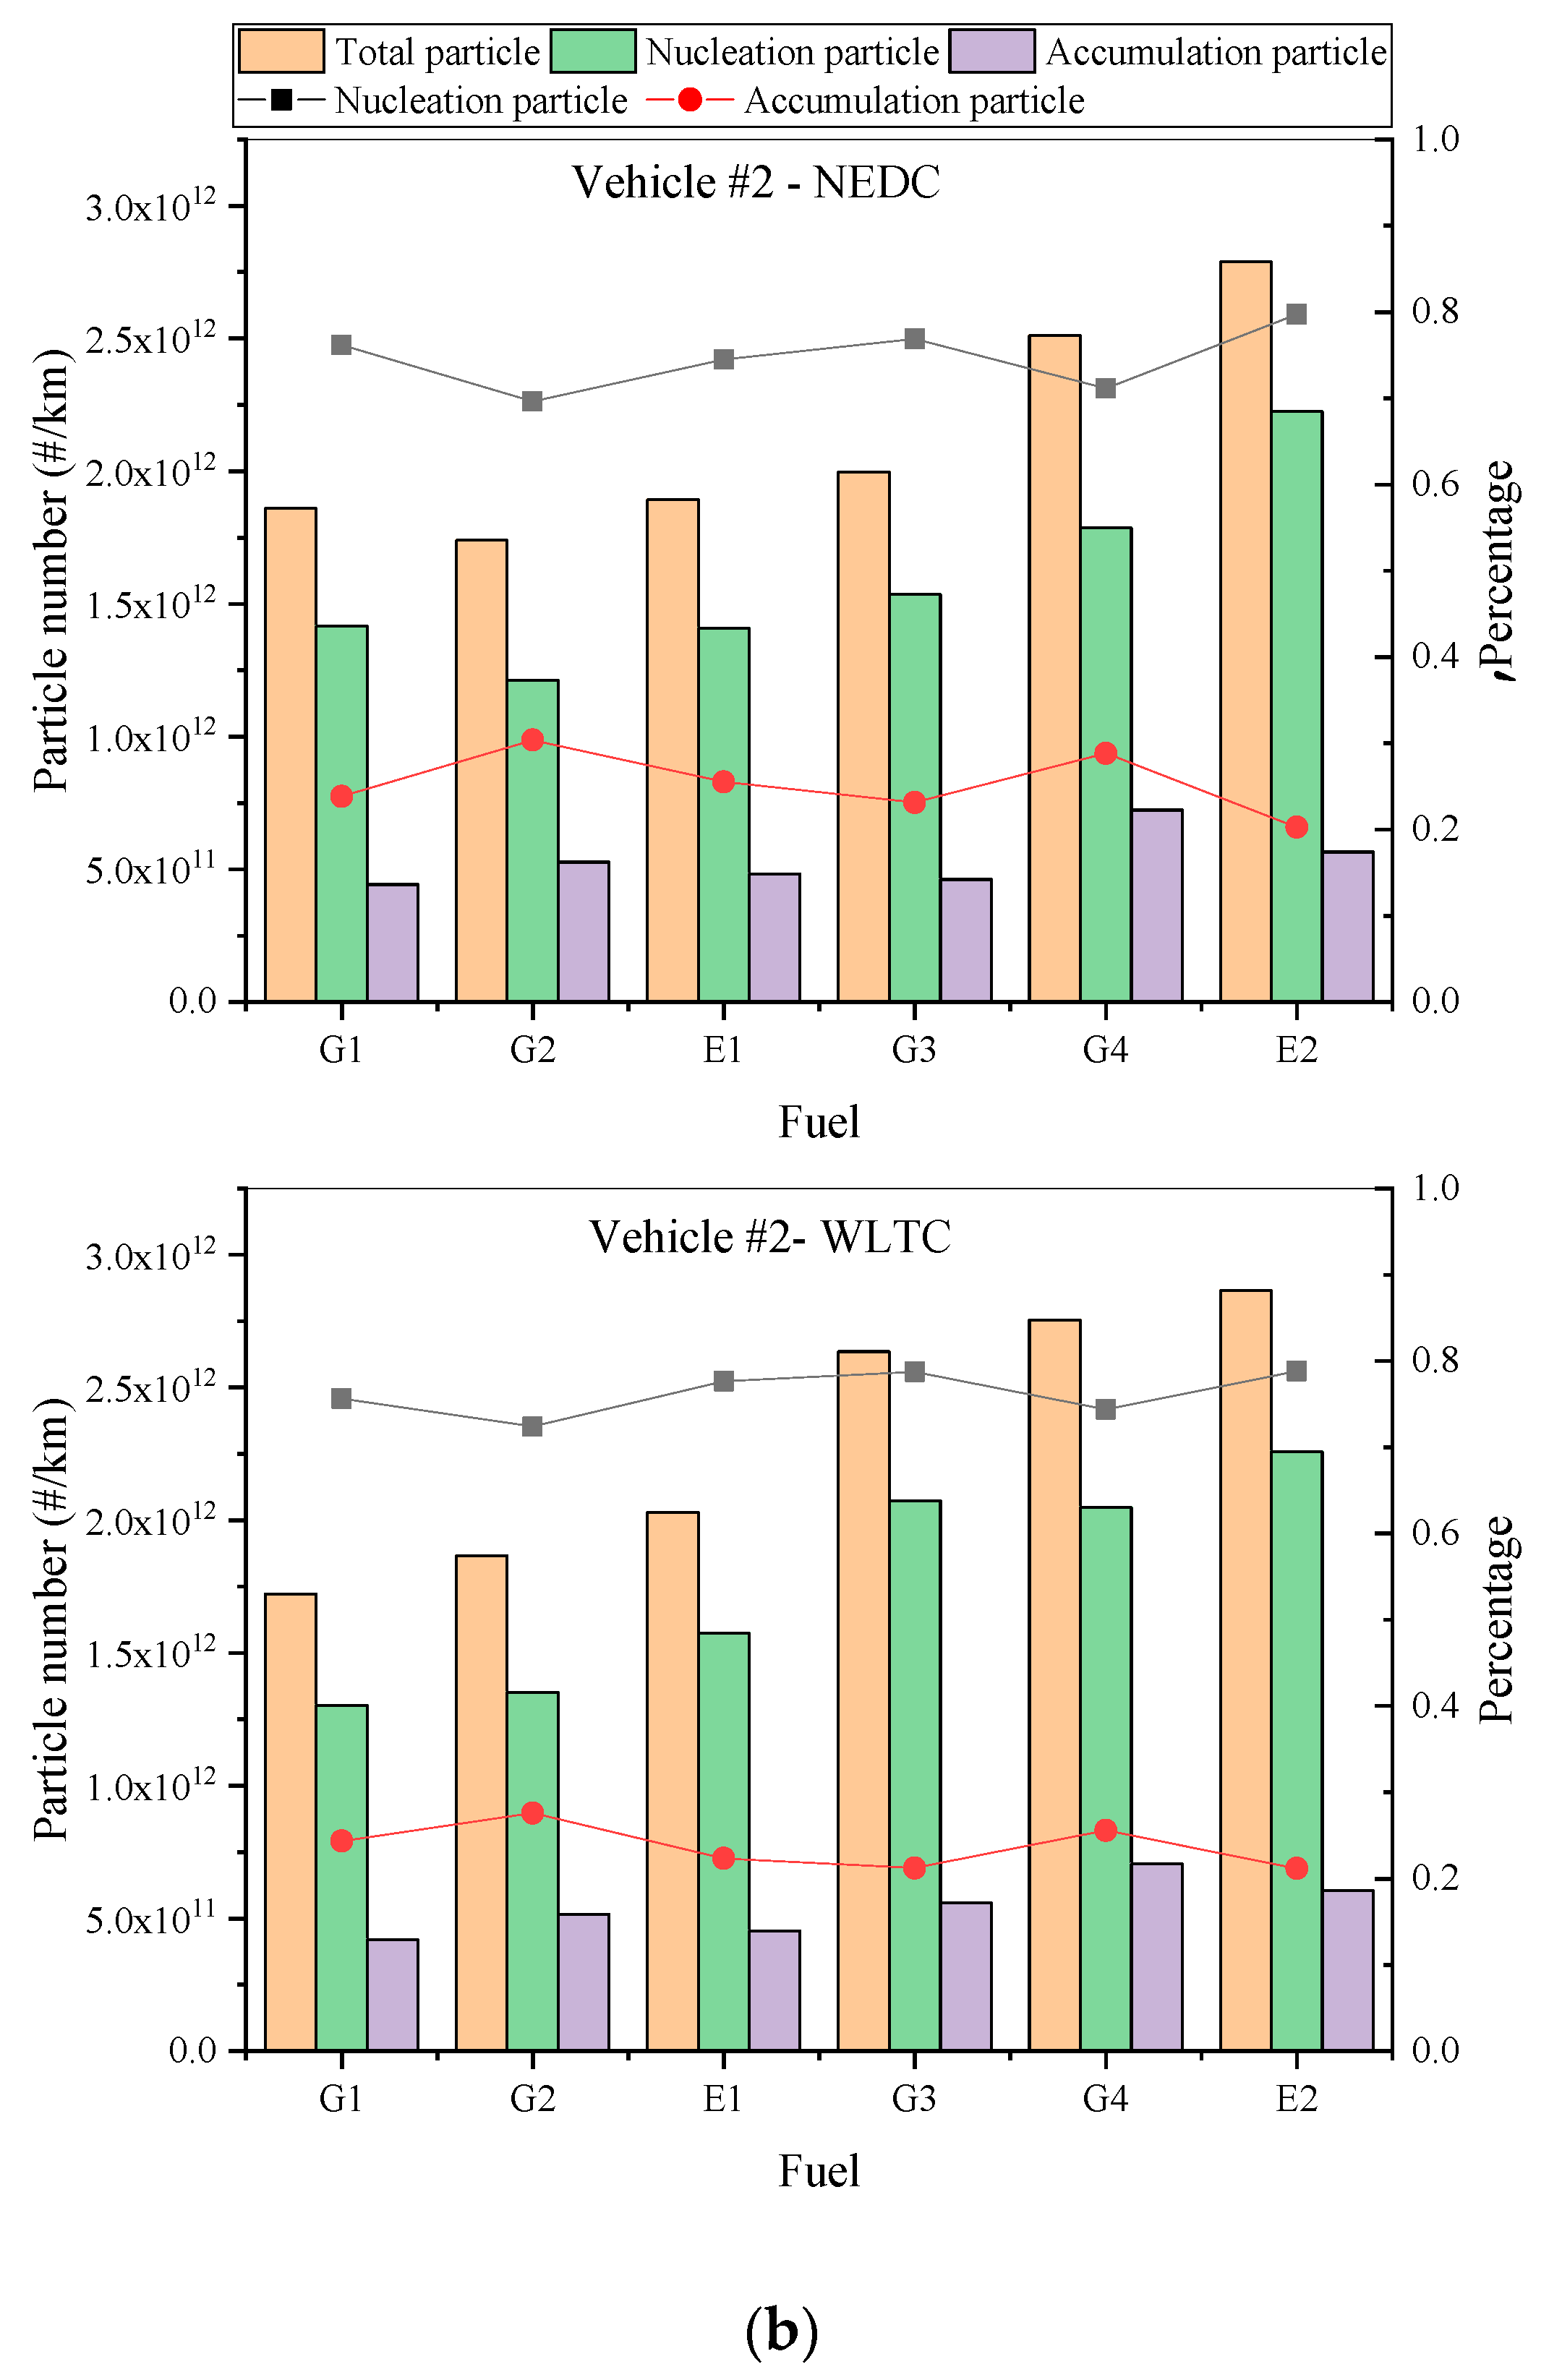
3.4.1. Particle Number Emissions
3.4.2. PN EFs
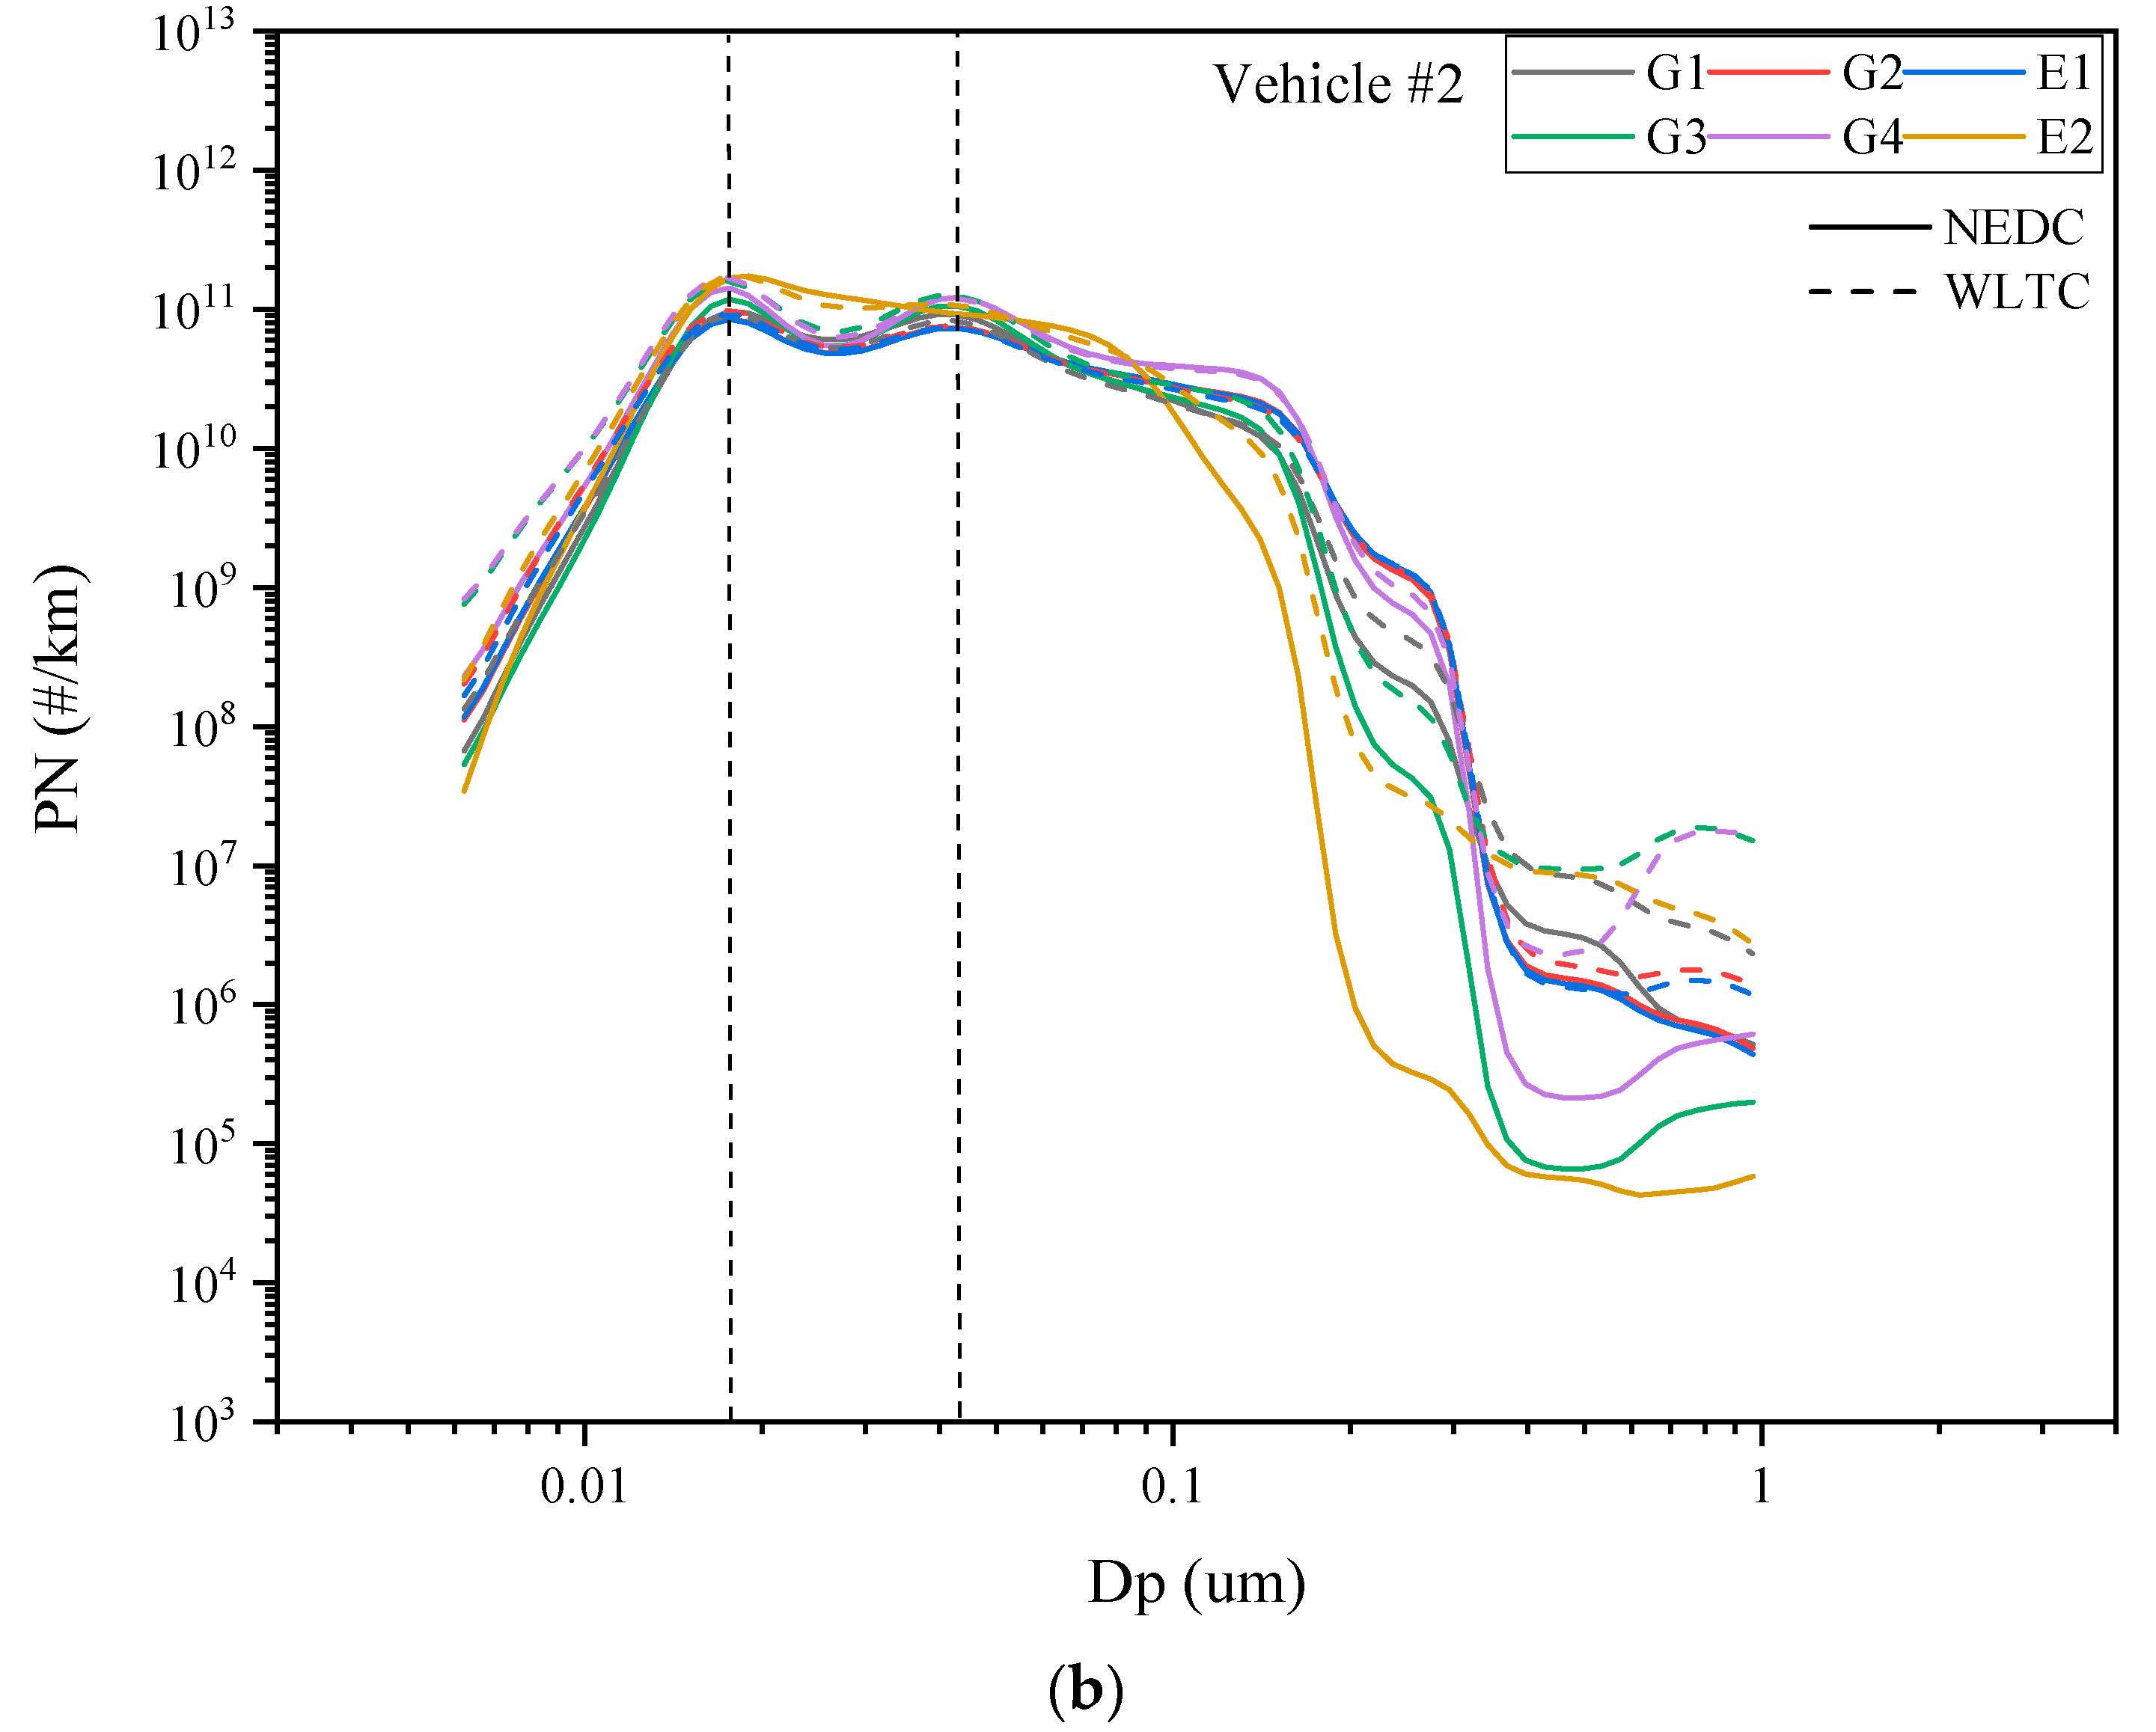
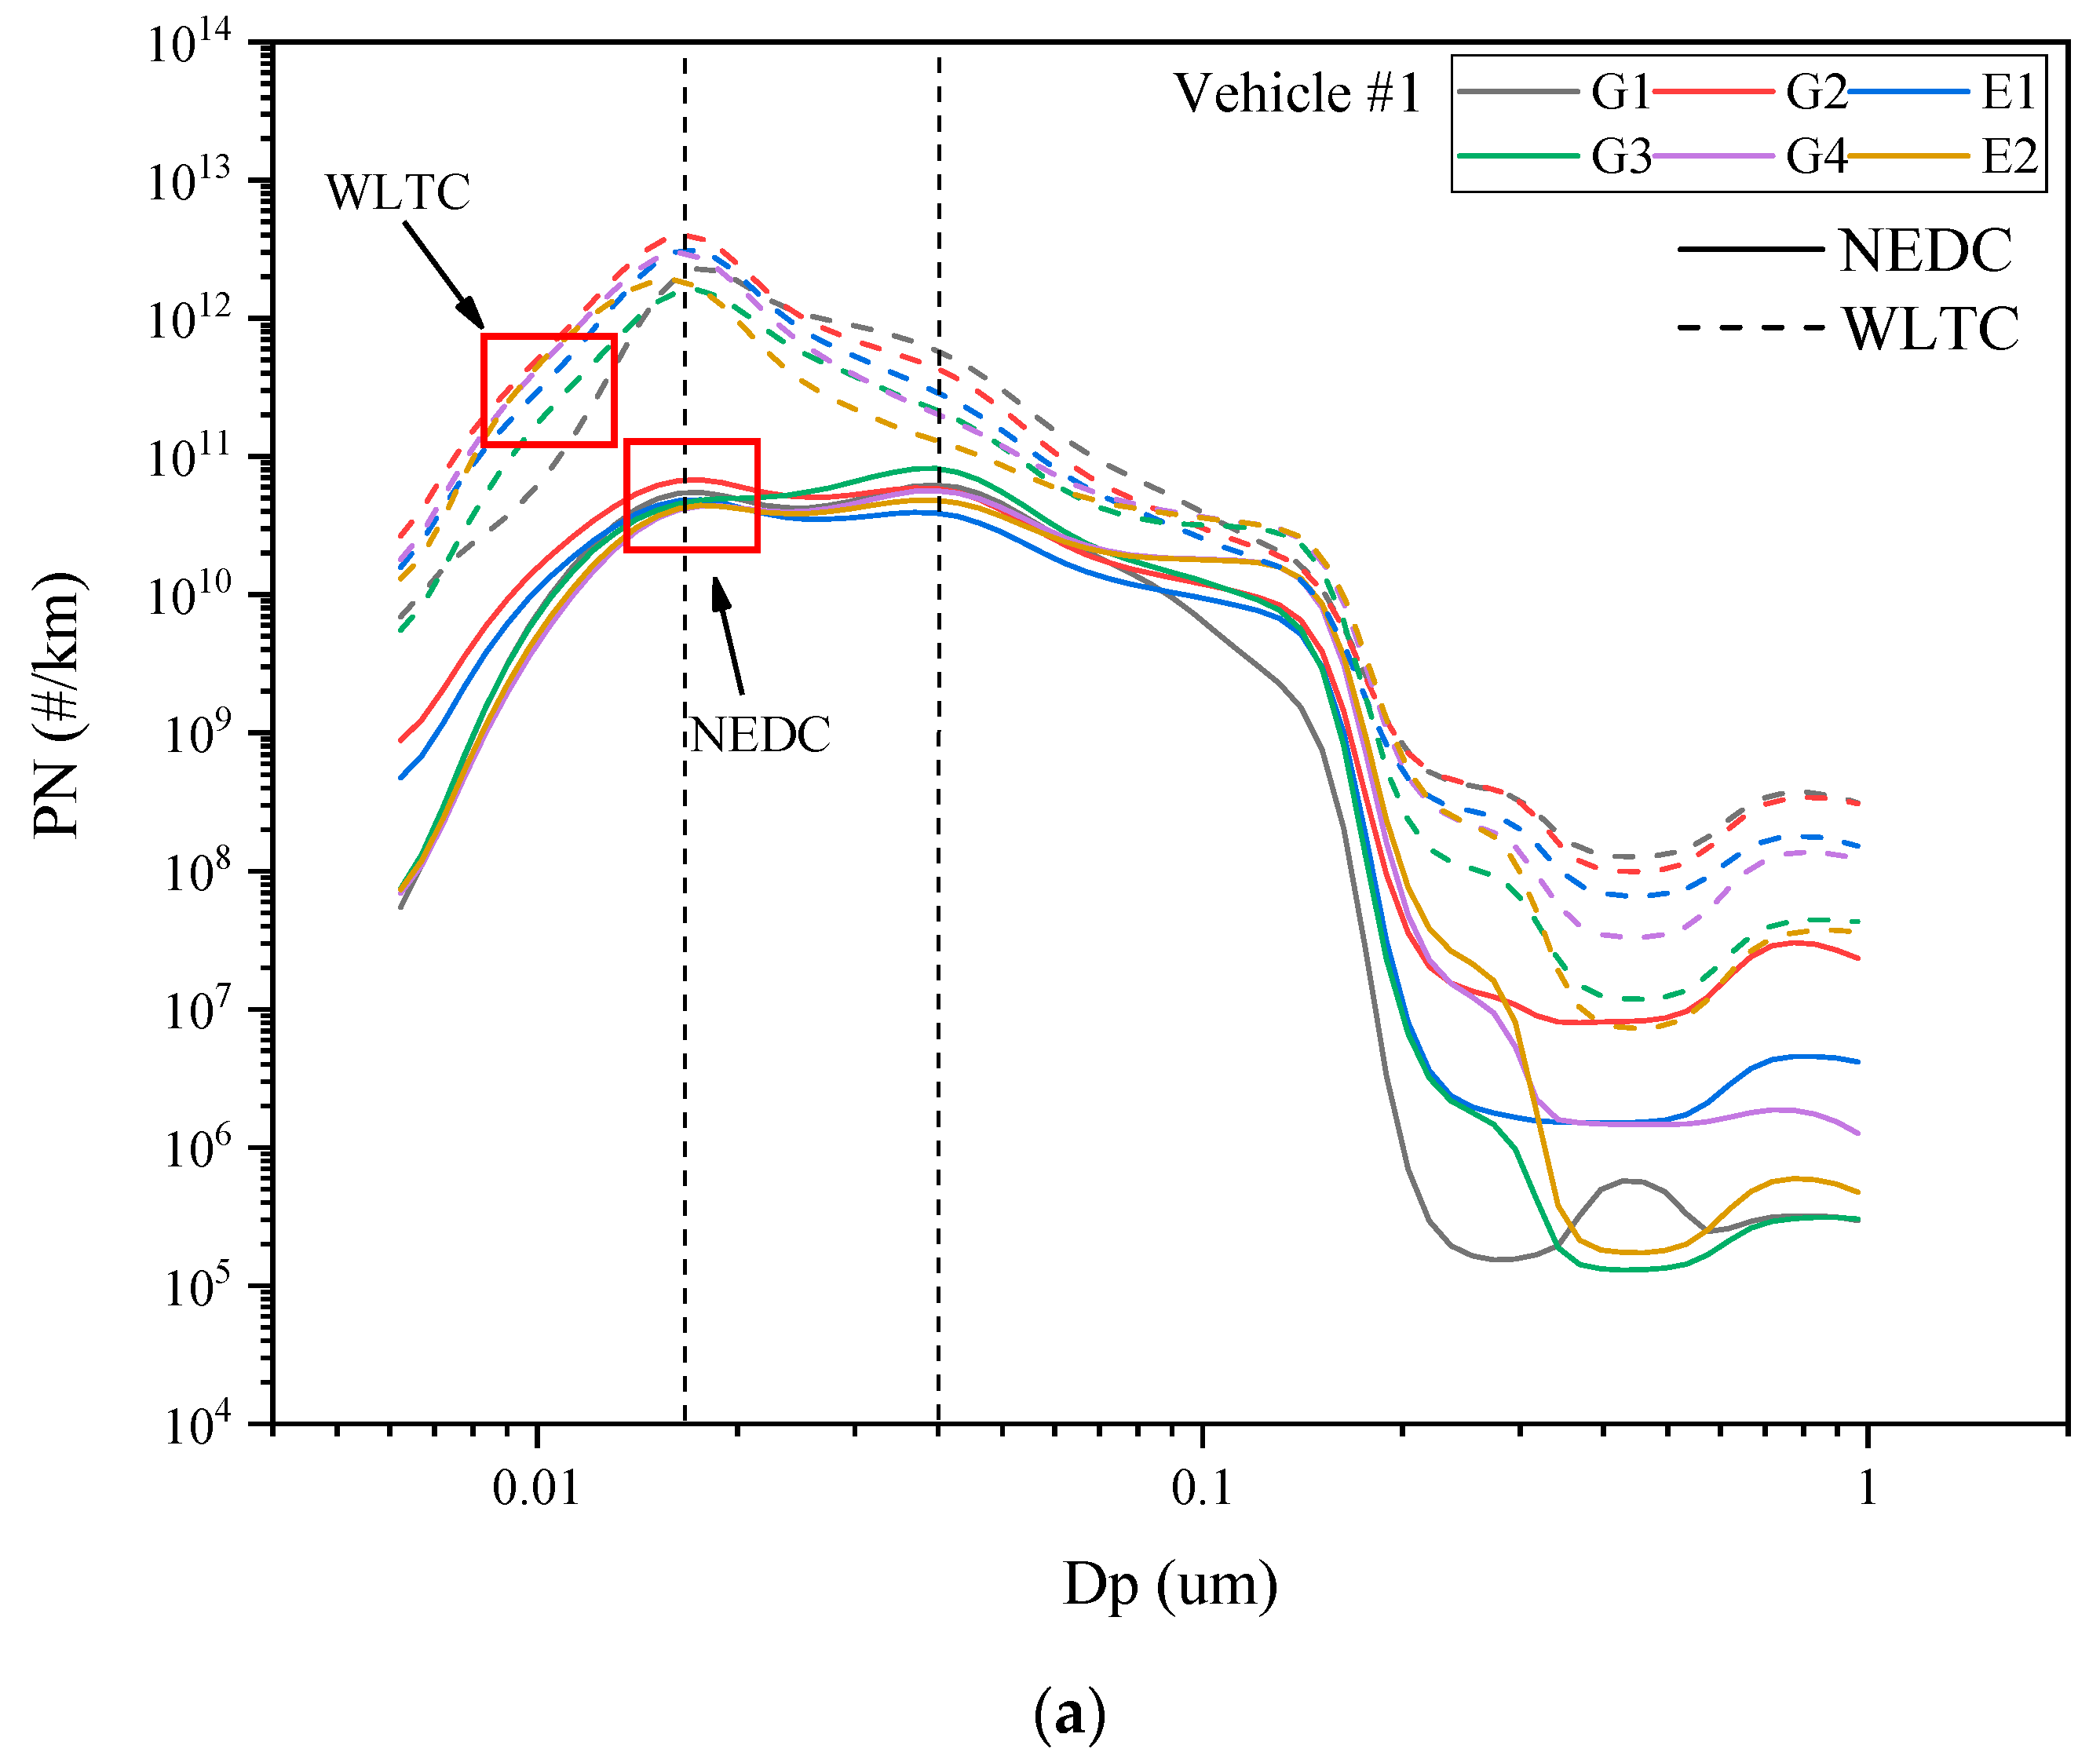
3.4.3. PSD Analysis
3.4.4. Discussion of Particulate Emission
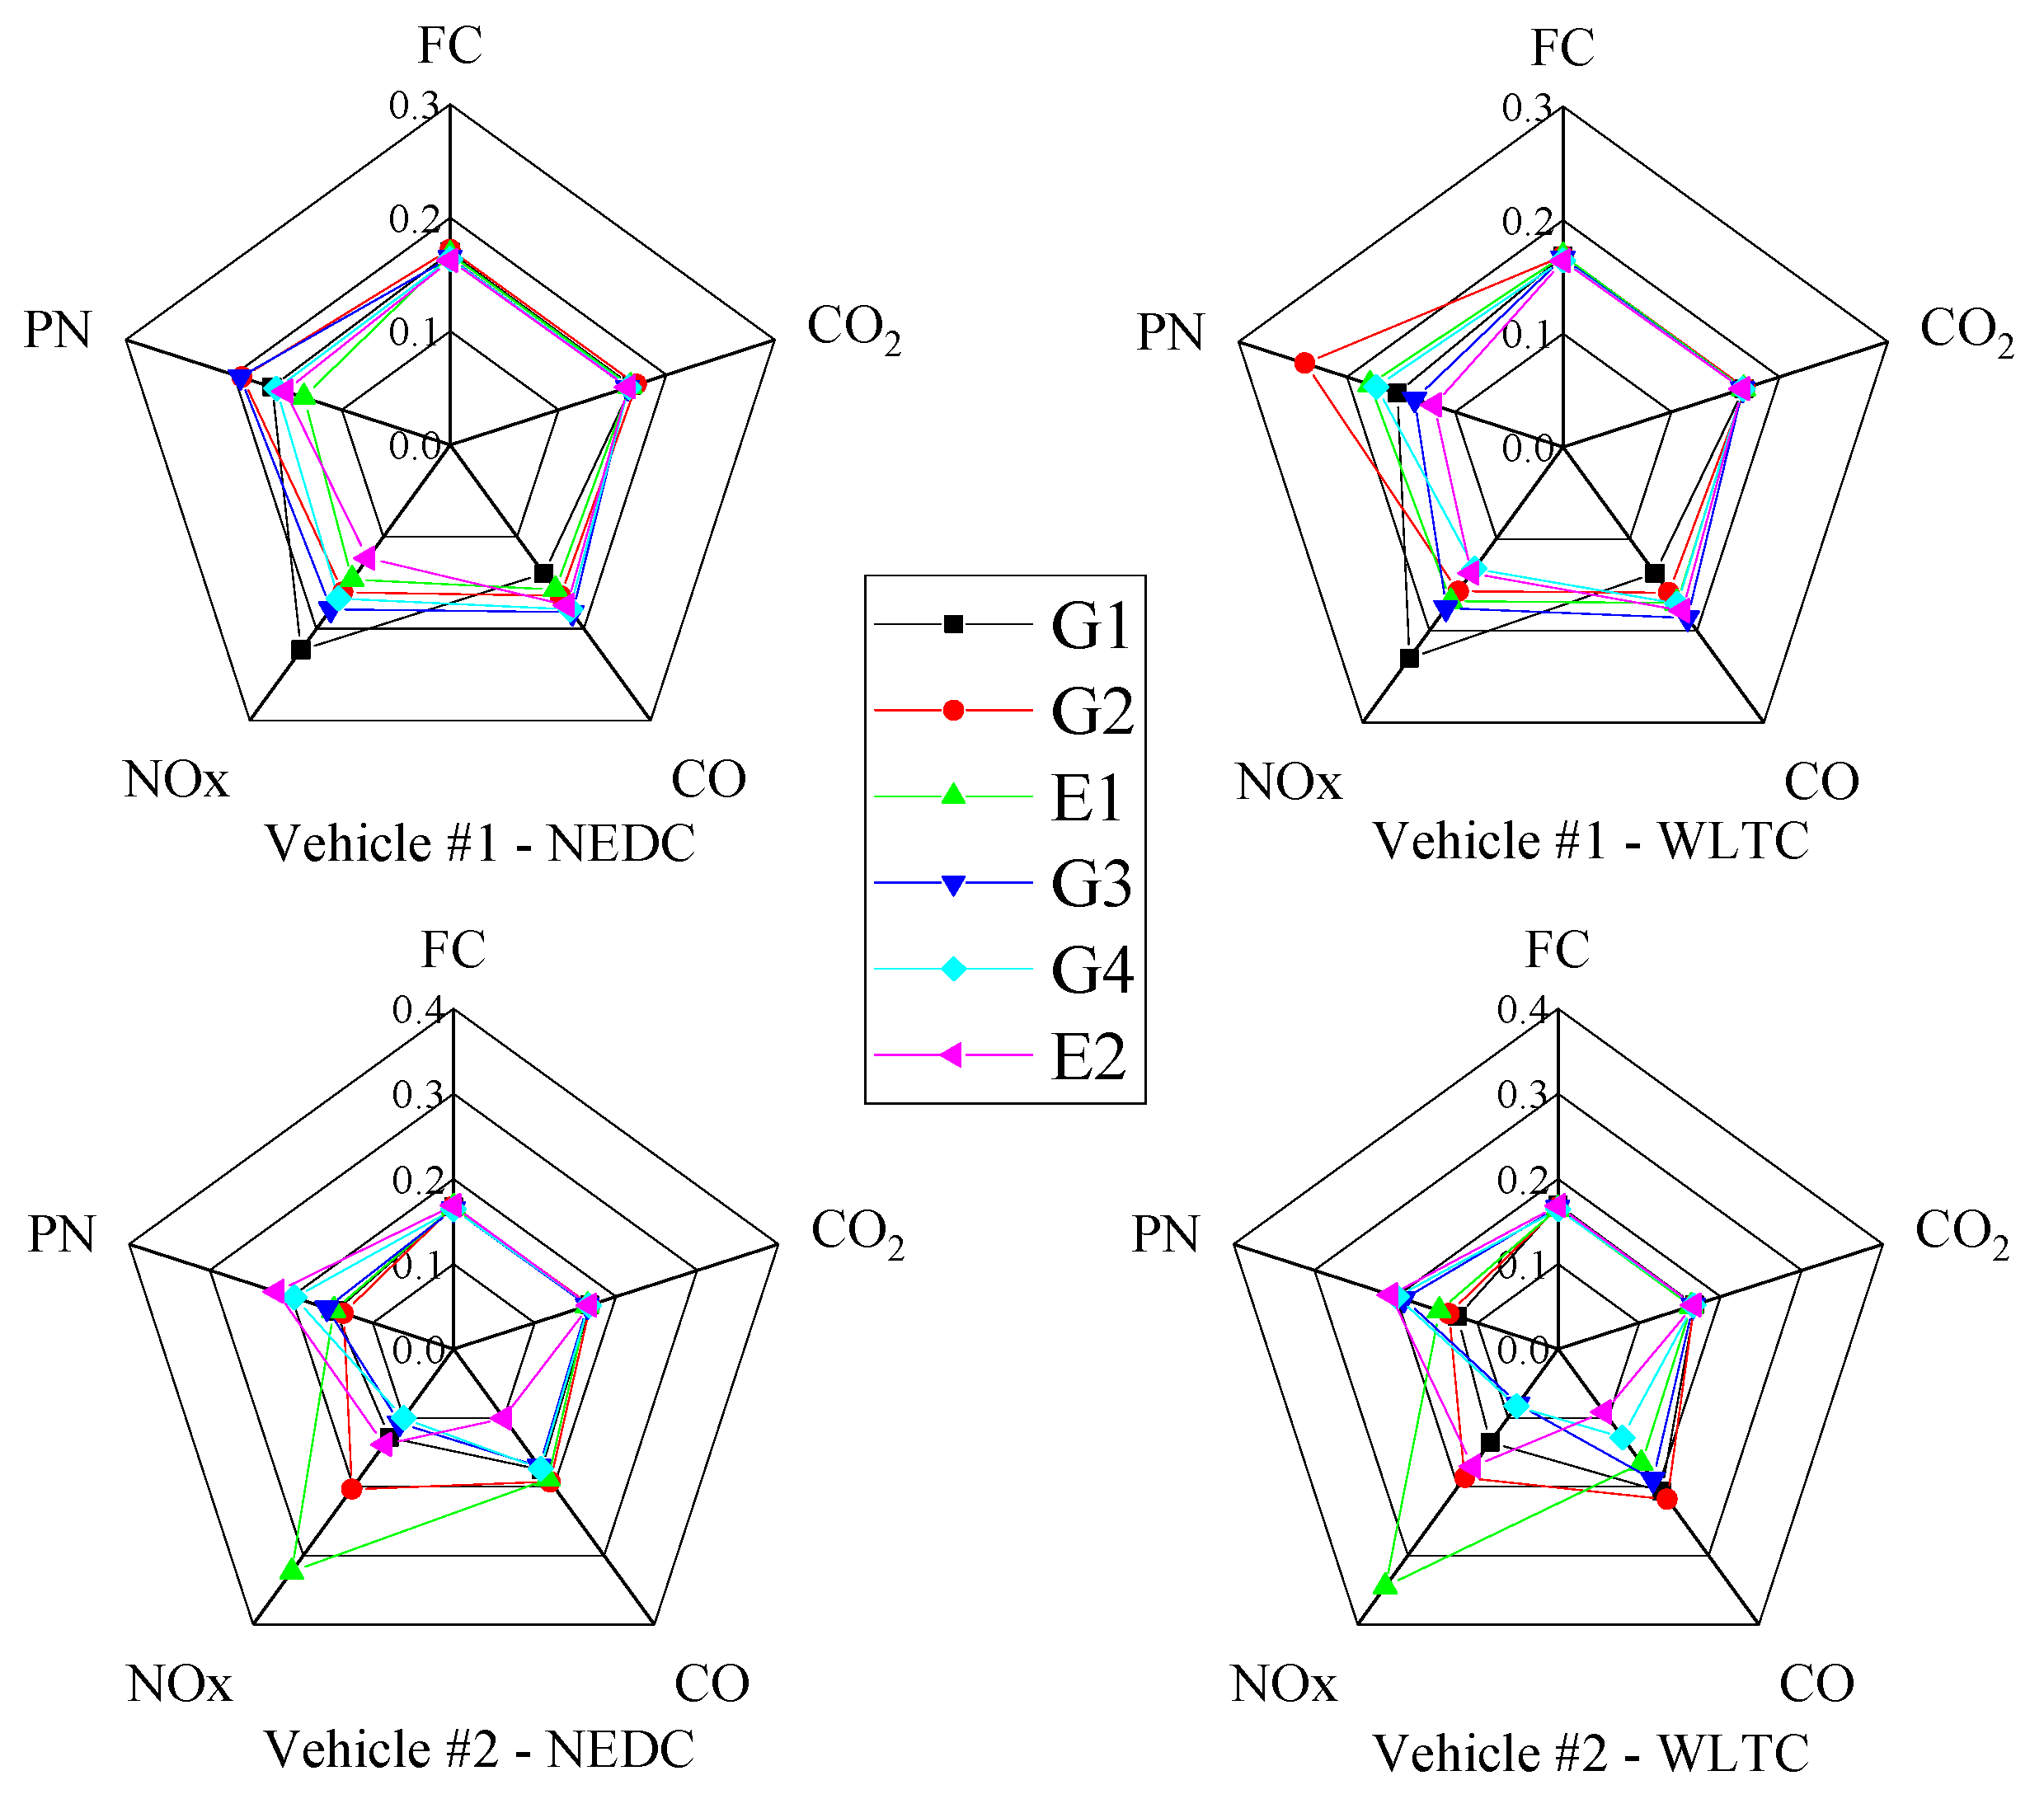
3.5. Matching of Vehicles and Fuels
4. Conclusions
- (1)
- Compared with the NEDC test cycle, the test vehicles had higher fuel consumption and pollutant emission factors during the WLTC test cycle. For Vehicle #1, the fuel consumption and emission factors for the WLTC cycle were significantly higher than those under the NEDC test conditions. For Vehicle #2, the fuel consumption and emission factors for the WLTC were also higher than those under the NEDC test conditions, but the gap was exceedingly small;
- (2)
- Fuel performance will affect vehicle emissions. The content of olefins and aromatics has little effect on emissions, but RON and ethanol content have a strong impact on emissions. An increase in RON led to an increase in fuel economy and a decrease in NOx emissions for the two vehicles. For vehicle #1, increasing the RON led to higher CO emissions and lower PN emissions. For Vehicle #2, the observation was the opposite. When ethanol–gasoline was used, the CO and PN emissions increased and the NOx emissions decreased for Vehicle #1, while the CO emissions decreased and the NOx and PN emissions increased for Vehicle #2. For the four traditional fuels, increasing the fuel’s aromatic content led to higher particle number emissions;
- (3)
- Many particles are emitted during the driving process, of which the largest proportion is that of the nucleation-mode particles. For Vehicle #1, the proportion of nucleation-mode particles was between 70% and 90%. For Vehicle #2, the proportion of nucleation-mode particles was higher, more than 90%. There were two peaks in the particle emission particle size distribution, at about 18 nm and 40 nm;
- (4)
- From the perspective of emissions levels, the adaptability of the two vehicles to six kinds of fuel was analyzed. Through a comparative analysis, the fuel suitable for the test vehicle in this study was found. The Euro 6 vehicle (Vehicle #2) in this experiment is more suitable for the use of traditional gasoline with a high RON.
Supplementary Materials
Author Contributions
Funding
Acknowledgments
Conflicts of Interest
References
- Zhang, Y.; Baltensperger, U.; Schnelle-Kreis, J.; An, Z.; Han, Y.; Crippa, M.; Zotter, P.; Platt, S.M.; Cao, J.-J.; Ho, K.-F.; et al. High secondary aerosol contribution to particulate pollution during haze events in China. Nature 2014, 514, 218–222. [Google Scholar]
- Schifter, I.; Diaz, L.; Gonzalez, U.; Macias, U.G. Fuel formulation for recent model light duty vehicles in Mexico base on a model for predicting gasoline emissions. Fuel 2013, 107, 371–381. [Google Scholar] [CrossRef]
- Fushimi, A.; Kondo, Y.; Kobayashi, S.; Fujitani, Y.; Saitoh, K.; Takami, A.; Tanabe, K. Chemical composition and source of fine and nanoparticles from recent direct injection gasoline passenger cars: Effects of fuel and ambient temperature. Atmos. Environ. 2016, 124, 77–84. [Google Scholar] [CrossRef]
- Awad, O.I.; Ma, X.; Kamil, M.; Ali, O.M.; Zhang, Z.; Shuai, S. Particulate emissions from gasoline direct injection engines: A review of how current emission regulations are being met by automobile manufacturers. Sci. Total Environ. 2020, 718, 137302. [Google Scholar] [CrossRef]
- Yang, J.; Roth, P.; Zhu, H.; Durbin, T.D.; Karavalakis, G. Impacts of gasoline aromatic and ethanol levels on the emissions from GDI vehicles: Part 2. Influence on particulate matter, black carbon, and nanoparticle emissions. Fuel 2019, 252, 812–820. [Google Scholar] [CrossRef]
- Sayin, C.; Kilicaslan, I.; Canakci, M.; Ozsezen, N. An experimental study of the effect of octane number higher than engine requirement on the engine performance and emissions. Appl. Therm. Eng. 2005, 25, 1315–1324. [Google Scholar] [CrossRef]
- Binjuwair, S.; Mohamad, T.I.; Almaleki, A.; Alkudsi, A.; Alshunaifi, I. The effects of research octane number and fuel systems on the performance and emissions of a spark ignition engine: A study on Saudi Arabian RON91 and RON95 with port injection and direct injection systems. Fuel 2015, 158, 351–360. [Google Scholar] [CrossRef]
- Liu, H.; Yao, M.; Zhang, B.; Zheng, Z. Effects of Inlet Pressure and Octane Numbers on Combustion and Emissions of a Homogeneous Charge Compression Ignition (HCCI) Engine. Energy Fuels 2008, 22, 2207–2215. [Google Scholar] [CrossRef]
- Broustail, G.; Halter, F.; Seers, P.; Moréac, G.; Mounaim-Rousselle, C. Comparison of regulated and non-regulated pollutants with iso-octane/butanol and iso-octane/ethanol blends in a port-fuel injection Spark-Ignition engine. Fuel 2012, 94, 251–261. [Google Scholar] [CrossRef]
- Lattimore, T.; Herreros, J.M.; Xu, H.; Shuai, S. Investigation of compression ratio and fuel effect on combustion and PM emissions in a DISI engine. Fuel 2016, 169, 68–78. [Google Scholar] [CrossRef] [Green Version]
- Iodice, P.; Langella, G.; Amoresano, A. Ethanol in gasoline fuel blends: Effect on fuel consumption and engine out emissions of SI engines in cold operating conditions. Appl. Therm. Eng. 2018, 130, 1081–1089. [Google Scholar] [CrossRef]
- Catapano, F.; Sementa, P.; Vaglieco, B.M. Air-fuel mixing and combustion behavior of gasoline-ethanol blends in a GDI wall-guided turbocharged multi-cylinder optical engine. Renew. Energy 2016, 96, 319–332. [Google Scholar] [CrossRef]
- Jin, D.; Choi, K.; Myung, C.-L.; Lim, Y.; Lee, J.; Park, S. The impact of various ethanol-gasoline blends on particulates and unregulated gaseous emissions characteristics from a spark ignition direct injection (SIDI) passenger vehicle. Fuel 2017, 209, 702–712. [Google Scholar] [CrossRef]
- Maricq, M.M.; Szente, J.J.; Jahr, K. The Impact of Ethanol Fuel Blends on PM Emissions from a Light-Duty GDI Vehicle. Aerosol Sci. Technol. 2012, 46, 576–583. [Google Scholar] [CrossRef]
- Karavalakis, G.; Short, D.; Russell, R.L.; Jung, H.; Johnson, K.C.; Asa-Awuku, A.; Durbin, T.D. Assessing the impacts of ethanol and isobutanol on gaseous and particulate emissions from flexible fuel vehicles. Environ. Sci. Technol. 2014, 48, 14016–14024. [Google Scholar] [CrossRef] [Green Version]
- Fatouraie, M.; Wooldridge, M.S.; Petersen, B.R.; Wooldridge, S.T. Effects of Ethanol on In-Cylinder and Exhaust Gas Particulate Emissions of a Gasoline Direct Injection Spark Ignition Engine. Energy Fuels 2015, 29, 3399–3412. [Google Scholar] [CrossRef]
- Wu, J.; Song, K.H.; Litzinger, T.; Lee, S.-Y.; Santoro, R.; Linevsky, M.; Colket, M.; Liscinsky, D. Reduction of PAH and soot in premixed ethylene-air flames by addition of ethanol. Combust. Flame 2006, 144, 675–687. [Google Scholar] [CrossRef]
- Lemaire, R.; Therssen, E.; Desgroux, P. Effect of ethanol addition in gasoline and gasoline–surrogate on soot formation in turbulent spray flames. Fuel 2010, 89, 3952–3959. [Google Scholar] [CrossRef]
- Khosousi, A.; Liu, F.; Dworkin, S.B.; Eaves, N.A.; Thomson, M.J.; He, X.; Dai, Y.; Gao, Y.; Liu, F.; Shuai, S.; et al. Experimental and numerical study of soot formation in laminar coflow diffusion flames of gasoline/ethanol blends. Combust. Flame 2015, 162, 3925–3933. [Google Scholar] [CrossRef]
- Yang, J.; Roth, P.; Durbin, T.D.; Johnson, K.C.; Asa-Awuku, A.; Cocker, D.R.; Karavalakis, G. Investigation of the Effect of Mid- And High-Level Ethanol Blends on the Particulate and the Mobile Source Air Toxic Emissions from a Gasoline Direct Injection Flex Fuel Vehicle. Energy Fuels 2018, 33, 429–440. [Google Scholar] [CrossRef]
- Chen, L.; Stone, R.; Richardson, D. A study of mixture preparation and PM emissions using a direct injection engine fuelled with stoichiometric gasoline/ethanol blends. Fuel 2012, 96, 120–130. [Google Scholar] [CrossRef]
- Storch, M.; Koegl, M.; Altenhoff, M.; Will, S.; Zigan, L. Investigation of soot formation of spark-ignited ethanol-blended gasoline sprays with single- and multi-component base fuels. Appl. Energy 2016, 181, 278–287. [Google Scholar] [CrossRef]
- Leach, F.C.; Stone, R.; Richardson, D.; Turner, J.W.; Lewis, A.; Akehurst, S.; Remmert, S.; Campbell, S.; Cracknell, R. The effect of oxygenate fuels on PN emissions from a highly boosted GDI engine. Fuel 2018, 225, 277–286. [Google Scholar] [CrossRef]
- Vuk, C.; Vander Griend, S.J. Fuel Property Effects on Particulates in Spark Ignition Engines. SAE Tech. Pap. Ser. 2013, 2, 1124. [Google Scholar]
- Chen, L.; Zhang, Z.; Gong, W.; Liang, Z. Quantifying the effects of fuel compositions on GDI-derived particle emissions using the optimal mixture design of experiments. Fuel 2015, 154, 252–260. [Google Scholar] [CrossRef]
- Karavalakis, G.; Short, D.; Vu, D.; Russell, R.; Hajbabaei, M.; Asa-Awuku, A.; Durbin, T.D. Evaluating the Effects of Aromatics Content in Gasoline on Gaseous and Particulate Matter Emissions from SI-PFI and SIDI Vehicles. Environ. Sci. Technol. 2015, 49, 7021–7031. [Google Scholar] [CrossRef] [Green Version]
- Wang, Y.; Zheng, R.; Qin, Y.; Peng, J.; Li, M.; Lei, J.; Wu, Y.; Hu, M.; Shuai, S. The impact of fuel compositions on the particulate emissions of direct injection gasoline engine. Fuel 2016, 166, 543–552. [Google Scholar]
- Zhu, R.; Hu, J.; Bao, X.; He, L.; Zu, L. Effects of aromatics, olefins and distillation temperatures (T50 & T90) on particle mass and number emissions from gasoline direct injection (GDI) vehicles. Energy Policy 2017, 101, 185–193. [Google Scholar]
- Yang, J.; Roth, P.; Durbin, T.; Karavalakis, G. Impacts of gasoline aromatic and ethanol levels on the emissions from GDI vehicles: Part 1. Influence on regulated and gaseous toxic pollutants. Fuel 2019, 252, 799–811. [Google Scholar] [CrossRef]
- Schifter, I.; Díaz, L.; Sánchez-Reyna, G.; Macias, U.G.; González, U.; Rodríguez, R. Influence of gasoline olefin and aromatic content on exhaust emissions of 15% ethanol blends. Fuel 2020, 265, 116950. [Google Scholar] [CrossRef]
- Han, Y.; Hu, S.; Sun, Y.; Sun, X.; Tan, M.; Xu, Y.; Tian, J.; Li, R.; Shao, Z. Compositional Effect of Gasoline on Fuel Economy and Emissions. Energy Fuels 2018, 32, 5072–5080. [Google Scholar] [CrossRef]
- Yao, C.; Dou, Z.; Wang, B.; Liu, M.; Lu, H.; Feng, J.; Feng, L. Experimental study of the effect of heavy aromatics on the characteristics of combustion and ultrafine particle in DISI engine. Fuel 2017, 203, 290–297. [Google Scholar] [CrossRef]
- Chan, T.W.; Lax, D.; Gunter, G.C.; Hendren, J.; Kubsh, J.; Brezny, R. Assessment of the Fuel Composition Impact on Black Carbon Mass, Particle Number Size Distributions, Solid Particle Number, Organic Materials, and Regulated Gaseous Emissions from a Light-Duty Gasoline Direct Injection Truck and Passenger Car. Energy Fuels 2017, 31, 10452–10466. [Google Scholar] [CrossRef]
- Leach, F.C.; Stone, R.; Richardson, D.; Lewis, A.G.; Akehurst, S.; Turner, J.W.; Shankar, V.; Chahal, J.; Cracknell, R.F.; Aradi, A. The effect of fuel composition on particulate emissions from a highly boosted GDI engine—An evaluation of three particulate indices. Fuel 2019, 252, 598–611. [Google Scholar] [CrossRef]
- Chen, L.; Liang, Z.; Zhang, X.; Shuai, S. Characterizing particulate matter emissions from GDI and PFI vehicles under transient and cold start conditions. Fuel 2017, 189, 131–140. [Google Scholar] [CrossRef]
- Bonatesta, F.; Chiappetta, E.; La Rocca, A. Part-load particulate matter from a GDI engine and the connection with combustion characteristics. Appl. Energy 2014, 124, 366–376. [Google Scholar] [CrossRef] [Green Version]
- Raza, M.; Chen, L.; Leach, F.; Ding, S. A Review of Particulate Number (PN) Emissions from Gasoline Direct Injection (GDI) Engines and Their Control Techniques. Energies 2018, 11, 1417. [Google Scholar] [CrossRef] [Green Version]
- Conte, M.; Contini, D. Size-resolved particle emission factors of vehicular traffic derived from urban eddy covariance measurements. Environ. Pollut. 2019, 251, 830–838. [Google Scholar] [CrossRef] [PubMed]
- Rönkkö, T.; Kuuluvainen, H.; Karjalainen, P.; Keskinen, J.; Hillamo, R.; Niemi, J.; Pirjola, L.; Timonen, H.J.; Saarikoski, S.; Saukko, E.; et al. Traffic is a major source of atmospheric nanocluster aerosol. Proc. Natl. Acad. Sci. USA 2017, 114, 7549–7554. [Google Scholar] [CrossRef] [Green Version]
- Hooftman, N.; Messagie, M.; Van Mierlo, J.; Coosemans, T. A review of the European passenger car regulations—Real driving emissions vs local air quality. Renew. Sustain. Energy Rev. 2018, 86, 1–21. [Google Scholar] [CrossRef]
- Pavlovic, J.; Marotta, A.; Ciuffo, B. CO2 emissions and energy demands of vehicles tested under the NEDC and the new WLTP type approval test procedures. Appl. Energy 2016, 177, 661–670. [Google Scholar] [CrossRef]
- Karagöz, Y. Analysis of the impact of gasoline, biogas and biogas + hydrogen fuels on emissions and vehicle performance in the WLTC and NEDC. Int. J. Hydrog. Energy 2019, 44, 31621–31632. [Google Scholar] [CrossRef]
- Sileghem, L.; Bosteels, D.; May, J.; Favre, C.; Verhelst, S. Analysis of vehicle emission measurements on the new WLTC, the NEDC and the CADC. Transp. Res. Part D Transp. Environ. 2014, 32, 70–85. [Google Scholar] [CrossRef] [Green Version]
- Dimaratos, A.; Tsokolis, D.; Fontaras, G.; Tsiakmakis, S.; Ciuffo, B.; Samaras, Z. Comparative Evaluation of the Effect of Various Technologies on Light-duty Vehicle CO2 Emissions over NEDC and WLTP. Transp. Res. Procedia 2016, 14, 3169–3178. [Google Scholar] [CrossRef] [Green Version]
- Marotta, A.; Pavlovic, J.; Ciuffo, B.; Serra, S.; Fontaras, G. Gaseous Emissions from Light-Duty Vehicles: Moving from NEDC to the New WLTP Test Procedure. Environ. Sci. Technol. 2015, 49, 8315–8322. [Google Scholar] [CrossRef]
- Demuynck, J.; Bosteels, D.; De Paepe, M.; Favre, C.; May, J.; Verhelst, S. Recommendations for the new WLTP cycle based on an analysis of vehicle emission measurements on NEDC and CADC. Energy Policy 2012, 49, 234–242. [Google Scholar] [CrossRef] [Green Version]
- Wang, Y.; Hao, C.; Ge, Y.; Hao, L.; Tan, J.; Wang, X.; Zhang, P.; Wang, Y.; Tian, W.; Lin, Z.; et al. Fuel consumption and emission performance from light-duty conventional/hybrid-electric vehicles over different cycles and real driving tests. Fuel 2020, 278, 118340. [Google Scholar] [CrossRef]
- Grigoratos, T.; Fontaras, G.; Giechaskiel, B.; Zacharof, N. Real world emissions performance of heavy-duty Euro VI diesel vehicles. Atmos. Environ. 2019, 201, 348–359. [Google Scholar] [CrossRef]
- Yli-Ojanperä, J.; Kannosto, J.; Marjamäki, M.; Keskinen, J. Improving the Nanoparticle Resolution of the ELPI. Aerosol Air Qual. Res. 2010, 10, 360–366. [Google Scholar] [CrossRef] [Green Version]
- Järvinen, A.; Aitomaa, M.; Rostedt, A.; Keskinen, J.; Yli-Ojanperä, J. Calibration of the new electrical low pressure impactor (ELPI+). J. Aerosol Sci. 2014, 69, 150–159. [Google Scholar] [CrossRef] [Green Version]
- Zervas, E.; Dorlhene, P. Comparison of Exhaust Particle Number Measured by EEPS, CPC, and ELPI. Aerosol Sci. Technol. 2006, 40, 977–984. [Google Scholar] [CrossRef] [Green Version]
- Saari, S.; Arffman, A.; Harra, J.; Rönkkö, T.; Keskinen, J. Performance evaluation of the HR-ELPI + inversion. Aerosol Sci. Technol. 2018, 52, 1037–1047. [Google Scholar] [CrossRef]
- Lepistö, T.; Kuuluvainen, H.; Juuti, P.; Järvinen, A.; Arffman, A.; Rönkkö, T. Measurement of the human respiratory tract deposited surface area of particles with an electrical low pressure impactor. Aerosol Sci. Technol. 2020, 54, 958–971. [Google Scholar] [CrossRef]
- Kittelson, D.B. Engines and nanoparticles: A review. J. Aerosol Sci. 1998, 29, 575–588. [Google Scholar] [CrossRef]
- Sun, W.; Wang, Q.; Guo, L.; Cheng, P.; Li, D.; Yan, Y. Influence of biodiesel/diesel blends on particle size distribution of CI engine under steady/transient conditions. Fuel 2019, 245, 336–344. [Google Scholar] [CrossRef]
- Zhou, J.; Cheung, C.; Zhao, W.; Leung, C. Diesel–hydrogen dual-fuel combustion and its impact on unregulated gaseous emissions and particulate emissions under different engine loads and engine speeds. Energy 2016, 94, 110–123. [Google Scholar] [CrossRef]
- Man, X.; Cheung, C.S.; Ning, Z.; Wei, L.; Huang, Z. Influence of engine load and speed on regulated and unregulated emissions of a diesel engine fueled with diesel fuel blended with waste cooking oil biodiesel. Fuel 2016, 180, 41–49. [Google Scholar] [CrossRef]
- Stradling, R.; Williams, J.; Hamje, H.; Rickeard, D. Effect of Octane on Performance, Energy Consumption and Emissions of Two Euro 4 Passenger Cars. Transp. Res. Procedia 2016, 14, 3159–3168. [Google Scholar] [CrossRef] [Green Version]
- Hu, Z.; Lu, Z.; Song, B.; Quan, Y. Impact of test cycle on mass, number and particle size distribution of particulates emitted from gasoline direct injection vehicles. Sci. Total Environ. 2020, 762, 143128. [Google Scholar] [CrossRef]
- Tan, P.-Q.; Li, Y.; Hu, Z.-Y.; Lou, D.-M. Investigation of nitrogen oxides, particle number, and size distribution on a light-duty diesel car with B10 and G10 fuels. Fuel 2017, 197, 373–387. [Google Scholar] [CrossRef]


| Fuels | G1 | G2 | E1 | G3 | G4 | E2 | Test Method |
|---|---|---|---|---|---|---|---|
| Research octane number (RON) | 92.6 | 92.4 | 92.7 | 95.4 | 95.3 | 96.1 | GB/T 5487 |
| Sulfur (mg/kg) | 6.3 | 4.2 | 6.3 | 6.2 | 5 | 6.5 | SH/T 0689 |
| Density, @20 °C (kg/m3) | 733.5 | 741.2 | 734.3 | 738.6 | 746.5 | 734.3 | GB/T 1884 |
| Vapor pressure (kPa) | 58.6 | 61 | 61 | 58.1 | 60.2 | 60.1 | GB/T 8017 |
| Olefin (V/V)) | 9.1% | 14.1% | 11.3% | 9% | 14% | 10.6% | SH/T 0741 |
| Benzene (V/V)) | 0.6% | 0.5% | 0.7% | 0.6% | 0.5% | 0.7% | SH/T 0713 |
| Aromatics (V/V) | 23% | 28.2% | 28.4% | 25% | 32.1% | 29.1% | SH/T 0741 |
| Ethanol (m/m) | - | - | 10.5% | - | - | 10.9% | SH/T 0663 |
| Methanol (m/m) | 0.1% | 0.1% | - | 0.1% | 0.1% | - | SH/T 0663 |
| Vehicle #1 | Vehicle #2 | |
|---|---|---|
| Registration year | 2017 | 2019 |
| Emission standard | Euro 5 | Euro 6 |
| Length × width × Height | 4620 × 1775 × 1480 | 4695 × 1885 × 1700 |
| Wheelbase (mm) | 2700 | 2710 |
| Intake system | VGA, VVT-iW | VGA, DCVVT |
| Cylinders | Inline, 4 | Inline, 4 |
| Displacement (mL) | 1197 | 1495 |
| Compression ratio | 10 | 10 |
| Maximum torque (N·m) | 185 | 265 |
| Maximum power (kW) | 85 | 112 |
| Odometer (km) | 29,000 | 20,000 |
| After-treatment configuration | TWC | TWC |
Publisher’s Note: MDPI stays neutral with regard to jurisdictional claims in published maps and institutional affiliations. |
© 2022 by the authors. Licensee MDPI, Basel, Switzerland. This article is an open access article distributed under the terms and conditions of the Creative Commons Attribution (CC BY) license (https://creativecommons.org/licenses/by/4.0/).
Share and Cite
Lv, Z.; Yang, L.; Wu, L.; Peng, J.; Zhang, Q.; Sun, M.; Mao, H.; Min, J. Comprehensive Analysis of the Pollutant Characteristics of Gasoline Vehicle Emissions under Different Engine, Fuel, and Test Cycles. Energies 2022, 15, 622. https://doi.org/10.3390/en15020622
Lv Z, Yang L, Wu L, Peng J, Zhang Q, Sun M, Mao H, Min J. Comprehensive Analysis of the Pollutant Characteristics of Gasoline Vehicle Emissions under Different Engine, Fuel, and Test Cycles. Energies. 2022; 15(2):622. https://doi.org/10.3390/en15020622
Chicago/Turabian StyleLv, Zongyan, Lei Yang, Lin Wu, Jianfei Peng, Qijun Zhang, Meng Sun, Hongjun Mao, and Jie Min. 2022. "Comprehensive Analysis of the Pollutant Characteristics of Gasoline Vehicle Emissions under Different Engine, Fuel, and Test Cycles" Energies 15, no. 2: 622. https://doi.org/10.3390/en15020622
APA StyleLv, Z., Yang, L., Wu, L., Peng, J., Zhang, Q., Sun, M., Mao, H., & Min, J. (2022). Comprehensive Analysis of the Pollutant Characteristics of Gasoline Vehicle Emissions under Different Engine, Fuel, and Test Cycles. Energies, 15(2), 622. https://doi.org/10.3390/en15020622