Abstract
Protection of the natural environment is a key activity driving development in the transport discipline today. The use of simulators to train civil aviation pilots provides an excellent opportunity to maintain the balance between efficiency and limit the negative impact of transport on the environment. Therefore, we decided to determine the impact of selected simulations of air operations on energy consumption. The aim of the research was to determine the energy consumption of the flight simulator depending on the type of flight operation and configuration used. We also decided to compare the obtained result with the energy consumption of an aircraft of a similar class, performing a similar aviation operation and other means of transport. In order to obtain the results, a research plan was proposed consisting of 12 scenarios differing in the simulated aircraft model, weather conditions and the use of the simulator motion platform. In each of the scenarios, energy consumption was measured, taking into account the individual components of the simulator. The research showed that the use of a flight simulator has a much smaller negative impact on the natural environment than flying in a traditional plane. Use of a motion platform indicated a change in energy consumption of approximately 40% (in general, flight simulator configuration can change energy consumption by up to 50%). The deterioration of weather conditions during the simulation caused an increase in energy consumption of 14% when motion was disabled and 18% when motion was enabled. Energy consumption in the initial stages of pilot training can be reduced by 97% by using flight simulators compared to aircraft training.
1. Introduction
Nowadays, more and more attention is paid to the protection of the natural environment. This is the reason for looking for solutions that can reduce the negative impact of transport on the environment. An example of the implemented method of reducing the exhaust emissions from air transport is biofuels use [1]. Extensive electrification of transport increases the popularity of electric vehicles or other alternative driving methods. In aviation, the vast majority of traffic is still carried out by conventional means of transport. Aviation training usually begins with flights on airplanes with one piston engine, followed by multi-engine ones, and finally the license to pilot jet engines airplanes is obtained. The training process is extremely important from the point of view of the safety of the entire air transport system. Therefore, it is very important that this training is as effective as possible. This motivation already allowed for the development of flight simulators in the 20th century. The first designs, although still unreliable and imperfect, allowed for pilots to practice their first maneuvers, reflexes and behaviors. Even then, another great advantage of simulators was noticed, which is a significant reduction in training costs. The simulator structures were improved over time. As early as the 1990s, the superiority of training based on combining a simulator with an airplane over training using only an airplane was proven in over 90% of experimental comparisons [2].
Therefore, the greatest benefits of using simulators are safety, economy and environmental friendliness. Currently, simulators are common in many fields. In [3], it is shown that they are “used in the academic research, government operations, space exploration, recreational computer markets, and driver training schools as well as by the military, medical sector, and automotive industry”. The paper [4] shows the possibility of using a flight simulator to calculate fuel consumption depending on the landing approach. The authors conducted 50 trials and showed that the fixed-flight path-angle descent is operatively feasible and allows for fuel savings.
Today, simulators are used in various areas, but still mainly for training. The use of flight simulators is most common in the field of transport, allowing pilots to learn new procedures, refresh knowledge and pilot skills, and train situations that would be impossible to recreate in real flight. This is due to the excessive risk of losing health or life of the crew. Simulators allow for the implementation of most of the training for an aviation license, while reducing its time and cost [5].
One of the most important aspects of using the simulator in pilot training is fidelity. “Fidelity is a fundamental concept in simulator design and is comprised of three elements: physical fidelity, cognitive fidelity, and functional fidelity” [6]. A very detailed description of the simulator fidelity is presented in [6]. The most important thing, from the point of view of this article, is that “the first of them concerns the mapping of the cockpit environment, the appearance of the cabin, movements felt in the simulator. Cognitive fidelity concerns the possibility of recreating psychological and perceptive factors such as situational awareness, anxiety, stress, and decision making. Functional fidelity is defined as to what degree the simulator acts like the real equipment” [6]. Based on a meta-analysis, Vaden and Hall showed that using a simulator platform motion has positive effect on the transfer of pilot training [7]. Simulators can also be used to improve efficiency in general aviation, as shown in [8]. Researchers from Turkey [3] showed many advantages of using simulators for research work, including ensuring safety, cost reduction and environmental friendliness. In addition to research and training, to obtain an aviation license, simulators are also used for training, not only for licenses, but also for eco-driving [9].
Detailed information about the construction of the simulator used for research is presented in the third section of this article. In the fourth section, the research methodology is presented. The fifth and sixth sections are the most important parts, presenting the energy consumption. There are several scenarios, described in the methodology. In the conclusion, the method is discussed and further research topics are listed.
2. Motivation
Simulators are widely used in pilots training. Many Approved Training Organizations (ATOs) use simulators. This usually increases their attractiveness and flexibility. The individual functionalities of the simulator (visualization, motion) affect the fidelity of the device. Training using simulators is usually less expensive than training in an airplane. When analyzing the prices in selected ATOs, it can be concluded that the difference in price amounts to 40–60% per flight hour. However, no one analyzes whether the use of the selected configuration affects the price of the flight hour in the simulator.
There are no scientific studies available to estimate the energy consumption of flight simulators depending on flight conditions. In [5], the authors analyzed the energy consumption by motion systems of various platform configurations depending on the frequency of their movement. In the research, selected platforms were moved at a single frequency and the required platform powers were compared. It was shown that electrohydrostatic platform is more than four times better compared to a hydraulic one and that an electric platform is five times better than a hydraulic one.
Most of the scientific works show the possibility of using such devices without analyzing their energy consumption depending on flight phases, which does not allow for an unequivocal determination of their impact on the environment. Therefore, this study is a novel approach to the topic.
Therefore, four research questions were chosen for consideration:
- Does the use of the motion platform affect the energy consumption in a given air operation?
- Does the use of a different weather scenario in the simulator affect the energy consumption?
- Does the type of propulsion selected for simulation affect the energy consumption?
- Can there be a significant difference in the mileage energy consumption in relation to real aircraft (both those with piston engines, jet engines and fully electric)?
The answers to the first three research questions were obtained on the basis of the research conducted as part of the article. The results are therefore collected in the “results” section later in the paper. The last research question aims to elaborate on doubts about the economic benefits of using simulators. The answer was obtained on the basis of the research of other scientists cited in the paper. Therefore, the answer to the last research question can be found in the chapter “discussion”.
3. Flight Simulator Construction and Configuration Used to Research
Research was conducted on modern flight simulator CKAS Motion Sim 5 (Figure 1). The mentioned simulator is used by the Simulator Research Laboratory at Poznan University of Technology. This device was produced by the Australian company CKAS Mechatronics Pty Ltd. The producer says that: “It is a system that uses software and hardware that combines the reliability of a modern desktop computer equipment on a custom built motion platform, with a cockpit that provides control devices identical or similar to those found on the real aircraft” [10].
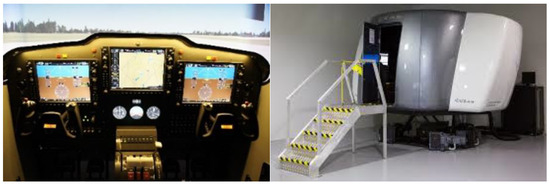
Figure 1.
CKAS Motion Sim 5 simulator.
This simulator is made to simulate four types of aircrafts. In the presented research, a piston single-engine and a light-jet aircrafts are chosen. Simulator can be certified as an EASA FNPT II MCC Flight Trainer (Flight Navigation and Procedure Trainer Multi Crew Coordination) although its appearance is reminiscent of FFS (Full Flight Simulator). From the legal point of view, CKAS MS5 simulator can only be certified as FNPT, but in terms of energy consumption it is the same as the FFS design. They differ only in the construction of the cockpit, which does not affect the results of presented research.
A more accurate description of the device was shown in articles published by our research group, for example in [11]. In research, the weather conditions were variable. There were three weather sets: CAVOK, rain and storm. CAVOK is “an abbreviation for Ceiling And Visibility OKay, indicating no cloud below 5000 ft (1500 m) or the highest minimum sector altitude and no cumulonimbus or towering cumulus at any level, a visibility of 10 km or more and no significant weather change” [12]. In our investigations, rain means 15 knots wind from a zero-degree direction and 8 knots near the ground, and that there are no gusts. At 2000 ft, there are a few (1/8) cumulus clouds; at 6000 ft the coverage is 7/8 (broken) clouds. Light and moderate turbulence and moderate rain precipitation also occur. The temperature at zero AMSL (Above Mean Sea Level) is 15 °C, QNH in 1013 hPa. The third weather combination is called storm. This means 30 knots of wind from a 90 degree direction with heavy turbulence and 20 knots near the ground, with moderate turbulence. At 1500 ft there are broken (5/8) cumulus clouds with moderate turbulence; at 8000 ft the coverage is 8/8 (overcast) thunderstorm clouds with severe turbulence. Rain precipitation is heavy. Temperature at zero AMSL is 15 °C; dew point is 5 °C and QNH in 985 hPa.
The weather is very important in aviation. It influences delays and can cause problems in flight. Analyses of weather conditions in aviation are shown in [13,14].
The device has a visual system which is formed of three projectors connected by three computers. A fourth computer is used to manage the simulation. The most important thing in an energy consumption system is the motion platform, which is a mechanism that creates the feelings of being in a real motion environment. Using an electrical motion system, the cab can be tilted by 18° and moved by 15 cm.
4. Research Methodology
4.1. Research Group
A group of 5 pilots took part in the research. Each of them had flight permissions—three were pilots with a PPL (Pilot Private Licence) license and two had a CPL (Commercial Pilot Licence) license. All pilots were men aged 19 to 23. Their average age was 20.8 and the standard deviation was 1.53. Their flight experience ranged from 45 to 240 h of flight time (M = 129, SD = 65, Min = 45, Max = 240, Mdn = 100). Each of the pilots was informed about the purpose of the research and could resign from it at any time. Before the measurement started, each of the pilots had time to familiarize themselves with the flight simulator and the configuration of the aircraft. After the flight readiness was declared, tests began. All tests were carried out between 10 am and 3 pm, and the pilots reported that they were refreshed and fully fit for flight.
4.2. Simulator Research Plan
The pilots had to perform 12 flights in the CKAS Motion Sim 5 flight simulator. The scenarios differed among themselves: the type of drive used, setting the weather conditions and enabling or disabling the motion platform. In each of the scenarios, the respondent’s task was to perform an aerodrome circuit at Clayton J. Lloyd International Airport (ICAO: TQPF) which is a small international airport located in the Caribbean. The pilots were informed that it was very important to maintain the repeatability of the circuits and they were to try to perform them as similarly as possible, keeping the route and flight altitude. Figure 2 shows a view of all the circuits made by one pilot on an airplane with a piston engine (Figure 2a) and flights of another pilot on an airplane with a jet engine (Figure 2b). Those figures are intended to refer to the repeatability of circuits. We carried out a statistical analysis of how the pilots performed subsequent attempts, but we also wanted to indicate how it was distributed for the sample trials. In order to make it easy to interpret the results, we decided to name the individual scenarios according to the scheme presented in Figure 3. Enabled in the motion section means that it was used in research; disabled means that platform was off.
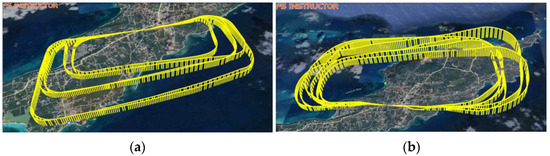
Figure 2.
The aerodrome circuits performed during test flights: (a) piston engine airplane, Pilot no.1; (b) very light jet airplane, Pilot no. 3.
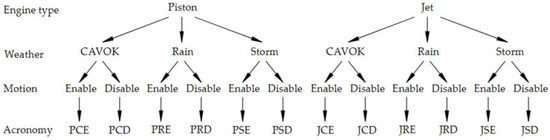
Figure 3.
Names of scenarios used in research which are a combination of engine type, weather set and motion system.
The propulsion was changed due to the capabilities of the simulator (indicated by the first letter in the acronym: P–piston, J–jet). It was assumed that its change should not change the energy consumption, but this requires a verification test.
Atmospheric conditions were chosen to differentiate the scenarios (indicated by the second letter in the acronym: C–CAVOK, R–rain, S–storm). This is due to the desire to verify whether the simulator has to make many more movements in order to reproduce the deteriorated weather conditions. In the “storm” setting, we deal with turbulence, which results in a higher amplitude of vibrations, and thus potentially higher energy consumption. In addition, computer units must perform more calculations to simulate the effects of increased winds and rain. The wind itself makes it difficult to steer the aircraft, which may affect the duration of the flight, and thus the energy consumption per circuit.
According to expectations, the motion system should be the most energy-consuming system. Its use is marked with a third letter in the acronym (E–enable, D–disable). In order to verify the assumptions, all scenarios were carried out with and without the use of motion to make a comparison possible.
4.3. Method of Measuring Energy Consumption
The energy consumption of the flight simulation system was based on the measurement of all electricity connections supplied to the elements of the CKAS MS5 system. The single-phase connection of the Motion system (80 A) was characterized by the highest maximum load. The second source of energy was a three-phase connection (16 A) for connecting a control and visualization unit based on a cluster consisting of five computing units. The whole of the above installation is connected in parallel with the UPS system, which allows for safe termination of the simulator operation after a power failure. Electricity meters were connected with the data archiving system in order to achieve the synchronization of the reading time equal to f = 1 Hz in relation to the simulator operation time. A schematic diagram of the tested installation is shown in Figure 4, which is the key one from the point of view of the measurement method.
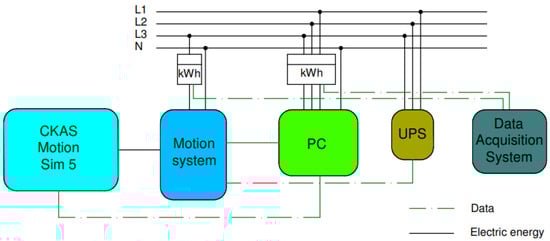
Figure 4.
Electric energy measurement system used in tests on the CKAS Motion Sim 5 simulator.
5. Results
5.1. Flights Length and Repeatability
Detailed information on the parameters of performed flights is summarized in Table 1 for the piston engine aircraft and Table 2 for the jet engine aircraft. The names of the scenarios from the diagram presented in Figure 3 were used. In the tables, the repeatability of the aerodrome circuits made by the pilots was checked. In the case of airplanes with piston engines, the highest repeatability was achieved by pilot No. 4 (SD = 0.107), and the lowest for pilot No. 1 (SD = 1.116). The average length of the circle for all pilots was 9.4 NM. In the case of aerodrome circuit performed on an airplane with a jet engine, pilot No. 3 (SD = 0.922) had the highest repeatability, and pilot No. 1 (SD = 2.797) the least (SD = 2.797). However, it should be taken into account that pilots have much more experience in flying airplanes with piston engines, hence there are greater discrepancies in the case of jet engines. The average circuit length for jet airplanes flights is 20.6 NM.

Table 1.
The length of the circuit for individual pilots in flights on an airplane with a single piston engine.
Table 2.
The length of the circuit for individual pilots in flights on an airplane with a jet engine.
Figure 5 summarizes the lengths of circuits for all pilots in all scenarios, whose names correspond to those presented in the diagram (Figure 3). Notably, only in the case of one pilot was it possible to maintain relative repeatability in all operations. A definite difference can be seen in the length of the aerodrome circuits made on piston and jet airplanes. This is understandable and is related to the rules of building a circuit depending on the parameters of the aircraft. Therefore, from the point of view of further work, it is more important to maintain repeatability in individual groups (distinguished by the type of aircraft).
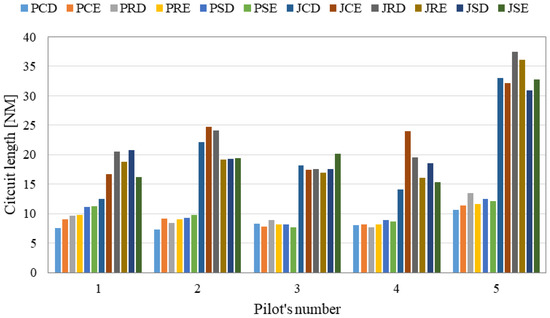
Figure 5.
Aerodrome circuits length for each pilot in all scenarios analyzed in research.
5.2. Energy Consumption Depending on Simulation Configuration
In order to estimate energy consumption in aerodrome circuit flights for all 12 scenarios and for each of the five pilots, we decided to summarize the average energy consumption in all scenarios according to their previously adopted nomenclature. First, we decided to check how the energy consumption changes depending on the use of the motion platform in flight. Figure 6 presents a summary of the average measurement results. On the left side (green columns) the flights without using the motion platform were collected; on the right side (blue columns) the flights with enable motion platform were collected. The average energy consumption for all flights without motion platform was 0.308 kWh per operation. In the flights with motion, this result was 40% higher and amounted to 0.431 kWh per operation. The error bars in Figure 6, Figure 7 and Figure 8 represent the lowest and highest value recorded during the measurements.
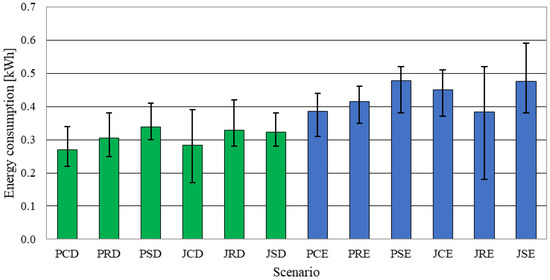
Figure 6.
Energy consumption depending on the use of the motion platform.
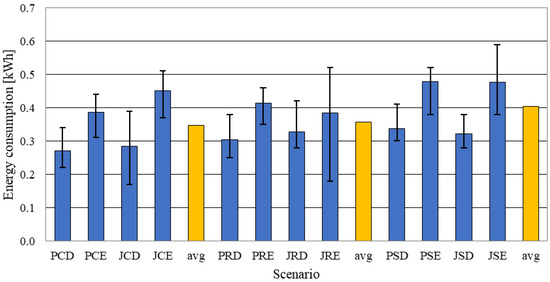
Figure 7.
Energy consumption depending on simulated atmospheric conditions.
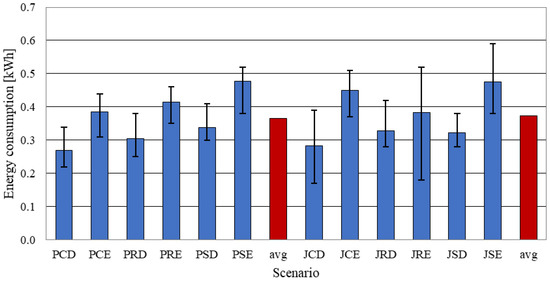
Figure 8.
Energy consumption depending on the airplane propulsion selected in the simulation.
When analyzing the impact of selected weather conditions, we decided to list all flights grouped in terms of weather conditions (Figure 7). The average value recorded at this weather setting was also added, and is marked with an orange column. There were no significant differences in energy consumption depending on weather conditions. For CAVOK the average consumption was 0.35 kWh per operation, 0.36 kWh in rain and 0.4 kWh in storm.
No impact of the type of propulsion used on energy consumption in individual scenarios was observed. Figure 8 shows the results classified by propulsion type. On the left side there are tests conducted on an airplane with a piston engine aircraft; on the right side are the tests conducted on a jet-engine airplane. The red columns represent the mean obtained from all circuits in a given simulator configuration. The average consumption for both piston and jet engine aircrafts was 0.37 kWh/operation.
6. Discussion
It is believed that electric vehicles or devices produce zero emissions. Of course, this is not true, as is particularly emphasized in The Well-To-Wheels (WTW) methodology. For passenger cars, a comparison of conventional and electric propulsion shows that energy consumption can be reduced by around 50% for gasoline engines and 60% for compression ignition engines [15].
In the case of electric-powered airplanes, it has been shown that the energy consumed depends on the target range of the airplane. The larger it is, the more batteries must be on board [16]. This is associated with an increase in its mass and the demand for final power. As a solution, the authors present the use of batteries with higher energy densities. By doubling this parameter, the range is increased by over 60%. The work carried out by [17] shows that the use of electric planes on short-haul flights would reduce the energy consumption by more than 72%.
As shown above, the use of electric-powered airplanes reduces exhaust emissions in the vicinity of airports. The popularity of this type of drive is steadily increasing, but it should be remembered that they are still in the minority today. So, the alternative is to use flight simulators—of course, in terms of aviation training and to the extent that is legally allowed and methodically justified. Importantly, in the global view, this emission still occurs, for example in the vicinity of the power plant. The problem of environmental protection is very noticeable in air transport. It is estimated that aviation energy consumption increases by about 2% annually [18].
Figure 9 shows energy consumption for different modes of transport. For comparison, we chose passenger cars (PC, marked by orange color), general aviation aircrafts (GAA, marked by blue color) and flight simulator test result made on CKAS Motion Sim 5 (MS5, marked in yellow).
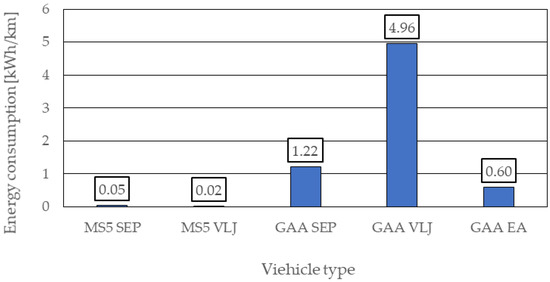
Figure 9.
Comparison for different modes of transport: passenger cars, general aviation aircrafts and flight simulator test result made on CKAS Motion Sim.
The calculations presented in the above chart are based on the research results from this publication and the available literature sources. In many research and development centers around the world, research is carried out to assess the emissivity and energy consumption of various means of transport or devices. Airplanes used in general aviation were analyzed successively. The SEP (single-engine piston) plane was selected for comparison. The Aircraft Owners and Pilots Association [19] website was used to obtain data on energy demand per kilometer of flight. The Cessna 172 aircraft was selected in the SEP group. The selection was due to the fact that it is one of the types of aircraft that can be simulated in the CKAS MS 5 simulator. AOPA materials indicated that the average fuel consumption for this aircraft is 14 dm3/100 km. This value was related to the high heating value of Avgas 100LL fuel and the obtained energy consumption was 1.22 kWh/km. The Hawker 400 plane was adopted as the VLJ (Very Light Jet) airplane. It is a jet aircraft capable of carrying 7–9 passengers. It is one of the aircraft types that can also be simulated in the CKAS MS 5 (as VLJ). The fuel consumption of this aircraft is 52.1 dm3/100 km, which means that the energy consumption is almost 5 kWh/km. The analysis did not omit the electric plane. A study by scientists from Prague was used, in which they compared the energy consumption of an electric plane with the energy consumption of an airplane with a piston engine [20]. An algorithm for determining the energy needed to drive the modernized aircraft was used. For this purpose, the aerodynamic parameters of the Cessna 172 aircraft were used for comparison. An additional mass of the batteries was introduced, which was set at the level of 350 kg. The last element of the list in Figure 9 are the results of the research carried out for the purposes of this study. The energy consumption for the flight of the simulated piston engine and VLJ aircraft is presented. The results part indicates that there are no differences in energy consumption due to the type of engine selected in the simulation. The differences in this table are due to the comparison of the results to the unit kWh/km. As shown in Figure 5 and in Table 1 and Table 2, the operations of the aerodrome circuit differed in length depending on the type of propulsion. The average length of this operation for SEP was approx. 9 NM, and for VLJ approx. 20 NM. This resulted in different energy consumption (0.05 kWh/km for SEP, 0.02 kWh/km for VLJ).
The summary of this comparison shows that the use of flight simulator reduces energy consumption by 97% in relation to the airplane. Notably, the engine of the VLJ airplane consumes three times more energy than the engine of the SEP airplane, referring the result to the unit of distance. In the case of the simulator, the tests showed that the aerodrome circuit made on the VLJ requires about 50% less energy than the SEP simulation.
7. Conclusions and Further Works
The research described in the article showed that the simulators consume less energy than any of the analyzed means of transport (even electric planes). This statement may seem obvious, but there are no reliable sources in the literature indicating such dependencies. The use of simulators in the process of training future pilots and improving the qualifications of active pilots is widely mentioned; however, apart from training and economic properties, attention should be paid to the ecological benefits of such a solution. However, a very important feature of simulators, which is fidelity, should be emphasized—only well-mapped simulators are allowed to replace part of the training. However, if the fidelity of the device is proven and the legal regulations regarding the use of simulators in the course of training or pilots’ career are met, the full benefits can be achieved.
The paper provides answers to the four research questions presented at the beginning. In the first one, it was considered whether the use of the motion platform affects the energy consumption in a given air operation. Analyses have shown that there is a significant difference in energy consumption. This is of particular importance in terms of economic criteria. Simulators equipped with a platform are definitely more expensive to buy and maintain than stationary ones. Such a large difference in energy consumption (up to 40% more) definitely increases the cost of training, without significantly increasing its possibilities. Therefore, it is necessary to consider the need and legitimacy of purchasing a device with a motion platform on a case-by-case basis.
The second question concerned the application of different weather scenarios. It was shown that the selected scenario does not affect energy consumption. The weather is especially important because in real conditions it is necessary to wait for desired conditions. In the case of simulators, it is possible to change them immediately as needed. For some licenses, the vast majority of training must be conducted under IMC (Instrument Meteorological Conditions). This means weather conditions below the minimum prescribed for flight under Visual Flight Rules (VFR). If the research showed a significant difference, the cost of such training could be several dozen percent higher.
The third research question concerned the type of propulsion selected for simulation. As expected, studies have shown that the type of propulsion has no effect on energy consumption. This result was expected as it is one simulator in two configurations. Changing this type of settings should not change the energy consumption, so this result confirms the correctness of the tests carried out.
The last of the research questions is the economic and ecological justification for the use of simulators in selected parts of aviation training. It has been shown that their use allows a 97% reduction in energy consumption, which can realistically translate into economic (training costs) and environmental savings (reducing the negative impact of aviation on the vicinity of airports). More on emissions in the vicinity of the airport can be found in [21,22].
The paper also indicates that electricity is the future of general aviation. This was the basis for the studies cited in the paper, especially in the discussion part.
Summarizing the most important information of the article, it can be stated that:
- Energy consumption in the initial stages of pilot training can be reduced by 97% by using flight simulators compared to aircraft training;
- Flight simulator configuration can change energy consumption by up to 50%;
- The deterioration of weather conditions during the simulation brings an increase in energy consumption by 14% when motion is disabled and 18% when motion is enabled;
- The use of the motion system increases energy consumption by up to 40%, depending on the simulated weather conditions.
In the future work of the research group, an attempt will be made to assess the emissivity of individual means of transport. The issue will be calculated throughout the process, in line with the WTW methodology. Particular emphasis will be placed on the use of simulators in the process of educating future pilots and determining the didactic, economic and environmental benefits associated with their use.
Author Contributions
Conceptualization, analysis, methodology, M.G., M.G.-G. and R.J.; investigation M.G.-G. and M.G.; writing—review and editing, M.G.-G., M.G. and R.J. All authors have read and agreed to the published version of the manuscript.
Funding
This research was funded by Rector of Poznan University of Technology, grant number 33/32/SIGR/0004, entitled “Development of methodology guidelines for effective reduction of particulate matter of pollution by in the Poznan area”.
Institutional Review Board Statement
Not applicable.
Informed Consent Statement
Informed consent was obtained from all subjects involved in the study.
Conflicts of Interest
The authors declare no conflict of interest.
References
- Kurzawska, P.; Jasiński, R. Overview of sustainable aviation fuels with emission characteristic and particles emission of the turbine engine fueled ATJ blends with different percentages of ATJ fuel. Energies 2021, 14, 1858. [Google Scholar] [CrossRef]
- Hays, R.T.; Jacobs, J.W.; Prince, C.; Salas, E.; Hays, R.T.; Jacobs, J.W.; Prince, C.; Salas, E.; Hays, R.T.; Jacobs, J.W.; et al. Flight Simulator Training Effectiveness: A Meta-Analysis. Mil. Psychol. 1992, 4, 63–74. [Google Scholar] [CrossRef]
- Eryilmaz, U.; Sancar Tokmak, H.; Cagiltay, K.; Isler, V.; Eryilmaz, N.O. A novel classification method for driving simulators based on existing flight simulator classification standards. Transp. Res. Part C Emerg. Technol. 2014, 42, 132–146. [Google Scholar] [CrossRef]
- Itoh, E.; Fukushima, S.; Hirabayashi, H.; Wickramasinghe, N.K.; Toratani, D. Evaluating energy-saving arrivals of wide-body passenger aircraft via flight-simulator experiments. J. Aircr. 2018, 55, 2427–2443. [Google Scholar] [CrossRef]
- Kozuba, J.; Bondaruk, A. Flight simulator as an essential device supporting the process of shaping pilot’s situational awareness. In Proceedings of the International Conference of Scientific Paper AFASES 2014, Brasov, Romania, 22–24 May 2014. [Google Scholar]
- Myers, P.L.; Starr, A.W.; Mullins, K. Flight simulator fidelity, training transfer, and the role of instructors in optimizing learning. Int. J. Aviat. Aeronaut. Aerosp. 2018, 5. [Google Scholar] [CrossRef] [Green Version]
- Vaden, E.A.; Hall, S. The effect of simulator platform motion on pilot training transfer: A meta-analysis. Int. J. Aviat. Psychol. 2005, 15, 375–393. [Google Scholar] [CrossRef] [Green Version]
- Galant, M.; Nowak, M.; Kardach, M.; Maciejewska, M.; Łęgowik, A. Using the simulation technique to improve efficiency in general aviation Using the Simulation Technique To Improve Efficiency in General Aviation. AIP Conf. Proc. 2019, 2078, 20097. [Google Scholar] [CrossRef]
- Wu, Y.; Zhao, X.; Rong, J.; Zhang, Y. The effectiveness of eco-driving training for male professional and non-professional drivers. Transp. Res. Part D Transp. Environ. 2018, 59, 121–133. [Google Scholar] [CrossRef]
- Merkisz, J.; Galant, M.; Bieda, M. Analysis of operating Instrument Landing System accuracy under simulated conditions. Sci. J. Sil. Univ. Technol. Ser. Transp. 2017, 94, 163–173. [Google Scholar] [CrossRef]
- Galant, M.; Merkisz, J. Analysis of the possibilities of using EEG in assessing pilots’ psychophysical condition. Sci. J. Sil. Univ. Technol. Ser. Transp. 2017, 95, 39–46. [Google Scholar] [CrossRef]
- World Meteorological Organization. Aerodrome Reports and Forecasts: A Users’ Handbook to the Codes; World Meteorological Organization: Geneva, Switzerland, 2008; ISBN 9789263107824. [Google Scholar]
- de Oliveira, M.; Eufrásio, A.B.R.; Guterres, M.X.; Murça, M.C.R.; de Arantes Gomes, R. Analysis of airport weather impact on on-time performance of arrival flights for the Brazilian domestic air transportation system. J. Air Transp. Manag. 2021, 91, 101974. [Google Scholar] [CrossRef]
- Chen, Z.; Wang, Y.; Zhou, L. Predicting weather-induced delays of high-speed rail and aviation in China. Transp. Policy 2021, 101, 1–13. [Google Scholar] [CrossRef]
- Moro, A.; Lonza, L. Electricity carbon intensity in European Member States: Impacts on GHG emissions of electric vehicles. Transp. Res. Part D Transp. Environ. 2018, 64, 5–14. [Google Scholar] [CrossRef] [PubMed]
- Gnadt, A.R.; Speth, R.L.; Sabnis, J.S.; Barrett, S.R.H. Technical and environmental assessment of all-electric 180-passenger commercial aircraft. Prog. Aerosp. Sci. 2019, 105, 1–30. [Google Scholar] [CrossRef] [Green Version]
- Baumeister, S.; Leung, A.; Ryley, T. The emission reduction potentials of First Generation Electric Aircraft (FGEA) in Finland. J. Transp. Geogr. 2020, 85, 102730. [Google Scholar] [CrossRef]
- Seymour, K.; Held, M.; Georges, G.; Boulouchos, K. Fuel Estimation in Air Transportation: Modeling global fuel consumption for commercial aviation. Transp. Res. Part D Transp. Environ. 2020, 88, 102528. [Google Scholar] [CrossRef]
- AOPA. Available online: www.aopa.org (accessed on 20 October 2021).
- Hospodka, J.; Bínová, H.; Pleninger, S. Assessment of all-electric general aviation aircraft. Energies 2020, 13, 6206. [Google Scholar] [CrossRef]
- Galant-Gołębiewska, M.; Jasiński, R.; Ginter, M.; Maciejewska, M.; Nowak, M.; Kurzawska, P. Methodical aspects of the lto cycle use for environmental impact assessment of air operations based on the Warsaw chopin airport. Aviation 2021, 25, 86–91. [Google Scholar] [CrossRef]
- Nowak, M.; Jasiński, R.; Galant, M. Implementation of the LTO cycle in flight conditions using FNPT II MCC simulator. IOP Conf. Ser. Mater. Sci. Eng. 2018, 421, 42060. [Google Scholar] [CrossRef] [Green Version]
Publisher’s Note: MDPI stays neutral with regard to jurisdictional claims in published maps and institutional affiliations. |
© 2022 by the authors. Licensee MDPI, Basel, Switzerland. This article is an open access article distributed under the terms and conditions of the Creative Commons Attribution (CC BY) license (https://creativecommons.org/licenses/by/4.0/).