Abstract
Ammonia combustion is a promising energy source as a carbon free fuel without greenhouse gas emissions. However, since the auto-ignition temperature is 651 degrees Celsius and the range of flammability limit is not wide compared to other fuels, fundamental studies on ammonia fires have rarely been conducted so far. Therefore, this study aims to numerically estimate fire spread characteristics when ammonia fuel in a high-pressure state leaks to the outside, especially focusing on the flammability limit according to oxygen concentration. Three kinds of reaction mechanism for numerical analysis were adopted to compare the flame structure, flammability limit, and combustion characteristics. Plank-mean absorption coefficients of nitrogen species were taken for the radiation model, in addition to the optically thin model. The effect of radiation heat loss could be identified from the maximum flame temperature trend at a low strain rate. It was confirmed that the pyrolysis of ammonia in the preheated zone results in hydrogen production, and the generated hydrogen contributes to heat release rate in the flame zone. It is found that the contribution of hydrogen would be an important role in the flammability limit of ammonia combustion. Finally, Karlovitz and Peclet numbers showed well the extinction behaviors of ammonia combustion as a result of LOC (Limit Oxygen Concentration) analysis as a function of global strain rate.
1. Introduction
In most countries, multipronged efforts are being made to strengthen the global response to the climate change issue. The reduction of greenhouse gases (GHG) is one of the priority targets for holding the increase in global average temperature. In order to achieve the global demand, it is essential to replace present fossil fuels with renewable energy sources, such as wind, solar, and carbon-free fuels.
Carbon-free fuel refers to fuel with zero carbon emission in the process of fuel production and consumption, such as biofuel, hydrogen, and ammonia. In the case of biofuel, since biomass used for fuel production absorbed carbon dioxide, carbon dioxide emissions from the perspective of the fuel life cycle becomes zero. However, considering that most biomass is used as food, there is a disadvantage that it can cause food shortages in developing countries. Biogas can also be produced from natural gas; however, it has a disadvantage of capturing and treating carbon dioxide emitted during the extraction process. Hydrogen is known as the most ideal fuel to achieve zero carbon emissions; however, the high-level technology of cryogenic liquefaction and the risk of explosion are considered as major difficulties in hydrogen utilization.
Meanwhile, ammonia (NH3) is one of the promising alternative fuels because of zero emissions from the combustion process. NH3 also has attractive features, which include easy transportation through liquefaction, high density of hydrogen carrier, and can be used as a fuel without the hydrogen extraction process [1]. In particular, as the hydrogen carrier, it is more competitive than liquefied hydrogen and liquid organic hydrogen carrier (LOHC), and is suggested as the most realistic alternative. Converting hydrogen into an ammonia-type compound has the advantage of increasing storage density by about 1.5 times and can be easily liquefied at room temperature with 8 atmosphere [1]. However, field managers only pay attention to human inhalation at industrial sites because ammonia gas is highly toxic, and are satisfied with the installation of ventilation and purification systems without additional fire safety devices. Thereby, fires or explosions often occur despite the limited flammable range due to negligence of fire prevention measures [2].
Since 1985, 71 cases of ammonia-related accidents have occurred at industrial sites [2]. In particular, in 2013, a large explosion at an ammonia plant in Louisiana, USA, killed one person and injured more than 10 people [3]. In 2000, three people were also killed in fires and explosions at the same factory; both accidents are known to have avoided casualties even if they were equipped with NH3 detection sensors. Therefore, it is an example that clearly shows that employees need to pay attention to the flammability and explosion of ammonia gas and that facility safety devices are essential.
Ammonia is a combustible gas; however, compared to other alternative fuels, the lower flammability limit is high and the flammable range is not wide, as shown in Figure 1 [4,5]. Since the minimum ignition energy (MIE) is 680 mJ, which is more than 2000 times higher than methane, the probability of auto-ignition from ammonia is very difficult compared to other fuels. Nevertheless, ammonia is lighter than environmental air and has a faster diffusion rate, so if it leaks from a high-pressure storage container, the damage is expected to be significant. In addition, it is urgent to establish fire prevention measures as the frequency of use for various purposes in industrial sites is increasing as the alternative storage medium of hydrogen, the refrigerant, and the reactant of combustion exhaust gas for post-treatment [1].
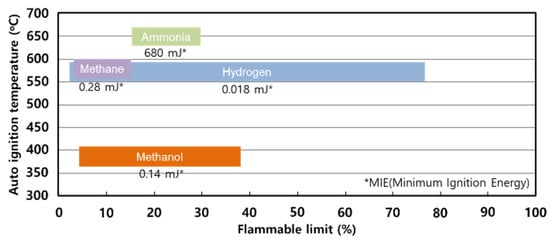
Figure 1.
Flammable range of various alternative fuels.
To date, previous studies on ammonia have mainly focused on post-treatment of combustion exhaust gases related to NOx formation and its reduction [6,7,8,9], oxidation, and pyrolysis [10,11,12,13,14]. Since the research on the combustion characteristics of ammonia fuel focuses only on the evaluation of combustion stability in ammonia–hydrogen blends [15,16], it is not easy to be analyzed for fire accidents due to ammonia leakage.
Therefore, in this study, 1-D numerical analysis was performed by adopting atmospheric pressure and leak velocity as evaluation factors to establish possible fire suppression measures when ammonia leaks from high-pressure storage containers. In order to clarify fire characteristics, it will be estimated on the flame extinction limits based on the comparison of three kinds of reaction mechanism.
2. Research Scope
An objective of this study is to present an operating condition of a system that controls an oxygen concentration in the surrounding environment in which a high-pressure tank of NH3 is installed to fundamentally block fire accidents. More specifically, it is intended to completely eliminate the possibility of fire and explosion by immediately controlling the oxygen concentration of external air during gas leakage by presenting limiting oxygen concentration (LOC) in accordance with a gas leakage velocity and an external pressure.
Figure 2a is a schematic diagram of a fire prevention system for the ammonia tank. As shown in the figure, the fire prevention system consists of a nitrogen supplier to reduce oxygen concentration in a closed room where ammonia tanks can be stored, a concentration meter to measure oxygen concentration, a pressure control mechanical ventilation system to maintain constant pressure in the room, and a control system to manage the entire system. The system control plan is as follows:
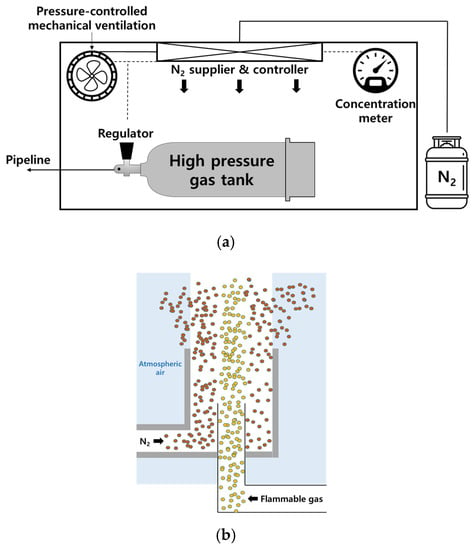
Figure 2.
Schematic diagram of (a) fire prevention system for ammonia tank and (b) ventilation system composed of coaxial flow structure proposed in this study.
- (1)
- Normally, the oxygen concentration in the room is maintained at the out of flammability limit, and the pressure in the room is fixed at atmospheric pressure with the pressure control mechanical ventilation system;
- (2)
- When an abnormal pressure reduction is detected in an ammonia regulator, a large amount of nitrogen is supplied into the room and the ventilation fan for pressure control is operated to maintain a constant pressure, enough to structurally endure the internal pressure in the room;
- (3)
- Based on the LOC chart, the amount of internal gas emitted and nitrogen supplied is determined to prevent secondary fires that may occur on the outside due to the emitted ammonia and external air;
- (4)
- The ventilation system is composed of a coaxial structure as shown in Figure 2b, the inner pipe emits flammable gas, and the outer pipe surrounds nitrogen to prevent secondary fire and suppresses and discharges the contact between the flammable gas and atmospheric air as much as possible.
In order to apply the fire prevention system of the ammonia tank, two operating standards are required: one is LOC according to internal pressure of the system and the other is LOC according to gas leakage velocity. Therefore, in this study, we intend to provide LOC chart for ammonia combustion by adopting two variables of pressure and gas leakage velocity.
3. Computational Method
3.1. Tested Conditions
In this study, in order to simulate a fire caused by ammonia leakage in a high-pressure storage tank, a counterflow flame geometry was adopted as shown in Figure 3. The counterflow configuration has been widely used to acquire the information of flame structure and flammability limit. In particular, counterflow flames are the most commonly adopted method in the evaluation of flammability limit, and many studies have been conducted so far [17,18,19]. A fuel and an oxidizer are ejected from two nozzles facing each other to form a stagnation plane, and a diffusion flame is formed on a surface close to the oxidizer nozzle. The diffuse flame is generated by chemical reactions and the flame surface area extends along the stagnation plane by the flow of fuel and oxidizer. In particular, since the configuration of counterflow combustion field can be described as a 1-D structure, detailed flame structure could be examined with relatively less calculation time consuming when detailed chemistry and reaction mechanisms are adopted.
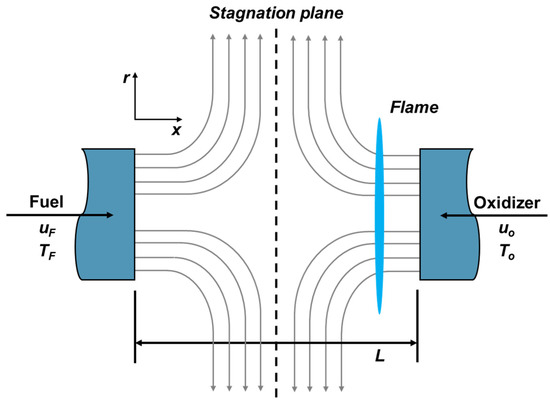
Figure 3.
Schematic geometry of counterflow diffusion flame for simulation.
Ammonia is supplied from the fuel nozzle and O2-N2 mixed gas is supplied from the oxidizer side. The nitrogen–oxygen ratio was controlled to induce flame extinction. The O2 mole fraction is defined as the limit oxygen concentration (LOC) when the flame extinction occurs.
Three detailed reaction mechanisms (GRI 3.0, Nakamura, Okafor) [20,21,22] were adopted to compare and examine closely the flame structure, flammability limits, and combustion characteristics. The optically thin model [23] was used to apply radiation heat loss from CO2, CO, CH4, and H2O. However, Plank-mean absorption coefficients (PMACs) for nitrogen species are not available in optically thin models. Thus, PMACs of nitrogen species were taken from HITRAN 2008 data base [24,25].
Fuel and oxidizer were supplied with the conditions of 298 K and 1~3 atm. The range of global strain rate is 5 < ag > 300, and it is defined [26] as:
where u and ρ denote the flow velocity and density, respectively, and subscripts O and F represent the oxidizer and fuel streams. The velocities of both fuel and oxidizer stream are kept as same value. L indicates the distance between both nozzles and was fixed as 2 cm.
3.2. Verification of Detail Chemical Reaction Mechanisms
In order to experimentally verify the three detailed chemical reaction mechanisms adopted in this study, a comparative evaluation was conducted with the experimental data measured in previous studies [27,28,29,30,31,32]. Figure 4 shows laminar burning velocities in the ammonia–air premixed gases measured by Takizawa et al. [27] and Pfahl et al. [28] with the calculation results of the three reaction mechanisms adopted in this study. As shown in Figure 4, the Okafor mechanism [22] showed the closest value to the experimental results, and the Nakamura mechanism [21] showed the lowest prediction rate.
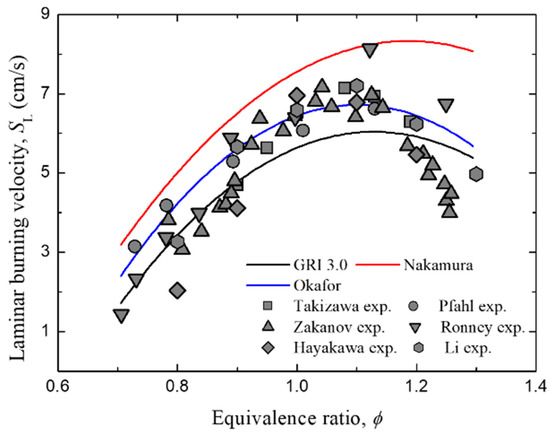
Figure 4.
Comparison of the computed (line) and measured (symbols) laminar burning velocity as a function of equivalence ratio for ammonia–air mixture.
In the case of the Okafor mechanism, the flame propagation velocity seems to be very well predicted because the validation was performed at CVCC (Constant Volume Chamber), which can measure the one-dimensional flame propagation velocity with great precision. On the other hand, for the Nakamura mechanism, since the validation was conducted at a micro flow reactor, the prediction rate of flame propagation velocity is somewhat low, but the prediction rate for flammability limits related to ignition and extinction is known to be significantly high. In addition, the prediction rate of the flame propagation velocity under the lean condition is not significantly low. Finally, for GRI mechanism, detailed chemical reaction mechanisms were developed targeting hydrocarbon fuels, so the calculated flame propagation velocity is well predicted with the experimental results at all equivalence ratios but shows quite different ignition characteristics from the other mechanisms [21]. Nevertheless, all three mechanisms obtained a C-curve similar to the experimental results, thereby it can be seen that they well predict the laminar burning velocities in the ammonia–air premixed gases.
4. Computational Results
4.1. Distribution of Adiabatic Flame Temperature and Concentration of Major Species
To estimate thermal properties and combustion characteristics of ammonia fuel, counterflow diffusion flame characteristics according to global strain rate were analyzed. Figure 5 shows maximum flame temperature variation as a function of global strain rate and pressure at XO = 0.21 with various reaction mechanisms. As shown in Figure 5, the adiabatic flame temperature decreased in the order of Okafor, Nakamura, and GRI in the overall global strain rate, and the maximum flame temperature occurred at a turning point between ag = 20~25 s−1. The low strain rate (ag < 20 s−1) flame extinction is responsible for radiative heat loss and the maximum flame temperature beyond the turning point (ag > 25 s−1) decreases with the global strain rate because of the high strain.
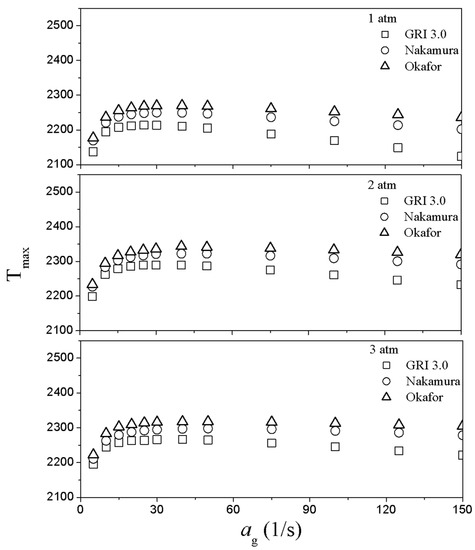
Figure 5.
Maximum flame temperature as a function of global strain rate and pressure at XO = 0.21 with various reaction mechanisms.
Generally, the theoretical flame extinction behaviors at the global strain rate is due to radiative heat loss due to an infinite burner distance at the low global strain rate before the turning point, and the other flame extinction phenomenon at the high strain rate occurs due to flame stretch. Therefore, the identical gas composition has a C-curve form with the turning point [33]. In the case of low strain rate, the flame extinction occurs at flame sheet condition in 1-D similarity concept because the flame thickness can be inversely proportional to the global strain rate and the radiation heat loss depends on the flame thickness. On the other hand, in the case of high strain rate, flame extinction is mainly affected by flame stretching rather than the radiation heat loss [33,34]. In Figure 5, the maximum flame temperature trend also shows a C-curve, which well corresponds with the 1-D similarity concept [33]. It also shows that the radiation mode applied to the reaction mechanisms for this study works effectively.
Figure 6 shows the profiles of mole fraction of major species and the heat release rate (HRR) profile as a function of distance from the fuel nozzle with various strain rates and ambient pressures. The graphs are arranged in the order of the calculation results adopting mechanisms of GRI, Nakamura, and Okafor from the left to the right. Considering Figure 6a, NH3 and O2 are consumed at reaction zone, which results in HRR rise. Interestingly, when ammonia fuel diffuses to the reaction zone, it is pyrolyzed due to the preheating effect from the flame to produce hydrogen.
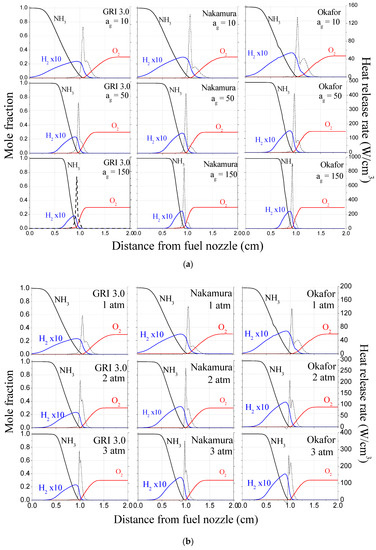
Figure 6.
Mole fractions of major species and heat release rate (HRR) with distance from fuel nozzle (a) various strain rate of ag = 10, 50, 150 s−1 at a constant pressure of 1 atm, (b) various ambient pressure of P = 1, 2, 3 atm at a constant strain rate of ag = 10 s−1; It is arranged in the order of mechanisms of GRI, Nakamura, and Okafor from the left to the right.
In general, it is known that a large amount of hydrogen is generated when ammonia is pyrolyzed at the reaction temperature of about 1100~1200 K [35,36], and it is decomposed as follows:
As a result, due to a large amount of hydrogen generated from the preheating zone in front of the flame, ammonia combustion undergoes a process of simultaneously performing a chemical reaction containing nitrogen hydrides and hydrogen. Additionally, two peaks of HRR profiles are formed in all cases as shown in Figure 6a, and this trend is more clearly shown at low strain rates. To clarify this point, Figure 7 shows binary diffusion coefficients of H2 and NH3 with various ambient pressures when oxygen was adopted as bath gas [37]. As shown in the Figure 7, the diffusion coefficient of H2 (0.816 cm2/s) at 1 atm is about four times higher than that of NH3 (0.219 cm2/s). This indicates that when H2 diffuses into the oxidizer, the penetration depth is relatively larger than that of NH3, which has the effect of increasing the thickness of the reaction zone. Therefore, two peaks in HRR profiles may be observed due to such difference of diffusion coefficients between these two species. Additionally, those HRR profiles imply that not only the ammonia but hydrogen produced by pyrolysis also participates in combustion reaction and contribution to HRR.
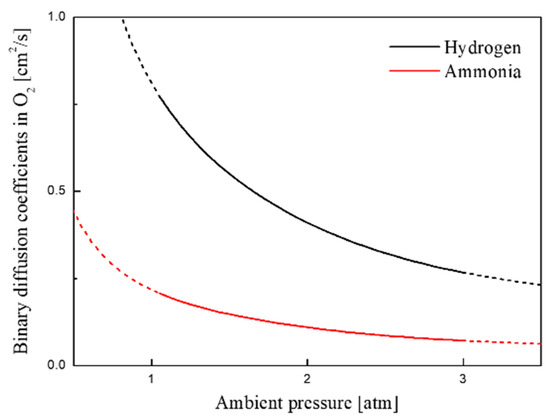
Figure 7.
Binary diffusion coefficients in O2 of H2 and NH3 with various ambient pressures.
When we compare and analyze the applied mechanisms, the derived HRR values are listed in the order of large followed by Nakamura, Okafor, and GRI. Here, Nakamura and Okafor mechanisms derive similar values, while HRR values of GRI are relatively low. Since the GRI mechanism is designed exclusively for CH4 fuel, the chemical reactions of hydrocarbon fuels are well predicted [20]; however, the prediction rate is significantly lower for nitrogen hydrides. On the other hand, in the case of Nakamura and Okafor mechanisms, exclusively designed ammonia fuel [21,22], the prediction rate is relatively higher than that of GRI, and the calculation results of both mechanisms are very similarly derived.
When the global strain rate increases, the mole fraction of hydrogen production reduces because the pyrolysis process becomes limited owing to reduced preheated zone. In general, it is known that an increase in strain rate narrows the preheating zone because the convection and diffusion time of the reactant flowing into the flame surface area decreases [33]. As a result, it can be understood that the flame temperature decreases along with the decreased hydrogen production due to pyrolysis. Nevertheless, as the global strain rate increases, the HRR value in the reaction region increases since the number of reactants per unit time entering to the flame surface increases.
Meanwhile, the results of GRI show a large difference from the flame temperature results derived from other mechanisms at high global strain rates, as shown in Figure 5, because the first peak of the heat release rate was relatively low, as shown in Figure 6a. The reason for this is that, as mentioned earlier, the GRI mechanism is designed exclusively for CH4, so the ammonia pyrolysis process is not well described. As a result, it can be seen that the scale of hydrogen production in GRI only is abnormally larger than that of other mechanisms in Figure 6a.
Figure 6b illustrates the mole fraction of major species and HRR according to various pressures at fixed strain rates (ag = 10 s−1). Overall, it can be seen that as the ambient pressure increases, HRR indicated in two peaks merge into one peak. This is because the difference in the diffusion coefficient between H2 and NH3 decreases. In general, the higher pressure causes the denser the molecules, the less the free path length of the species, and the slower diffusion rate. Figure 7 shows that in both species, the binary diffusion coefficient decreases as the pressure increases. In particular, at 3 atm, the difference in diffusion coefficients between the two species is significantly reduced. Additionally, the penetration depth of hydrogen into oxidizer is significantly reduced as the pressure increases. Thereby, it can be understood that two peaks of HRR are merged.
In addition, it was found that the area of the mole fraction of hydrogen produced by pyrolysis decreased. For this reason, as ambient pressure increases, the density of the reactants increases and the chemical reaction rate enhances due to the increased density of the reactants, resulting in a narrow reaction region consuming the reactants within a finite chemical reaction time. Therefore, due to the narrowed reaction area, the preheating section is reduced, and hydrogen production due to ammonia pyrolysis is bound to decrease. Additionally, the HRR profile increases sharply as ambient pressure increases due to the high reaction rate and the narrowed reaction region.
With ambient pressure increases, the HRR results of the Nakamura mechanism differ from the GRI and Okafor mechanisms. For this reason, as mentioned in Section 3.2, the Nakamura mechanism basically performed the verification based on the experimental results in the micro flow reactor. In other words, verification was not conducted under various pressure conditions. On the other hand, in the case of the Okafor mechanism, since the verification was conducted based on the experimental results in CVCC with various pressure, the combustion properties were well predicted at 2 atm and 3 atm.
4.2. Change in LOC According to Ambient Pressure and Global Strain Rate
Figure 8 shows the limit oxygen concentration (LOC) variation as a function of global strain rate with various ambient pressures for each reaction mechanism. The LOC curve increases with global strain rate regardless of ambient pressure. This implies that with the global strain rate increases, the flammability limit narrows and flame extinction by control of oxygen concentration can be induced relatively easily. The LOC calculated by the Nakamura mechanism has the highest flammability, followed by Okafor and GRI. Additionally, it can be confirmed that the gap of flammability limit between Okafor and GRI mechanisms is getting smaller with increasing ambient pressure. This means that there is no significant difference between Okafor and GRI mechanisms when calculating LOC of ammonia combustion at a high-pressure environment.
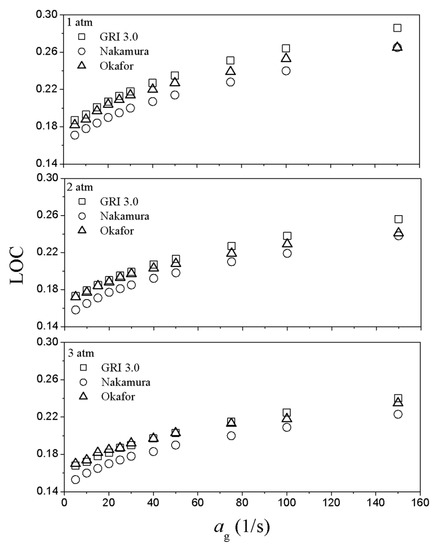
Figure 8.
Limit oxygen concentration (LOC) variation as a function of global strain rate with various ambient pressure.
The mole fraction of hydrogen production by ammonia pyrolysis also decreases with global strain rate and ambient pressure increase, as shown in Figure 6. Note that the flammability zone is expanded in the LOC chart despite decreased hydrogen production as the pressure increases. It can be understood that gas molecules become dense and the collision frequency increases due to high ambient pressure, resulting in enhanced chemical reaction rate.
Meanwhile, ammonia fuel has lower combustion heat and lower adiabatic flame temperature than hydrogen fuel, so it is not good in terms of combustion efficiency, but ammonia is better than hydrogen fuel in terms of fire suppression. Therefore, the hydrogen production rate due to pyrolysis can be a very important indicator of the flammability evaluation of ammonia combustion and can be the key parameter in terms of fire suppression.
As mentioned in Section 4.1, the flame extinction mechanism at low strain rate can be explained as radiative heat loss. Therefore, in order to devise a fire extinction plan utilizing the radiative heat loss, Okafor mechanism, which is the most valid in terms of prediction rate, has been adopted to additionally calculate the flammability limit at a low strain rate.
Figure 9 shows the variation of adiabatic flame temperature and LOC with and without radiative heat loss at a low strain rate. As shown in the figure, the difference between with radiative heat loss and without radiative heat loss seems to vary significantly at ag < 40. However, if it is not in inverse form, the difference between the two values is negligibly small. Therefore, the effect of radiation heat loss on LOC could not be clearly observed because the radiative heat transfer from ammonia flame is relatively lower than that of hydrocarbon flame owing to a lack of CO2 in its products [33,38].
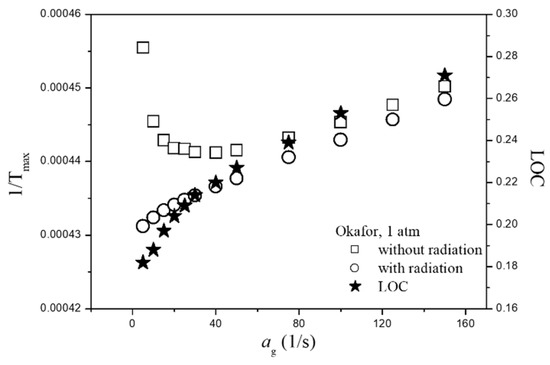
Figure 9.
Variation of adiabatic flame temperature and LOC with and without radiative heat loss at low strain rate by adopting Okafor mechanism.
4.3. Flame Extinction Curve
In general, Karlovitz number (Ka) is widely adopted as an evaluation factor for characterizing flame extinction behavior [39,40]. Ka number can be defined as the ratio of characteristic chemical reaction time to characteristic flow time, and the definition equation is as follows:
Here, δ, uf, and SL mean the flame thickness, the flow velocity, and laminar burning velocity, respectively. It is known that flame extinction occurs when Ka number exceeds the threshold value [39,40].
Meanwhile, in the case of Ka number, only the flame extinction mechanism due to flame stretch at a high strain rate can be explained. Therefore, in order to obtain the overall flame extinction curve of ammonia combustion, Peclet number (Pe), which can describe the flame extinction mechanism due to heat losses at a low strain rate, was additionally adopted. The Pe number is defined as the ratio of the advective transport rate to the diffusive transport rate:
Here, α means the thermal diffusivity. The Pe number used in the combustion field is related to flame stabilization, and it is known that if the Pe number is larger than the critical value, Pecrit, the flame becomes unstable due to strong convectional force. Conversely, when the Pe number is smaller than Pecrit, thermal diffusion from the flame is strong, and thus the response of the reaction region to external disturbance is insensitive, so that a stable combustion state can be implemented [41,42,43].
Figure 10 shows the critical Ka at flame extinction versus Pe for all tested conditions in this study to examine the feature of flame extinction. All experimental conditions are described into one curve regardless of the ambient pressure, global strain rate, and the detailed chemical reaction mechanisms adopted as computational variables.
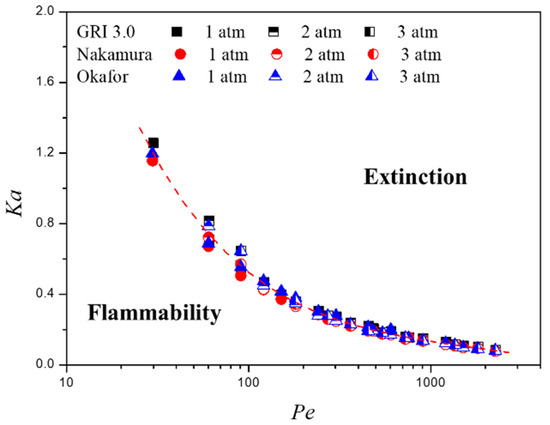
Figure 10.
Critical Karlovitz number at flame extinction versus Peclet number for all tested conditions in this study.
As described above, when the Pe number is smaller than Pecrit, it is very difficult to induce flame extinction by adjusting the Pe number because the thermal diffusivity is large and the flame is formed as a stable state. Therefore, as shown in Figure 10, it is effective to induce flame extinction by slightly increasing Ka number. On the other hand, when Pe number is large, the flame has a small thermal diffusivity and the flame is formed as an unstable state. Thereby, flame extinction occurs relatively more easily than when the Pe number is small due to the narrowed flammability zone. In addition, considering the fixed Ka number, it is considered effective to construct a large Pe number by inducing gas composition with low thermal diffusivity to induce flame extinction.
5. Conclusions
This study conducted 1-D numerical simulations to establish fire suppression measures when ammonia leaks from high-pressure storage containers, especially focusing on the flammability limit according to oxygen concentration. Ambient pressure and global strain rate were selected as evaluation factors. Three detailed chemical reaction mechanisms were adopted to characterize the flame extinction curve of ammonia combustion. The simulation results can be summarized as described below:
- Ammonia combustion underwent a process of simultaneously performing a chemical reaction containing nitrogen hydrides and hydrogen due to a large amount of hydrogen generated from the preheating zone in front of a flame. Hydrogen produced by pyrolysis resulted in the formation of two peaks in HRR profile and an increase in reaction thickness due to the high diffusion coefficient of hydrogen;
- As the strain rate increases, the adiabatic flame temperature decreases with the relatively small amount of hydrogen produced by pyrolysis due to the thinner preheating thickness. As the ambient pressure increases, HRR indicated in two peaks merge into one peak. Additionally, HRR profile increases sharply due to the high reaction rate and the narrowed reaction region;
- LOC curve increases with global strain rate regardless of ambient pressure. This implies that the flammability limit narrows, and the flame extinction by control of oxygen concentration can be induced relatively easily;
- Hydrogen production rate due to pyrolysis can be a very important indicator of the evaluation of ammonia combustion flammability and can be the key parameter in terms of fire suppression;
- Based on the result of LOC analysis as a function of global strain rate, Karlovitz and Peclet numbers showed well the extinction behaviors of ammonia combustion;
- Comparing the performance of the three detailed chemical reaction mechanisms used in this work to evaluate the combustion characteristics of ammonia fuel, the GRI 3.0 and Okafor mechanisms predicted high rates of flame propagation velocity; the Okafor mechanism captured well the combustion characteristics under high-pressure conditions.
Author Contributions
Conception, design, and funding acquisition of this study, S.H.Y.; acquisition and analysis of data, Y.H.C., W.-J.L., J.K., S.H.Y.; drafting the manuscript or figures, Y.H.C.; critical review, Y.H.C., S.H.Y. All authors have read and agreed to the published version of the manuscript.
Funding
This work was supported by the Technology Innovation Program (20005750, Commercial Development of Combustion System Control Technology for Minimizing Pollutant with Multiple Analysis) funded by the Ministry of Trade, Industry & Energy (MOTIE, Korea). This work was supported by the National Research Foundation of Korea (NRF) grant funded by the Korea government (MSIT) (No. 2018R1C1B5086432).
Institutional Review Board Statement
Not applicable.
Informed Consent Statement
Not applicable.
Conflicts of Interest
The authors declare no conflict of interest.
References
- Valera-Medina, A.; Banares-Alcantara, R. Techno-Economic Challenges of Green Ammonia as an Energy Vector; Academic Press: Oxford, UK, 2020. [Google Scholar]
- United States Department of Labor. Available online: https://www.osha.gov/ (accessed on 19 October 2019).
- Smoot, L.D.; Hill, S.C.; Xu, H. NOx control through reburning. Prog. Energy Combust. Sci. 1998, 24, 385–408. [Google Scholar]
- Kondo, S.; Takizawa, K.; Takahashi, A.; Tokuhashi, K. On the temperature dependence of flammability limits of gases. J. Hazard. Mater. 2011, 187, 585–590. [Google Scholar]
- Khan, A.S.; Kelley, R.D.; Chapman, K.S.; Fenton, D.L. Flammability Limits of Ammonia-air Mixtures. ASHRAE Trans. 1995, 101, 454–462. [Google Scholar]
- Tullo, A.H. Employee Killed at CF Industries Plant. Available online: https://cen.acs.org/articles/91/web/2013/06/Employee-Killed-CF-Industries-Plant.html (accessed on 26 November 2019).
- Miller, J.A.; Branch, M.C.; Kee, R.J. A chemical kinetic model for the selective reduction of nitric oxide by ammonia. Combust. Flame 1981, 43, 81–98. [Google Scholar]
- Skreiberg, Ø.; Kilpinen, P.; Glarborg, P. Ammonia chemistry below 1400 K under fuel-rich conditions in a flow reactor. Combust. Flame 2004, 136, 501–518. [Google Scholar]
- Koebel, M.; Elsener, M.; Kleemann, M. Urea-SCR: A promising technique to reduce NOx emissions from automotive diesel engines. Catal. Today 2000, 59, 335–345. [Google Scholar]
- Zabielski, M.F.; Seery, D.J. High temperature measurements of the rate of the reaction of OH with NH3. Int. J. Chem. Kinet. 1985, 17, 1191–1199. [Google Scholar]
- Sutherland, J.W.; Patterson, P.M.; Klemm, R.B. Flash photolysis-shock tube kinetic investigation of the reaction of O(3P) atoms with ammonia. J. Phys. Chem. 1990, 94, 2471–2475. [Google Scholar]
- Bozzelli, J.W.; Dean, A.M. Energized complex quantum Rice-Ramsperger-Kassel analysis on reactions of amidogen with hydroperoxo, oxygen and oxygen atoms. J. Phys. Chem. 1989, 93, 1058–1065. [Google Scholar]
- Davidson, D.F.; Kohse-Höinghaus, K.; Chang, A.Y.; Hanson, R.K. A pyrolysis mechanism for ammonia. Int. J. Chem. Kinet. 1990, 22, 513–535. [Google Scholar]
- Song, Y.; Hashemi, H.; Christensen, J.M.; Zou, C.; Marshall, P.; Glarborg, P. Ammonia oxidation at high pressure and intermediate temperatures. Fuel 2016, 181, 358–365. [Google Scholar]
- Lee, J.H.; Lee, S.I.; Kwon, O.C. Effects of ammonia substitution on hydrogen/air flame propagation and emissions. Int. J. Hydrogen Energy 2010, 35, 11332–11341. [Google Scholar]
- Lee, J.H.; Kim, J.H.; Park, J.H.; Kwon, O.C. Studies on properties of laminar premixed hydrogen-added ammonia/air flames for hydrogen production. Int. J. Hydrogen Energy 2010, 35, 1054–1064. [Google Scholar]
- Smith, G.P.; Golden, D.M.; Frenklach, M.; Moriarty, N.W.; Eiteneer, B.; Goldenberg, M.; Bowman, C.T.; Hanson, R.K.; Song, S.; Gardiner, W.C.; et al. GRI-Mech 3.0. Available online: http://combustion.berkeley.edu/gri-mech/index.html (accessed on 21 July 2017).
- Kee, R.J.; Miller, J.A.; Evans, G.H.; Dixon-Lewis, G. A computational model of the structure and extinction of strained, opposed flow, premixed methane-air flames. Proc. Combust. Inst. 1989, 22, 1479–1494. [Google Scholar]
- Giovangigli, V.; Smooke, M. Extinction of strained premixed laminar flames with complex chemistry. Combust. Sci. Technol. 1987, 53, 23–49. [Google Scholar]
- Jeon, J.; Kim, S.J. Precent progress in hydrogen flammability prediction for the safe energy systems. Energies 2020, 13, 6263–6306. [Google Scholar]
- Nakamura, H.; Shindo, M. Effects of radiation heat loss on laminar premixed ammonia/air flames. Proc. Combust. Inst. 2019, 37, 1741–1748. [Google Scholar]
- Okafor, E.C.; Naito, Y.; Colson, S.; Ichikawa, A.; Kudo, T.; Hayakawa, A.; Kobayashi, H. Measurement and modelling of the laminar burning velocity of methane-ammonia-air flames at high pressures using a reduced reaction mechanism. Combust. Flame 2019, 204, 162–175. [Google Scholar]
- Barlow, R.S.; Karpetis, A.N.; Frank, J.H.; Chen, J.Y. Scalar profiles and NO formation in laminar opposed-flow partially premixed methane/air flames. Combust. Flame 2001, 127, 2102–2118. [Google Scholar]
- Modest, M.F. Radiative Heat Transfer, 3rd ed.; Academic Press: New York, NY, USA, 2013. [Google Scholar]
- Rothman, L.S.; Gordon, I.E.; Barbe, A.; Benner, D.C.; Bernath, P.F.; Birk, M.; Boudon, V.; Brown, L.R.; Campargue, A.; Champion, J.-P.; et al. The HITRAN 2008 molecular spectroscopic database. J. Quant. Spectrosc. Radiat. Transf. 2009, 110, 533–572. [Google Scholar]
- Chelliah, H.K.; Law, C.K.; Ueda, T.; Smooke, M.D.; Williams, F.A. An experimental and theoretical investigation of the dilution, pressure and flow field effects on the extinction condition of methane-air-nitrogen diffusion flames. Proc. Combust. Inst. 1990, 23, 503–511. [Google Scholar]
- Takizawa, K.; Takahashi, A.; Tokuhashi, K.; Kondo, S.; Sekiya, A. Burning velocity measurements of nitrogen-containing compounds. J. Hazard. Mater. 2008, 155, 144–152. [Google Scholar] [PubMed]
- Pfahl, U.J.; Ross, M.C.; Shepherd, J.E.; Pasamehmetoglo, K.O.; Unal, C. Flammability limits, ignition energy, and flame speeds in H2-CH4-NH3-N2O-O2-N2 mixtures. Combust. Flame 2000, 123, 140–158. [Google Scholar]
- Zakaznov, F.Z.; Kursheva, L.A.; Felina, Z.I. Determination of normal flame velocity and critical diameter of flame extinction in ammonia-air mixture. Combust. Explos. Shock Waves 1978, 14, 710–713. [Google Scholar]
- Ronney, P.D. Effect of chemistry and transport properties on near-limit flames at microgravity. Combust. Sci. Technol. 1988, 59, 123–141. [Google Scholar]
- Hayakawa, A.; Goto, T.; Mimoto, R.; Arakawa, Y.; Kudo, T.; Kobayashi, H. Laminar burning velocity and Markstein length of ammonia/air premixed flames at various pressures. Fuel 2015, 159, 98–106. [Google Scholar]
- Li, Y.; Bi, M.; Li, B.; Gao, W. Explosion behaviors of ammonia-air mixtures. Combust. Sci. Technol. 2018, 190, 1804–1816. [Google Scholar]
- Maruta, K.; Yoshida, M.; Guo, H.; Ju, Y.; Niioka, T. Extinction of low-stretched diffusion flame in microgravity. Combust. Flame 1998, 112, 181–187. [Google Scholar]
- Tsuji, H. Counterflow diffusion flames. Prog. Energy Combust. Sci. 1982, 8, 93–119. [Google Scholar]
- Alturaifi, S.A.; Mathieu, O.; Petersen, E.L. An experimental and modeling study of ammonia pyrolysis. Combust. Flame 2022, 235, in press. [Google Scholar]
- Benés, M.; Pozo, G.; Abián, M.; Millera, Á.; Bilbao, R.; Alzueta, M.U. Experimental study of the pyrolysis of NH3 under flow reactor conditions. Energy Fuel 2021, 35, 7193–7200. [Google Scholar]
- Transport Property Evaluation Website, Colorado State University Bioanalytical Microfluidics Program Chemical and Biological Engineering. Available online: http://navier.engr.colostate.edu/code/code-2/index.html (accessed on 30 September 2019).
- T’ien, J.S. Diffusion flame extinction at small stretch rates: The mechanism of radiative loss. Combust. Flame 1986, 65, 31–34. [Google Scholar]
- Chung, S.H.; Chung, D.H.; Fu, C.; Cho, P. Local Extinction Karlovitz number for premixed flames. Combust. Flame 1996, 106, 515–520. [Google Scholar]
- Cho, E.S.; Chung, S.H.; Oh, T.K. Local Karlovitz numbers at extinction for various fuels in counterflow premixed flames. Combust. Sci. Technol. 2006, 178, 1559–1584. [Google Scholar]
- Bradley, D.; Hicks, R.A.; Lawes, M.; Sheppard, C.G.W.; Woolley, R. The measurement of laminar burning velocities and Markstein numbers for iso-octaine-air and iso-octane-n-heptane-air mixtures at elevated temperatures and pressures in an explosion bomb. Combust. Flame 1998, 115, 126–144. [Google Scholar]
- Bradley, D.; Sheppard, C.G.W.; Woolley, R.; Greenhalgh, D.A.; Lockett, R.D. The development and structure of flame instabilities and cellularity at low Markstein numbers in explosions. Combust. Flame 2000, 122, 195–209. [Google Scholar]
- Bradley, D.; Harper, C.M. The development of instabilities in laminar explosion flames. Combust. Flame 1994, 99, 562–572. [Google Scholar]
Publisher’s Note: MDPI stays neutral with regard to jurisdictional claims in published maps and institutional affiliations. |
© 2022 by the authors. Licensee MDPI, Basel, Switzerland. This article is an open access article distributed under the terms and conditions of the Creative Commons Attribution (CC BY) license (https://creativecommons.org/licenses/by/4.0/).