Article

Does ESG Reporting Relate to Corporate Financial Performance in the Context of the Energy Sector Transformation? Evidence from Poland

1
Institute of Economics, Finance and Management, Jagiellonian University, 31-007 Kraków, Poland
2
Department of Management, WSB University, 41-300 Dąbrowa Górnicza, Poland
*
Author to whom correspondence should be addressed.
Energies 2022, 15(2), 477; https://doi.org/10.3390/en15020477
Submission received: 6 December 2021 / Revised: 4 January 2022 / Accepted: 5 January 2022 / Published: 10 January 2022

Abstract

:
This paper aims to investigate whether the environmental, social and corporate governance (ESG) score of companies operating in the energy sector is associated with their corporate financial performance (CFP). The research covered data from eight companies with a dominant position in the Polish energy sector. The research used the comparative analysis between ESG performance and accounting-based measures of profitability: return on equity (ROE), return on assets (ROA) and return on sales (ROS). Additionally, reference was also made to the DuPont model. The acquired results do not reveal repetitive dependencies that would facilitate the discovery of a pattern of the impact of the factors of ESG on the financial performance of enterprises. Despite indicating the cases of correlations between the ESG scores and CFP at a high level, indeed sometimes at a very high level, the particular case studies significantly differ from each other. This may be caused by the fact that Polish enterprises from the energy sector illustrate far-reaching specifics, among others, with regard to the key significance of the entities with a prevalent state ownership and strict administrative regulations, which are subject to the energy market, state of development and structure of the whole sector in Poland. Thus, this is also why the mechanisms or dependencies, whose existence it is possible to expect in conditions of free competition, may be weakened or even eliminated in Polish conditions.

1. Introduction

In the coming years, the energy sector, or rather its transformation, will drive the world economy and create new industries and services, and a new division of labour [1]. Energy security is one of the elements of the energy policies of every country and constitutes a strategic issue, while the energy sector alongside others (e.g., the financial, transportation and food sectors) shapes the efficient functioning of the whole national economy [2].
Contemporary researchers, when diagnosing energy sector companies with regard to their reports, most often consider the following issues [3]:
  • the responsibility a company must take on to uphold its ‘contract’ with society;
  • risks that threaten profitability;
  • an opportunity for further growth.
Sustainability reporting initiatives like the Global Reporting Initiative and non-profit organizations have also had an impact on corporate disclosure related to the energy sector for state-owned companies [4].
The aim of our research is to analyse the relationship between ESG performance and CFP in the energy sector. Until now, such considerations have not been carried out regarding the highly concentrated and mostly state-owned energy sector in Poland. The conducted research answers the following research question: do companies with higher ESG scores operating in the Polish energy sector show better financial results? This is an important issue as the energy sector has a huge impact on many areas of the economy, society and natural environment. Therefore, managing enterprises operating in that specific sector should address the challenge of incorporating the ESG factors, as well as acknowledging their complex network of stakeholders while they pursue profits. Thus, the issue of managing enterprises in the energy sector becomes an important methodological issue. This research presents Polish energy companies in terms of ESG indicators, which has not yet been studied. It is known that companies that take into account ESG issues in their activities (while informing their stakeholders about it) have a chance to improve their image and increase trust in the company, especially during energy transformation. The results of our research are, therefore, the first point of discussion in Poland about changing the perception of the energy sector.

2. Theoretical Background

2.1. Challenges for the Polish Energy Sector

The priority of the governments is to create conditions to build sustainable development of the energy sector that lead to the development of the national economy and ensure the energy security of the country, while simultaneously fulfilling the energy needs of enterprises and households, which consequently leads to the reduction of the harmful impact of the energy sector on the environment [5,6]. Every important energy system is deemed to be sustainable if [7]:
  • the economic potential of the provision of energy services for future generations is guaranteed;
  • the energy services are provided with the minimum use of resources, including that of the environment itself;
  • the emissions of harmful substances do not exceed the natural ability of the environment to assimilate them;
  • the threat to human health is lower than the natural dangers avoided as a result of the energy services provided.
At present, European industry is faced with two main transformations—ecological and digital, whose common and key element is the energy sector [8]. The strategy of development for this sector is primarily based on the fact that in order to replace fossil fuels—hitherto the source of energy (natural gas, crude oil, coal)—with new fuels means minimizing the degradation of the natural environment. In this context, the issue of taking account of the needs of the broadly perceived end-users and the challenges posed by the European Union is significant [9]. These challenges were formulated in January 2007 within the framework of the work of the European Commission which took direction of the new community policies in the area of the energy sector that arose from the growing climate change mainly caused by the emissions of carbon dioxide and the gradual exhaustion of the sources of energy from fossil fuels. Energy is a product, thus it should be within the framework of the EU, and for which legislative and institutional frameworks are essential in relation to which over the past two decades attempts to harmonize the framework of the energy sector in member states have been made [10].
On the long road towards the transformation of the energy sector, regulatory packages were accepted within the framework of the EU in the period 2009–2014 in the following areas:
  • In 2009, the package of regulations determining the three fundamental aims of counteracting climate change up to 2020 (the so-called package 3 × 20%) within the framework of which Poland is obliged to do the following [11]:
    • increase energy efficiency by means of saving the use of primary energy by 13.6 Mtoe in the period 2010–2020 by comparison with the forecasts for demand for fuel and energy in 2007;
    • increase the share of energy from renewable sources of energy to 15% in the final gross use of energy by 2020;
    • contribute to the EU-wide reduction of emissions of greenhouse gases by 20% (by comparison with 1990) by 2020.
  • In 2014, the European Council confirmed four aims with the perspective of 2030 for the entire EU, which after a revision in 2018 and in 2020 now have the following form [12]:
    • the reduction of greenhouse gases by at least 55% in comparison with emissions in 1990;
    • at least 32% of renewable sources of energy as a share of the final gross energy consumption;
    • growth of energy efficiency by 32.5%;
    • completion of the creation of the internal energy market of the EU.
The regulations stipulated above, while also being in the economic, political and environmental spheres, lead to the fact that the Polish energy sector dominated by power plants combusting bituminous and lignite coal is slowly changing its structure by adding renewable sources of energy to the production potential [13,14]. According to a report prepared by Agora Energiewende and Ember published in January 2021, the share of energy from coal constituted 83% in Poland, whereas the share of green energy amounted to 17% [15]. The elimination of bituminous and lignite coal constitutes a challenge for Poland, the more so as the majority of EU member states do not possess this raw material and are, therefore, not interested in its participation in the production of the resulting energy. In terms of the EU member states, the greatest amounts of this raw material are used in German and Polish power plants [16].
Within the framework of the transformation of the energy sector in Poland, a document entitled “Energy Policy of Poland up to 2040” (EPP) was signed in January 2021. This is a strategic and directional document, whereby the obligation to accept it arises from the Energy Law [17], and its essence is the undertaking of strategic investment decisions aimed at availing of the national economic potential, as well as raw materials, technological and personnel resources, while also creating through the energy sector a driving force for economic growth favouring a fair transformation [18]. The aims, scope and elements of the energy policy in Poland were specified in the document, which include ensuring energy security in the country, growth in the competitiveness of the economy and energy efficiency, while also, consequently, environmental protection. These are convergent with the EU aims in part, but not entirely as in the EU there is a prevalence of issues associated with the sphere of environmental protection and the climate (the priority here is the decarbonization of the energy sector, while in the future it is the climate neutrality of the economy), whereas in Poland, the priority is energy security. EPP constitutes a document that contains a prognostic section that encompasses no less than 20 years (thus, the time horizon of the project lasts until 2040), while its primary composite element contains a program of executive actions that include a description of the instruments that facilitate their implementation, as well as the evaluation of the execution of state energy policy. The scope of the document is wide-ranging as it encompasses the fuel–energy balance of the country, while also the manufacturing and transmission capacity, as well as the directions of restructuring and transformation in the sector as a whole [18]. The program assumptions are formulated in three principal pillars as presented in Figure 1 below.
In sum, one of the main assumptions of the Polish energy policy constitutes mitigation of its negative impact on the environment, thus the restriction of the emissions created by the energy sector and the negative impact on the state of the surface and underground waterways, while also reducing the dumping of waste by means of the widest possible reuse of resources in the economy as well as a change in manufacturing for low-emission technologies, namely adherence to the principles of sustainable development [19].
The development of the EU energy policy based on sustainable development is a cultural development [20] and is primarily determined by the preferences of consumers [21,22]. Nevertheless, it is not possible to forget the fact that the changes in the energy sector also arise from other premises, such as total global growth in demand for energy envisaged within the forthcoming 30 years [23,24], as well as the role of enterprises in the energy sector in the transition towards sustainable development that may be significant with regard to the inherent potential and mainly financially based [25].

2.2. Social Responsibility of Energy Sector

Corporate social responsibility (CSR) is a strategic approach of an organization to ensure financial success by means of a positive contribution to the environment, the local community and the associated stakeholders [26], while also the philosophy which by definition encompasses the relations at the level of the organization—stakeholders [27]. The issues of CSR and sustainable development have been explored by a multitude of researchers [28,29,30,31,32,33] and the majority of the theories of CSR according to them concentrate on the following aspects: the execution of economic aims to ensure long-term profits, the responsible use of business power, the integration of the requirements, and the pursuit of the good of the community [34,35]. The details relating to these aspects are dependent on the quality of the reports prepared by the organizations, which constitute part of the social dialogue between a firm and its stakeholders, while their scope should encompass three principal composite elements of the concept, namely: economic, social and environmental. In the past, within the framework of research on CSR, emphasis was placed on the issue of the responsibility of the organization itself, or the impact of the activities of CSR on the financial performance of the organization; however, currently it also refers to the integration of the stakeholders within the framework of the policies conducted, while also the decisions and operations undertaken [36].
The current challenges facing organizations arise from, among other things, the necessity to pursue the attainment of profit with the simultaneous consideration of the social context [37]. Organizations should serve social needs as they avail of a large share of resources such as financial resources, environmental resources and human capital, which obliges them to process these resources in a responsible manner, so as not to harm the community. Due to the significant impact on the environment, or the increased risk with relation to the safety of the employees, organizations from the energy market are also forced to place emphasis on CSR [38]. Vollero et al. indicate that the enterprises from this sector feel increasing pressure from their stakeholders, who expect sustainable products and clean energy [39] while, moreover, stakeholders are demanding transparency in terms of revealing information about the impact of the activities of firms on the environment [40].
The principal pillars of the assumptions within the framework of CSR in the energy sector are presented in Table 1 below.
As the research relating to the development of the concept of CSR in the energy sector indicates, this development has encountered numerous barriers in the social sphere that are associated with weak cooperation with stakeholders, lack of attention to competences and the motivation of personnel, a low level of awareness in the community of the activities of energy companies, high prices for energy, while also the general lack of information [42,43].
The constantly growing awareness of the necessity to take account of environmental and social issues in business operations leads to the fact that this element is increasingly treated as an investment in key competences or assets rather than a certain type of restriction or source of costs. Some people claim that engagement in CSR activities is desirable only to the extent that it improves the long-term financial standing of the organization [44]. From the viewpoint of the shareholders, CSR activities constitute a certain type of cost, whereas from the viewpoint of stakeholders, they are an ethical obligation [45]. By way of assumption, activities on behalf of the local community or the natural environment cannot be merely a reaction to an amendment to the binding legislative regulations, while the activities themselves must evoke a positive and measurable effect, such as, e.g., saving costs, growth in the level of competitiveness, enhancement of profitability, retention of clients, or an improvement of image [46]. All the elements stipulated entice organizations to create so-called green marketing strategies with which they can build a positive image [47]. Together with the development of green strategies, there is also development of the phenomenon known as greenwashing, which Siano et al. defined as the divergence between two types of behaviour: on the one hand, low eco-efficiency, while on the other hand, promotion of the green aims of sustainable development [48]. This may be alternatively defined as the “intersection of two behavioural aspects of firms: low environmental efficiency and positive communication” [49] or misleading consumers with reference to environmental practices, environmental efficiency and communication about environmental efficiency applied by the organizations [50]. Greenwashing mainly serves the promotion of ecological benefits instead of real investments in green projects and the majority are applied by organizations from the energy, chemical and automotive sectors with the aim of promoting their own products as environmentally friendly [51]. As proven by scientists, greenwashing does not have a favourable impact on the value of listed companies [52] and may lead to the increased level of scepticism among investors that are interested in the implementation of green concepts [53]. Unfortunately, scientists indicate that the energy sector, as in the case of other sectors, must face the paradox of CSR, namely, that the more organizations do and communicate about their CSR activities, the more frequently they are observed and criticized for all their offences, however insignificant they may be [54]. Thus, the means of communication is taking on more significance, which has an impact on the minimization of negative interpretations of green activities and accusations of greenwashing, hence communication should not only involve communicating about activities in the area of sustainable development to stakeholders but, first and foremost, it should encompass the process of predicting their expectations of whether the management of tools aimed at providing real and transparent information [54], which consequently may lead to the creation of favourable relations with the broadly perceived stakeholders [55]. The implementation of CSR strategies is becoming a necessity, not only due to the significance of the aims of sustainable business for firms, but primarily due to the stakeholders [56,57].

2.3. Significance of Environmental, Social and Corporate Governance (ESG) for Stakeholders

The types and ways of communicating information conveyed to stakeholders are so significant that according to ACCA, approximately 67% of investors take decisions while also taking account of non-financial data [58], thus the interest in this data and the development of the concept of CSR is leading to the fact that reporting information on environmental areas, social areas and corporate governance is taking on greater significance (the so-called ESG, namely, E—environment, S—social, G—governance), whereby analysis is conducted of the impact of CSR on the financial performance and social status of a business [59,60,61].
Reporting on data of ESG is a global trend as it increases the transparency of firms on the market, while also facilitating their valuation and also determining the decisions of investors, which by way of consequence may also have an impact on the cost of the external capital acquired. In addition to this, the issue is viewed in a strategic notion, which is long-term and is aimed at enhancing the level of competitiveness and supporting the social good [62,63]. Relations between CSR and ESG are clarified by stating that CSR refers to the general involvement of enterprises with regard to various stakeholders and socially responsible behaviour, while ESG refers to the criteria used in the evaluation of the practices of the sustainable development of firms; that is, for the evaluation of the level of involvement of firms in CSR, the results of ESG are a method of measuring the “sustainable efficiency of a firm” [64]. The problems described within the framework of ESG, which firms usually struggle with in their pursuit of long-term value, are presented in Table 2. Up until now, there has been no singular, or precise list, nor has their significance been defined, yet they are increasingly perceived as an increasing share of the value of firms that is dependent on intangible value [65].
It is acknowledged that the factors of ESG are particular dimensions of non-financial information, which firms, markets and investors focus on [66,67]. The organizations that take account of the issues of ESG in their business activities, while simultaneously informing their stakeholders of this fact, indicate the following benefits accruing from this:
  • enhancement of their image and the growth of trust, while also the attractiveness in the eyes of investors—potentially lower cost of capital [68];
  • greater possibilities of acquiring employees, while also their greater loyalty [69] and job satisfaction [70];
  • greater innovativeness—taking social and ecological aspects into account motivates the creation of new products and streamlining of processes [70];
  • lower costs that may arise from the reduction of the use of resources.
As indicated by Lamandi et al. [62], Dorfleitner et al. [71] or Utz [72] there are few scientific works that concentrate exclusively on the results of ESG. Within the framework of scientific research that encompassed the area of ESG, three main elements are listed [72]:
  • reporting on ESG,
  • investments in ESG,
  • relations between ESG and the financial/economic performance of enterprises.
Information on ESG may have an impact on the financial performance of the firm by means of the following [73]:
  • reporting on ESG may have an impact on the reputation of the firm, while simultaneously increasing the level of trust among investors;
  • information on ESG associated with the efficient use of resources may have an impact on the acquisition of a competitive advantage;
  • the policy of ESG leads to a greater level of motivation among the employees, thus increasing their productivity and innovativeness, which in turn, enables firms to gain new market share.
Brooks and Oikonomou [74] indicate the need for analysis of the various components of ESG, even if the positive contribution of ESG is by consequence not always significant for the financial performance of the organization. As indicated by Iamandi et al. [62], stakeholders must have appropriate information at their disposal in order to analyse corporate behaviour from various perspectives. This signifies the fact that the scope of information conveyed based on financial reporting is insufficient for the stakeholders interested in CSR [75] and should encompass both information of a quantitative and qualitative nature [30,64].

3. Methodology

This paper aims to investigate whether the environmental, social and corporate governance (ESG) score of companies operating in the energy sector is associated with their corporate financial performance (CFP). There are continuous academic efforts to identify the impact of ESG on CFP, since these are efforts to legitimize its social engagement and prove that business can do well by doing good [76]. Although a causal conclusion remains complex, past academic literature has argued for either a positive or neutral correlation between ESG quality represented by a business and its CFP [76,77,78].
Research examining strictly the link between the ESG profile of companies and their accounting or market measures of CFP reports mostly a positive, although usually weak, relationship. For example, a meta-analysis of 167 studies investigating the effects of ESG performance and CFP since 1972, conducted by Margolis et al. [77], indicates only a mildly positive relationship between them. The extensive meta-analysis of empirical evidence embracing the time span from 1980 to 2019 by Huang [79] shows a positive, statistically significant, yet economically modest relationship between ESG performance and CFP. Clark et al.’s [77] enhanced meta-study based on over 200 sources reports a remarkable correlation between diligent sustainability business practices and economic performance. In particular, 45 of 51 reviewed studies (88%) show that sustainability is positively correlated with operational performance. An earlier study by Eccles et al. [80] for the US market in 1993–2010 also finds that the portfolio of high-sustainability companies outperforms the low-sustainability ones, both in terms of the stock market and accounting performance. Those results are consistent with theoretical expectations of a null to modestly positive link between ESG and CFP [81].
In this paper, we contribute to that ongoing discourse of whether ESG performance of companies matters for companies’ CFP by raising the following research question: do companies with higher ESG scores operating in the Polish energy sector show better financial results? We aim to focus on a narrow but very specific segment of the Polish economy—enterprises with leading positions in the energy sector that are highly consolidated, mostly state-owned, strictly regulated, and not governed by the rules of free competition. To the best of our knowledge, the relationship between ESG score and CFP in that segment has not been analysed so far by academics. While searching for an answer to our research question, we are particularly interested in whether findings and conclusions from previous studies on the ESG–CFP nexus can be transferable to that specific sector of the Polish economy.
In order to answer that question, we examine if there is a positive relation between ESG performance and CFP, and we adopt the following as a proxy for the latter accounting-based measures of profitability: return on equity (ROE), return on assets (ROA) and return on sales (ROS). Such a selection is justified by the fact that those ratios have repeatedly appeared in previous research projects on the relation between ESG performance and CFP, as studied in the meta-analysis by Margolis et al. [77]. Additionally, we refer to the DuPont model, which is widely used in financial analysis and facilitates the decomposition of the different drivers of ROE. This seems to be crucial for a better understanding of CFP as ROE itself might be an insufficient indicator of value creation, while also particularly related to just one group of a company’s stakeholders—namely shareholders. The DuPont model breaks down ROE into the following components: ROA, ROS, total asset turnover (TAT)—a measure of asset use efficiency, and an equity multiplier (A/E) as a measure of financial leverage (see Equations (1) and (2)). This is why we include in our study the two latter indices [82].
ROE = ROA × A E
ROE = ROS × TAT × A E
Additionally, we supplement the set of the chosen accounting metrics by the current ratio (CR) as the most popular indicator of financial liquidity in order to also cover the cash-flow dimension of the financial performance analysis. The values of the aforementioned accounting measures for companies from our research sample have been taken from the Biznes Radar Data Base [83].
As a proxy of the ESG performance of companies, we use one of the leading global, comprehensive ESG rating methodologies—the Refinitiv ESG scoring, which is available at the DataStream database. The reason for choosing this ESG data provider is that it has the greatest coverage worldwide in comparison with other ESG rating providers (e.g., the SAM Corporate Sustainability Assessment or Sustainalytics). The Refinitiv model comprises two overall ESG scores: ESG Score, which measures the company’s ESG performance based on verifiable reported data in the public domain, and ESG Combined score (ESGC), which overlaps the ESG score with the ESG Controversies Score to provide an evaluation of the company’s sustainability impact and conduct over time [84]. Employing ESG secondary data in our research allows for reliability and comparability of the results dues to the Refinitiv advanced methodology of data collection and processing, which has been used in numerous previous studies.
Refinitiv calculates over 500 company-level ESG measures, of which a subset of 186 of the most comparable and tangible per industry is used for the overall company assessment and scoring process. The metrics are grouped into 10 categories. The category scores are rolled up into three pillar scores—environmental, social, and corporate governance. The ESG pillar score is a relative sum of the category weights, which vary per industry for the environmental and social categories. The final ESG score reflects the company’s ESG performance, commitment, and effectiveness based on publicly reported information. For each company, the Refinitiv methodology produces a score of between 0 and 100 [84].
Our research sample embraces companies operating in the Polish energy sector whose ESG profiles have been evaluated by the Refinitiv ESG scoring. There are eight companies which have met those criteria and the sample is homogenous. We do not have to control per sector, size or ownership, since all the analysed companies belong to the same sector, namely the energy sector, according to the Global Industry Classification Standard (GICS), thus, they are qualified as large enterprises according to EU criteria, and are listed on the Warsaw Stock Exchange (WSE).
It is necessary to mention that the Polish enterprises of the energy market that are listed on the stock exchange illustrate far-reaching specifics. This is first and foremost caused by two circumstances. The first is the fact that in this category, enterprises with a prevalence of state ownership are of key significance. The second circumstance is that the energy market is subject to strict administrative regulations. This is why the mechanisms (such as the impact of the indicators of ESG on the financial standing of enterprises), whose very existence would be possible to expect in a different situation, e.g., functioning in conditions of free competition, in Polish conditions may be weakened or even totally eliminated [85].
In its current form, the concept of the parametric evaluation of enterprises in the sphere of ESG has been shaped since 2005, while its popularization in such countries as Poland took several years [86]. Due to this fact, the search for correlations between the values of the financial indicators and those which describe the situation of an entity from the perspective of ESG is justified as this type of data is derived from at least the second decade of the 21st century. In order to observe the possible correlations, it is also necessary to approach this period following 2019 with caution as the occurrence of the pandemic, the breakup of the supply chains, and the turbulence of supply and demand for a multitude of goods, distorted the functioning of multiple market phenomena. For this reason, the period of 2010–2019 was chosen for analysis.
The specifics of reporting on the results of the business activities conducted by state companies signifies, among other things, the publication of data in the following formulations: monthly, quarterly and annual reports [87]. In the opinion of the authors, the monthly data refers to periods which are too short to have a real impact on the changes in the level of the indicators of ESG with regard to the financial performance of enterprises. However, the data in an annual formulation are of an excessively general nature, hence in the research it was assumed that all calculations would be conducted on the basis of quarterly data. The procedure for calculating the values of the correlations was conducted on the basis of a complete set of available data, or in other words, random samples were not availed of in this case.
In order to test the correlation between ESG scores and the selected CFP measures, the classical r-Pearson correlation indicator has been used which was calculated according to the statistical formula:
r ( x , y ) = c o v ( x , y ) σ x · σ y  
The values of the calculated correlations have been evaluated in accordance with the J. Guilford scale, in which the particular ranges look as follows [88]:
|r| = 0—lack of correlation
0.0 < |r| ≤ 0.1—faint correlation
0.1 < |r| ≤ 0.3—weak correlation
0.3 < |r| ≤ 0.5—average correlation
0.5 < |r| ≤ 0.7—high correlation
0.7 < |r| ≤ 0.9—very high correlation
0.9 < |r| < 1.0—almost total correlation
|r| = 1—total correlation.
In order to check whether changes in a company’s CFP indicators can be explained by its ESG Combined score, the ordinary least-squares (OLS) method has been used to estimate the regression between each of the six CFP indicators and the ESG Combined score.
CFP N i = α N + β N · E S G c o m b i n e d i + ε i
where CFPN represents one of the six indicators: ROE; ROA; ROS; TAT; A/E; CR.
The fit of the regression model has been assessed first on the basis of the F-test (significance F) and second on the basis of the coefficient of determination R2. In the case of statistically significant regression models for which R2 has a low value, the possibility of adding additional variable has been considered based on the R2adj (adjusted) coefficient. According to this idea, the variable expressing the level of diversification of the company’s activity has been taken into account. This is a dummy variable where “0” means no diversification and the value “1” means a situation in which at least 20% of income (the Pareto rule was used) comes from a sector other than the energy sector. As for the supplementary case (with additional variable), the changes in the R2adj coefficient has been analysed.

4. Results

In the research, there was an endeavour to collect data representing the entire population of the entities that form the energy sector in Poland with the reservation that this relates solely to the enterprises whose business activities are of significance in terms of the economy of the whole country. Hence, the results presented below do not include references to the accepted level of significance, nor do they define the p-value. In individual cases, where some of the enterprises failed to publish the appropriate data in the reports for some quarters, this is appropriately marked in the descriptions in the table that displays the results. Ultimately, the research encompassed data derived from eight enterprises of leading positions in the Polish energy sector. This grouping encompassed the following entities:
  • KGHM Polska Miedź S.A. (KGHM)
  • Polskie Górnictwo Naftowe i Gazownictwo S.A. (PGNiG)
  • Grupa Lotos S.A. (Lotos)
  • PGE Polska Grupa Energetyczna S.A. (PGE)
  • Polski Koncern Naftowy Orlen S.A. (Orlen)
  • Enea S.A. (Enea)
  • Energa S.A. (Energa)
  • Tauron Polska Energia S.A. (Tauron)
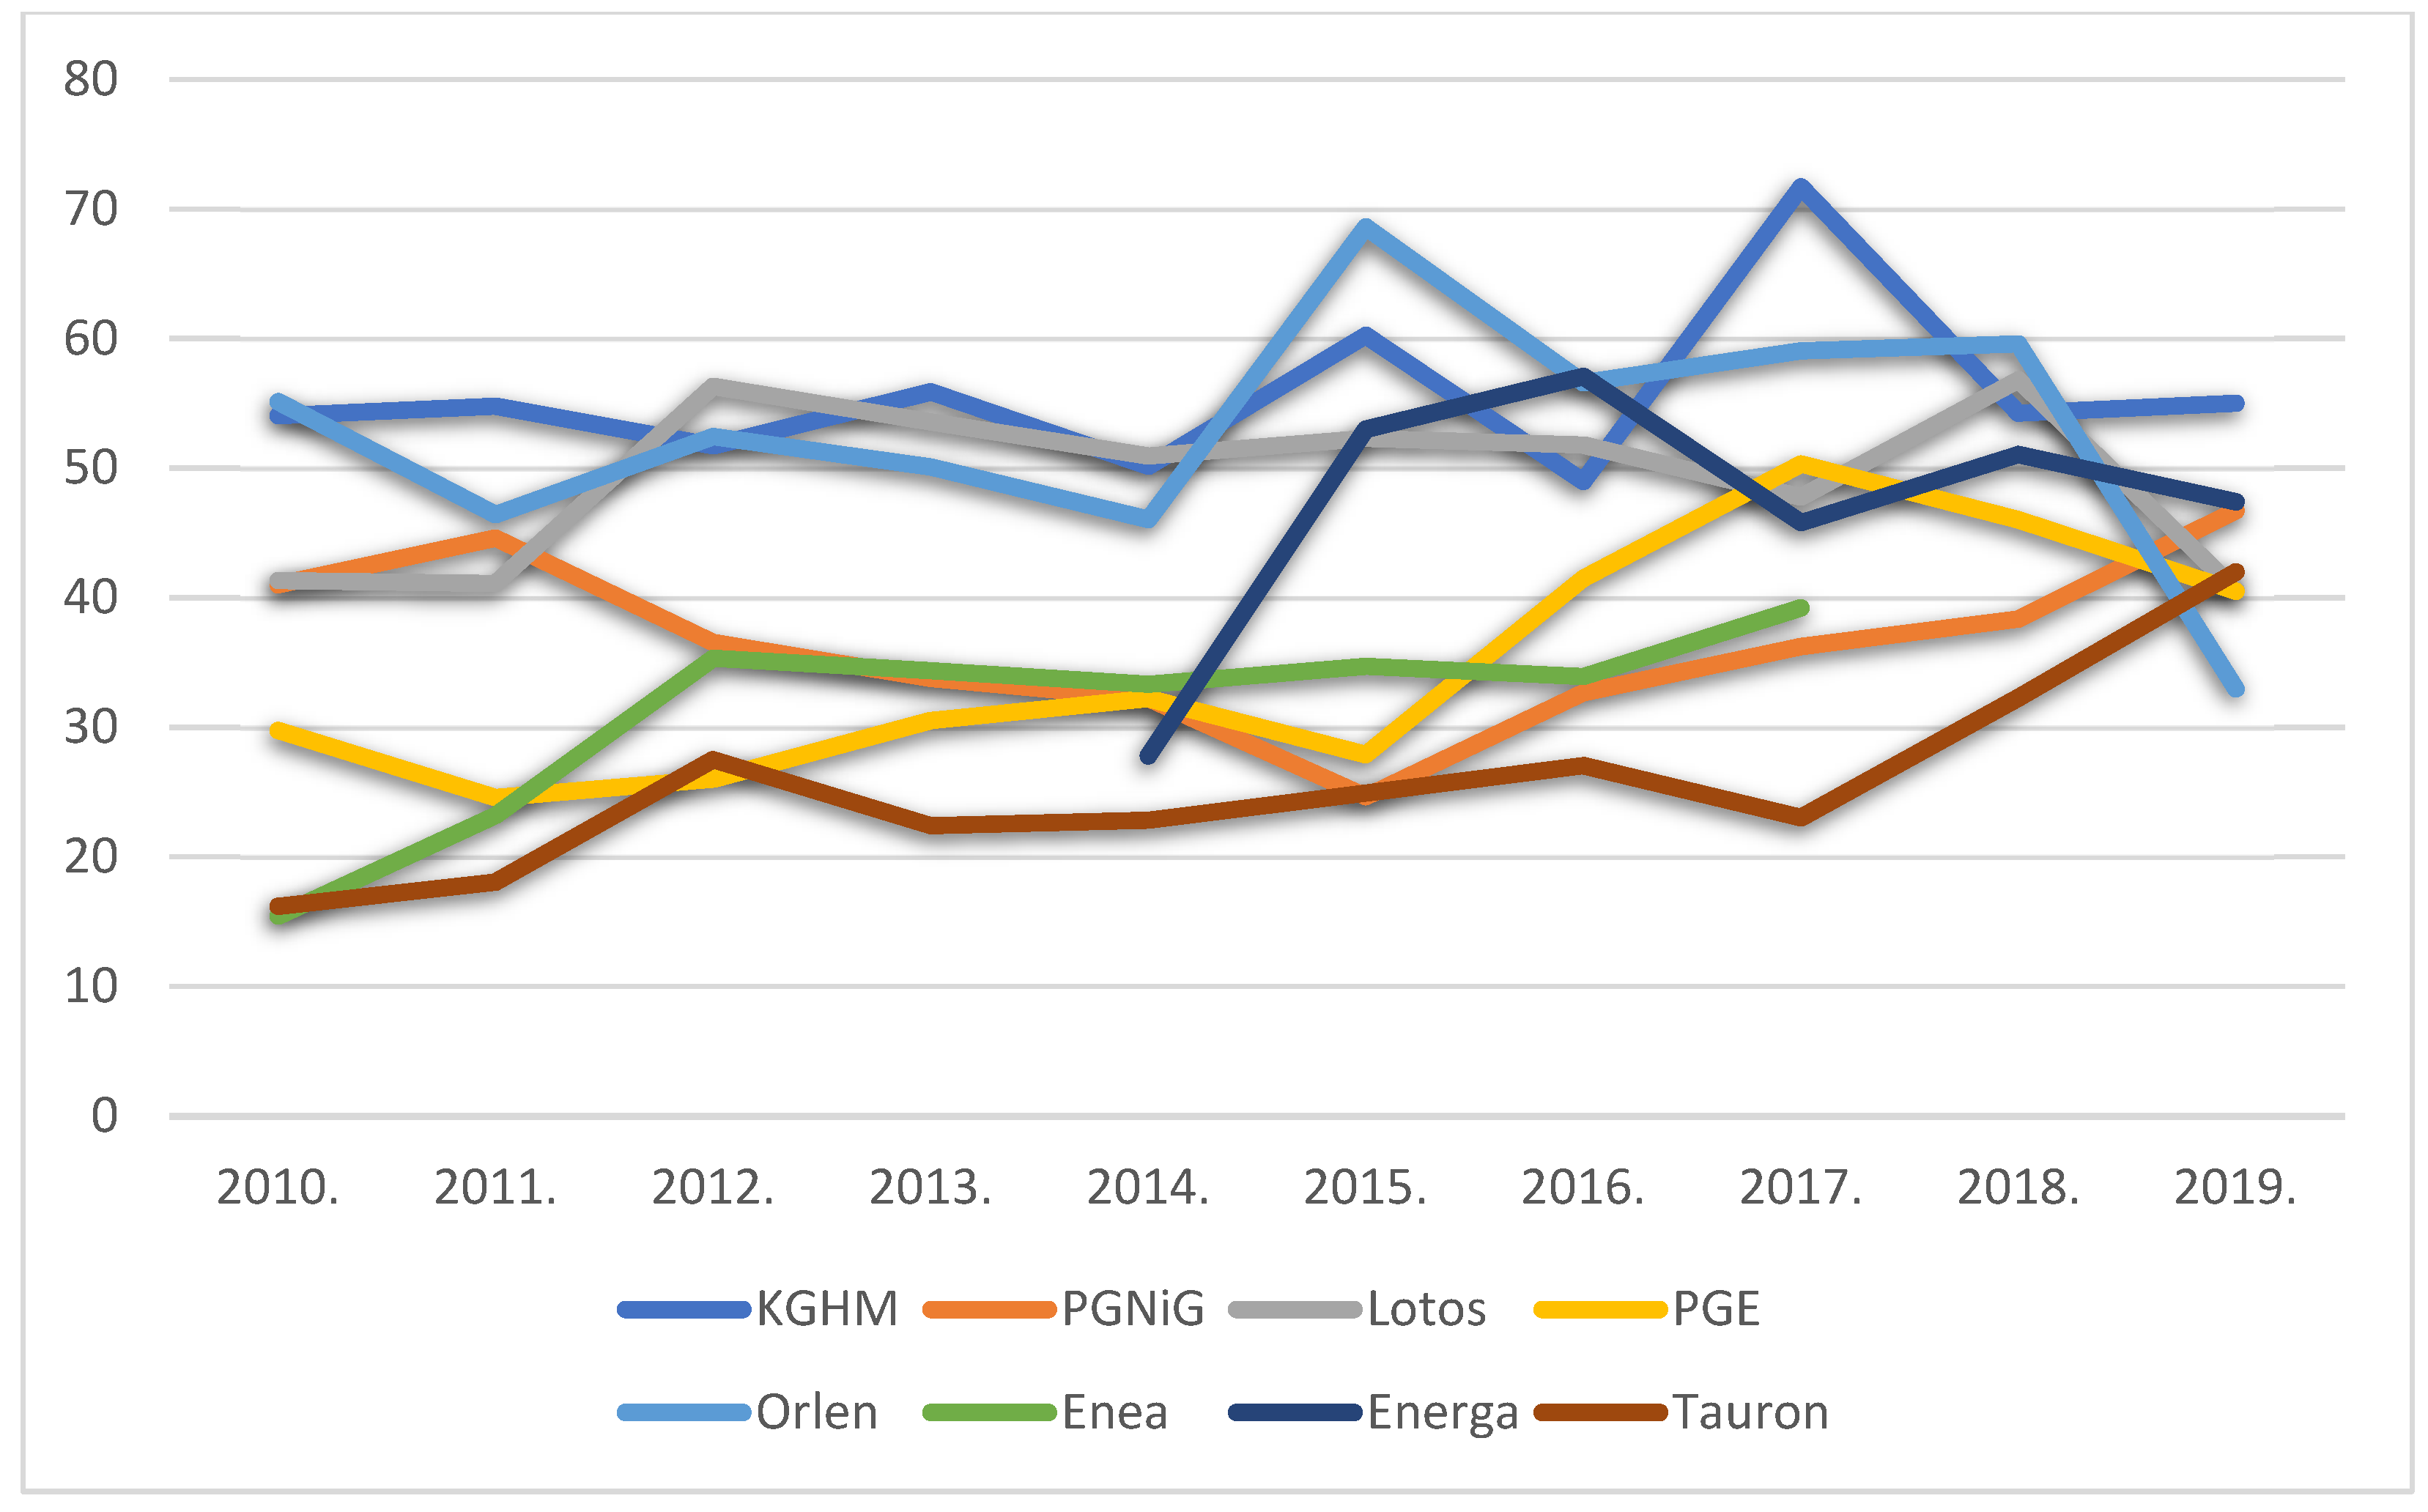
As among the indicators enumerated as the group of ESG, a leading role is played by ESG Combined, thus empirical data, which reflects its measurement, constitutes the basis for the analysis presented. As regards the registered value noted by the particular enterprises in the subsequent years in this sphere, great differentiation occurs here. Throughout the period under review, these changes are of a rather turbulent and unrelated nature. Only in the final phase of this period are there combined and simultaneous approximations of the results for the entire group of the analysed entities. This occurs at a level that is generally higher than reading the analysed values from the beginning of the time period under review (this holds true with reference to 6 out of 8 analysed cases). Hence, it is possible to state that the group of analysed enterprises treated as a whole achieved a certain degree of success in the sphere of ESG (Figure 2).
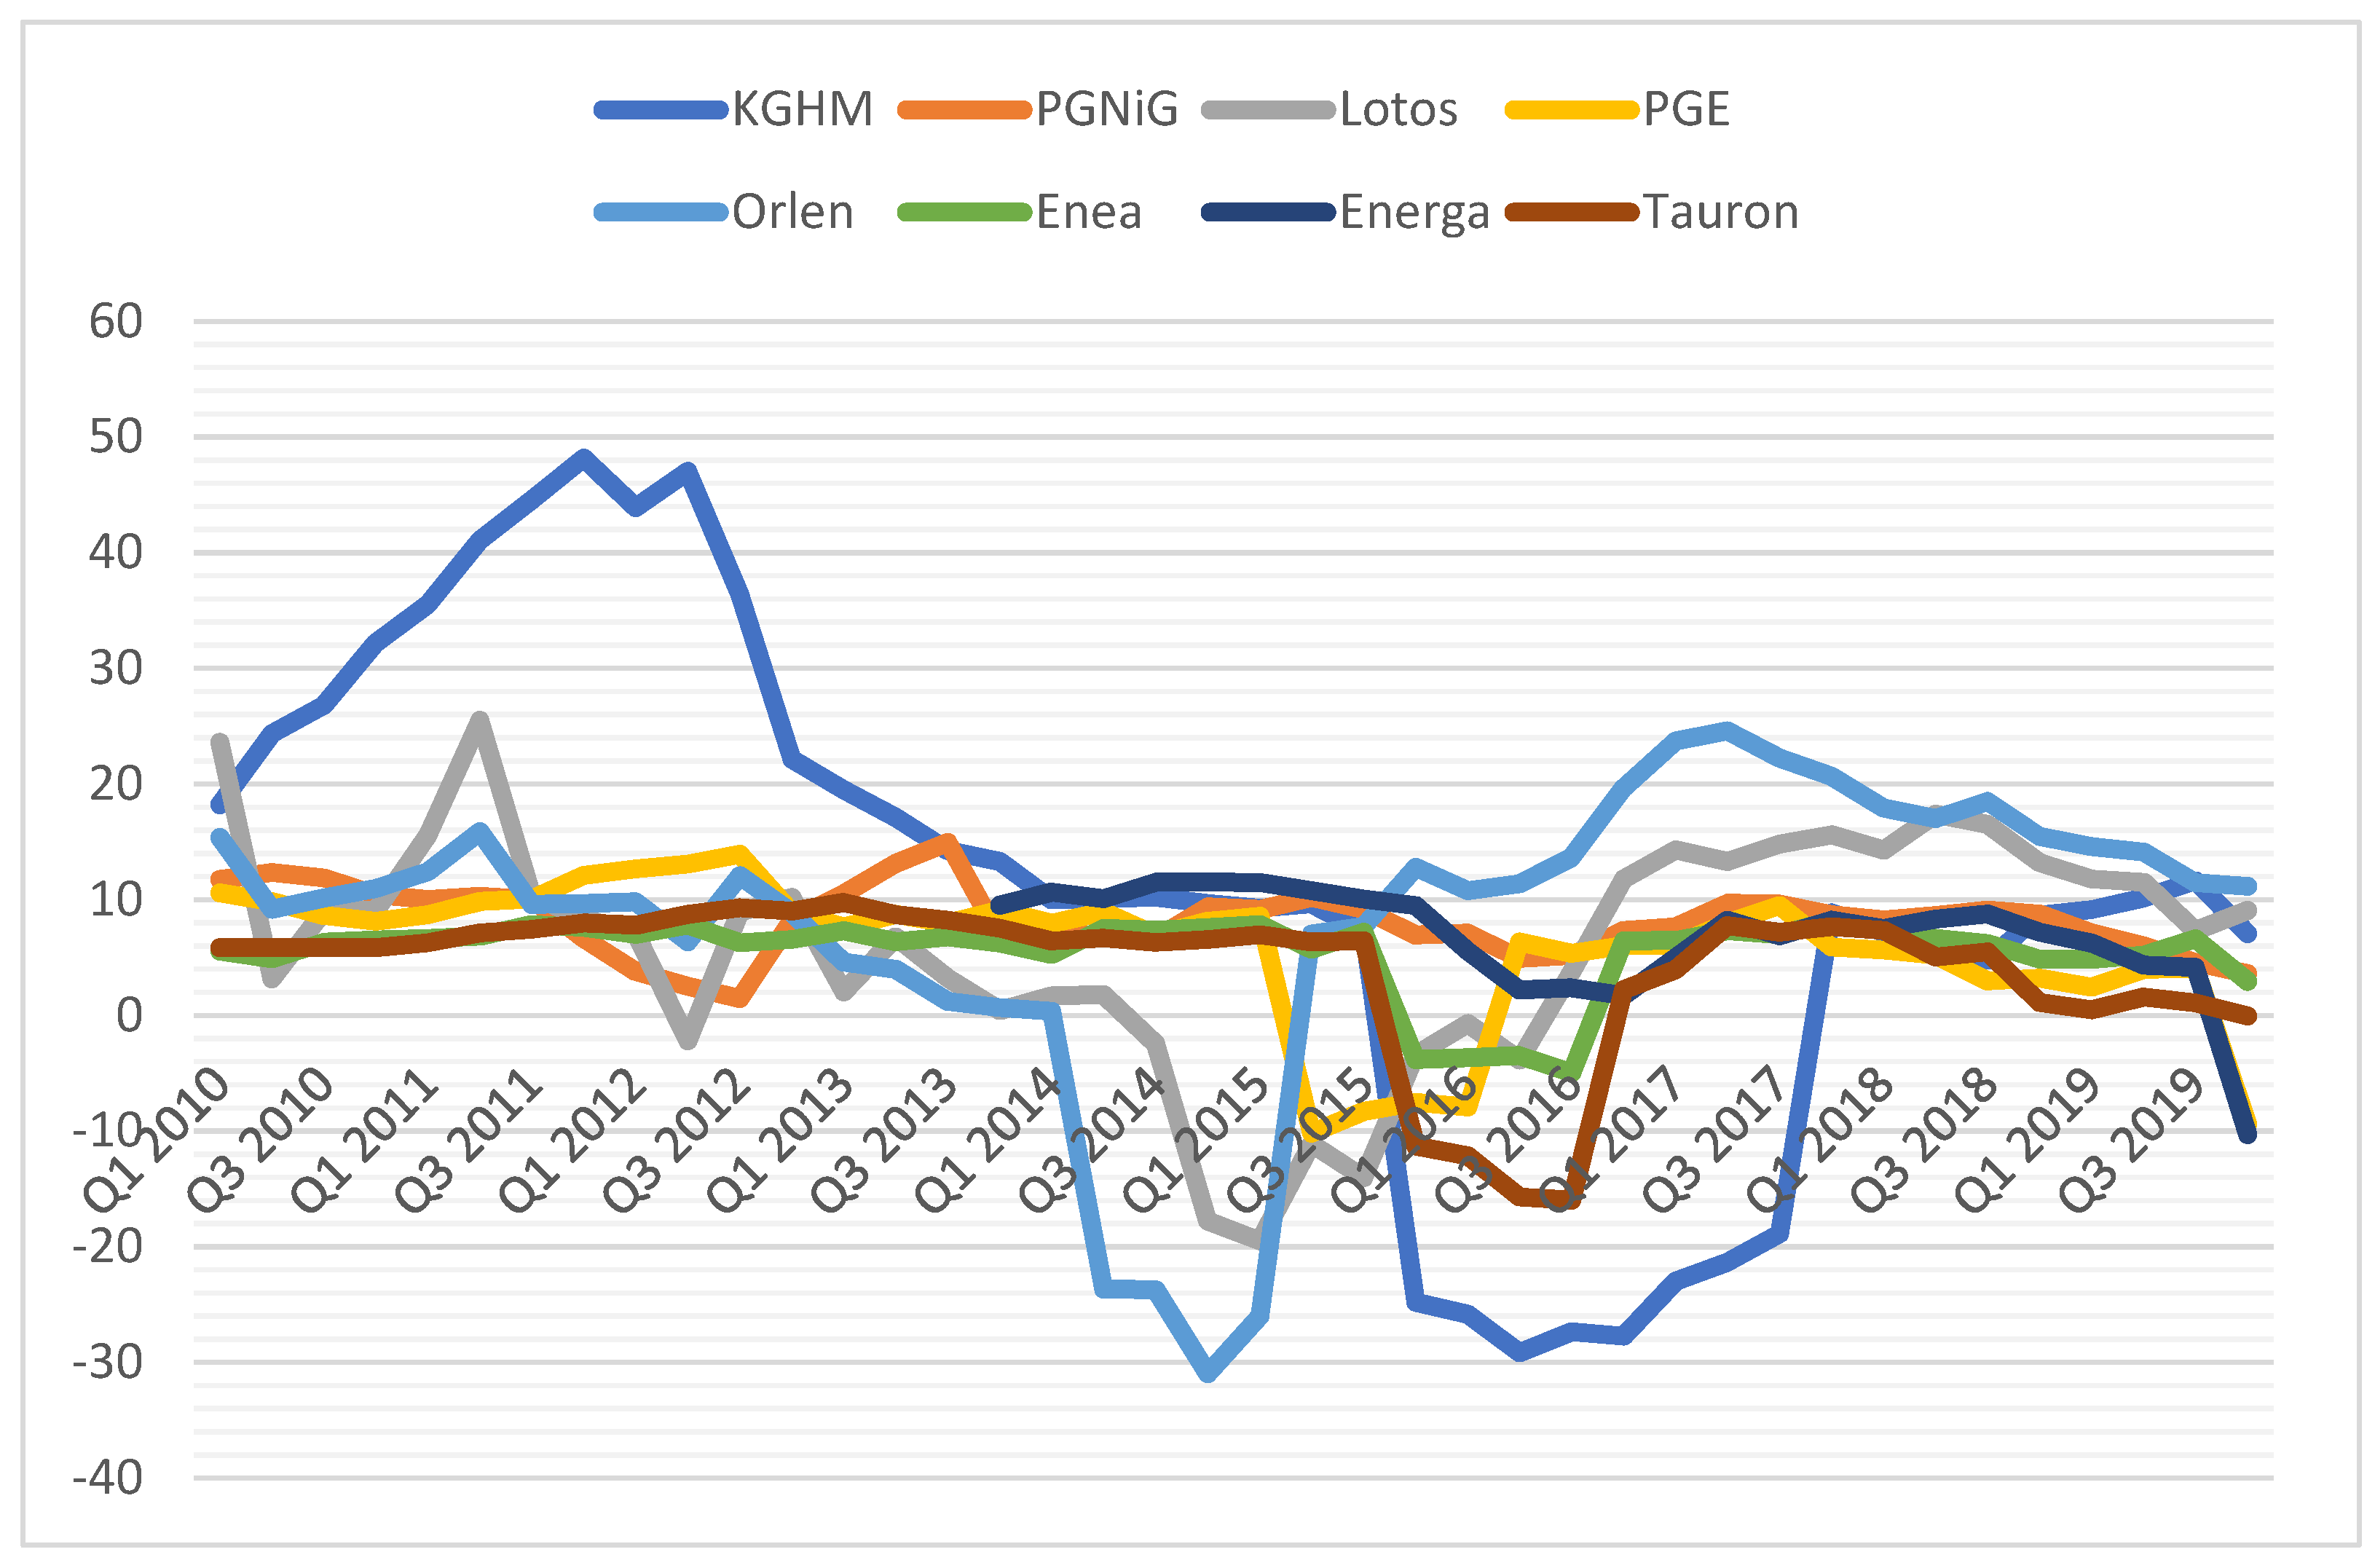
In the case of the ROE indicator (Figure 3), two circumstances attract particular attention. The first of these is associated with the distinction of the set of data characterizing the situation of the enterprise KGHM. This is due to the fact that business activities in the energy sector are secondary from the perspective of this entity (the primary business activity is operating in the market of metal resources). Nevertheless, due to the magnitude of the secondary business activity involving the production and distribution of energy, the aforesaid enterprise is becoming one of the leaders of the analysed sector. The latter circumstance that draws attention is the multitude of negative readings of the ROE indicators in the period of 2014–2017.
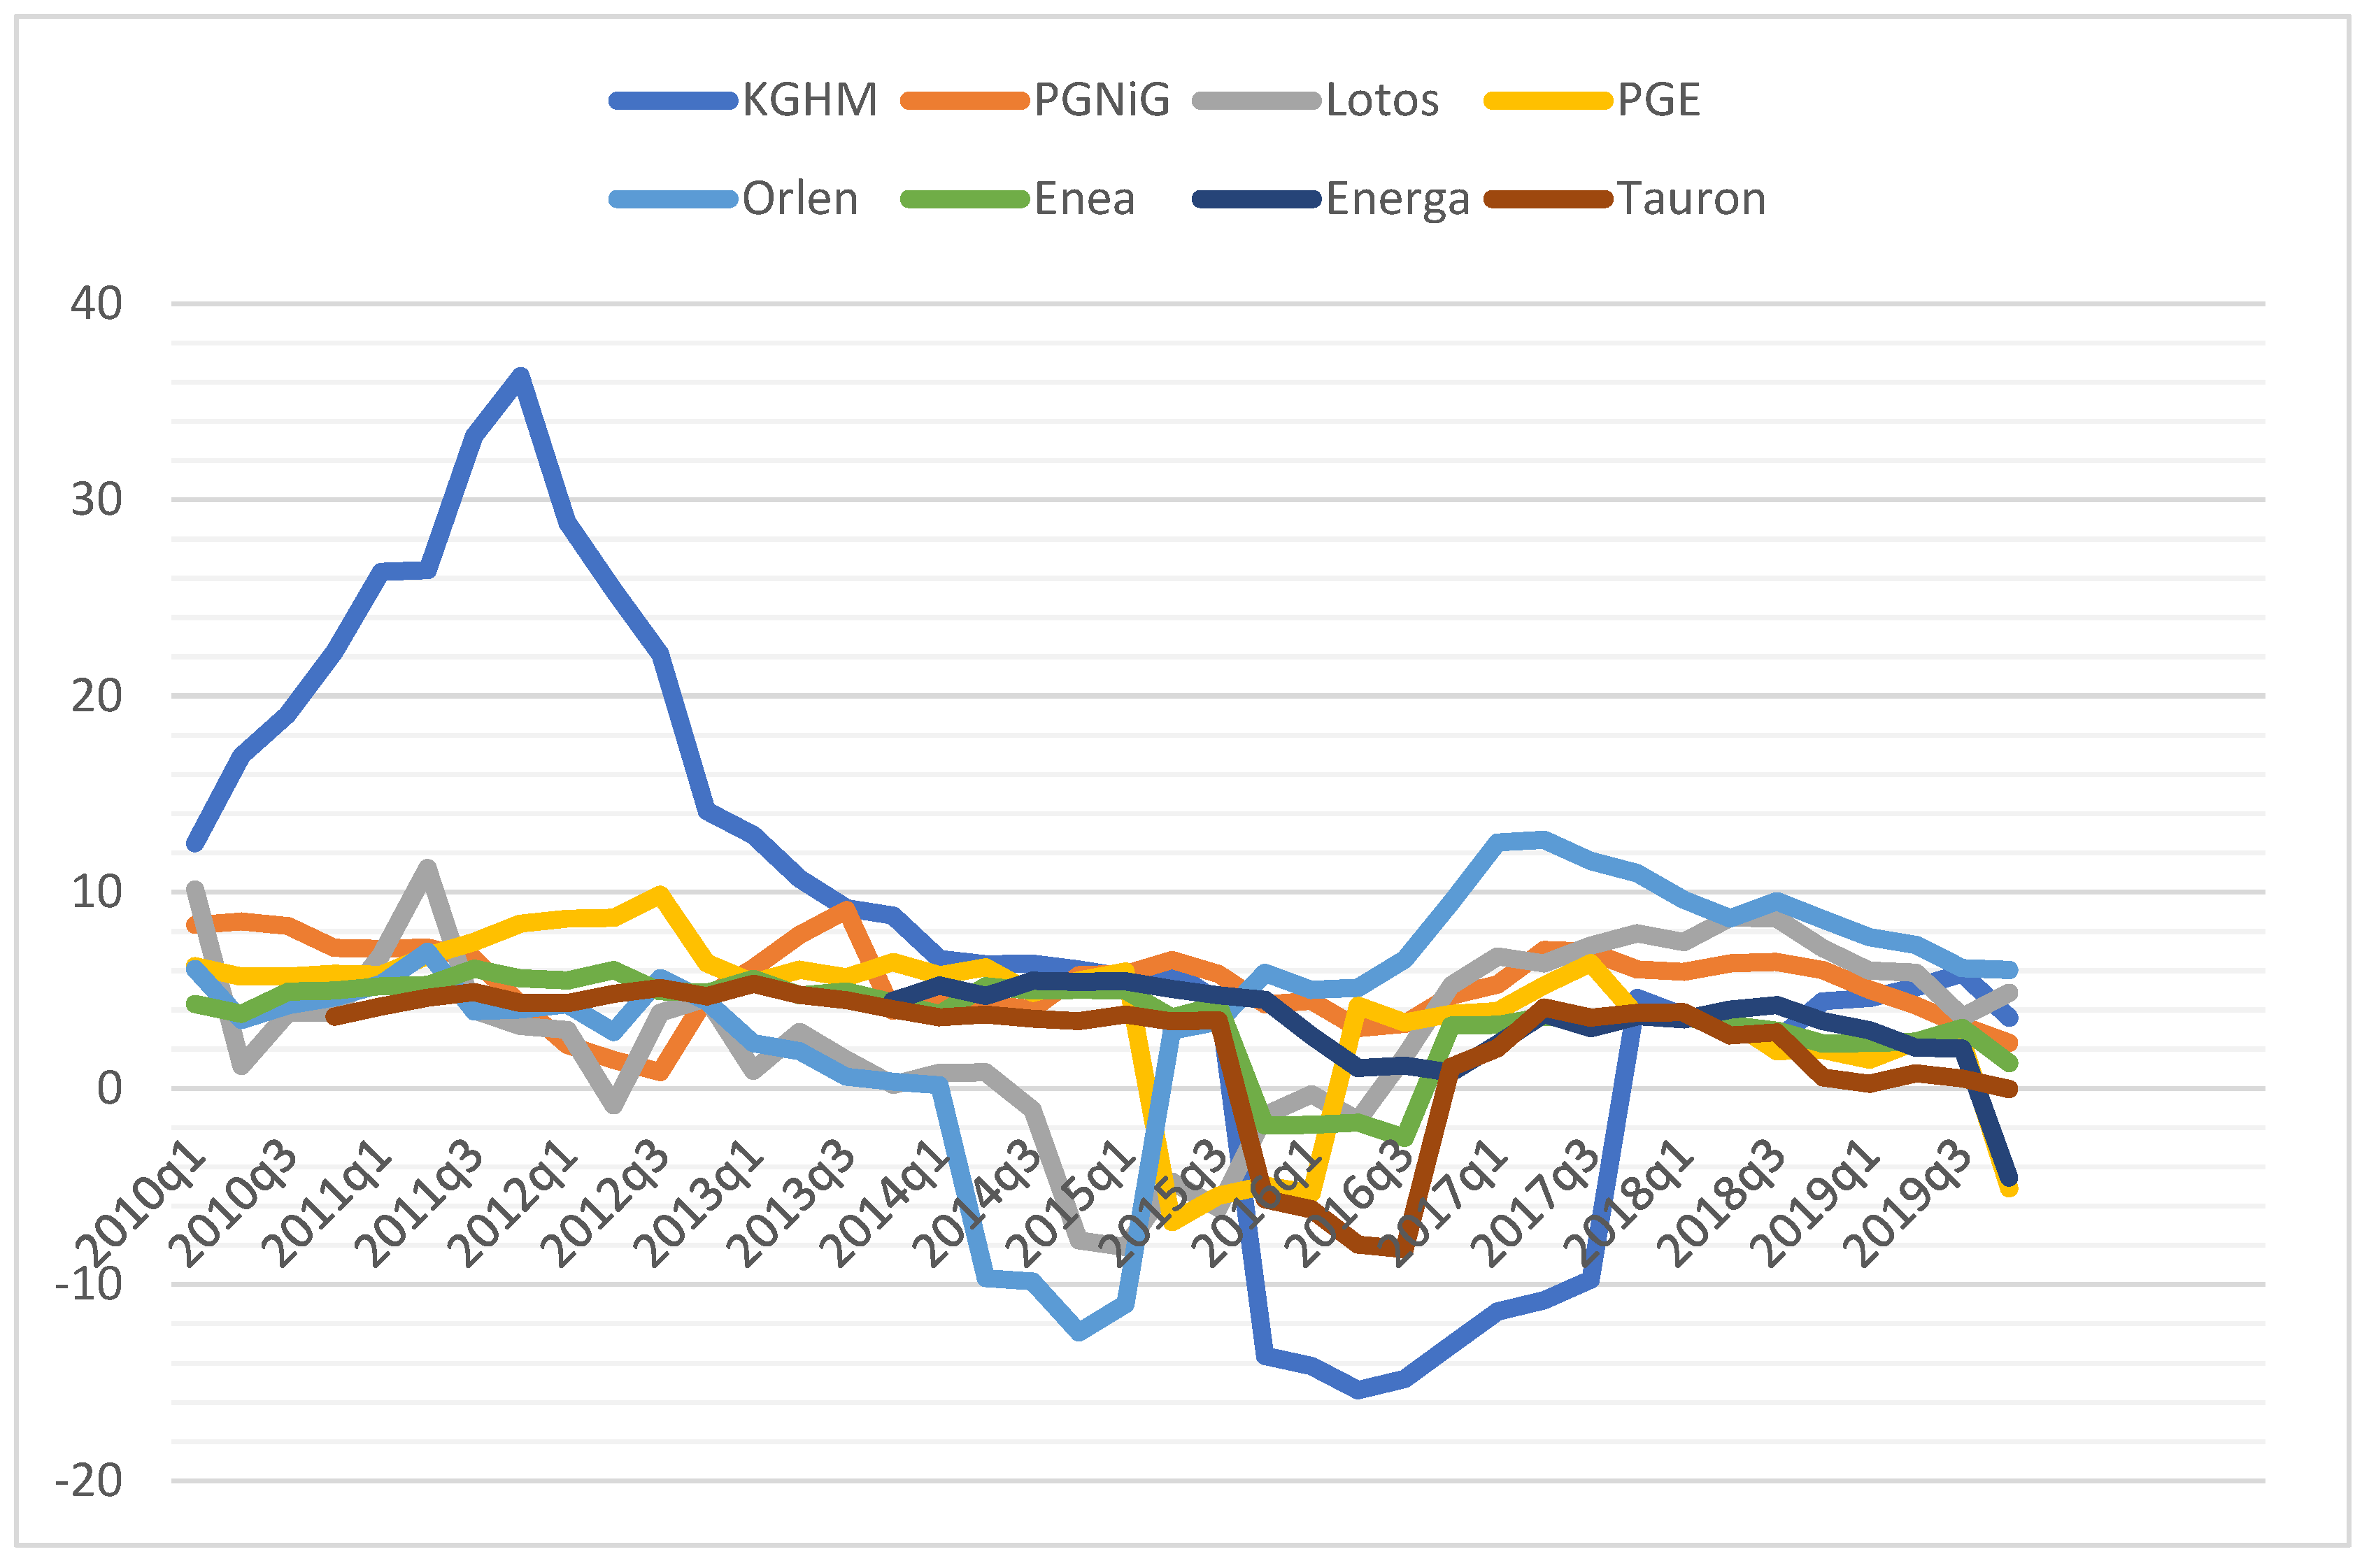
The ROA indicator reacted in a manner that was approximate to the ROE indicator in the period under analysis (Figure 4). Likewise, a clear distinction is revealed in terms of the set of data characteristic for the situation of the enterprise KGHM. In the second diagram, this phenomenon is even more visible than in the first one. A similar period of 2014–2017 noted the occurrence of a range of negative readings.
In the case of the enterprise KGHM Polska Miedź S.A. (Table 3), attention is drawn to the values of the high correlation between the indicators of the ESG Score and the financial indicators of ROE, ROA, ROS (all three are negative dependencies), while also A/E (positive dependency). Likewise, ESG Controversies indicates similar connections with the set of three indicators of ROE, ROS, A/E (in which the return of each of these dependencies changes to the opposite scale in comparison with the situation described as the first one). In the remaining cases, the correlation is at the level of average or weak.
The correlation combining the indicators characterizing the situation of the enterprise Polskie Górnictwo Naftowe i Gazownictwo S.A. (Table 4) in the majority of cases is of little strength. As regards the financial aspect, attention is drawn to the high level of correlation (negative dependency) between the indicators A/E and the set of indicators ESG Score and ESG Combined. The relation between the indicators CR and ESG Combined is close to the threshold of the correlation, which is possible to define as high (negative).
The situation of the enterprise Grupa Lotos S.A. (Table 5) does not facilitate the observation of the existence of the values of the indicator of the correlation at a level that could be defined as high (more so, as very high). With regard to the financial aspect in the analysis conducted, the dependency is close to the aforementioned level between the indicators A/E and ESG Controversies. The second case to some extent stands out against the backdrop of the others, having low values, namely the relation between the indicators A/E and ESG Score.
The table of correlations formulated on the basis of analysis of the data associated with the enterprise PGE includes three values that attract attention (Table 6). A significant role is played here by two out of six financial indicators taken into account. Thus, it is worth noting the values expressing the relation between A/E and ESG Controversies (high negative value), while also TAT with two indicators of ESG (Score and Combined) of high negative dependency.
In the case of the enterprise Orlen (Table 7), the financial indicators feature slight connections with the sphere of ESG. Nevertheless, it is possible here to indicate total regularity. In the case of all the columns of the table, the scope of the absolute values of the stated correlations read (namely, by omitting the events involving the change of the sign for an opposite), rises during the course of moving from the left to the right side. This is certified by the fact that the controversies discovered surrounding the analysed enterprise (whose significance was measured by means of the ESG Controversies indicator) had a lower impact on the financial standing of the enterprise than the fundamental achievements of Orlen with regard to the sphere of ESG.
Of the financial indicators that characterize the situation of the enterprise of Enea (Table 8), the strongest values of the positive correlation combine the indicator of A/E with the ESG Score (high positive dependency), while also the ESG Combined (identical high positive dependency). A further value of the correlation that requires noting (this time at a level of very high negative), occurs between the indicators CR and ESG Score and ESG Combined. The lack of significant events evoking controversies around the analysed enterprise (whose significance was measured with the aid of the ESG Controversies indicator), results here in the lack of difference between the values of the correlation combining the sphere of finance both with the indicators of ESG Combined and ESG Score.
The results of calculations conducted with reference to the enterprise Energa indicate a high range of correlations (Table 9). These dependencies combine the indicator of ESG Score with ROA and TAT (negative correlation), as well as the indicator ESG Controversies with ROE, ROA, CR, ROS (positive dependency). The acquired set of values registered in the table indicates that apart from one case (the A/E indicator), greater impact on the sphere of finances of the analysed enterprise was exerted by the occurrence of potential events that evoked controversies around the enterprise of Energa (whose significance was measured by means of the ESG Controversies indicator).
In the case of the final entity analysed, the enterprise Tauron (Table 10), among the financial indicators a high correlation only occurred between the indicator A/E and ESG Score and ESG Combined (in both cases the dependency is positive). Once again (as in the case of Enea S.A.), there was a lack of significant events that evoked controversies around Tauron (whose significance was measured by means of the ESG Controversies indicator), which resulted in a lack of differences between the values of the correlation and combined the sphere of finances with both the indicators of ESG Combined and ESG Score.
The acquired results do not create an unequivocal picture of the situation. Despite the occurrence of cases of correlation at a high level, and sometimes very high, the particular cases for analysis significantly differ from one another. There is a lack of regularity here, or a repeated pattern, which would facilitate the discovery of a pattern of the impact of the sphere of ESG on the financial standing of the enterprise.
In the case of ROE, ROA, ROS and CR indicators, the significance F value indicates that there is no statistically significant relationship between these indicators and the value of the ESG Combined indicator (Table 11). The results show also that regarding the TAT and A/E indicators, there is statistically significant relationship between these indicators and the value of the ESG Combined indicator but the value of the R2 coefficient is very low. R2 indicates that models explain only 0.1798 changes in TAT indicator and 0.1767 changes in A/E indicator. In the case of TAT, an increase in the ESG Combined value by one unit causes the TAT value to increase by 0.0160, and in the case of A/E, the corresponding increase is 0.0116. This leads to the conclusion that the linear regression model (estimated by the classical method of least squares) is of little use for explaining the influence of ESG score on CFP in the analysed sample. The obtained results lead us to consider the possibility of adding an additional variable to the regression model in the form of an assessment of the degree of diversification of the activities of the surveyed entities. Such an observation will allow determination of whether, in the case of operating in sectors other than energy, the relationship between ESG and financial indicators will change significantly.
In the case of the TAT index, adding a variable describing the diversification of the company’s activity to the regression model causes that the R2adj coefficient reaches the value of 0.4985 (Table 12). In the case of the A/E index, adding a variable describing the diversification of the company’s activity to the regression model causes the R2adj coefficient to reach the value of 0.2433. The significance F value is sufficiently low for both TAT and A/E, which allows the resulting models to be used. In both cases, adding an additional variable is an effective and justified procedure and the comparison of the values of the bESG and bDIV parameters shows that the influence of the ESG Combined indicator on the TAT and A/E indicators is marginal in relation to the circumstances of operating only in the energy sector or in a diversified manner (this means in sectors where the free market rules apply). Such a situation may result from the fact that activities in the field of ESG (in the energy sector) are mainly adaptive to dynamically changing legal provisions and look similar in relation to all entities (the legally required scope of the changes is very wide and expensive, therefore enterprises do not undertake additional activities of a significant nature). In addition, revenues are generated on a market that is subject to strict administrative regulations (both in terms of prices and limited market access). What is more, all surveyed entities are partially state-controlled (as one of the key shareholders) and therefore the principles of conducting business activity by energy sector enterprises cannot be considered fully free-market.

5. Discussion

The research conducted reveals that the energy sector has an enormous impact on the majority of the sectors of the economy. This is particularly visible in the period of the energy transformation, which is caused by the necessity to refrain from the use of bituminous and lignite coal in the energy sector. Simultaneously, the issue of the management of enterprises in the energy sector is becoming an important practical and methodological issue.
During the past several decades, climate change has become an economic problem visible in the annual reports of enterprises. Based on the theories of organizational legitimization where the state or status in which it exists, when the system of values of the entity is in accordance with the system of values of a great social system, if an entity is part of the energy sector it should consider adjustment to climate change as the principal part of its behaviour and subsequently publish full reports [89,90,91].
This would increase the value of the organization by showing how it is socially responsible and may even have an impact on the positive phenomena (e.g., trust, loyalty and civic behaviour), while also eliminating negative phenomena (e.g., organizational silence) and organizational human resources. This problem blends in with the theory of the stakeholders, according to whom the organization should act not only in the interests of shareholders but also internal and external stakeholders, such as employees, suppliers, governments, etc. In accordance with this theory, the energy sector may enhance its credibility by providing various stakeholders with all the required information [92,93].
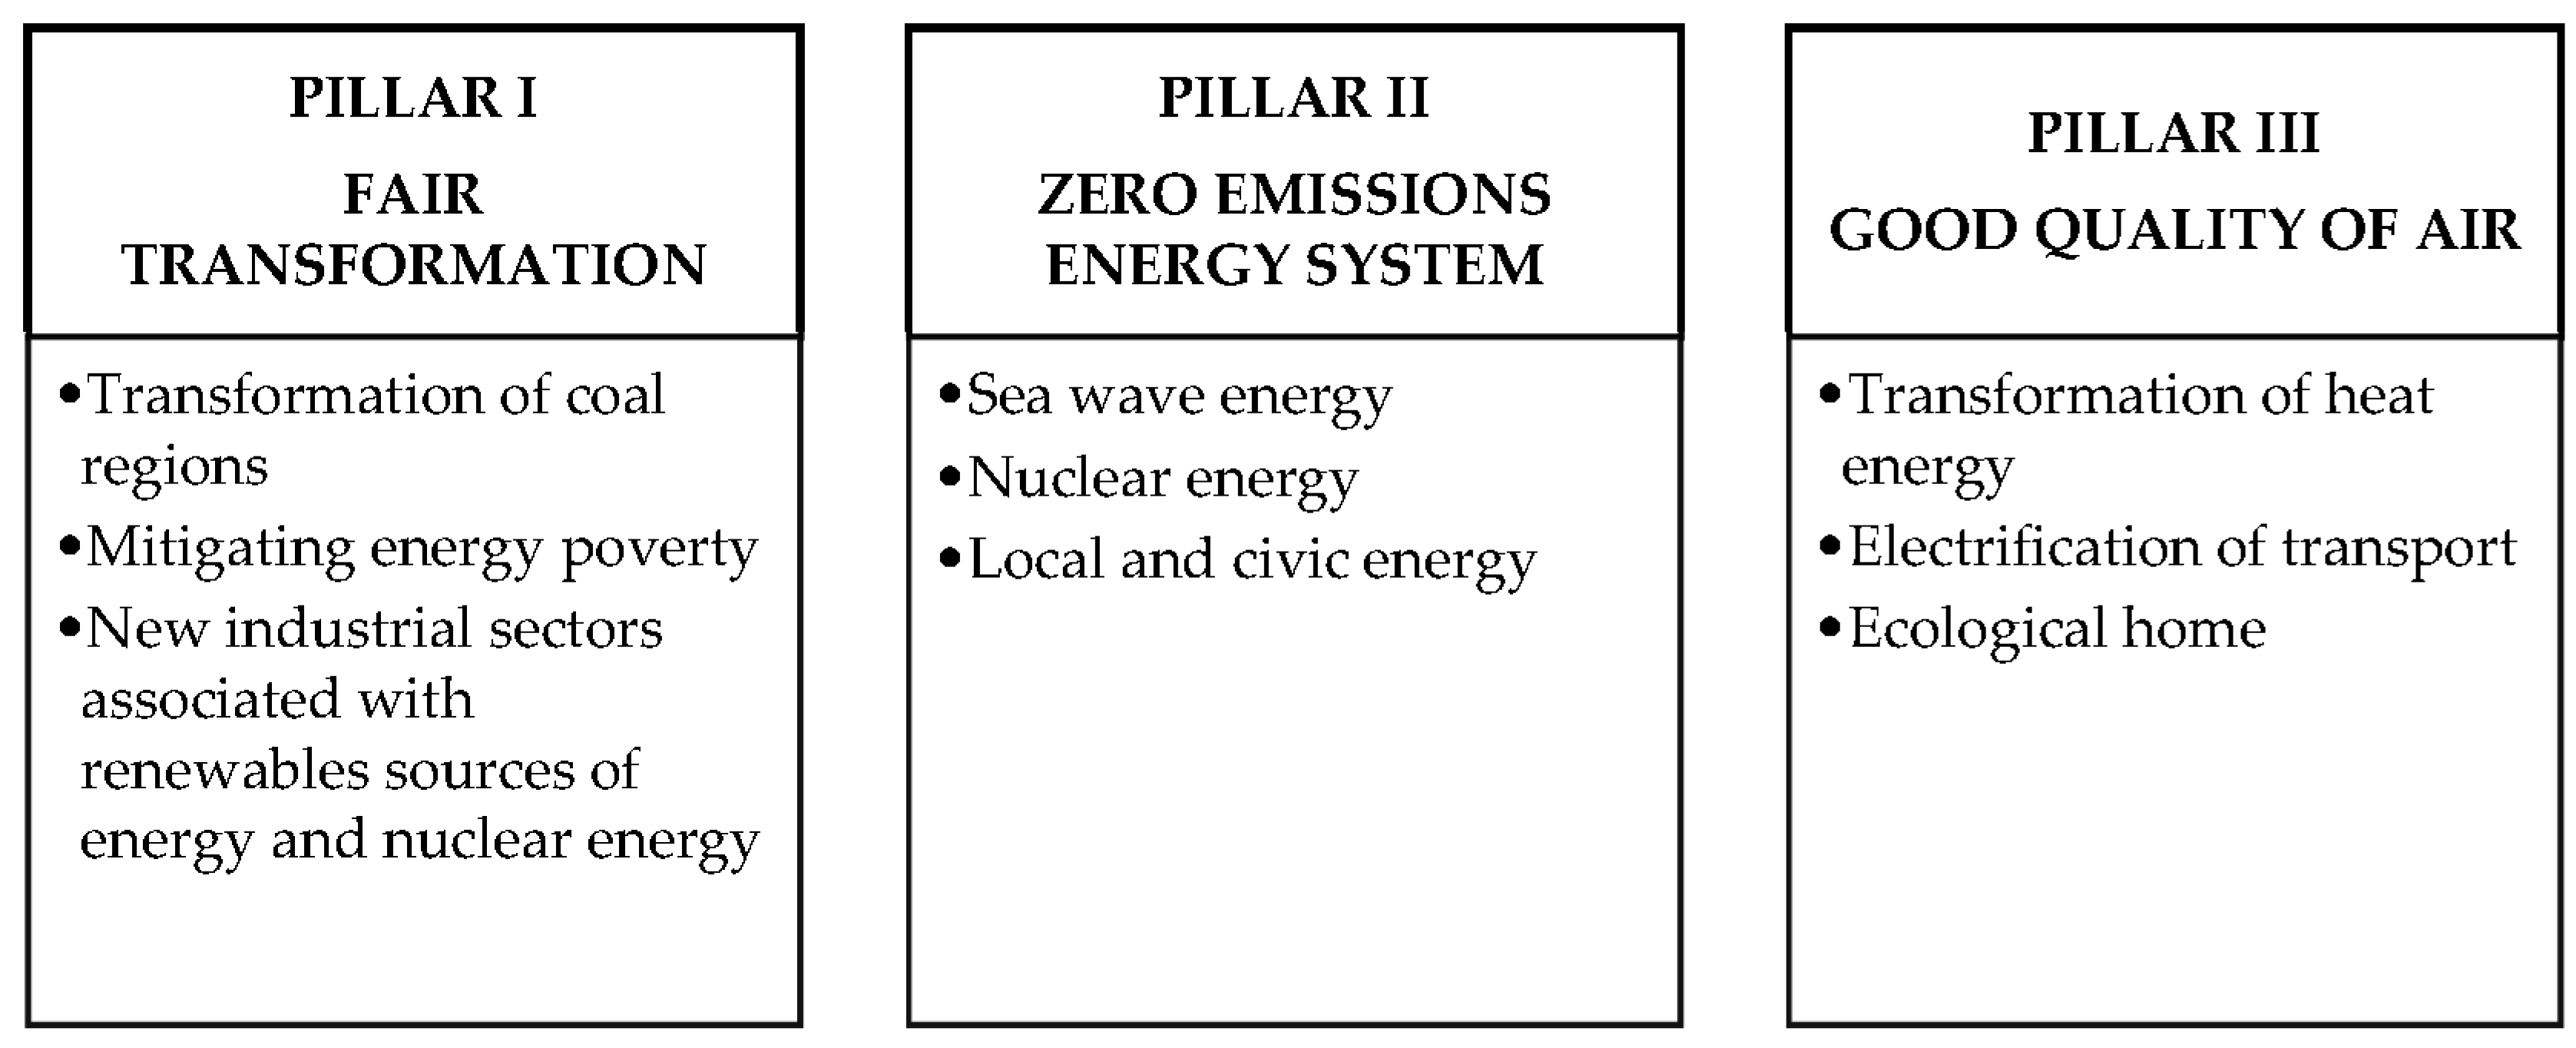
With the aims of easing the problem of the transformation of the energy sector, which is essential, the Ministry of State Assets (MSA) submitted a draft of a document entitled “Transformation of the energy sector in Poland. Phasing out the coal production assets from state-owned companies” for consultation [94]. The process aimed at phasing out coal production assets from energy companies that belong to the State Treasury has commenced. This will probably facilitate the secure and gradual transformation of the electroenergy sector that is adjusted to Polish circumstances, in the direction of the acquisition of energy from low- and zero-emission sources over many years. The document emphasizes that the program constitutes the implementation of the “Energy Policy of Poland up to 2040” in the area of supervision by the owner of the companies that belong to the State Treasury and is aimed at adjusting energy concerns to the challenges of the transformation. Following the phasing out of coal assets, they will focus on the execution of low- and zero-emission investments.
The document assumes the acquisition by the State Treasury of PGE Polskiej Grupy Energetycznej S.A., ENEA S.A., TAURON Polska Energia S.A. and companies dealing with the production of electric power in conventional entities powered by coal. The proposed program envisages the phasing out of only the coal power stations while simultaneously leaving the heating plants and co-generation plants within the structure, which will in turn be gradually replaced by gas production units adjusted to being powered in the future by zero-emission hydrogen.
In relation to the inseparability of the energy complexes powered by lignite coal among the acquired assets, there are also lignite coal mines. However, assets associated with the extraction of bituminous coal will not be acquired. The subject of phasing out will also not include power plants employing the combustion of coal, as their modernization is planned in the direction of low- and zero-emission sources.
MSA has provided information about the integration of the acquired assets in one capital group as a company totally owned by the State Treasury that will function in accordance with the principles of the Code of Commercial Companies [93].
The owner of the coal assets will be the National Agency of Energy Security (NAEB), which aims to guarantee the security of energy for the country, thus ensuring the essential availability of power in the energy system and restricting itself to the necessary replacement investments and gradual phasing out of coal units in favour of the progressive growth of power from low- or zero-emission sources [95]. Together with the connection to the National Grid System of the new low- or zero-emission sources of generation, NAEB shall withdraw the coal units from use.
The Ministry of State Assets has announced that PGE Polska Grupa Energetyczna, Enea, and Tauron Polska Energia shall continue to develop their business activities on the basis of the assets held in the areas of distribution, heating, turnover and generation of energy from low- and zero-emission sources. In the area of production, the companies shall focus on ensuring new production power that is to replace the currently used coal-generated power in the National Power Grid. The phasing out of coal assets will facilitate execution of the controlled energy transformation [94].
In the context of the suggestions of the Ministry of State Assets, it is necessary to indicate that within the framework of the transformation of the energy sector in Poland, a document was signed in February 2021 entitled “Energy Policy of Poland up to 2040”. EPP [96] is a strategic and directional document, the necessity of adoption of which arises from the Energy Law. Its essence is to undertake strategic investment decisions that are aimed at the use of the national economic potential, while also the potential of raw materials, technological and personnel resources, and driving the economy by means of the energy sector, which would favour fair transformation. In the document, the aims, scope and elements of energy policy in Poland are specified, which include ensuring energy security for the country, the growth of the level of competitiveness of the economy and its energy efficiency, and consequently environmental protection. These are convergent with the EU aims in part, but not as a whole, as in the EU there is a prevalence of issues in the sphere of environmental protection and the climate (here the priority is the decarbonization of the energy sector and, in the future, the climate neutrality of the economy), whereas in Poland, the priority is the security of energy. EPP constitutes a document that contains a prognostic section that encompasses no less than 20 years (thus, the time horizon of the project is up to 2040), while its principal composite element includes a program of executive actions describing the instruments to facilitate their implementation while also evaluating the energy policy of the state. The scope of the document is wide-ranging, as it encompasses the fuel–energy balance of the country, as well as the production and transmission capacity, while also the directions of restructuring and transformation in this sector.
It is necessary to indicate that the Polish enterprises of the energy sector that are listed on the stock exchange illustrate far-reaching specifics. This is first and foremost caused by the fact that in this category of entities, enterprises with a prevalent level of state ownership are of key importance, while also the fact that the energy market is subject to strict administrative regulations. Hence, the mechanisms (such as the impact of the indicators of ESG on the financial standing of enterprises), whose very existence may be expected in conditions of free competition, albeit in the Polish conditions they are weakened and frequently eliminated.
The specifics of reporting on the results of the business activities conducted by state-owned companies signifies, among other things, the publication of data in the following formulations: on a monthly, quarterly and annual basis. In the opinions of the authors, monthly data refer to excessively short periods in order to have a real impact on the change of the level of the indicators of ESG on the financial performance of the enterprises. However, data on an annual basis are of an excessively general nature, thus it was assumed in the research that all calculations should be conducted on a quarterly basis. The procedure of calculating the values of correlations was conducted on the basis of a complete set of available data, in other words, random samples were not availed of.

6. Conclusions

In this paper, the difficulties that occur in the sphere of the modernization of power engineering have been described, while simultaneously a critical assessment of the role played by the state in this process has been provided. The energy sector is a very specific one in which, due to the intricacy of the process, the regulatory ownership role of the state may remain justified, the more so as the intricacy and frailty of the energy market also overlaps with global trends of a decline in the identification of employees with corporations in which they are employed. The aforementioned arguments support the need to increase the ownership quality of the impact of the state on the sector and not necessarily its total elimination.
In sum, it has been indicated that the Polish energy sector has delayed its transformation, thanks to the way it functions in a protected system, in which their own defensive mechanisms were shaped by, among other things, strong trade unions, ties with politics, as well as the acceptance of the existing tools for coordinating the employment structure (collective wage agreements, social welfare packages and the modified tool of restructuring for the purposes of protecting the internal status quo). In effect, the employment structure in the Polish energy sector has remained ineffective, which may be illustrated by comparing the fundamental indicators of operations with other countries, as well as with reference to the most efficient plants in the sector, which in turn has led to the deepening of the competence gap and brought with it a paralysis of the internal tools of modernization of the employment structure, giving rise to the theory that the modernization of energy enterprises has been delayed. Such conditions may hamper the potential of the energy sector in Poland to incorporate ESG factors into the operations of individual entities, and thus might limit the materiality of the relationship between socially responsible activities and the economic results of companies.

Author Contributions

Data curation: M.B., A.K., A.S.; Formal analysis: M.B., A.S.; Investigation: M.B., A.K.; Methodology: Z.J.M., A.S., M.M.S.; Resources: A.K., A.S., M.M.S. All authors have read and agreed to the published version of the manuscript.

Funding

The project is funded by Institute of Economics, Finance and Management, Jagiellonian University.

Institutional Review Board Statement

Not applicable.

Informed Consent Statement

Not applicable.

Data Availability Statement

Not applicable.

Conflicts of Interest

The authors declare that there is no conflict of interest.

References

  1. Ehrenhalt, W. Kierunki transformacji polskiej energetyki. Energetyka-Społeczeństwo-Polityka 2018, 8, 88–103. [Google Scholar] [CrossRef]
  2. Dąbrowski, I.; Staniek, Z. Property rights in the process of privatization of the Polish energy sector. Pr. Nauk. Uniw. Ekon. Wrocławiu 2015, 402, 70–83. [Google Scholar] [CrossRef] [Green Version]
  3. Talking about climate change. Strateg. Dir. 2019, 35, 7–8. Available online: https://www.emerald.com/insight/content/doi/10.1108/SD-06-2019-0106/full/html?skipTracking=true (accessed on 10 November 2021). [CrossRef]
  4. Matisoff, D.; Noonan, D.; O’Brien, J. Convergence in environmental reporting: Assessing the carbon disclosure project. Bus. Strategy Environ. 2013, 22, 285–305. [Google Scholar] [CrossRef] [Green Version]
  5. Fraś, B.; Ivashchuk, O. Rola klastrów w zrównoważonym rozwoju energetyki w Polsce. Energy Policy J. 2017, 20, 25–40. [Google Scholar]
  6. Lu, J.; Ren, L.; Yao, S.; Qiao, J.; Strielkowski, W.; Streimikis, J. Comparative Review of Corporate Social Responsibility of Energy Utilities and Sustainable Energy Development Trends in the Baltic States. Energies 2019, 12, 3417. [Google Scholar] [CrossRef] [Green Version]
  7. Vob, A.; Ellersdorfer, I.; Rath-Nagel, S. A Conceptual Framework for Sustainable Electricity Supply; EUSUSTEL-WP 8.2: Stuttgart, Germany, 2005. [Google Scholar]
  8. European Commission. Communication from the Commission to the European Parliament, the European Council, the Council, the European Economic and Social Committee and the Committee of the Regions, a New Industrial Strategy for Europe, Brussels. 2020. Available online: https://eur-lex.europa.eu/legal-content/EN/TXT/?uri=CELEX%3A52020DC0102 (accessed on 10 November 2021).
  9. Szczerbowski, R. Polityka energetyczna wybranych krajów europejskich a strategia energetyczna Polski. Energy Policy J. 2015, 18, 4–14. [Google Scholar]
  10. Tantau, A.; Santa, A.-M.I. Best Practices for a Sustainable Energy Sector at European Union Level; Chances and Challenges for Romania. Amfiteatru Econ. 2019, 21, 697–706. Available online: www.amfiteatrueconomic.ro (accessed on 10 November 2021). [CrossRef]
  11. Decision No 406/2009/EC of the European Parliament and of the Council of 23 April 2009 on the Effort of Member States to Reduce Their Greenhouse Gas Emissions to Meet the Community’s Greenhouse Gas Emission Reduction Commitments up to 2020. 2009. Available online: https://eur-lex.europa.eu/legal-content/EN/TXT/PDF/?uri=CELEX:32009D0406&from=EN (accessed on 11 June 2021).
  12. Communication from the Commission to the European Parliament, the Council, the European Economic and Social Committee and the Committee of the Regions a Policy Framework for Climate and Energy in the Period from 2020 to 2030, Brussels. 2014. Available online: https://eur-lex.europa.eu/legal-content/en/txt/pdf/?uri=celex:52014dc0015r(01)&from=pl (accessed on 11 June 2021).
  13. Jurasz, J.; Mikulik, J.; Ciapała, B. Potential extreme events in the Polish wind energy sector, based on historical data. E3S Web Conf. 2018, 44, 00059. [Google Scholar] [CrossRef]
  14. Khalid, B.; Urbański, M.; Kowalska-Sudyka, M.; Wysłocka, E.; Piontek, B. Evaluating Consumers’ Adoption of Renewable Energy. Energies 2021, 14, 7138. [Google Scholar] [CrossRef]
  15. Agora Energiewende and Ember. The European Power Sector in 2020: Up-to-Date Analysis of the Electricity Transition. 2021. Available online: https://www.agora-energiewende.de/en/publications/the-european-power-sector-in-2020/ (accessed on 25 September 2021).
  16. Ruszel, M. Rola surowców energetycznych w procesie produkcji energii elektrycznej w UE do 2050 roku. Energy Policy J. 2017, 20, 5–16. [Google Scholar]
  17. Ustawa z, dn. 10 kwietnia 1997—Prawo Energetyczne (DZ.U. z 2019, poz.755 z póź. zm.).
  18. Monitor Polski 2021 r. poz. 264, Ministerstwo Energii. Polityka energetyczna Polski do 2040 r. Warszawa: Ministerstwo Energii. 2021. Available online: https://www.dziennikustaw.gov.pl/M2021000026401.pdf (accessed on 9 June 2021).
  19. Ligus, M. Zrównoważony rozwój systemu elektroenergetycznego Polski—Analiza opłacalności i możliwości rozwoju energetyki odnawialnej. Pr. Nauk. Uniw. Ekon. Wrocławiu 2014, 329, 206–214. [Google Scholar] [CrossRef] [Green Version]
  20. Pelau, C.; Pop, N.A. Implications for the energy policy derived from the relation between the cultural dimensions of Hofstede’s model and the consumption of renewable energies. Energy Policy 2018, 118, 160–168. [Google Scholar] [CrossRef]
  21. Weder, F.; Koinig, I.; Voci, D. Antagonistic framing of sustainability by energy suppliers. Corp. Commun. Int. J. 2019, 24, 368–390. [Google Scholar] [CrossRef]
  22. Tantau, A.; Maassen, M.; Fratila, L. Models for Analyzing the Dependencies between Indicators for a Circular Economy in the European Union. Sustainability 2018, 10, 2141. [Google Scholar] [CrossRef] [Green Version]
  23. Silvast, A. Energy, economics, and performativity: Reviewing theoretical advances in social studies of markets and energy. Energy Res. Soc. Sci. 2017, 34, 4–12. [Google Scholar] [CrossRef] [Green Version]
  24. Diemuodeke, E.O.; Addo, A.; Dabipi-Kalio, I.; Oko, C.O.C.; Mulugetta, Y. Domestic energy demand assessment of coastline rural communities with solar electrification. Energy Policy Res. 2017, 4, 1–9. [Google Scholar] [CrossRef] [Green Version]
  25. Hörisch, J. The Role of Sustainable Entrepreneurship in Sustainability Transitions: A Conceptual Synthesis against the Background of the Multi-Level Perspective. Adm. Sci. 2015, 5, 286–300. [Google Scholar] [CrossRef]
  26. Pop, O.; Dina, G.C.; Martin, C. Promoting the corporate social responsibility for a green economy and innovative jobs. Procedia Soc. Behav. Sci. 2011, 15, 1020–1023. [Google Scholar] [CrossRef] [Green Version]
  27. Maqbool, S.; Zameer, M.N. Corporate social responsibility and financial performance: An empirical analysis of Indian banks. Future Bus. J. 2018, 4, 84–93. [Google Scholar] [CrossRef]
  28. Carroll, A.B. A Three-Dimensional Conceptual Model of Corporate Performance. Acad. Manag. Rev. 1979, 4, 497–505. [Google Scholar] [CrossRef]
  29. Carroll, A.B. Corporate Social Responsibility. Bus. Soc. 1999, 38, 268–295. [Google Scholar] [CrossRef]
  30. Freda, M. The Influence of Self-Regulation and Stakeholder Theories on Corporate Social Responsibility (CSR). Int. J. Multicult. Multireligious Underst. 2017, 4, 29–34. [Google Scholar] [CrossRef] [Green Version]
  31. Cordeiro, J.J.; Tewari, M. Firm Characteristics, Industry Context, and Investor Reactions to Environmental CSR: A Stakeholder Theory Approach. J. Bus. Ethics 2015, 130, 833–849. [Google Scholar] [CrossRef]
  32. Calvo, N.; Calvo, F. Corporate social responsibility and multiple agency theory: A case study of internal stakeholder engagement. Corp. Soc. Responsib. Environ. Manag. 2018, 25, 1223–1230. [Google Scholar] [CrossRef]
  33. Jamali, D. A Stakeholder Approach to Corporate Social Responsibility: A Fresh Perspective into Theory and Practice. J. Bus. Ethics 2008, 82, 213–231. [Google Scholar] [CrossRef]
  34. Garriga, E.; Melé, D. Corporate Social Responsibility Theories: Mapping the Territory. J. Bus. Ethics 2004, 53, 51–71. [Google Scholar] [CrossRef]
  35. Szczepankiewicz, E.; Mućko, P. CSR Reporting Practices of Polish Energy and Mining Companies. Sustainability 2016, 8, 126. [Google Scholar] [CrossRef] [Green Version]
  36. Carroll, A.B. Corporate social responsibility. Organ. Dyn. 2015, 44, 87–96. [Google Scholar] [CrossRef]
  37. Brammer, S.; Williams, G.; Zinkin, J. Religion and Attitudes to Corporate Social Responsibility in a Large Cross-Country Sample. J. Bus. Ethics 2007, 71, 229–243. [Google Scholar] [CrossRef]
  38. Lloyd, R.A. The Impact of CSR Efforts on Firm Performance in the Energy Sector. Rev. Integr. Bus. Econ. Res. 2018, 7, 25. [Google Scholar]
  39. Vollero, A.; Palazzo, M.; Siano, A.; Elving, W.J.L. Avoiding the greenwashing trap: Between CSR communication and stakeholder engagement. Int. J. Innov. Sustain. Dev. 2016, 10, 120–140. [Google Scholar] [CrossRef]
  40. Antunes, D.; Santos, A.; Hurtado, A. The communication of the LCA: The need for guidelines to avoid greenwashing. Espacios 2015, 36. Available online: https://www.revistaespacios.com/a15v36n05/15360501.html (accessed on 10 November 2021).
  41. Stjepcevic, J.; Siksnelyte, I. Corporate Social Responsibility in Energy Sector. Transform. Bus. Econ. 2016, 16, 21–33. [Google Scholar]
  42. Streimikiene, D.; Simanaviciene, Z.; Kovaliov, R. Corporate social responsibility for implementation of sustainable energy development in Baltic States. Renew. Sustain. Energy Rev. 2009, 13, 813–824. [Google Scholar] [CrossRef]
  43. Barykin, S.Y.; Kapustina, I.V.; Valebnikova, O.A.; Valebnikova, N.V.; Kalinina, O.V.; Sergeev, S.M.; Camastral, M.; Volkova, L. Digital Technologies for Personnel Management: Implications for Open Innovations. Acad. Strateg. Manag. J. 2021, 20, 1–14. [Google Scholar]
  44. Jensen, M.C. Value Maximization, Stakeholder Theory, and the Corporate Objective Function. Bus. Ethics Q. 2002, 12, 235–256. [Google Scholar] [CrossRef]
  45. DesJardins, J. An Introduction to Business Ethics, 4th ed.; McGraw-Hill: New York, NY, USA, 2011. [Google Scholar]
  46. Schaltegger, S.; Freund, F.L.; Hansen, E.G. Business cases for sustainability: The role of business model innovation for corporate sustainability. Int. J. Innov. Sustain. Dev. 2012, 6, 95–119. [Google Scholar] [CrossRef]
  47. Zhang, L.; Li, D.; Cao, C.; Huang, S. The influence of greenwashing perception on green purchasing intentions: The mediating role of green word-of-mouth and moderating role of green concern. J. Clean. Prod. 2018, 187, 740–750. [Google Scholar] [CrossRef]
  48. Siano, A.; Vollero, A.; Conte, F.; Amabile, S. ‘More than words’: Expanding the taxonomy of greenwashing after the Volkswagen scandal. J. Bus. Res. 2017, 71, 27–37. [Google Scholar] [CrossRef]
  49. Delmas, M.A.; Burbano, V.C. The Drivers of Greenwashing. Calif. Manag. Rev. 2011, 54, 64–87. [Google Scholar] [CrossRef] [Green Version]
  50. TerraChoice. The sins of greenwashing: Home and family edition. 2010. Available online: http://faculty.wwu.edu/dunnc3/rprnts.TheSinsofGreenwashing2010.pdf (accessed on 14 June 2021).
  51. Pimonenko, T.; Bilan, Y.; Horák, J.; Starchenko, L.; Gajda, W. Green Brand of Companies and Greenwashing under Sustainable Development Goals. Sustainability 2020, 12, 1679. [Google Scholar] [CrossRef] [Green Version]
  52. Du, X.; Chang, Y.; Zeng, Q.; Du, Y.; Pei, H. Corporate environmental responsibility (CER) weakness, media coverage, and corporate philanthropy: Evidence from China. Asia Pac. J. Manag. 2016, 33, 551–581. [Google Scholar] [CrossRef]
  53. Kim, E.-H.; Lyon, T.P. Greenwash vs. Brownwash: Exaggeration and Undue Modesty in Corporate Sustainability Disclosure. Organ. Sci. 2015, 26, 705–723. [Google Scholar] [CrossRef]
  54. Podnar, K. Guest Editorial: Communicating Corporate Social Responsibility. J. Mark. Commun. 2008, 14, 75–81. [Google Scholar] [CrossRef]
  55. Clarkson, M.B.E. A Stakeholder Framework for Analyzing and Evaluating Corporate Social Performance. Acad. Manag. Rev. 1995, 20, 92–117. [Google Scholar] [CrossRef]
  56. Ganescu, C. Corporate social responsibility, a strategy to create and consolidate sustainable businesses. Theor. Appl. Econ. 2012, 19, 91–106. [Google Scholar]
  57. Freeman, R.E. Strategic Management: A Stakeholder Approach; Pitman: Boston, MA, USA, 1984. [Google Scholar]
  58. Sroka, R. Association of Stock Exchange Issuers, GES and Crido Business Consulting. Warszawa 2013, 49–63. [Google Scholar]
  59. Lech, A. Corporate Social Responsibility and Financial Performance. Theoretical and Empirical Aspects. Comp. Econ. Res. Cent. East. Eur. 2013, 16, 49–62. [Google Scholar] [CrossRef]
  60. Jha, A.; Cox, J. Corporate social responsibility and social capital. J. Bank. Financ. 2015, 60, 252–270. [Google Scholar] [CrossRef]
  61. Thuy, C.T.M.; Khuong, N.V.; Canh, N.T.; Liem, N.T. Corporate Social Responsibility Disclosure and Financial Performance: The Mediating Role of Financial Statement Comparability. Sustainability 2021, 13, 10077. [Google Scholar] [CrossRef]
  62. Iamandi, I.-E.; Constantin, L.-G.; Munteanu, S.M.; Cernat-Gruici, B. Mapping the ESG Behavior of European Companies. A Holistic Kohonen Approach. Sustainability 2019, 11, 3276. [Google Scholar] [CrossRef] [Green Version]
  63. Christensen, H.B.; Hail, L.; Leuz, C. Mandatory CSR and sustainability reporting: Economic analysis and literature review. Rev. Account. Stud. 2021, 26, 1176–1248. [Google Scholar] [CrossRef]
  64. Hřebíček, J.; Soukopová, J.; Trenz, O. Current Trends of Economic Modelling of Sustainable Corporate Performance and Reporting—Review and Research Agenda. Procedia Econ. Financ. 2014, 12, 234–242. [Google Scholar] [CrossRef] [Green Version]
  65. Matos, P. ESG and Responsible Institutional Investing Around the World a Critical Review. CFA Institute Research Foundation. 2020. Available online: https://www.cfainstitute.org/-/media/documents/book/rf-lit-review/2020/rflr-esg-and-responsible-institutional-investing.ashx (accessed on 13 June 2021).
  66. Setyahuni, S.W.; Handayani, R.S. On the value relevance of information on environmental, social, and governance (ESG): An evidence from Indonesia. J. Crit. Rev. 2020, 7, 50–58. [Google Scholar] [CrossRef]
  67. Anning, F. An Assessment of the Traditional Theory of Firm Based Assumption of Profit Maximization in an Organization. SSRN Electron. J. 2018. [Google Scholar] [CrossRef]
  68. Bassen, A.; Meyer, K.; Schlange, J. The Influence of Corporate Responsibility on the Cost of Capital. SSRN Electron. J. 2006. [Google Scholar] [CrossRef] [Green Version]
  69. Knox, S.; Maklan, S. Corporate Social Responsibility. Eur. Manag. J. 2004, 22. [Google Scholar] [CrossRef] [Green Version]
  70. Burke, L.; Logsdon, J.M. How Corporate Social Responsibility Pays Off. Long Range Plan. 1996, 29, 495–502. [Google Scholar] [CrossRef]
  71. Utz, S. Corporate scandals and the reliability of ESG assessments: Evidence from an international sample. Rev. Manag. Sci. 2019, 13, 483–511. [Google Scholar] [CrossRef]
  72. Dorfleitner, G.; Halbritter, G.; Nguyen, M. Measuring the level and risk of corporate responsibility—An empirical comparison of different ESG rating approaches. J. Asset Manag. 2015, 16, 450–466. [Google Scholar] [CrossRef]
  73. Daugaard, D. Emerging new themes in environmental, social and governance investing: A systematic literature review. Account. Financ. 2020, 60, 1501–1530. [Google Scholar] [CrossRef]
  74. Zuraida, Z.; Nurul Houqe, M.; van Zijl, T. Value relevance of environmental, social and governance disclosure. In Research Handbook of Finance and Sustainability; Edward Elgar Publishing: Cheltenham, UK, 2018. [Google Scholar] [CrossRef]
  75. Brooks, C.; Oikonomou, I. The effects of environmental, social and governance disclosures and performance on firm value: A review of the literature in accounting and finance. Br. Account. Rev. 2018, 50, 1–15. [Google Scholar] [CrossRef]
  76. Clark, G.L.; Feiner, A.; Viehs, M. From the stockholder to the stakeholder. How sustainability can drive financial outperformance. SSRN Electron. J. 2015. [Google Scholar] [CrossRef]
  77. Margolis, J.D.; Elfenbein, H.A.; Walsh, J.P. Does it Pay to Be Good… And Does it Matter? A Meta-Analysis of the Relationship between Corporate Social and Financial Performance. SSRN Electron. J. 2009. [Google Scholar] [CrossRef]
  78. Camilleri, M. Corporate Sustainability, Social Responsibility and Environmental Management, An Introduction in Theory and Praktice with Case Study; Springer: Berlin/Heidelberg, Germany, 2017. [Google Scholar]
  79. Huang, D.Z.X. Environmental, social and governance (ESG) activity and firm performance: A review and consolidation. Account. Financ. 2021, 61, 335–360. [Google Scholar] [CrossRef]
  80. Eccles, R.; Ioannou, I.; Serafeim, G. The Impact of Corporate Sustainability on Organizational Processes and Performance. Manag. Sci. 2014, 60, 2835–2857. [Google Scholar] [CrossRef] [Green Version]
  81. Benabou, R.; Tirole, J. Individual and Corporate Social Responsibility. Economica 2010, 77, 1–19. [Google Scholar] [CrossRef] [Green Version]
  82. Bunea, O.-I.; Corbos, R.-A.; Popescu, R.-I. Influence of some financial indicators on return on equity ratio in the Romanian energy sector—A competitive approach using a DuPont-based analysis. Energy 2019, 189, 116251. [Google Scholar] [CrossRef]
  83. Radar Inwestycji. Available online: www.biznesradar.pl (accessed on 1 August 2021).
  84. Refinitive, Environmental, Social and Governance (ESG) Scores from Refinitive. 2021. Available online: https://www.refinitiv.com/content/dam/marketing/en_us/documents/methodology/refinitiv-esg-scores-methodology.pdf (accessed on 10 November 2021).
  85. Nagaj, R. Konkurencyjność rynku energii elektrycznej w Polsce. Rynek Energii 2017, 2, 3–10. [Google Scholar]
  86. Jedynak, T. Rozwój koncepcji inwestowania społecznie odpowiedzialnego w Polsce i na świecie. Zesz. Nauk. Uniw. Ekon. Krakowie 2011, 875, 17–28. [Google Scholar]
  87. Gad, J. Sprawozdanie z działalności we współczesnym modelu raportowania—Praktyka sprawozdawcza spółek publicznych notowanych na GPW. Zarządzanie Finans. 2015, 13, 79–98. [Google Scholar]
  88. Comporek, M. Wzrost przychodów ze sprzedaży jako determinanta całkowitego zwrotu dla akcjonariuszy. Pr. Nauk. Uniw. Ekon. Wrocławiu 2017, 471, 114–125. [Google Scholar] [CrossRef]
  89. Deegan, C.M. Legitimacy theory. Account. Audit. Account. J. 2019, 32, 2307–2329. [Google Scholar] [CrossRef]
  90. Castelo Branco, M.; Lima Rodrigues, L. Communication of corporate social responsibility by Portuguese banks. Corp. Commun. Int. J. 2006, 11, 232–248. [Google Scholar] [CrossRef]
  91. Guthrie, J.; Parker, L.D. Corporate social reporting: A rebuttal of legitimacy theory. Account. Bus. Res. 1989, 19, 343–352. [Google Scholar] [CrossRef]
  92. Enyinna, O. Is stakeholder theory really ethical? Afr. J. Bus. Ethics 2013, 7, 79–86. [Google Scholar] [CrossRef] [Green Version]
  93. Wagner Mainardes, E.; Alves, H.; Raposo, M. Stakeholder theory: Issues to resolve. Manag. Decis. 2011, 49, 226–252. [Google Scholar] [CrossRef]
  94. Transformacja Sektora Elektroenergetycznego w POLSCE. Wydzielenie Wytwórczych Aktywów Węglowych ze Spółek z Udziałem Skarbu Państwa. Available online: https://www.gov.pl/web/aktywa-panstwowe/program-transformacji-sektora-elektroenergetycznego (accessed on 1 October 2021).
  95. Plusy i Minusy Narodowej Agencji Bezpieczeństwa Energetycznego. Available online: https://wysokienapiecie.pl/37038-plusy-minusy-narodowej-agencji-bezpieczenstwa-energetycznego/ (accessed on 1 October 2021).
  96. Polityka Energetyczna Polski do 2040 r. Available online: https://www.gov.pl/web/klimat/polityka-energetyczna-polski (accessed on 1 October 2021).
Figure 1. Pillars of energy transformation in Poland. Source: Self-analysis on the basis of [18].
Energies 15 00477 g001
Figure 2. Changes in average annual values of ESG Combined indicator noted by the analysed enterprises in the period of 2010–2019. Source. Self-analysis.
Energies 15 00477 g002
Figure 3. Values of return on equity (ROE) indicator noted by analysed enterprises in the period 2010–2019. Source. Self-analysis.
Energies 15 00477 g003
Figure 4. Values of return on assets (ROA) indicator noted by analysed enterprises in the period 2010–2019. Source. Self-analysis.
Energies 15 00477 g004
Table 1. Areas of responsibility in energy sector.
Social ResponsibilityEnvironmental ResponsibilityEconomic Responsibility
  • personnel’s welfare, skills and motivation,
  • open interaction with stakeholders,
  • the quality of energy supply,
  • good practices of business and cooperation with the stakeholders, networking with other companies,
  • correct price for energy
  • measuring of environmental impact,
  • awareness and reduction of environmental impacts of energy production and transfer,
  • minimization of use of fossil fuels,
  • reduction of pollution and emissions,
  • development of renewable sources,
  • controlling systems for waste and pollution
  • cost-effective operations,
  • fair prices and good service,
  • investing in new technologies,
  • reliability of energy supply,
  • financial risk management.
Source: Self-analysis on the basis of [41].
Table 2. Chosen problems within the framework of environmental, social and corporate governance (ESG).
EnvironmentalSocialGovernance
  • climate change and carbon emissions
  • use of natural resources, energy and water management
  • pollution and waste
  • ecodesign and innovation
  • workforce health and safety, diversity, and training
  • customer and product responsibility
  • community relations and charitable activities
  • shareholder rights
  • composition of boards of directors (independence and diversity)
  • management compensation policy
  • fraud and bribery
Source: Self-analysis on the basis of [65].
Table 3. Correlations between values of indicators taken into account in research in the case of the enterprise KGHM Polska Miedź S.A. (period of 2010–2019).
IndicatorESG CombinedESG Controver.ESG Score
ROE−0.250.51−0.60
ROA−0.240.50−0.57
ROS−0.210.54−0.58
TAT−0.120.45−0.36
A/E0.27−0.520.53
CR−0.170.36−0.36
Source. Self-analysis.
Table 4. Correlations between values of indicators taken into account in research in the case of the enterprise Polskie Górnictwo Naftowe i Gazownictwo S.A. (period of 2010–2019).
IndicatorESG CombinedESG Controver.ESG Score
ROE−0.060.17−0.04
ROA0.050.220.07
ROS0.120.270.12
TAT−0.02−0.170.08
A/E−0.64−0.38−0.69
CR−0.47−0.34−0.36
Source. Self-analysis.
Table 5. Correlations between values of indicators taken into account in research in the case of the enterprise Grupa Lotos S.A. (period of 2010–2019).
IndicatorESG CombinedESG Controver.ESG Score
ROE−0.31−0.13−0.17
ROA−0.27−0.16−0.11
ROS−0.31−0.14−0.16
TAT0.390.050.32
A/E0.080.47−0.40
CR−0.22−0.10−0.12
Source. Self-analysis.
Table 6. Correlations between values of indicators taken into account in research in the case of the enterprise PGE Polska Grupa Energetyczna S.A. (period of 2010–2019).
IndicatorESG CombinedESG Controver.ESG Score
ROE−0.220.30−0.22
ROA−0.240.30−0.25
ROS−0.150.30−0.16
TAT−0.660.09−0.66
A/E0.35−0.580.35
CR−0.190.39−0.19
Source. Self-analysis.
Table 7. Correlations between values of indicators taken into account in research in the case of the enterprise Polski Koncern Naftowy Orlen S.A. (period of 2010–2019).
IndicatorESG CombinedESG Controver.ESG Score
ROE0.12−0.160.35
ROA0.12−0.160.37
ROS0.12−0.150.38
TAT−0.030.23−0.35
A/E0.110.27−0.32
CR−0.11−0.110.20
Source. Self-analysis.
Table 8. Correlations between values of indicators taken into account in research in the case of the enterprise Enea S.A. (period of 2010–2018).
IndicatorESG CombinedESG Controver.ESG Score
ROE−0.070.00−0.07
ROA−0.230.00−0.23
ROS−0.120.00−0.12
TAT−0.400.00−0.40
A/E0.550.000.55
CR−0.720.00−0.72
Source. Self-analysis.
Table 9. Correlations between values of indicators taken into account in research in the case of the enterprise Energa S.A. (period of 2014–2019).
IndicatorESG CombinedESG Controver.ESG Score
ROE−0.360.55−0.50
ROA−0.370.54−0.51
ROS−0.300.52−0.43
TAT−0.500.34−0.58
A/E0.11−0.270.19
CR−0.280.69−0.46
Source. Self-analysis.
Table 10. Correlations between values of indicators taken into account in research in the case of the enterprise Tauron Polska Energia S.A. (period of 2010–2019).
IndicatorESG CombinedESG Controver.ESG Score
ROE−0.280.00−0.28
ROA−0.320.00−0.32
ROS−0.260.00−0.26
TAT−0.490.00−0.49
A/E0.650.000.65
CR−0.440.00−0.44
Source. Self-analysis.
Table 11. Regression results.
VariableROEROAROSTATA/ECR
a5.33113.6026 ***8.3844 ***0.19181.3052 ***1.6544 ***
(2.4128)(2.8079)(4.4535)(2.1885)(20.2930)(15.2580)
b0.03920.0152−0.05730.0160 ***0.0116 ***−0.0011
(0.7767)(0.5172)(−1.3324)(7.9878)(7.9018)(−0.4655)
N293293293293293293
sF0.440.610.183.22 × 10−145.7 × 10−140.64
Su10.926.349.310.430.320.54
Vu1.571.501.560.500.180.33
R20.00210.00090.00610.17980.17670.0007
R2adj−0.001−0.0030.0030.180.17−0.003
a, b—estimated parameters of the regression model; sF—significance F; Su—standard deviation of the residual component; Vu—coefficient of residual variation (average level of random fluctuations); t statistics in brackets; *** p < 0.01. Source. Self-analysis.
Table 12. Regression results (with an additional variable describing the level of diversification of the entity’s activity).
IndicatorTAT (ESGComb. and Div.)A/E (ESGComb. and Div.)
a0.76041.5019 ***
(9.5017)(20.8602)
bESG−0.00510.0043
(−2.3348)(2.1791)
bDIV0.7730 ***0.2674 ***
(13.6963)(5.2660)
N293293
sF1.26 × 10−441.02 × 10⁻¹⁸
Su0.340.30
Vu0.390.17
R20.50200.2485
R2adj0.49850.2433
a, bESG, bDIV—estimated parameters of the regression model; sF—significance F; Su—standard deviation of the residual component; Vu—coefficient of residual variation (average level of random fluctuations); t statistics in brackets; *** p < 0.01. Source. Self-analysis.
Publisher’s Note: MDPI stays neutral with regard to jurisdictional claims in published maps and institutional affiliations.

