
Partial Discharge Pulse Segmentation Approach of Converter Transformers Based on Higher Order Cumulant


Abstract
:1. Introduction
2. Fundamental Theory
2.1. Higher Order Cumulant of Time Series
2.2. Characteristic Analysis of Noisy Local Radio Signals
2.3. Characteristic Analysis of Time Series Cumulant
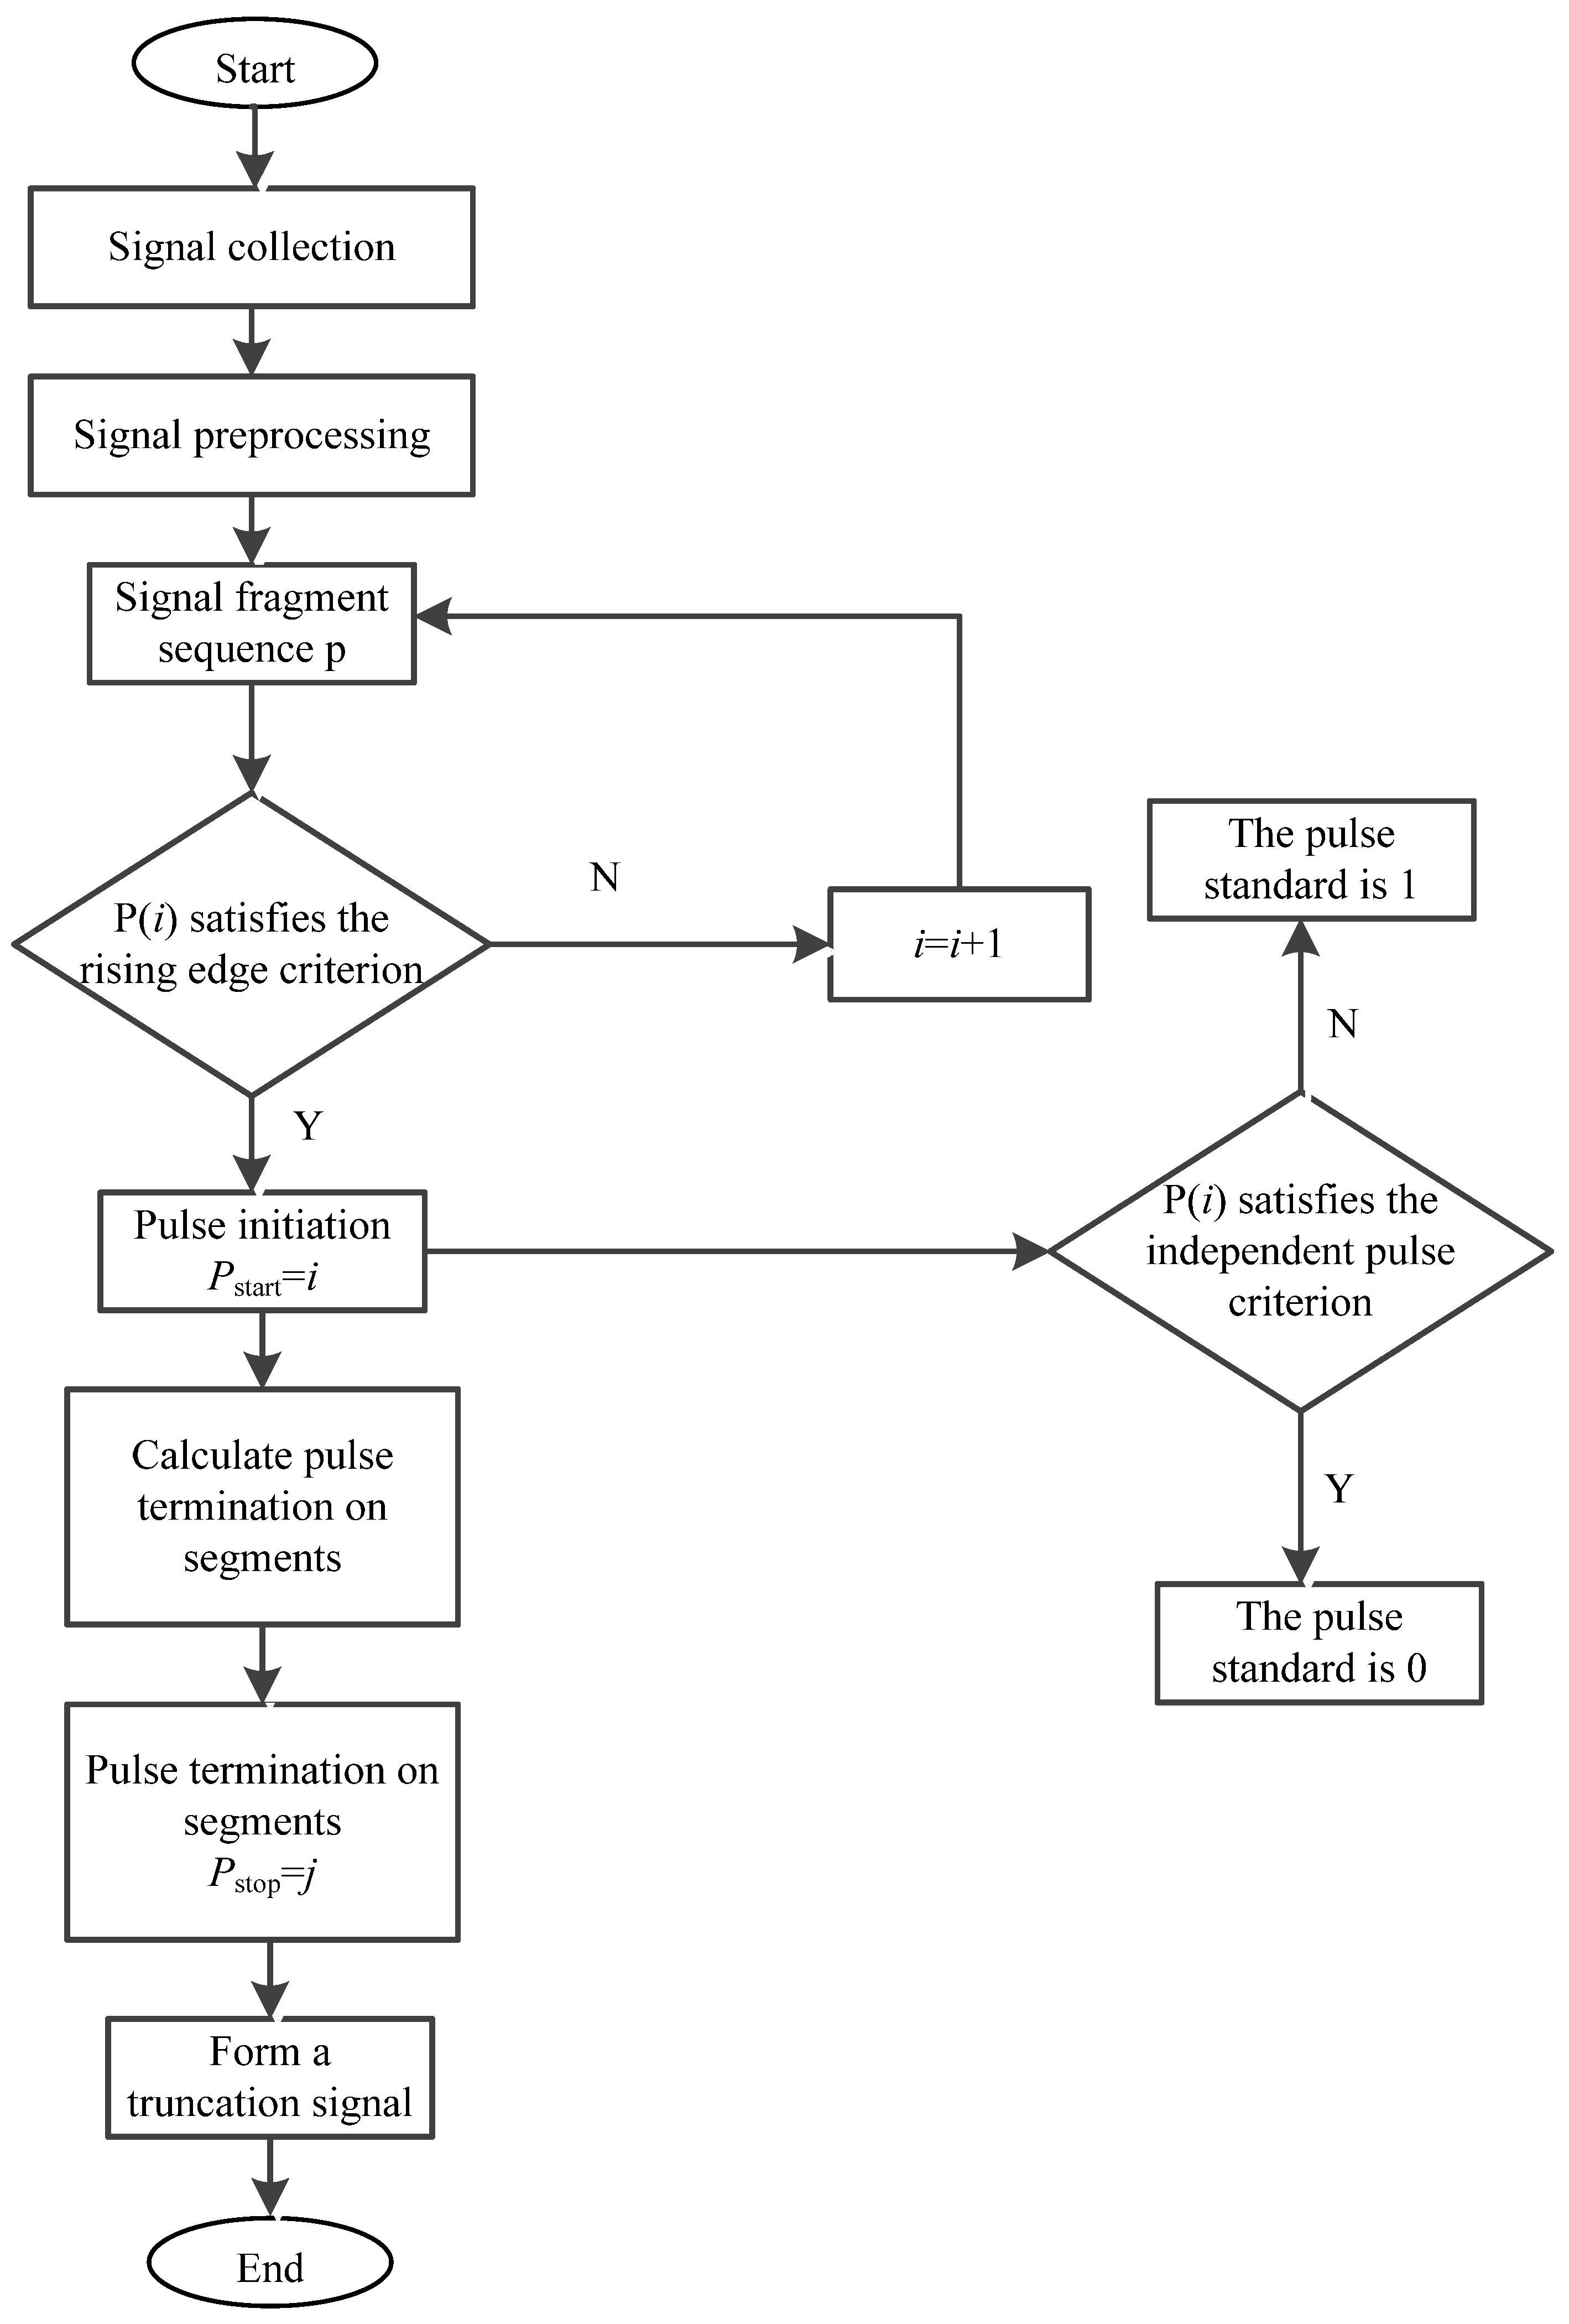
3. Steps of Pulse Truncation Method
- (1)
- Signal preprocessing. Filter, segment and normalize the sampled signal.
- (2)
- The rising edge of the pulse is determined. According to the characteristics of the time-domain cumulant and the time-domain RMS, judge whether it is the rising edge of the independent signal according to the principle that the change of the fourth-order cumulant is equal to the fourth-order cumulant.
- (3)
- The pulse initiation time is determined. At the beginning time, the fourth order cumulant in the time domain and the change of the fourth order cumulant in the time domain are calculated for all of the segments, the three condition signal segments of CUM(i) = ΔCUM(i), CUM(i) > CUM0 and RMS(i) > RMS0 are judged simultaneously and the time is determined to be the beginning time. CUM0 is the threshold value of the fourth-order cumulant, which is set as 3.0 in this paper, and RMS0 is the threshold value of the effective value.
- (4)
- The pulse cut-off time is determined. The fourth-order cumulant and effective value of the minimum calculated signal of each segment are calculated by forward search with each rising edge time as the starting point. According to the attenuation characteristics of the signal, including the segments of the pulse cut-off time, the cumulative modulus value is less than the set threshold, and the effective value is also less than the set threshold. In addition, the signal from the cut-off time to the rising edge of the next pulse is flat, and the cumulative modulus value and signal effective value of this interval are also less than the set threshold. Therefore, the signal segment that first meets the threshold conditions should be regarded as the pulse cut-off time.
- (5)
- Form a truncated signal. According to the pulse start time and truncation time, the pulse time-domain sequence is intercepted from the original sampling signal. In order to reduce the influence of time length on equivalent time, the intercepted signal is zeroed to the same length, that is, the time domain length of the original signal.
4. Verification of Pulse Truncation Method
4.1. Calculation and Verification
4.2. Actual Measurement and Verification of Converter Station
5. Conclusions
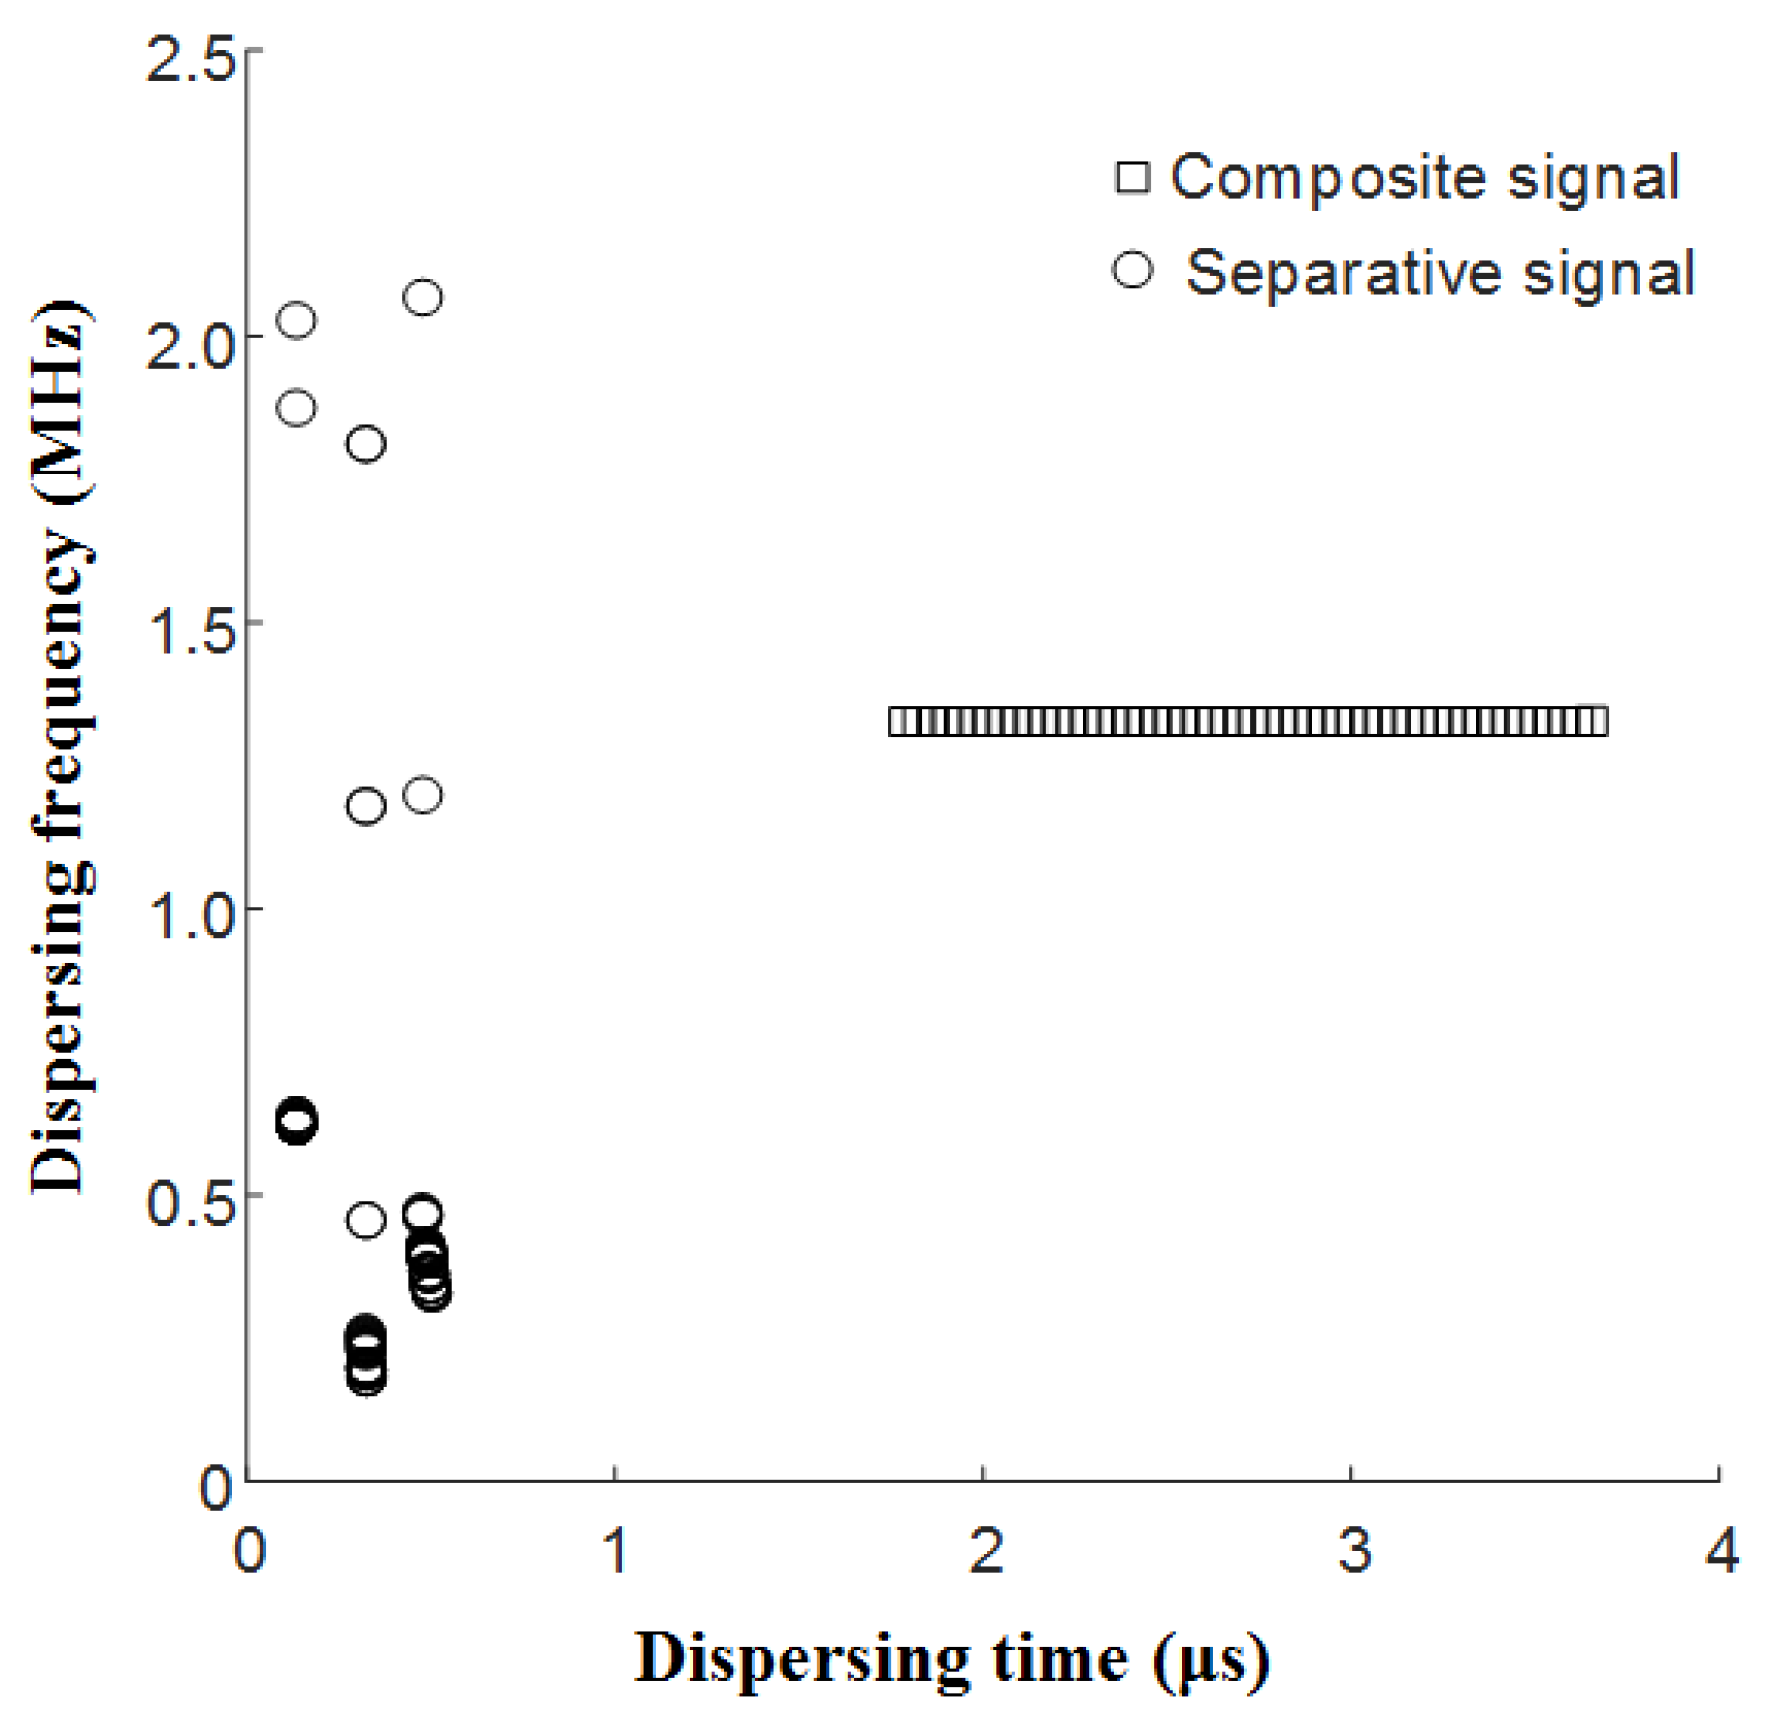
- (1)
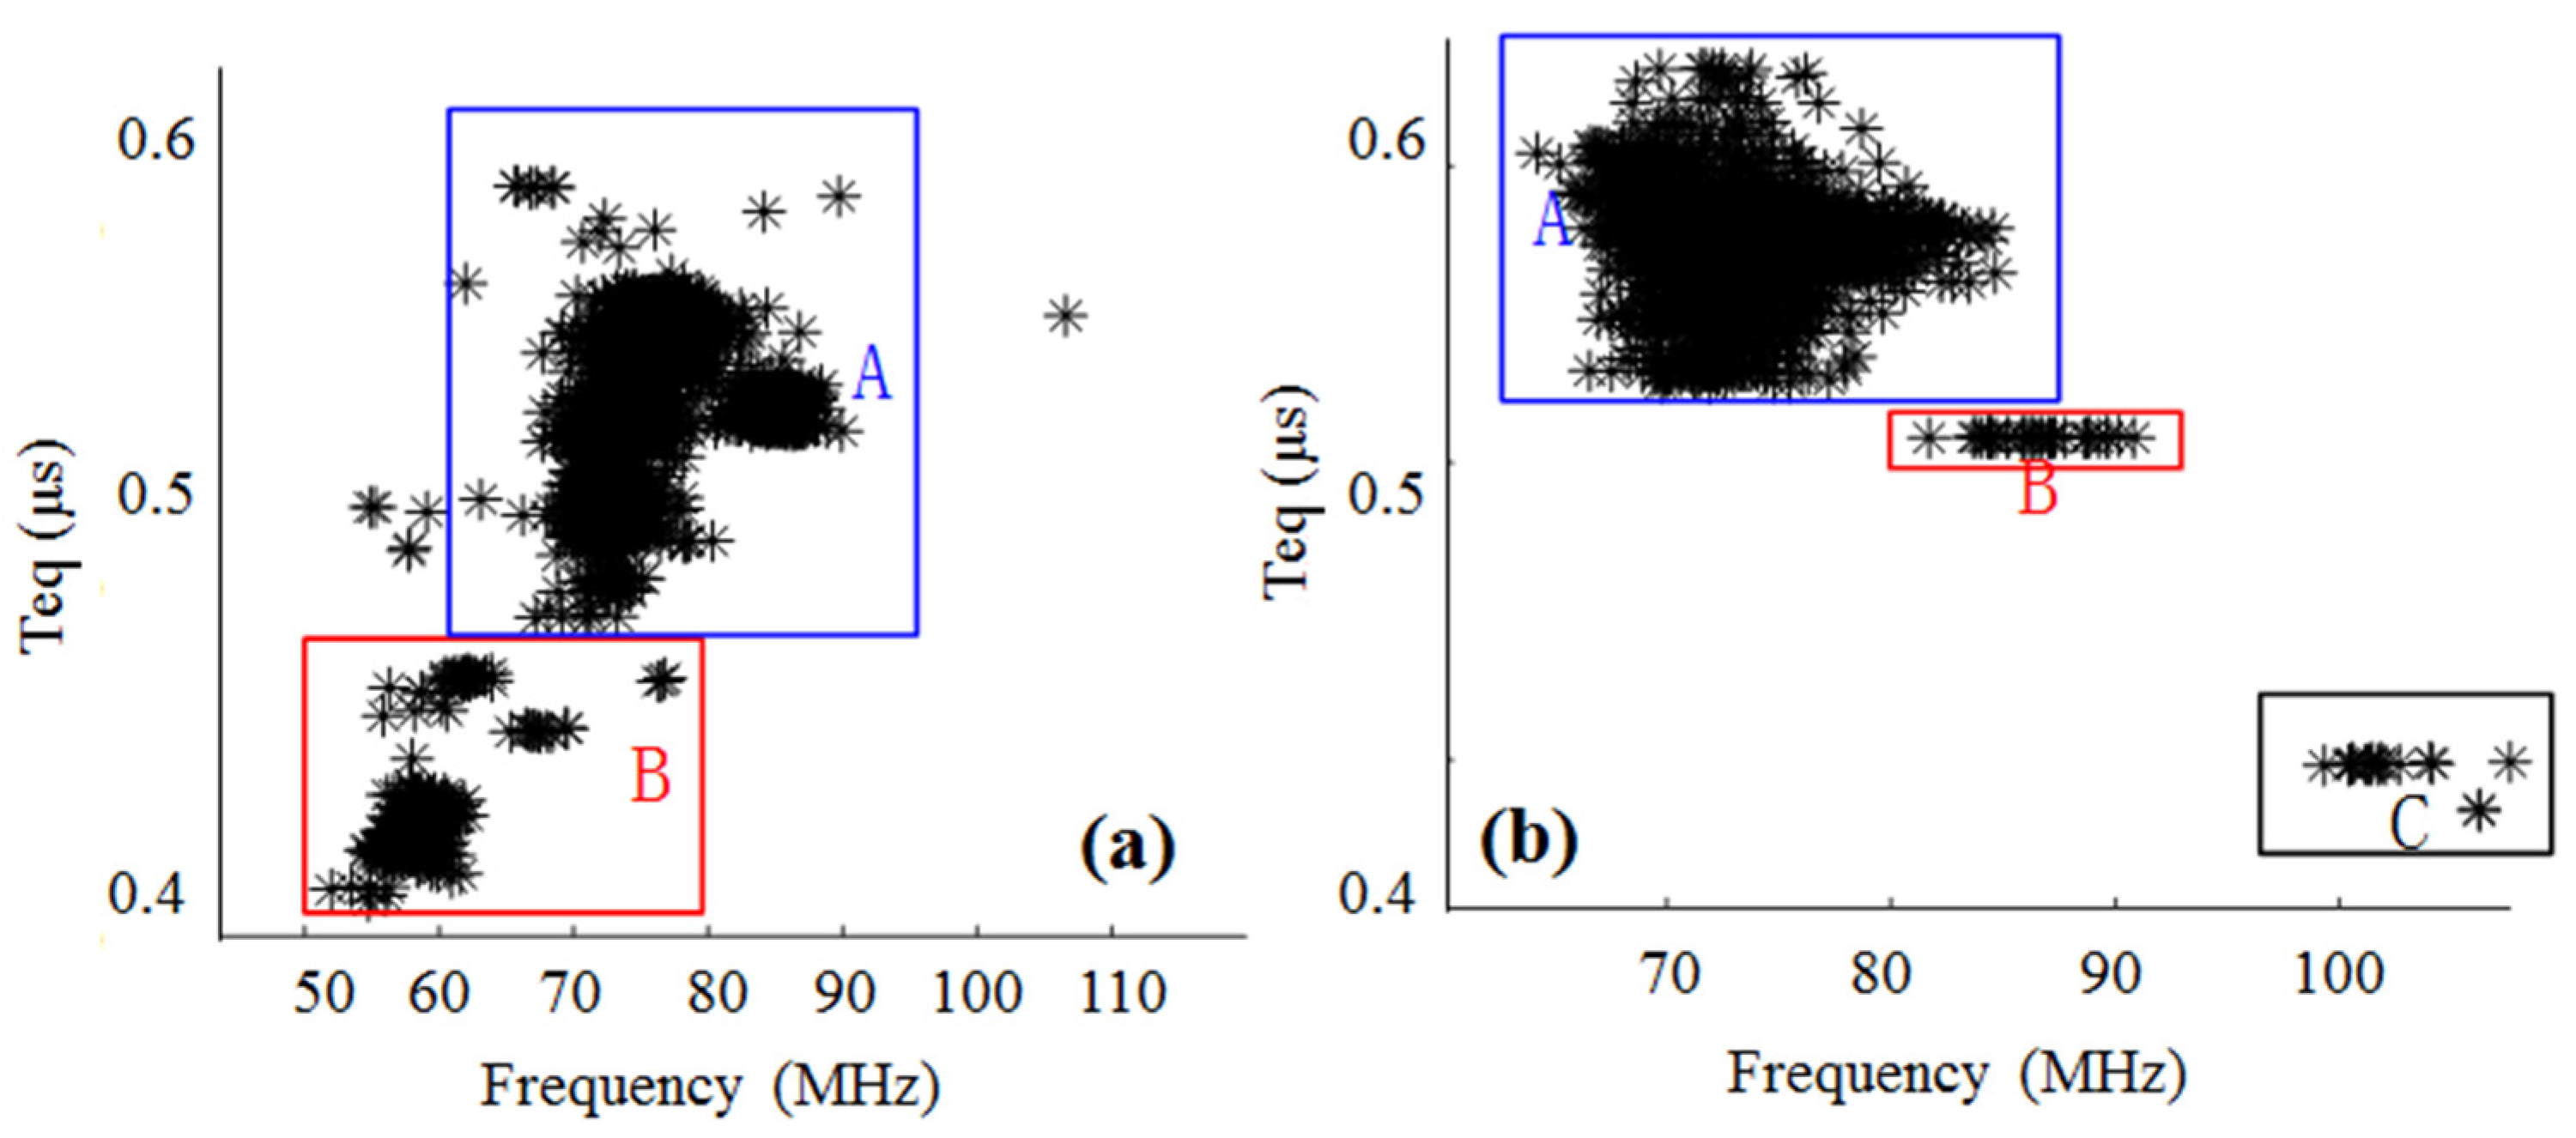
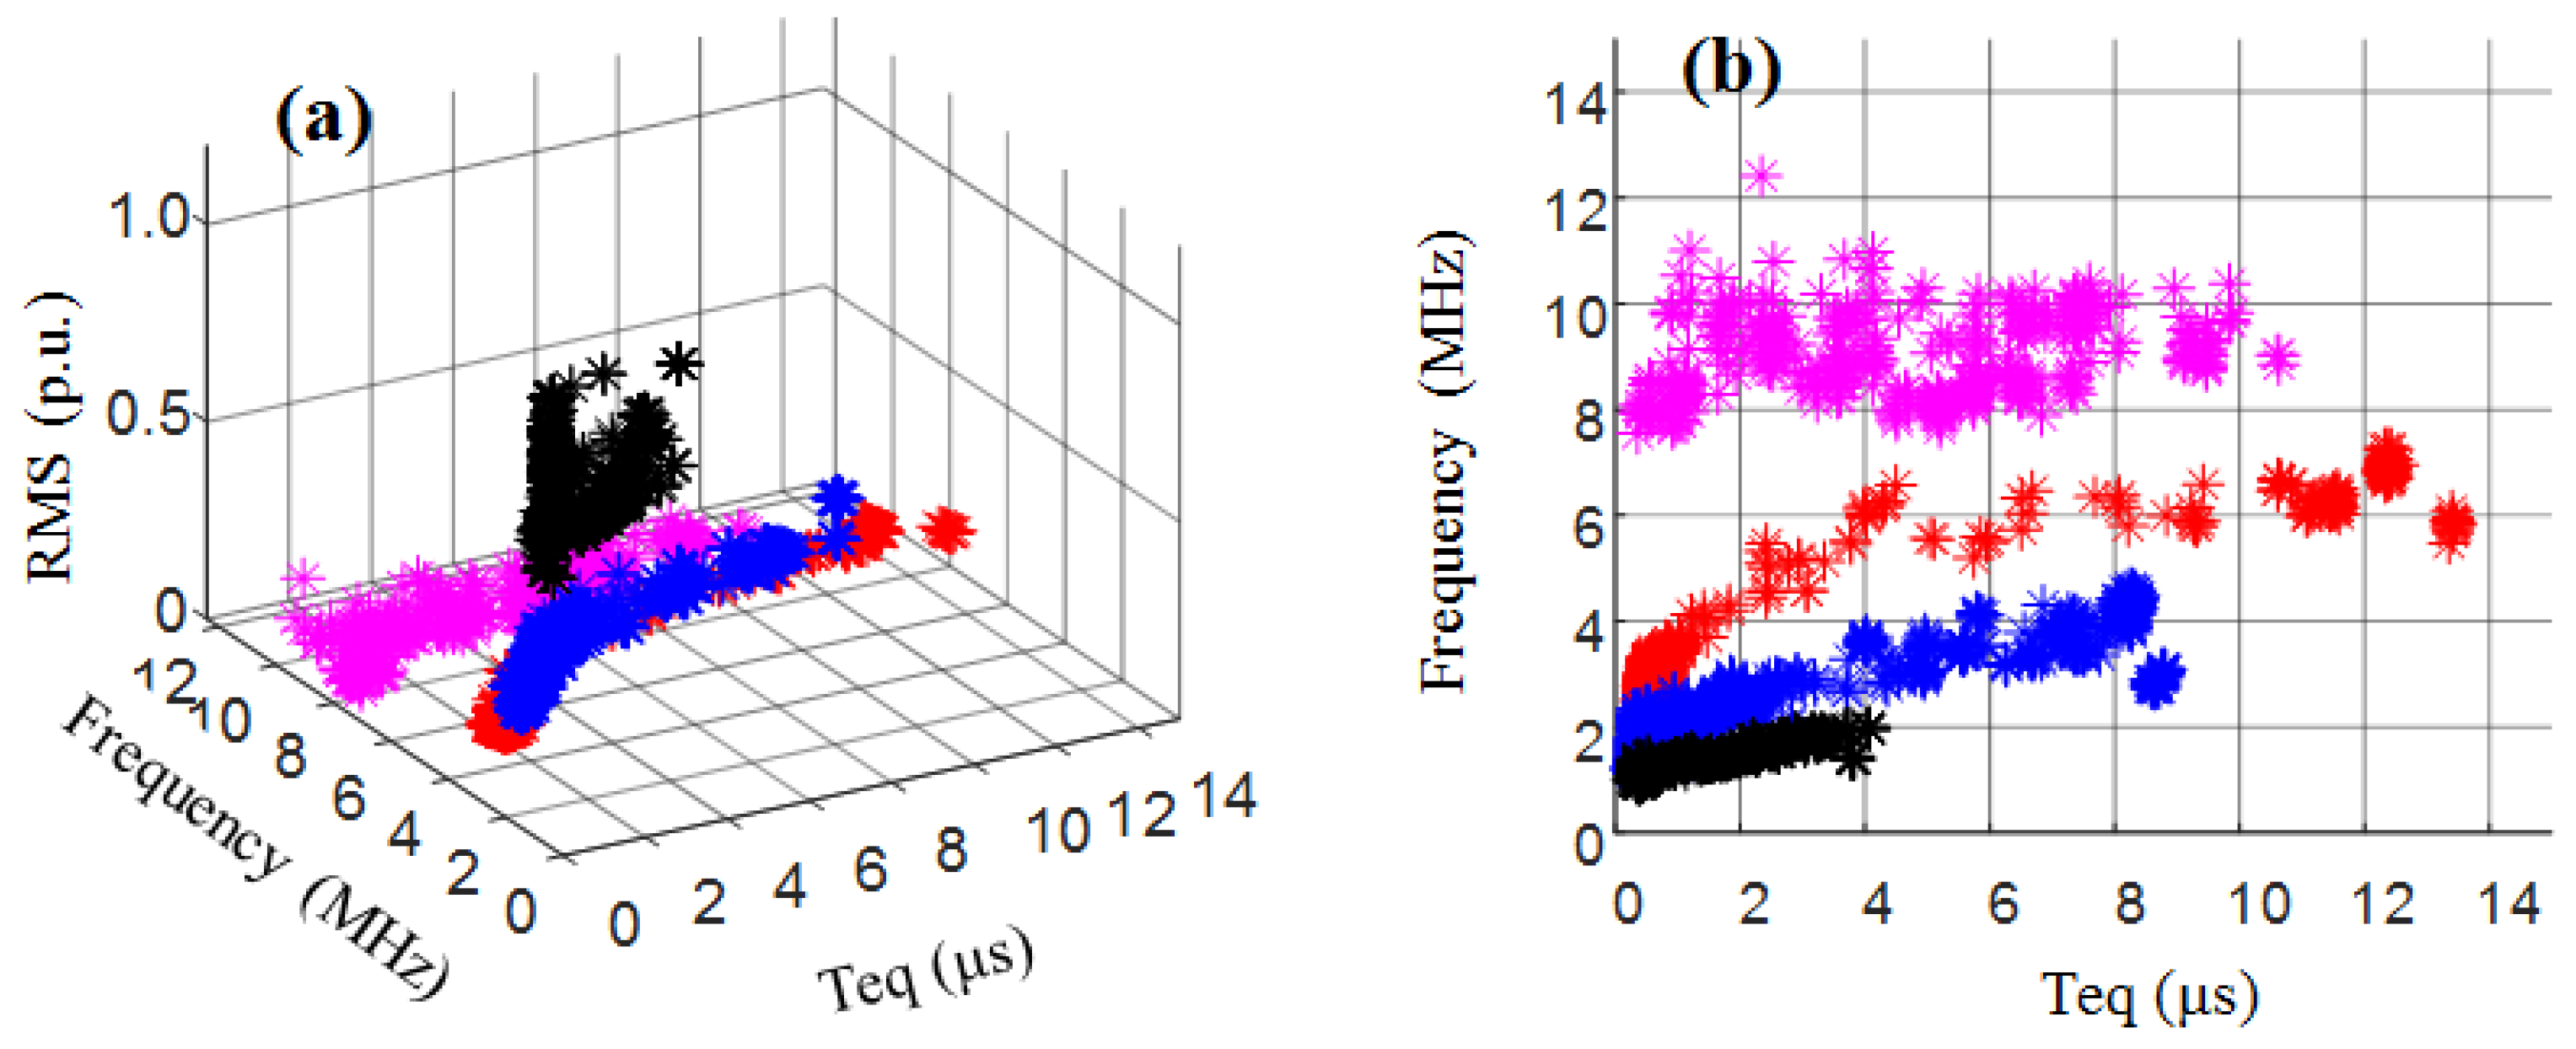
- Comparing and analyzing the time-frequency clustering results of the multi pulse signal and the truncated signal, the accuracy of the separated pulse before truncation is 8%, and the accuracy of the separated pulse after truncation is more than 90%.
- (2)
- The pulse truncation method is verified and applied in the UHV converter station. This method realizes the separation of the commutation pulse and the PD pulse in the time domain waveform.
- (3)
- When there are many PWM commutation pulses, the sampling time length reaches 100 μs, the sampling signal contains a large amount of commutation pulse information and the accuracy of extracting the simulated PD signal is 1.65%. The method described in this paper extracts the PD signal separately so that the extraction rate of the PD signal is increased to 79%.
Author Contributions
Funding
Informed Consent Statement
Data Availability Statement
Conflicts of Interest
Abbreviations and Nomenclatures
| PD | Partial discharge |
| UHV | Ultra high vacuum |
| IMF | Intrinsic mode functions |
| EEMD | Ensemble empirical mode decomposition |
| MMG | Mathematical morphological gradient |
| DWT | Discrete wavelet transform |
| RMS | Root mean square |
| CUM | Cubic metre |
| UHVDC | Ultra-high voltage direct current |
| VHF | Very high frequency |
| PWM | Pulse width modulation |
Symbols
| M | Origin moments of the sequence array |
| Y | Zero mean random time series |
| Μ | Mean value |
| δ2 | Standard deviation |
| N | Number of elements |
| X | Element |
| The nth-order moment of sequence x | |
| the nth-order moment of sequence a01 | |
| the nth-order moment of sequence a02 |
References
- Wu, M.; Cao, H.; Cao, J.; Nguyen, H.L.; Gomes, J.B.; Krishnaswamy, S.P. An overview of state-of-the-art partial discharge analysis techniques for condition monitoring. IEEE Electr. Insul. Mag. 2015, 31, 22–35. [Google Scholar] [CrossRef]
- IEC/TS 64278-2016. High Voltage Test Techniques-Measurement of Partial Discharges by Electromagnetic and Acoustic Methods; IEC: Geneva, Switzerland, 2016. [Google Scholar]
- Tang, J.; Wang, J.; Li, J. Statistical parameter method for PD pattern recognition. High Volt. Eng. 2002, 28, 4–6. [Google Scholar] [CrossRef]
- Hu, W.; Gao, S.; Yu, S.; Tan, K.; Gao, W. Application of statistical parameters in pattern recognition of transformer partial discharge. High Volt. Eng. 2009, 35, 277–281. [Google Scholar] [CrossRef]
- Yuan, J.; Wang, Y.; Liu, Y.; Wang, Y.; Xu, J. Partial discharge fault detection technology for transformer based on knowledge reasoning. Electr. Meas. Instrum. 2020, 57, 1–5. [Google Scholar] [CrossRef]
- Dong, Y.; Liao, M.; Zhang, X.; Wang, F. Faults diagnosis of rolling element bearings based on modified morphological method. Mech. Syst. Signal Process. 2011, 25, 1276–1286. [Google Scholar] [CrossRef]
- Zheng, Y.; Zhu, Y.; Gao, J. Hybrid signal separation of transformer partial discharge based on SSA and ICA. Electr. Meas. Instrum. 2020, 57, 84–90. [Google Scholar] [CrossRef]
- He, Y.; Hua, Z.; Hou, Z.; Wang, Z. GIS partial discharge pattern recognition research based on class kernel mean principal component analysis. Electr. Meas. Instrum. 2016, 53, 84–89. [Google Scholar] [CrossRef]
- Tang, J.; Wang, J.; Li, J.; Song, S. Application of the Weibull distribution for the recognition of transformer PD phenomena. J. Chongqing Univ. 2002, 25, 87–90. [Google Scholar] [CrossRef]
- El-Hag, A.H. Promoting Condition Monitoring and Diagnostics of Electrical Insulation in Undergraduate Capstone Graduation Projects. IEEE Electr. Insul. Mag. 2015, 31, 8–15. [Google Scholar] [CrossRef]
- Okabe, S.; Ueta, G.; Hama, H.; Ito, T.; Hikita, M.; Okubo, H. New aspects of UHF PD diagnostics on gas-insulated systems. IEEE Trans. Dielectr. Electr. Insul. 2014, 21, 2245–2258. [Google Scholar] [CrossRef]
- Judd, M.D.; Yang, L.; Hunter, I.B.B. Partial discharge monitoring of power transformers using UHF sensors. Part I: Sensors and signal interpretation. IEEE Electr. Insul. Mag. 2005, 21, 5–14. [Google Scholar] [CrossRef]
- Chen, G.; Liu, Z.; Zhang, Q. Partial discharge signals extraction based on spectral kurtosis. Electr. Power Autom. Equip. 2013, 33, 94–110. [Google Scholar] [CrossRef]
- Hu, A.; Ma, W.; Tang, G. Rolling bearing fault feature extraction method based on ensemble empirical mode decomposition and kurtosis criterion. Proc. CSEE 2012, 32, 106–111. [Google Scholar] [CrossRef]
- Ozbek, I.Y.; Shamsi, H. Heart Sound Localization in Respiratory Sound Based on a New Computationally-Efficient Entropy Bound. IEEE J. Biomed. Health Inform. 2017, 21, 105–114. [Google Scholar] [CrossRef]
- Ait, L.E.H.; Akhouayri, E.S.; Agliz, D.; Atmani, A. Automatic detection and picking of P-wave arrival in locally stationary noise using cross-correlation. Digit. Signal Process. 2014, 26, 87–100. [Google Scholar] [CrossRef]
- Fernandes, R.A.; Andrade, S.; Luciano, C.M.; Oleskovicz, M. Adaptive threshold based on wavelet transform applied to the segmentation of single and combined power quality disturbances. Appl. Soft Comput. 2016, 38, 967–977. [Google Scholar] [CrossRef]
- Zhang, X.; Zhou, J.; Li, N.; Wen, X. Block theresholding spatial combined de-noising method for suppress white-noise inter-ference in PD signals. High Volt. Eng. 2011, 37, 1142–1148. [Google Scholar] [CrossRef]
- Shang, H.; Yuan, J.; Wang, Y.; Jin, S. Application of wavelet footprints based on translation- invariant in of partial discharge signal detection. Trans. China Electrotech. Soc. 2013, 28, 33–40. [Google Scholar] [CrossRef]
- Yao, C.; Chen, Y.; Chen, P.; Chen, L.; Liu, F.; Liao, R. Method for partial dis-charge pattern recognition based on characteristics of signal energy spectrum and its system realization. High Volt. Eng. 2014, 40, 829–836. [Google Scholar] [CrossRef]
- Ashtiani, M.; Shahrtash, S. Partial discharge pulse localization in excessive noisy data window. IEEE Trans. Dielectr. Electr. Insul. 2015, 22, 428–435. [Google Scholar] [CrossRef]
- Xu, Z.; Tang, J.; Zhang, X.; Sun, C. Denoising of UHF partial discharge signal by complex wavelet transform for power transformer. Electr. Power Autom. Equip. 2008, 28, 27–32. [Google Scholar] [CrossRef]
- Kamran, M.; Habib, S.; Bajwa, A.A. An investigation into partial discharge pulse extraction methods. Int. J. Electr. Power Energy Syst. 2015, 73, 964–982. [Google Scholar] [CrossRef]
- Wang, Y.; Xu, X.; Hou, W.; Zhu, J.; Gao, B.; Zhang, Q. Defect Recognition of Oil-Paper Insulation Based on Fuzzy C-means Algorithm. Electr. Meas. Instrum. 2017, 54, 123–128, CNKI:SUN:DCYQ.0.2017-22-022. [Google Scholar]
- Jin, H. Research on feature extraction of transformer partial discharge signal based on variational mode decomposition and independent component analysis. Electr. Meas. Instrum. 2019, 56, 70–73+109. [Google Scholar] [CrossRef]
- Fatih, S.; Hakan, F.; Öztop, H.F. MHD Pulsating forced convection of nanofluid over parallel plates with blocks in a channel. Int. J. Mech. Sci. 2019, 157, 726–740. [Google Scholar] [CrossRef]
- Fatih, S.; Hakan, F.; Öztop, H.F. Pulsating nanofluids jet impingement cooling of a heated horizontal surface. Int. J. Heat Mass Transf. 2014, 69, 54–65. [Google Scholar] [CrossRef]


Publisher’s Note: MDPI stays neutral with regard to jurisdictional claims in published maps and institutional affiliations. |
© 2022 by the authors. Licensee MDPI, Basel, Switzerland. This article is an open access article distributed under the terms and conditions of the Creative Commons Attribution (CC BY) license (https://creativecommons.org/licenses/by/4.0/).
Share and Cite
Yang, D.; Zhang, W.; Xu, G.; Li, T.; Shen, J.; Yue, Y.; Li, S. Partial Discharge Pulse Segmentation Approach of Converter Transformers Based on Higher Order Cumulant. Energies 2022, 15, 415. https://doi.org/10.3390/en15020415
Yang D, Zhang W, Xu G, Li T, Shen J, Yue Y, Li S. Partial Discharge Pulse Segmentation Approach of Converter Transformers Based on Higher Order Cumulant. Energies. 2022; 15(2):415. https://doi.org/10.3390/en15020415
Chicago/Turabian StyleYang, Dingqian, Weining Zhang, Guanghu Xu, Tiangeng Li, Jiexin Shen, Yunkai Yue, and Shuaibing Li. 2022. "Partial Discharge Pulse Segmentation Approach of Converter Transformers Based on Higher Order Cumulant" Energies 15, no. 2: 415. https://doi.org/10.3390/en15020415
APA StyleYang, D., Zhang, W., Xu, G., Li, T., Shen, J., Yue, Y., & Li, S. (2022). Partial Discharge Pulse Segmentation Approach of Converter Transformers Based on Higher Order Cumulant. Energies, 15(2), 415. https://doi.org/10.3390/en15020415