
Heat Transfer Enhancement by Perforated and Louvred Fin Heat Exchangers


Abstract
:1. Introduction
2. Materials and Methods
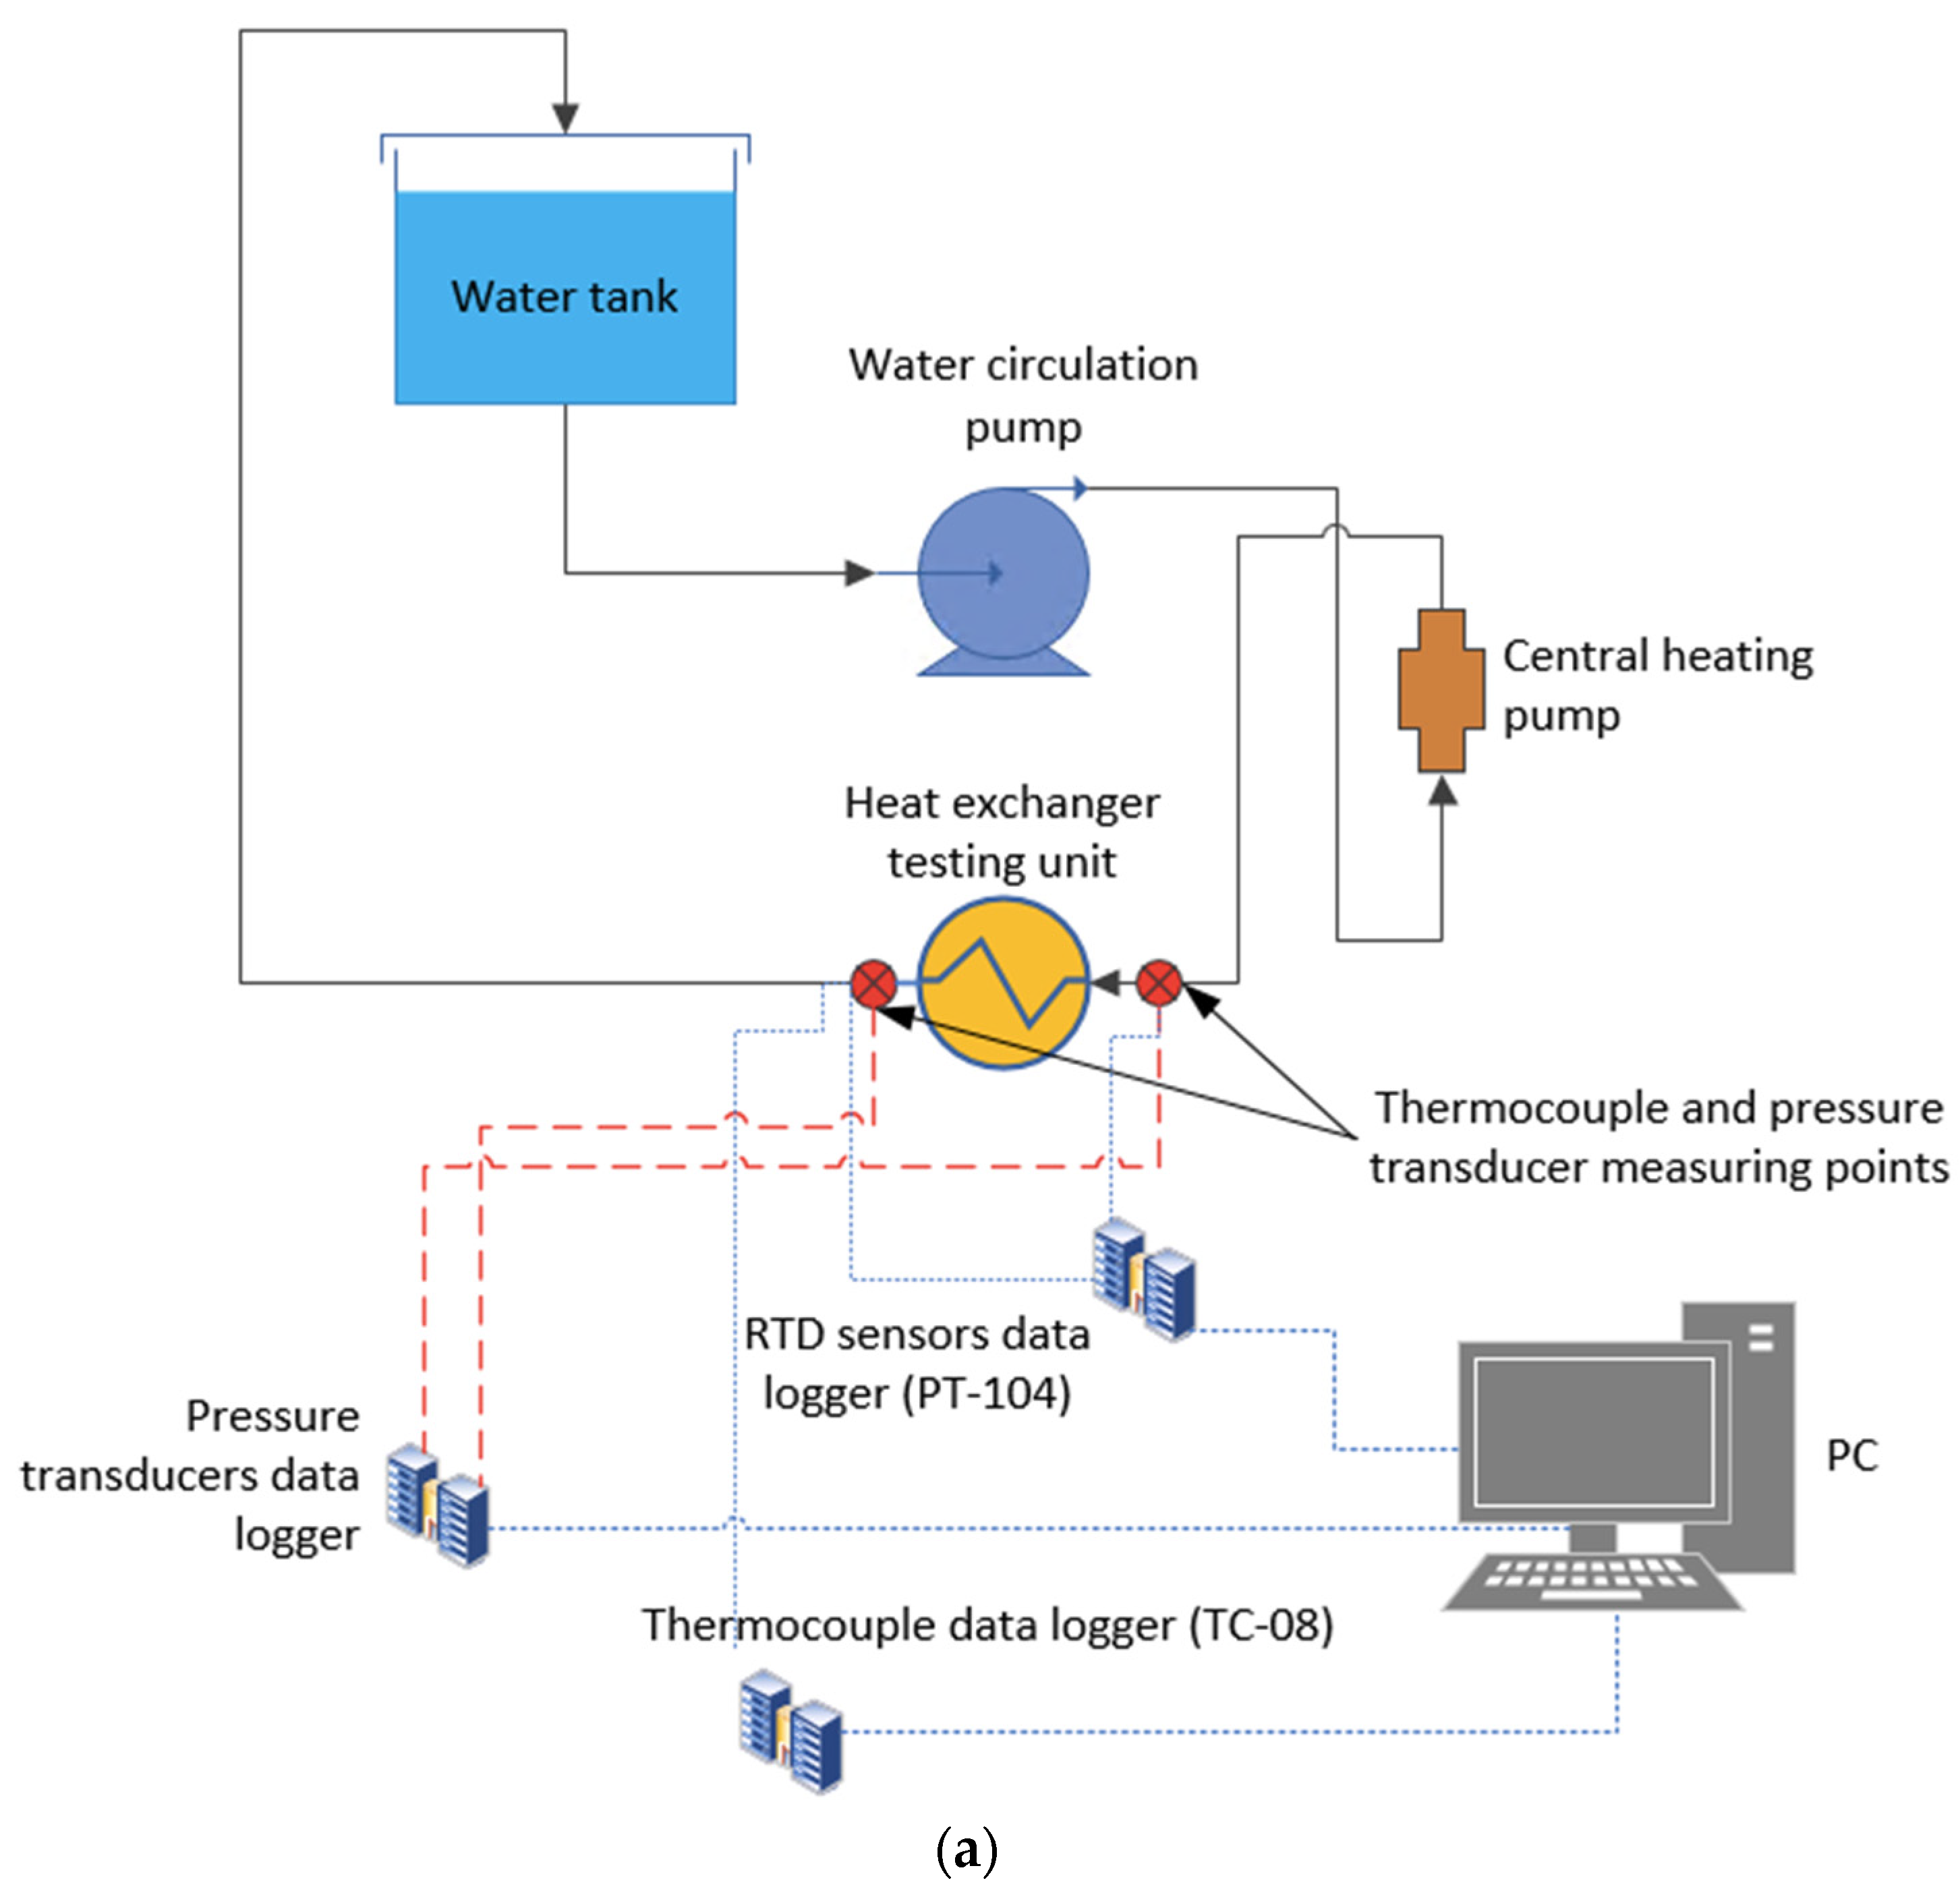
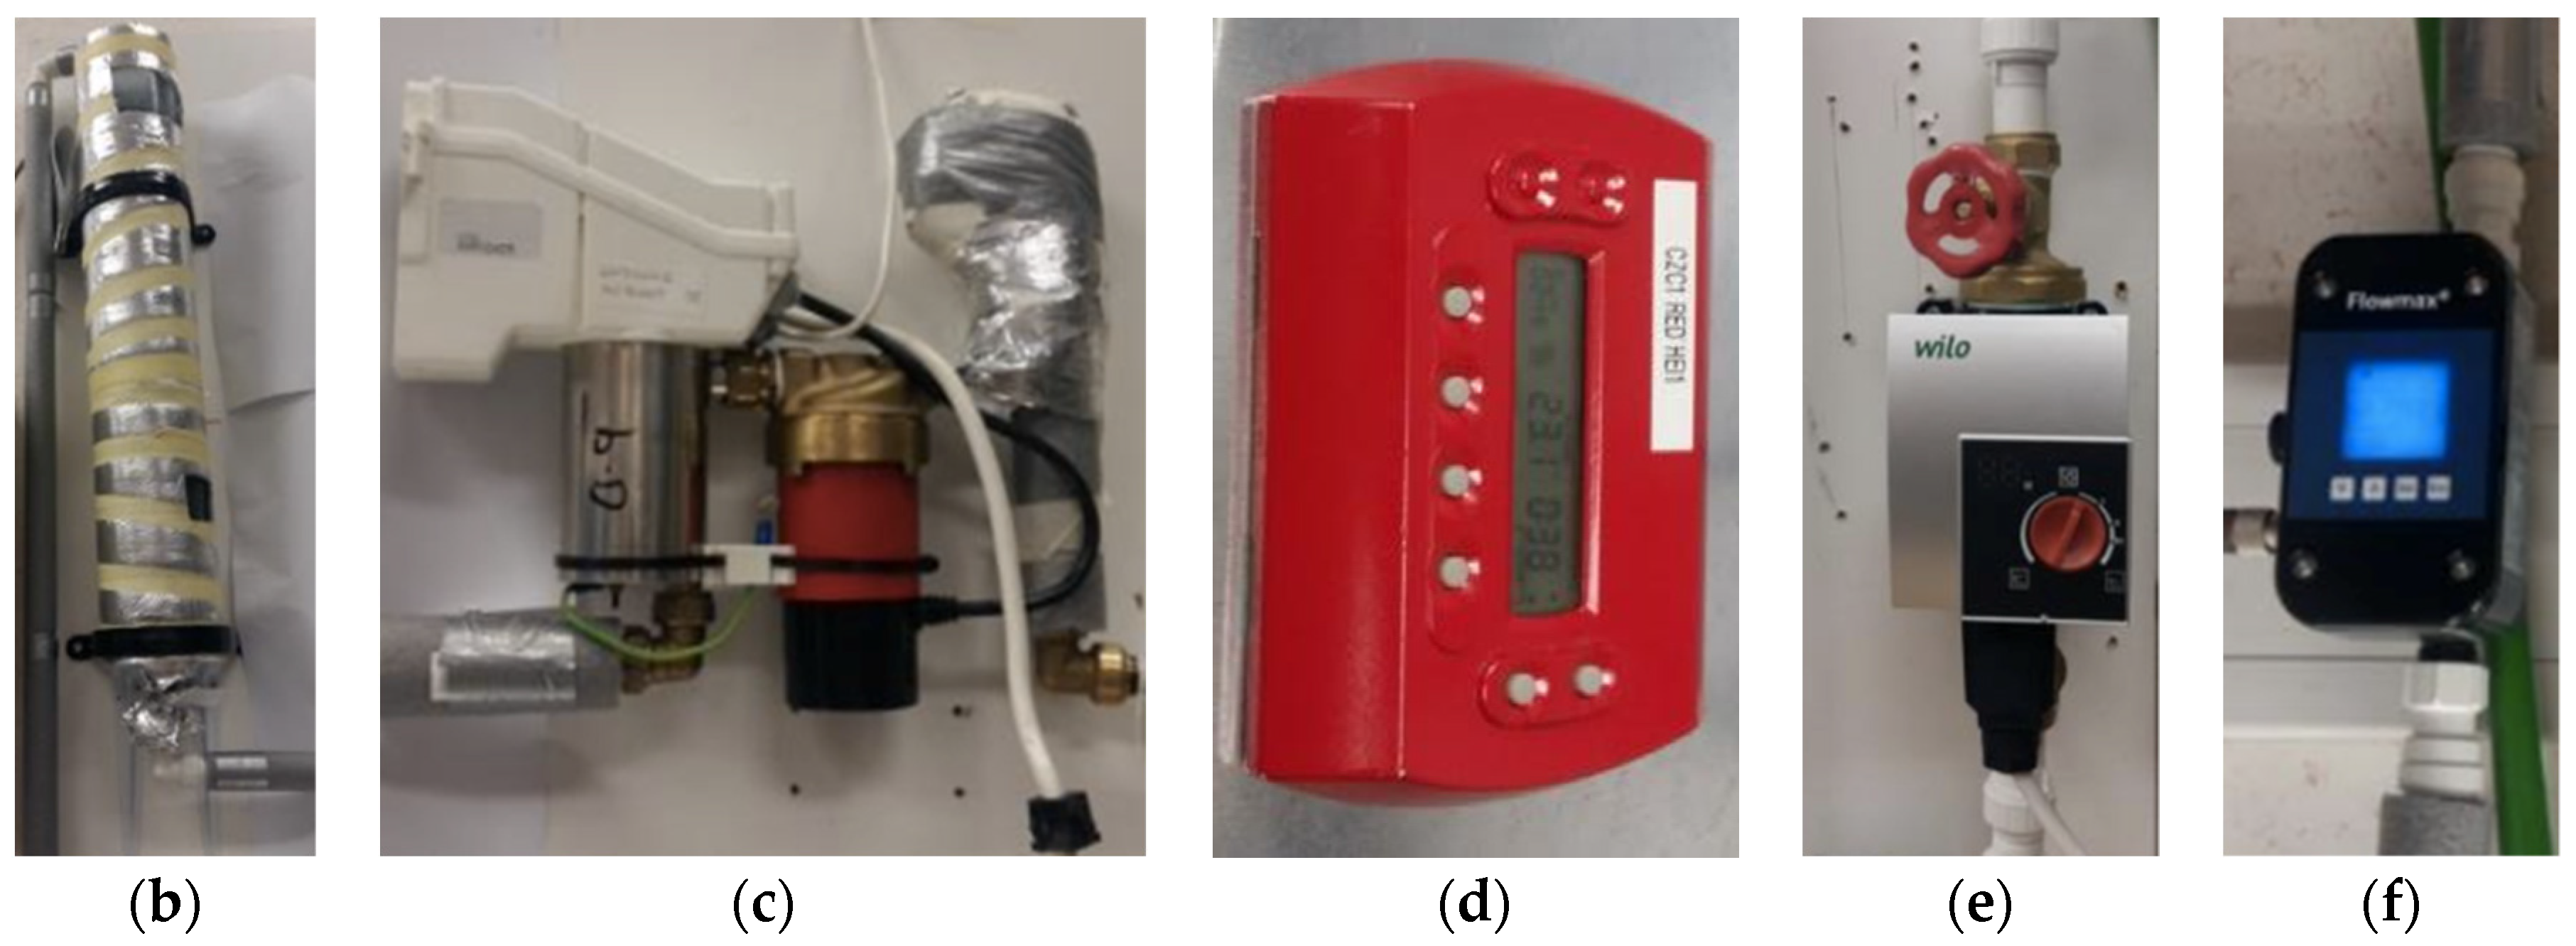
2.1. Experimental Rig
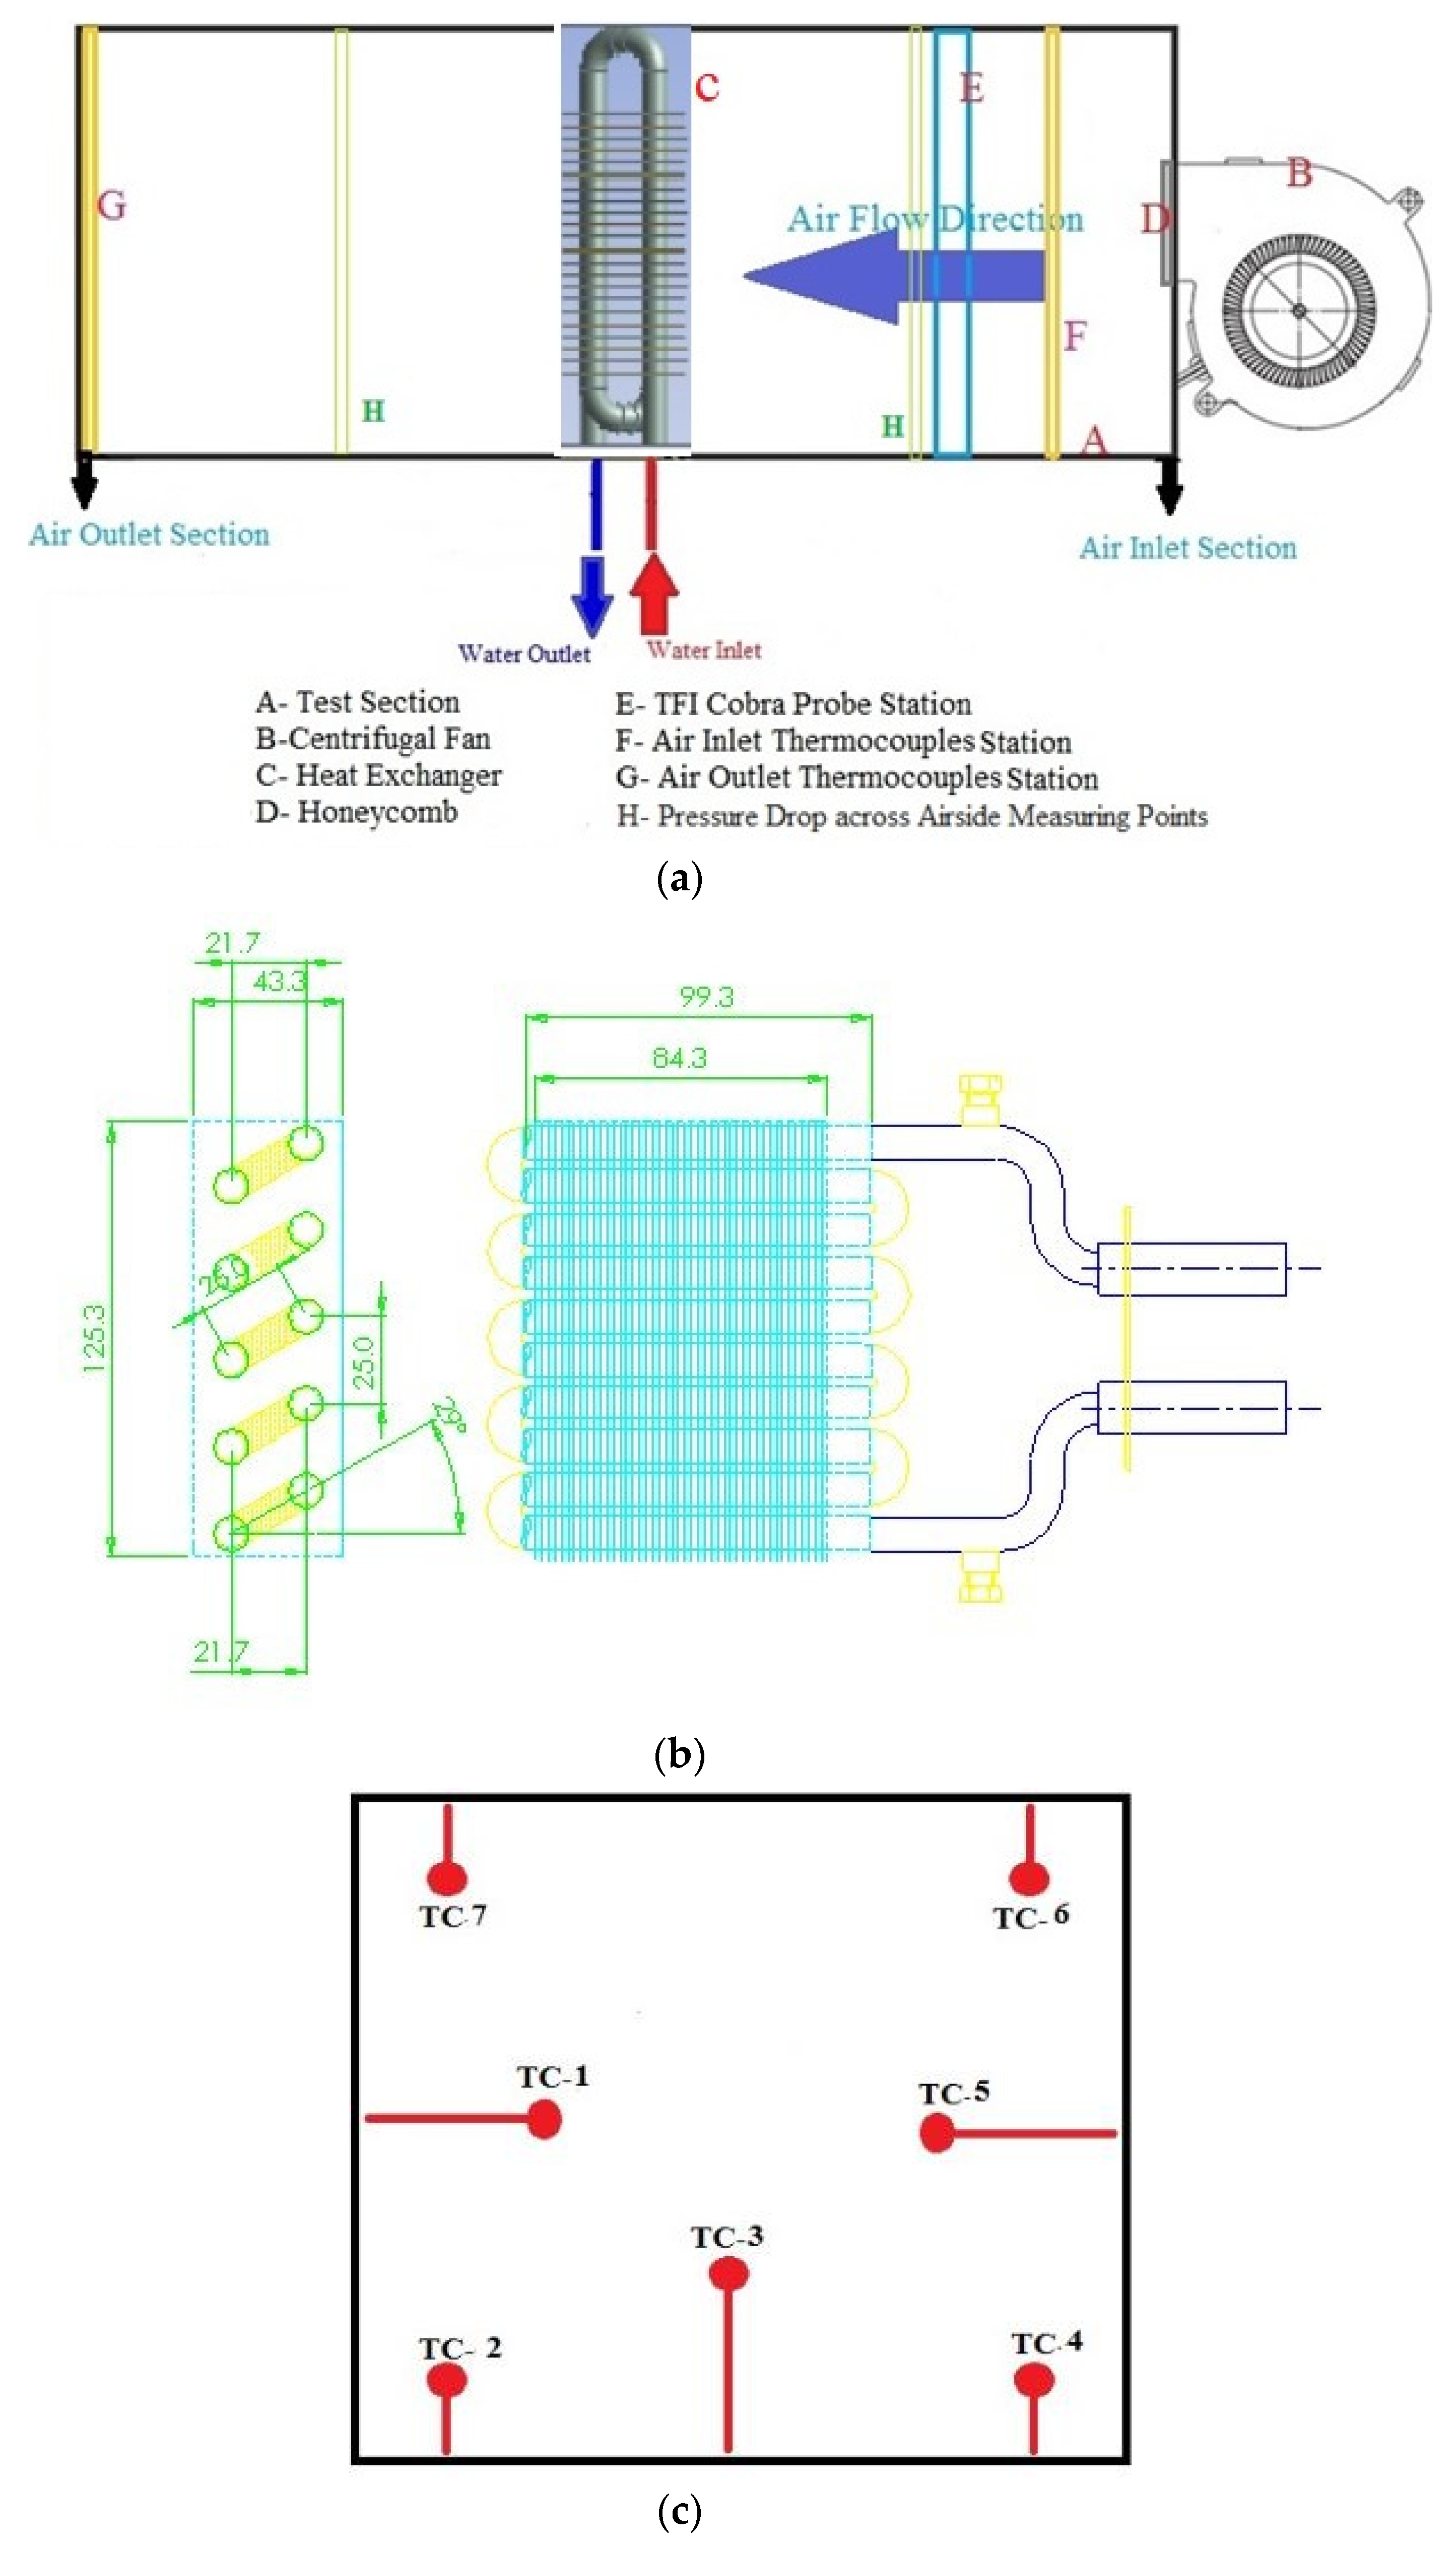
2.1.1. Heat Exchanger Testing Unit
2.1.2. Fin Geometries
- Plain fin
- Perforated plain fin
- Louvred fin
2.1.3. Experimental Procedure
2.2. Data Analysis
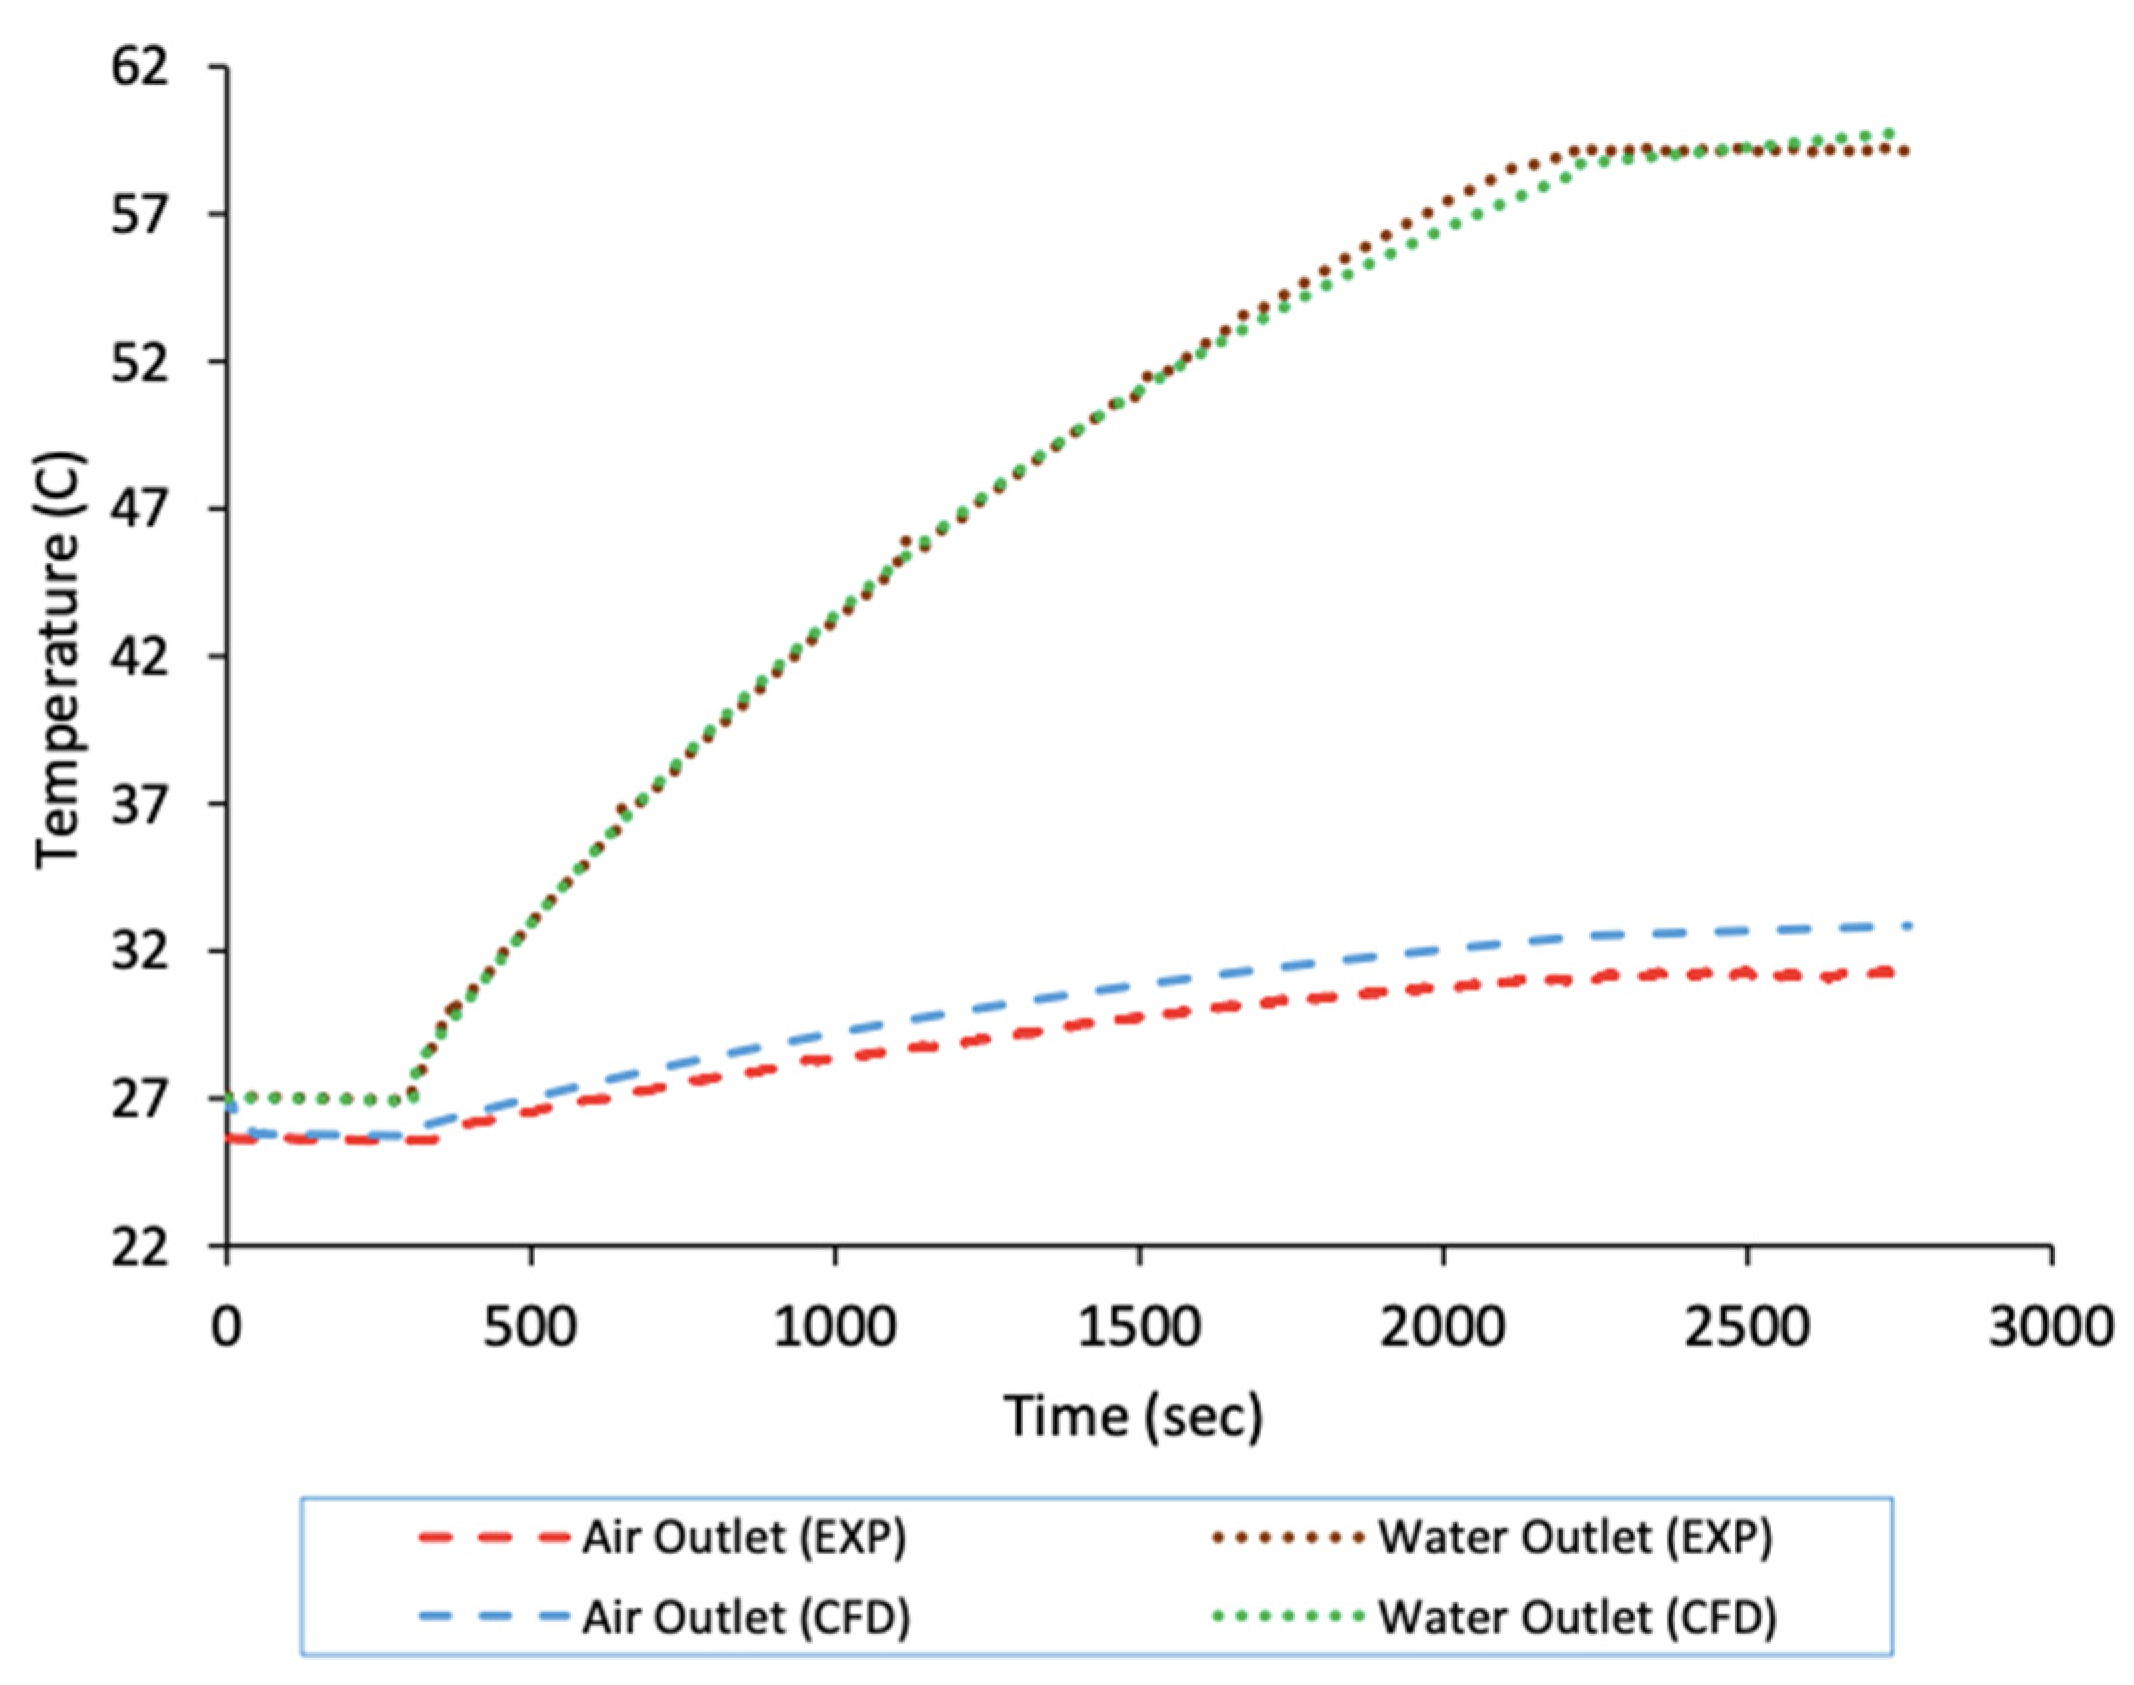
3. Results
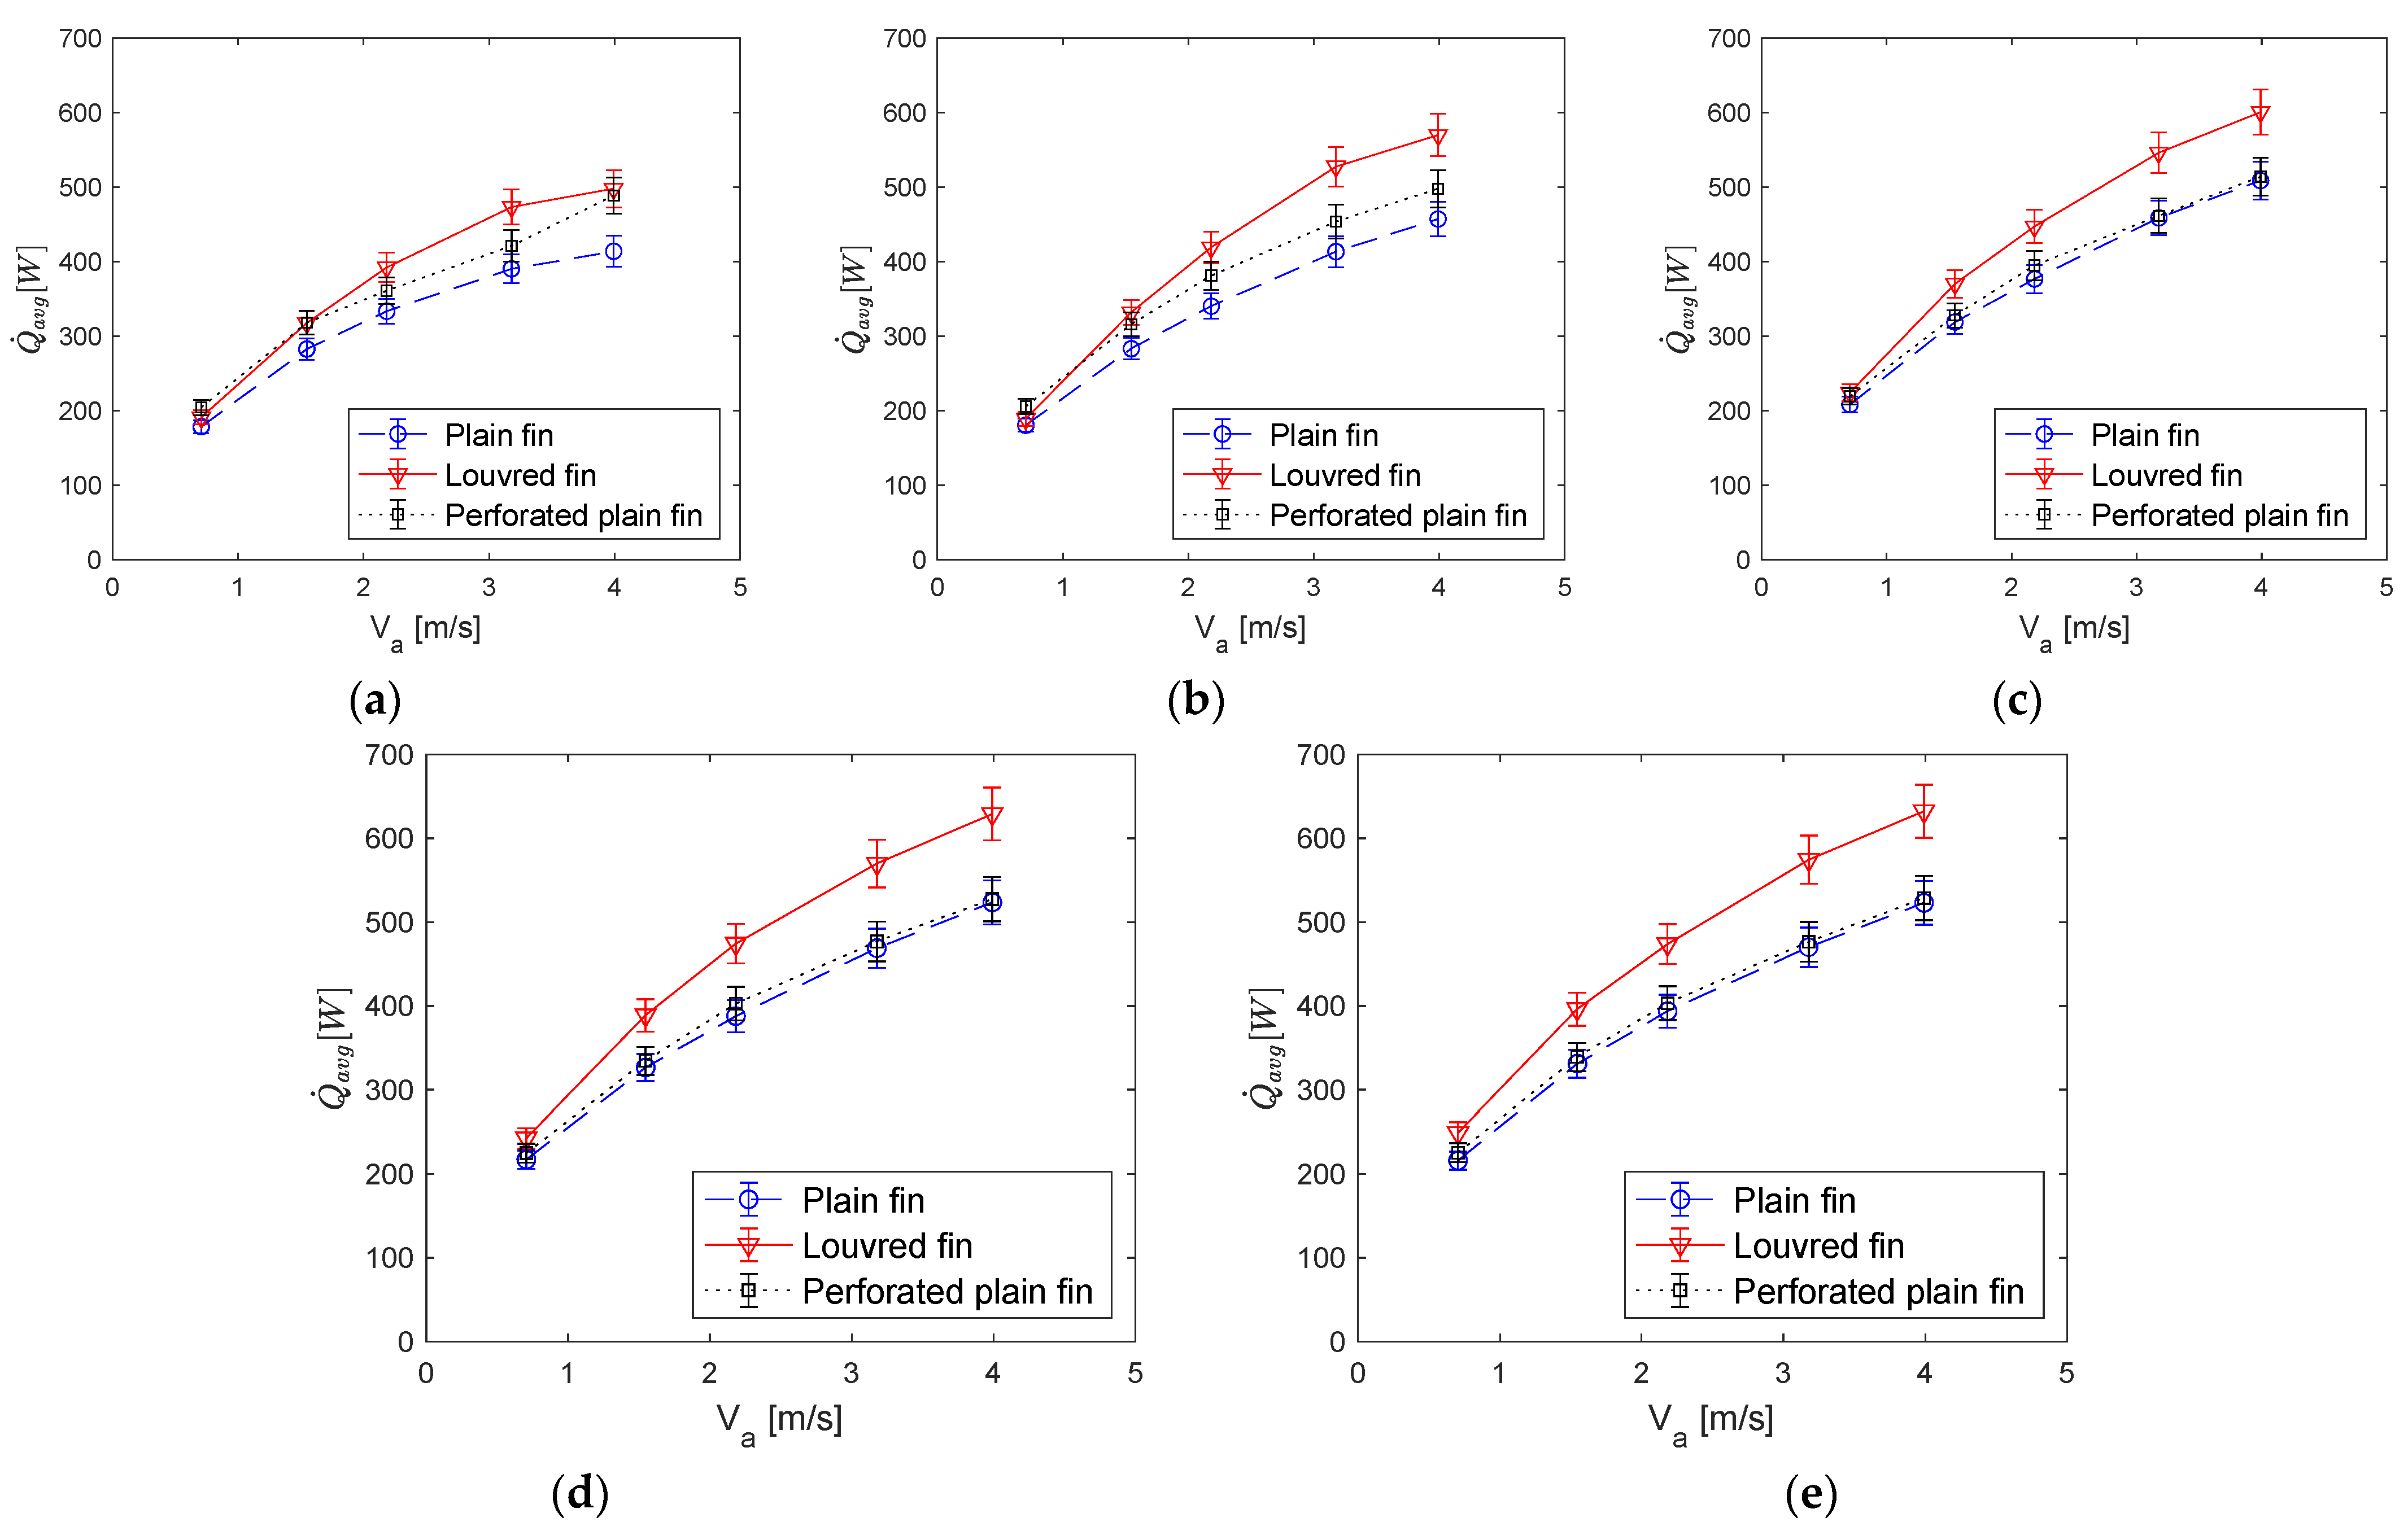
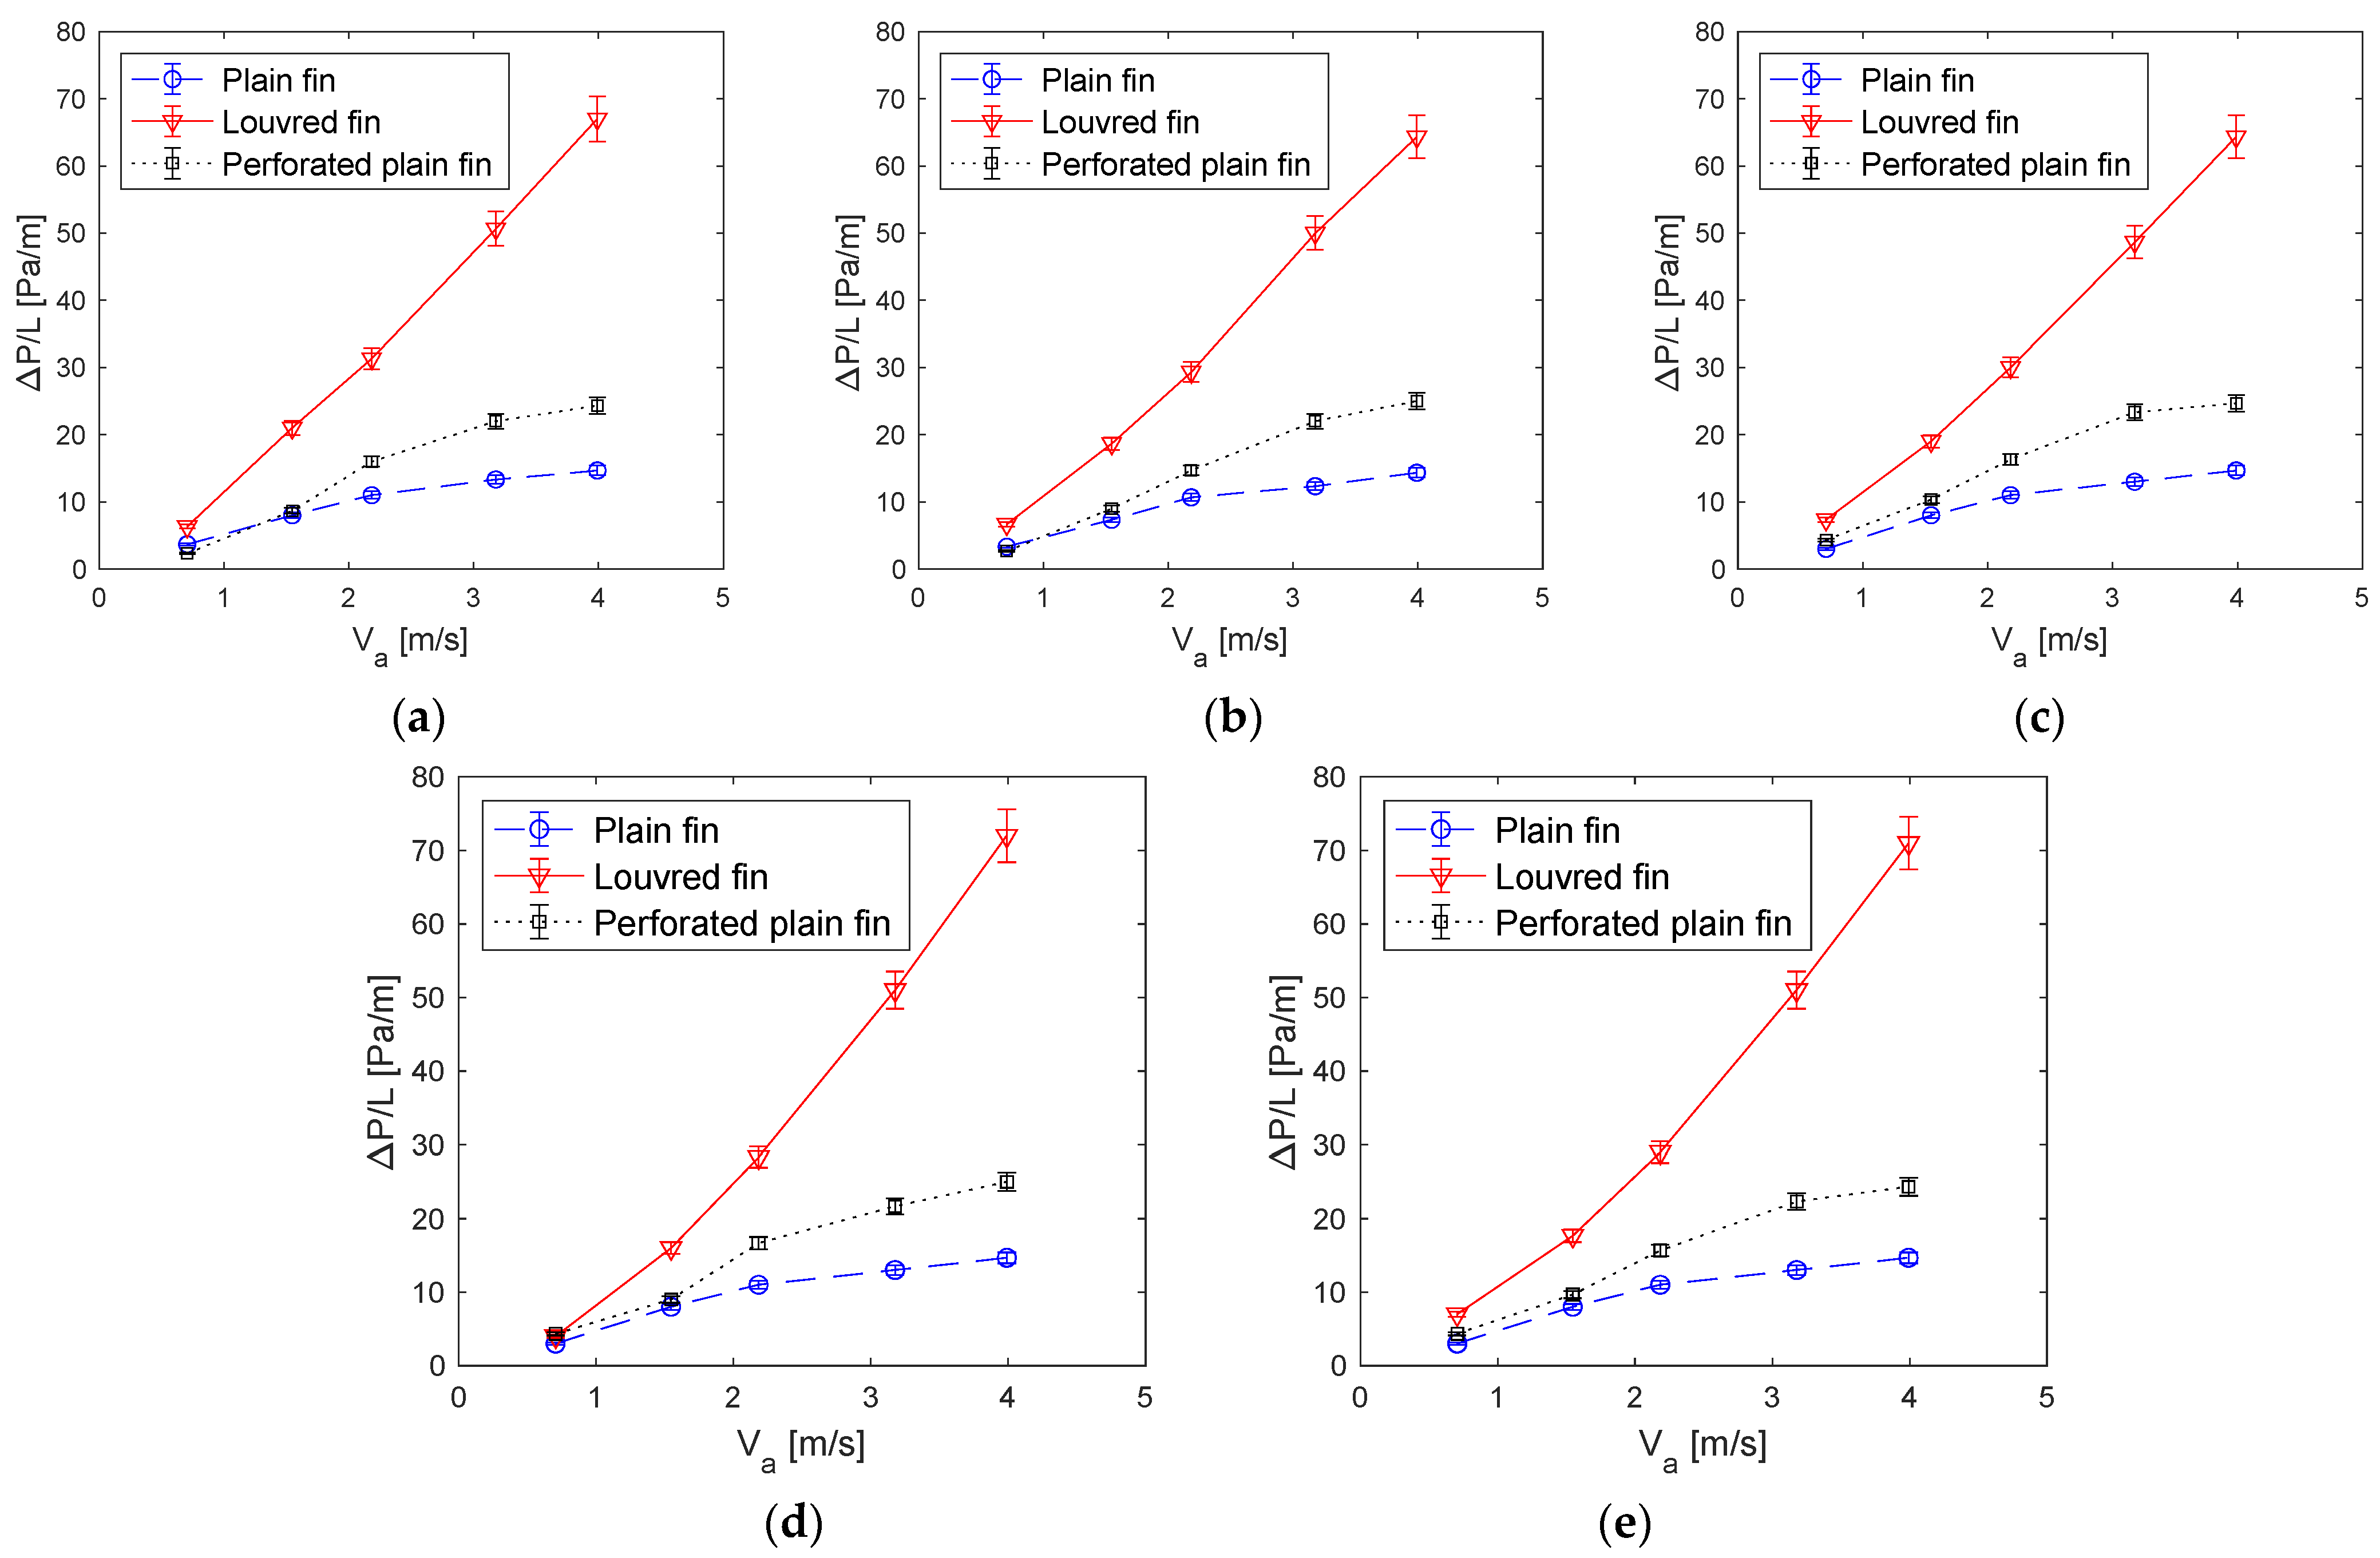
3.1. Performance Comparison of Fin Geometry
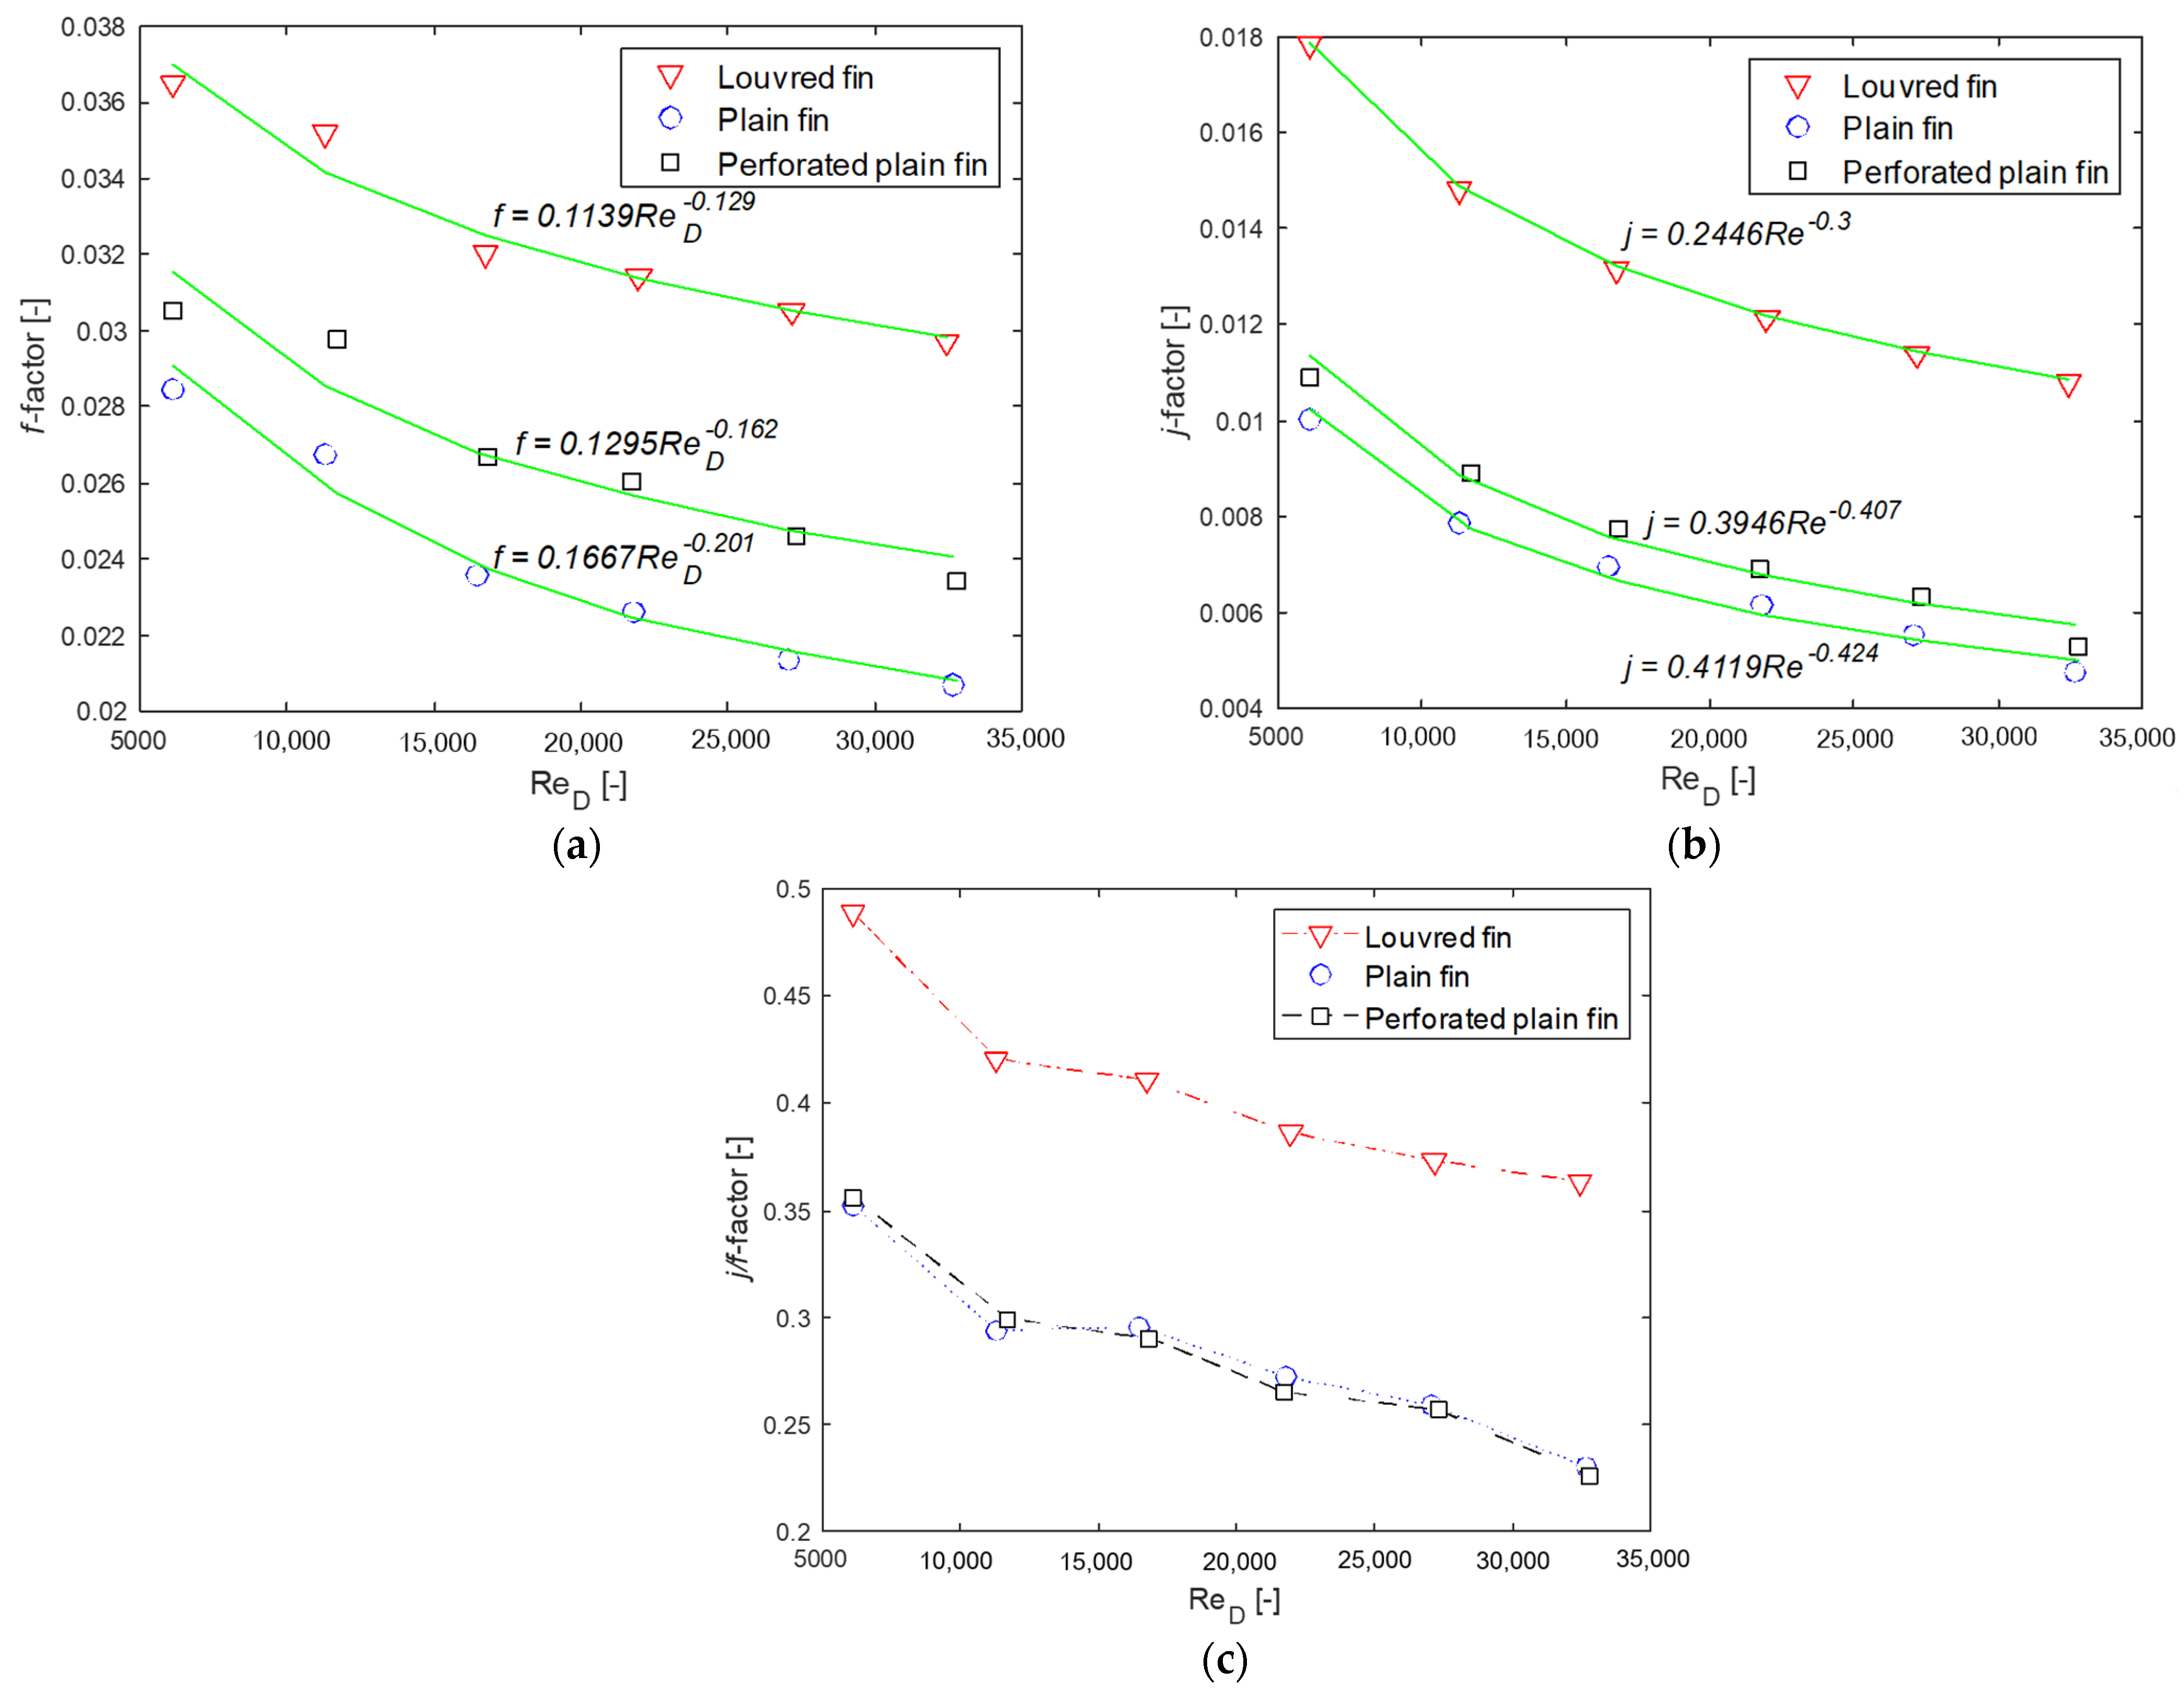
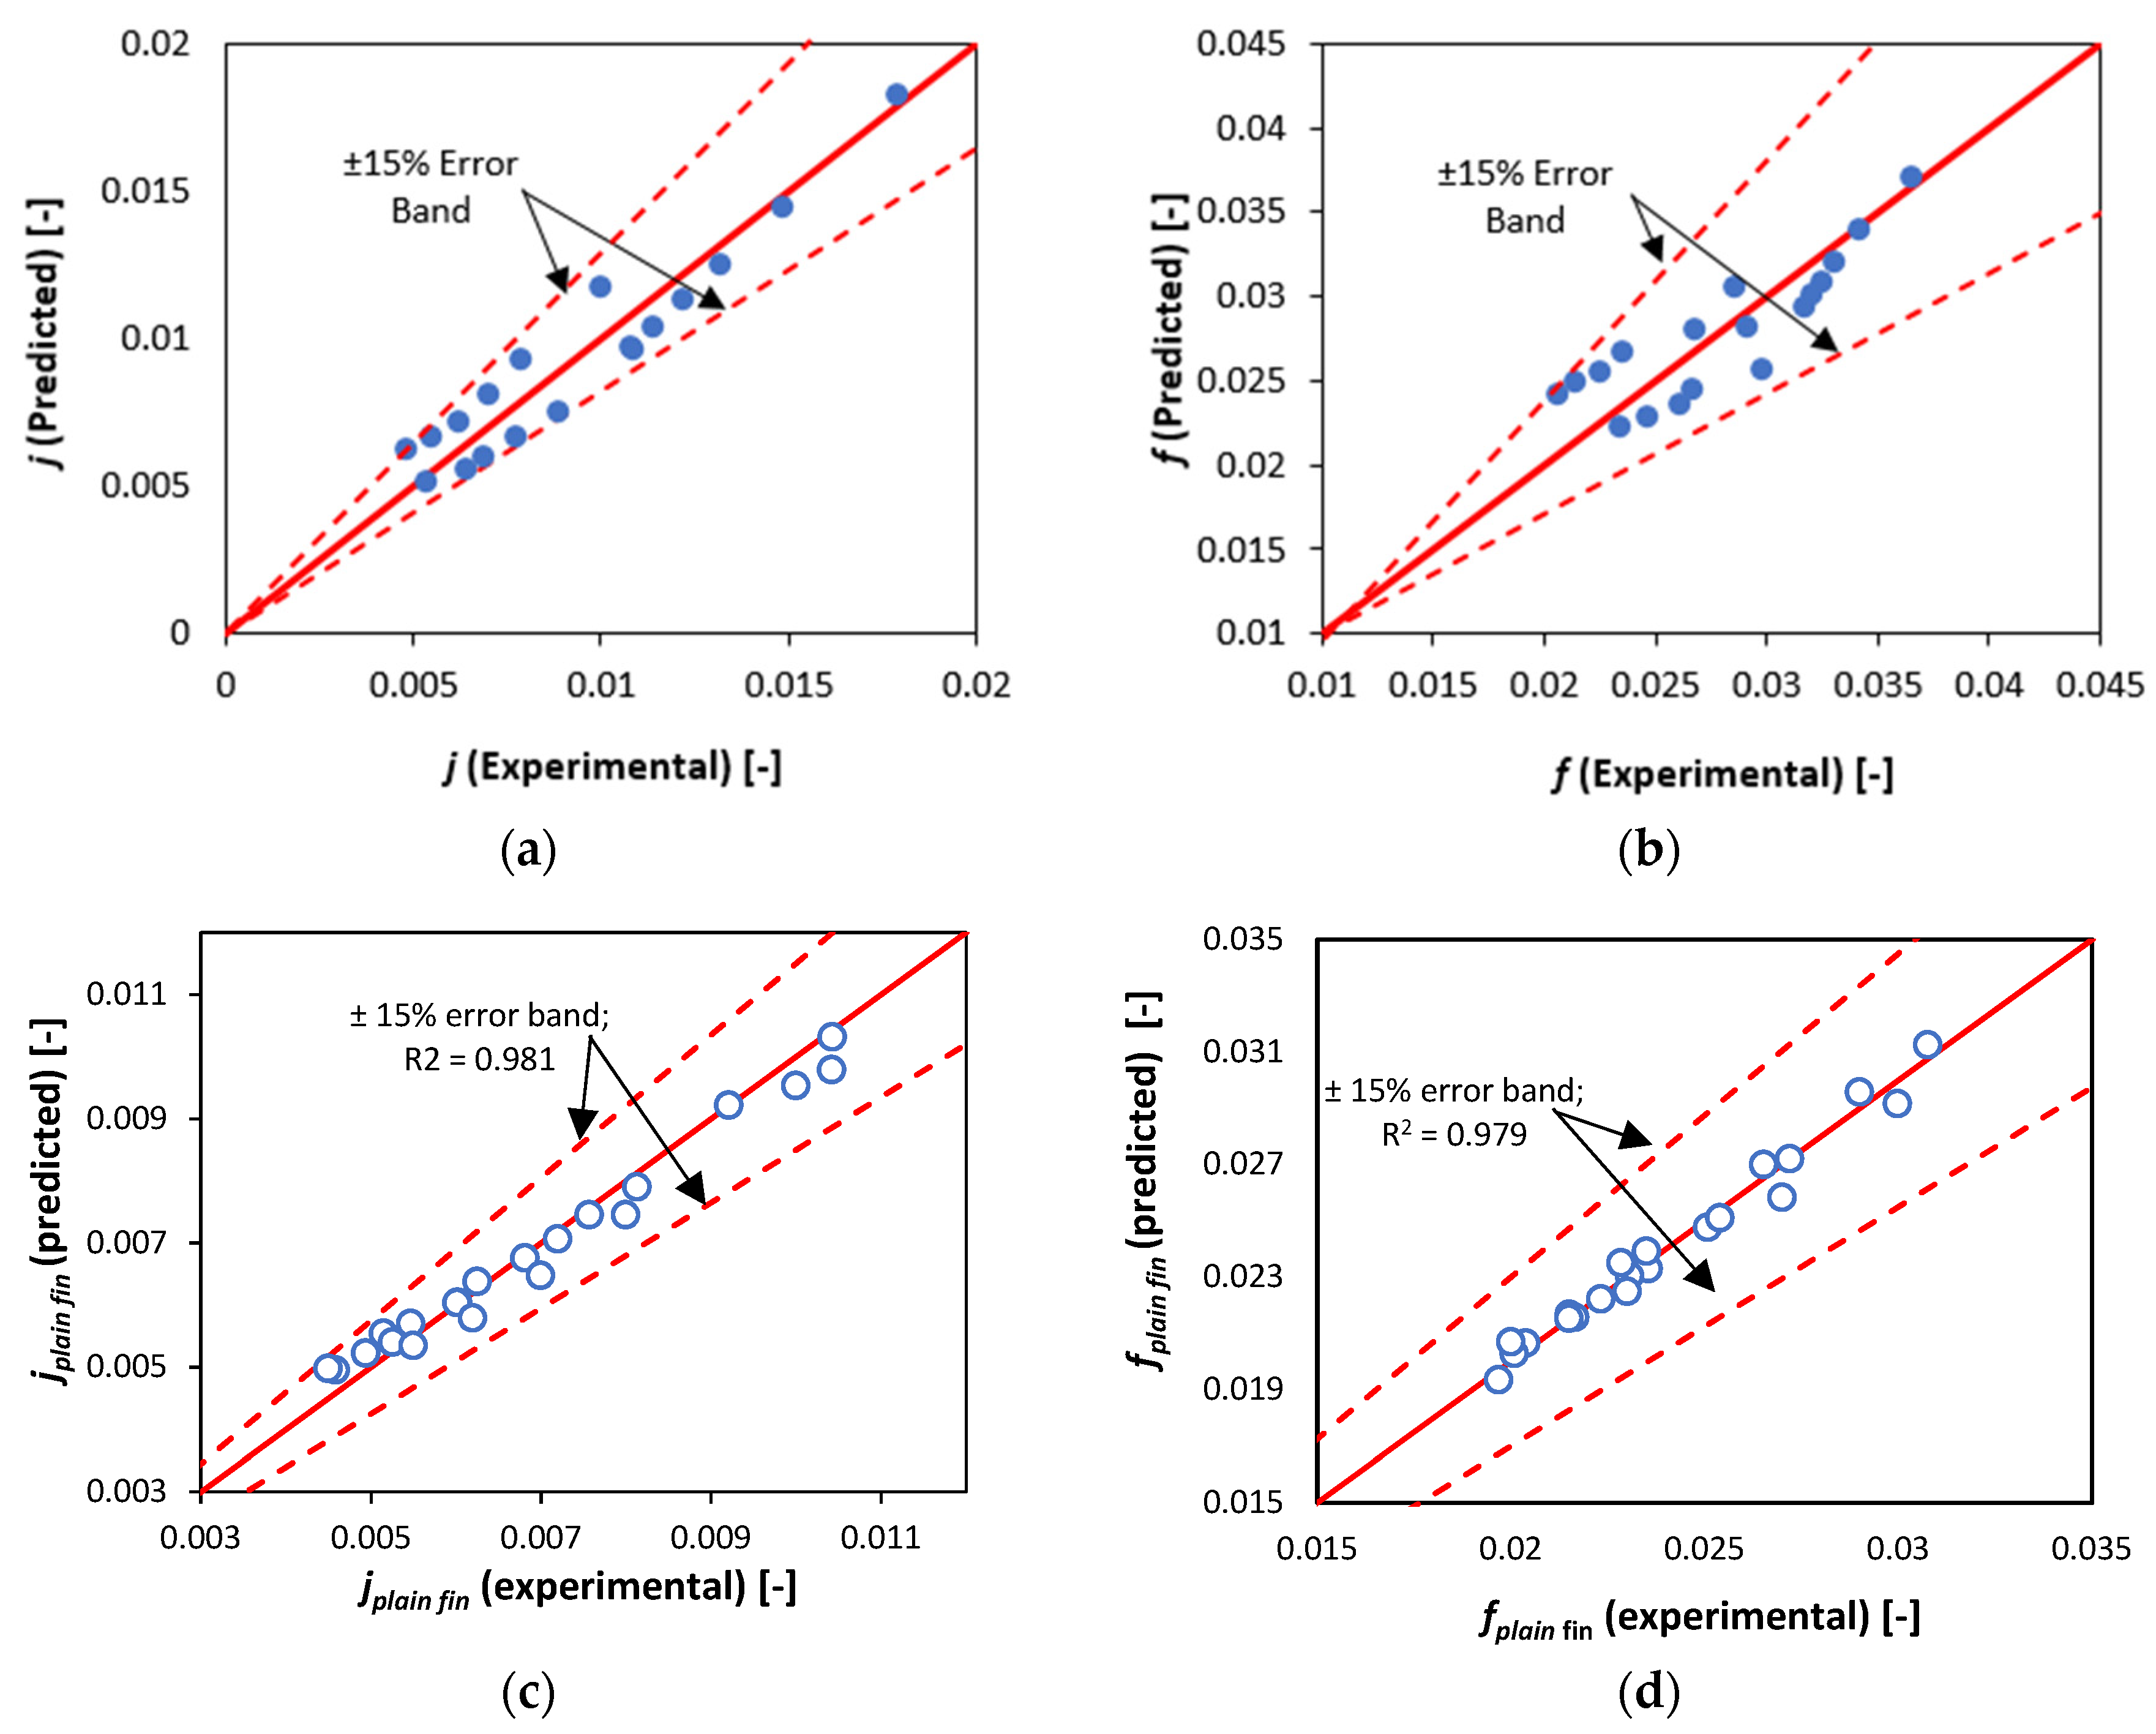
3.2. Development of New Empirical Relations for Fanning f and Colburn j-Factor
4. Conclusions
Author Contributions
Funding
Data Availability Statement
Conflicts of Interest
References
- Shah, R.K.; Sekulic, D.P. Fundamentals of Heat Exchanger Design; John Wiley & Sons: Hoboken, NJ, USA, 2003. [Google Scholar]
- Mcquiston, F.C.; Parker, J.D.; Spilter, J.K. Heating, Ventilating, and Air Conditioning: Analysis and Design; Wiley: Hoboken, NJ, USA, 2004. [Google Scholar]
- Naphon, P.; Wongwises, S. A review of flow and heat transfer characteristics in curved tubes. Renew. Sustain. Energy Rev. 2006, 10, 463–490. [Google Scholar] [CrossRef]
- Thulukkanam, K. Heat Exchanger Design Handbook, 2nd ed.; Taylor & Francis: Abingdon, UK, 2013. [Google Scholar]
- Wilson, E.E. A basis for rational design of heat transfer apparatus. J. Am. Soc. Mech. Eng. 1915, 37, 546–551. [Google Scholar]
- Sieder, E.N.; Corporation, G.E.T.A.T.E.F.W.; York, N. Heat Transfer and Pressure Drop of Liquids in Tubes O Oil A, Heating Oil B, Heating Oil A, Cooling Oil C, Cooling; American Chemical Society: New York, NY, USA, 2021. [Google Scholar]
- Colburn, A.P. A method of correlating forced convection heat-transfer data and a comparison with fluid friction. Int. J. Heat Mass Transf. 1964, 7, 1359–1384. [Google Scholar] [CrossRef]
- Dittus, F.W.; Boelter, L.M.K. Heat transfer in automobile radiators of the tubular type. Int. Commun. Heat Mass Transf. 1985, 12, 3–22. [Google Scholar] [CrossRef]
- Wang, C.-C.; Chang, Y.-J.; Hsieh, Y.-C.; Lin, Y.-T. Sensible heat and friction characteristics of plate fin-and-tube heat exchangers having plane fins. Int. J. Refrig. 1996, 19, 223–230. [Google Scholar] [CrossRef]
- Abu Madi, M.; Johns, R.; Heikal, M. Performance characteristics correlation for round tube and plate finned heat exchangers. Int. J. Refrig. 1998, 21, 507–517. [Google Scholar] [CrossRef]
- Webb, R.; Kim, N.-H. Advances in Air-Cooled Heat Exchanger Technology. J. Enhanc. Heat Transf. 2007, 14, 1–26. [Google Scholar] [CrossRef]
- Wang, C.-C. A survey of recent patents of fin-and-tube heat exchangers from 2001 to 2009. Int. J. Air-Cond. Refrig. 2010, 18, 1–13. [Google Scholar] [CrossRef]
- Wang, C.-C.; Lee, W.-S.; Sheu, W.-J. A comparative study of compact enhanced fin-and-tube heat exchangers. Int. J. Heat Mass Transf. 2001, 44, 3565–3573. [Google Scholar] [CrossRef]
- Fernández-Seara, J.; Uhía, F.J.; Sieres, J.; Campo, A. A general review of the Wilson plot method and its modifications to determine convection coefficients in heat exchange devices. Appl. Therm. Eng. 2007, 27, 2745–2757. [Google Scholar] [CrossRef] [Green Version]
- Wang, C.-C.; Chen, K.-Y.; Liaw, J.-S.; Tseng, C.-Y. An experimental study of the air-side performance of fin-and-tube heat exchangers having plain, louver, and semi-dimple vortex generator configuration. Int. J. Heat Mass Transf. 2015, 80, 281–287. [Google Scholar] [CrossRef]
- Liu, X.; Yu, J.; Yan, G. A numerical study on the air-side heat transfer of perforated finned-tube heat exchangers with large fin pitches. Int. J. Heat Mass Transf. 2016, 100, 199–207. [Google Scholar] [CrossRef]
- Kalantari, H.; Ghoreishi-Madiseh, S.A.; Kurnia, J.C.; Sasmito, A.P. An analytical correlation for conjugate heat transfer in fin and tube heat exchangers. Int. J. Therm. Sci. 2021, 164, 106915. [Google Scholar] [CrossRef]
- Altwieb, M.; Kubiak, K.J.; Aliyu, A.M.; Mishra, R. A new three-dimensional CFD model for efficiency optimisation of fluid-to-air multi-fin heat exchanger. Therm. Sci. Eng. Prog. 2020, 19, 100658. [Google Scholar] [CrossRef]
- Altwieb, M.O.; Mishra, R. Experimental and Numerical Investigations on the Response of a Multi Tubes and Fins Heat Exchanger under Steady State Operating Conditions. In Proceedings of the 6th International and 43rd National Conference on Fluid Mechanics and Fluid Power, Allahabad, India, 15–17 December 2016; pp. 1–3. [Google Scholar]
- Singh, D.; Aliyu, A.; Charlton, M.; Mishra, R.; Asim, T.; Oliveira, A. Local multiphase flow characteristics of a severe-service control valve. J. Pet. Sci. Eng. 2020, 195, 107557. [Google Scholar] [CrossRef]
- Singh, D.; Charlton, M.; Asim, T.; Mishra, R.; Townsend, A.; Blunt, L. Quantification of additive manufacturing induced variations in the global and local performance characteristics of a complex multi-stage control valve trim. J. Pet. Sci. Eng. 2020, 190, 107053. [Google Scholar] [CrossRef]
- Asim, T.; Mishra, R.; Oliveira, A.; Charlton, M. Effects of the geometrical features of flow paths on the flow capacity of a control valve trim. J. Pet. Sci. Eng. 2019, 172, 124–138. [Google Scholar] [CrossRef] [Green Version]
- Asim, T.; Charlton, M.; Mishra, R. CFD based investigations for the design of severe service control valves used in energy systems. Energy Convers. Manag. 2017, 153, 288–303. [Google Scholar] [CrossRef] [Green Version]
- TFI. Cobra Probe. 2021. Available online: https://www.turbulentflow.com.au/Products/CobraProbe/CobraProbe.php (accessed on 6 December 2021).
- ASHRAE. HVAC Design Manual for Hospitals and Clinics; ASHRAE: Atlanta, GA, USA, 2013. [Google Scholar]
- Palmer, E.; Mishra, R.; Fieldhouse, J. An optimization study of a multiple-row pin-vented brake disc to promote brake cooling using computational fluid dynamics. Proc. Inst. Mech. Eng. Part D J. Automob. Eng. 2009, 223, 865–875. [Google Scholar] [CrossRef] [Green Version]


| Test ID | Water Side | Air Side | ||
|---|---|---|---|---|
| Water Flow Rate (m3/h) | Water Inlet Temperature (°C) | Air Velocity (m/s) | Air Inlet Temperature (°C) | |
| Test case 1.1 | 0.12 ± 0.0018 | 60 ± 1 | 0.705 | 24 ± 1 |
| Test case 1.2 | 1.546 | |||
| Test case 1.3 | 2.183 | |||
| Test case 1.4 | 3.177 | |||
| Test case 1.5 | 3.991 | |||
| Test case 2.1 | 0.18 ± 0.0018 | 60 ± 1 | 0.705 | 24 ± 1 |
| Test case 2.2 | 1.546 | |||
| Test case 2.3 | 2.183 | |||
| Test case 2.4 | 3.177 | |||
| Test case 2.5 | 3.991 | |||
| Test case 3.1 | 0.24 ± 0.0018 | 60 ± 1 | 0.705 | 24 ± 1 |
| Test case 3.2 | 1.546 | |||
| Test case 3.3 | 2.183 | |||
| Test case 3.4 | 3.177 | |||
| Test case 3.5 | 3.991 | |||
| Test case 4.1 | 0.3 ± 0.0018 | 60 ± 1 | 0.705 | 24 ± 1 |
| Test case 4.2 | 1.546 | |||
| Test case 4.3 | 2.183 | |||
| Test case 4.4 | 3.177 | |||
| Test case 4.5 | 3.991 | |||
| Test case 5.1 | 0.36 ± 0.0018 | 60 ± 1 | 0.705 | 24 ± 1 |
| Test case 5.2 | 1.546 | |||
| Test case 5.3 | 2.183 | |||
| Test case 5.4 | 3.177 | |||
| Test case 5.5 | 3.991 | |||
Publisher’s Note: MDPI stays neutral with regard to jurisdictional claims in published maps and institutional affiliations. |
© 2022 by the authors. Licensee MDPI, Basel, Switzerland. This article is an open access article distributed under the terms and conditions of the Creative Commons Attribution (CC BY) license (https://creativecommons.org/licenses/by/4.0/).
Share and Cite
Altwieb, M.; Mishra, R.; Aliyu, A.M.; Kubiak, K.J. Heat Transfer Enhancement by Perforated and Louvred Fin Heat Exchangers. Energies 2022, 15, 400. https://doi.org/10.3390/en15020400
Altwieb M, Mishra R, Aliyu AM, Kubiak KJ. Heat Transfer Enhancement by Perforated and Louvred Fin Heat Exchangers. Energies. 2022; 15(2):400. https://doi.org/10.3390/en15020400
Chicago/Turabian StyleAltwieb, Miftah, Rakesh Mishra, Aliyu M. Aliyu, and Krzysztof J. Kubiak. 2022. "Heat Transfer Enhancement by Perforated and Louvred Fin Heat Exchangers" Energies 15, no. 2: 400. https://doi.org/10.3390/en15020400
APA StyleAltwieb, M., Mishra, R., Aliyu, A. M., & Kubiak, K. J. (2022). Heat Transfer Enhancement by Perforated and Louvred Fin Heat Exchangers. Energies, 15(2), 400. https://doi.org/10.3390/en15020400