Article

Heat Transfer Characteristics of Cold Water Phase-Change Heat Exchangers under Active Icing Conditions

1
College of Mechanical and Electrical Engineering, Qingdao University, Qingdao 266071, China
2
Qingdao Kechuang Blue New Energy Co., Ltd., Qingdao 266300, China
*
Author to whom correspondence should be addressed.
Energies 2022, 15(19), 7392; https://doi.org/10.3390/en15197392
Submission received: 22 August 2022 / Revised: 18 September 2022 / Accepted: 28 September 2022 / Published: 9 October 2022
(This article belongs to the Section B2: Clean Energy)

Abstract

:
Under active icing conditions, the heat transfer performance of the CPHE has a significant impact on the system’s efficiency and energy consumption. Using the enthalpy-porosity method for describing the solidification process of liquids, the simulation and analysis of the effects of different parameter changes on the CPHE heat transfer performance were conducted to clarify the effects of the changes in the intermediary side inlet water temperature, intermediate water flow rate, and cold water flow rate on the heat transfer process in the CPHE. According to our results, changing the intermediary inlet water temperature has a greater impact on the heat transfer process in the cold-water phase-change heat exchangers. For every decrease of 0.5 °C in the intermediary side inlet water temperature, the average heat transfer coefficient increases by approximately 50 W/m2-K. Changes in the intermediary water flow rate affect the cold water phase-change heat exchanger’s heat transfer process. By increasing the intermediary water flow rate, the average heat transfer coefficient of a cold water phase-change heat exchanger can be improved, but the growth decreases, and the maximum flow rate of the intermediary water should not exceed 0.5 m per second. A change in the cold water flow rate in the cold water phase-change heat exchanger’s heat transfer process has a small impact on the cold water flow rate, increasing by 0.02 m/s each, with the average heat transfer coefficient increasing by 20 W/m2-K.

1. Introduction

Using heat pump technology to extract heat energy from low-grade clean energy for the heating and cooling of buildings is an effective way to conserve energy and reduce emissions, which has a high environmental protection value and economic benefits [1,2].
These low-grade energy sources include air [3,4], soil [5,6], groundwater [7], surface water [8], urban sewage [9], industrial waste heat [10,11], etc. They have a low temperature, between 0 °C and 40 °C in winter, so they cannot be used directly and need to be used by heat pump technology to consume a small amount of high-grade energy. Among them, using a water source heat pump system for heating is the main way. At present, most of the research on water source heat pump systems focuses on performance and the optimization of the related parameters and control strategy. Wu [12] experimentally studied the effect of chilled water and cooling water flow rate variation on the performance of water source heat pump systems, and the results showed that the average COP increased by 23% when the chilled water flow rate was 1.4 m3/h compared to 2.2 m3/h, with the average COP of the system increasing by 7.8% when the cooling water flow rate was at 2.5 m3/h compared to 1.9 m3/h. Zhang [13] analyzed the effect of mathematical model uncertainty and parameter uncertainty on the performance of a water source heat pump system. The results showed that for the performance of water source heat pump systems, the most significant factors of uncertainty parameters were outdoor meteorological parameters, COP, the heat pump unit model, personnel, and fresh air. Qian [14] studied the optimality of the pool capacity in an energy storage water source heat pump system through a simulation method. The results showed that the cumulative annual energy savings of the optimized system could reach 7.28 kW-h, which could reduce the operating cost by RMB 31.1 million. Wang [15] proposed a novel NAPSO algorithm to solve the optimal scheduling model of a water source heat pump system. The results show that using this algorithm can save up to 0.57% operating costs per day compared to other algorithms. Xu [16] proposed an operation strategy based on the initial room temperature for water-source heat pump systems and verified the energy efficiency experimentally. The results show that the system with this operation strategy can save 37.8 kW·h of electricity consumption in 2 h. Fu [9] conducted a simulation study of sewage source heat pump systems using an air-cooled heat exchanger; the power consumption of the system, when the frequency conversion technology was used for sewage pumps and the air-cooled heat exchangers, was reduced by 7.4% compared to the frequency conversion technology for air-cooled heat exchangers only, and the indoor temperature fluctuation did not exceed 0.6 °C. The application of conventional water source heat pumps is still limited by the water volume and water temperature on the source side. When the water volume and water temperature on the source side are low, conventional water source heat pumps cannot be used. The development and application of the PCHP system [17] solves this problem, reduces the dependence of conventional water source heat pumps on the source side water temperature, and breaks through the geographical limitation of water source heat pump system application [18]. The PCHP is a system that uses low-grade sensible heat and latent heat released by the cold water freezing process as a heat source and converts it into high-grade thermal energy through the heat pump unit. Among them, the heat transfer performance of the CPHE under icing conditions affects the system’s efficiency and energy consumption, and it is of great significance to analyze the influence of various parameters in CPHEs on heat transfer performance for the design and debugging of the whole system [19,20,21].

2. Physical Model

The schematic diagram of the PCHP system is shown in Figure 1. It mainly consists of heat pump unit, the CPHE, a plate heat exchanger, and multiple pumps. The CPHE and cold water source are connected by pipes to form the cold water circulation system. The CPHE and heat pump units are connected by pipes to form the intermediate water cycle. The heat pump units and the heat consumer are connected by pipes to form the end water circulation. In addition, one end of the plate heat exchanger is connected to the intermediate water circulation, and the other end is connected to the end water circulation, controlled by multiple valves to form an intermittent heat cycle.
The operating principle of the PCHP system is as follows. The system operation modes are divided into icing mode, melting and, de-icing mode. First, No. 1 and No. 2 valves are closed, and the end valve and intermediary valve are opened. Icing mode is on under this configuration. The cold water circulation pump extracts the cold water from the water source and delivers it to the shell range of the CPHE. Then, the cold water freezes in the CPHE and releases latent heat to the intermediate water. The intermediate circulation pump transfers the intermediate water, which absorbs the latent heat of the cold water into the heat pump unit. Then, the heat pump unit extracts the low-grade heat from the intermediate water to supply heat to the heat users. When the outlet temperature of the intermediate water reaches a set temperature, No. 1 and No. 2 valves are opened, and the end and intermediate valves are closed; under this configuration, the ice-melting and de-icing mode is turned on. The high-temperature return water at the end is exchanged with the intermediate water through the plate heat exchanger. The intermediate water warms up rapidly, melting the ice layer attached to the wall of the heat exchanger tube in the CPHE and making the ice layer loose. After melting the ice, the mechanical de-icing device inside the CPHE is turned on, and the motor drives the scraper to move up and down to break the ice layer. Finally, the ice and water mixture is discharged from the system. After the de-icing mode ends, the system reverts back to the icing mode.
The CPHE is a new generation of heat extraction equipment based on the traditional shell and tube heat exchanger, which achieves continuous ice making and heat extraction. As shown in Figure 2a, it is mainly composed of a heat exchange tube row and a de-icing device outside of the tube. The cold water flow channel is formed between the heat exchange tube rows, with the cold water flowing in from the bottom of the heat exchanger and then into the cold water channel to exchange heat with the intermediate water (below 0 °C) flowing in the heat exchange tube. The cold water freezes on the tube wall, releasing the latent heat of the phase change. When the ice layer reaches a certain thickness, the motor drives the scraper through the spindle to scrape the ice layer on the tube wall out of the runner and discharge it, completing a cycle of ice making and heat extraction.
The heat exchange tube in the CPHE is a square tube, which facilitates scraper de-icing as multiple square tubes are arranged in the vertical direction against the wall. Due to the numerous heat exchange tube rows, the model is more complex, and, according to the experimental results shows that if multiple heat exchange tube rows (in the icing situation) are similar, there is no significant difference in the effect. Therefore, in order to simplify the calculation, a group of multiple heat exchange tube rows was selected for physical modeling. The structural parameters of a single heat exchange square tube are shown in Figure 2b and Table 1.

3. Mathematical Model

The enthalpy-porosity method is used to describe the freezing process on the cold water side. In this method, instead of showing the phase change interface, the physical quantity of the liquid-phase fraction is used to express the degree of phase change, and in each iteration of the calculation, the liquid-phase fraction is derived from enthalpy conservation. When the liquid phase fraction is 0, the fluid velocity in this area drops to 0, which represents complete freezing and solidification.

3.1. Energy Equation

To simplify the calculation, the following assumptions are made for the energy equation.
(1) Ignoring the energy transfer caused by component diffusion;
(2) Ignoring energy transfer caused by viscous dissipation.
Then the energy equation of the solidification model can be obtained as follows.
t ( ρ q ) + · ( ρ v q ) = · ( k T ) + S
The q   in Formula (1) can be calculated by the following equation:
q = h s + h l  
The h s in Formula (2) can also be expressed specifically as a reference value plus the variable form.
h s = h ref + Δ h
Δ h = T ref T c p d T  
The h l in Formula (2) can be specifically expressed as:
h l = β r    
Combining Formulas (2)–(5) gives the complete expression for H in (1):
= h ref + Δ h + β r

3.2. Momentum Equation

According to the conservation of momentum, there are momentum equations:
( ρ v ) t + · ( ρ v ) = p + μ 2 v + F  
F = ρ g S p  
For the enthalpy-porosity method [22], which treats part of the solidification region in the fluid domain as a porous medium, the porosity and flow velocity are both 0 when the computational unit is completely solidified. The momentum degradation caused by the decrease in porosity in the solidification zone can be expressed as follows:
S p = ( 1 β ) 2 ( β 3 + ε ) A mush v
The complete momentum equation describing the icing process can be obtained by substituting Equations (8) and (9) into (7). Equation (10) is the completed momentum equation expression.
( ρ v ) t + · ( ρ v ) = p + μ 2 v + ρ g ( 1 β ) 2 ( β 3 + ε ) A mush v  

3.3. Mass Equation

The mass equation is shown in Equation (11).
ρ t + · ( ρ v ) = S m  

4. Computational Analysis

4.1. Geometric Models and Computational Grids

The geometric model is shown in Figure 3, which includes the intermediary water flow area, the cold water flow area on the outside of the heat exchanger tube, and the heat exchanger wall. The geometry of the model was constructed by SOLDWORKS (version 2020). Then, the geometric model was imported into ICEM for boundary naming and meshing. In ICEM, the hexahedral mesh is used for the whole model. The locations where the intermediate water intersects with the heat exchange wall and cold water intersects with the heat exchange wall are grid encrypted. The result of dividing the grid is shown in Figure 4.
A grid-independent study was conducted to ensure that the results are not affected by the number and size of the grids. The number of grids gradually grows from 50 W to 400 W, only the min cell size and the max face size were changed, with the other mesh parameters remaining unchanged. In this simulation, a grid number of approximately 3,200,000 was found to be the most suitable. Table 2 shows the relevant details of the grid.

4.2. Simulation Scheme and Boundary Conditions

The PISO algorithm is used to couple and solve the pressure and velocity fields. Second-order discrete methods were used to solve the pressure equation. The second-order windward method was, used to solve the momentum, energy and turbulent kinetic energy equations. First-order discretization is used to solve the turbulent dissipation rate equation. The specific values of the under-relaxation factors used to control the iterative process are shown in Table 3.
The inlets on the cold water side and intermediate water side are set as velocity inlets, keeping the default settings for the specific parameters. The outlets on the cold water side and the intermediate water side are set as pressure outlets. The gauge pressure for the pressure outlet parameter was set to 0, and the other parameters were set to default. The contact surface of each area was set as the interface, and the other walls were set as adiabatic walls.
For the thermophysical properties of the fluids and solids in the computational domain, the following assumptions were made.
1. The density, specific heat capacity, and thermal conductivity of the intermediate water are constant and do not vary with pressure and temperature;
2. The density and specific heat capacity of the cold water are constant and do not vary with pressure and temperature;
3. The thermal conductivity of the cold water changes only after it has completely solidified into ice.
The specific thermal parameters of the fluids and solids are shown in Table 4, and the thermal parameters of the intermediate water are in reference to the 30% aqueous solution of glycerol at 0 °C. In addition, due to the different thermal conductivity of ice and water, the user-defined function (UDF) was used to customize the thermal conductivity of the cold water, written in Python for the following languages:
When the water temperature of the cold water is greater than 273 K, its thermal conductivity is 0.62 W/m·K; when the water temperature is less than 273 K, its thermal conductivity is 2.73 W/m·K. Before the simulation proceeds, the model is globally initialized. The initial temperature is set to the initial water temperature on the cold water side. Other conditions remain as their default setting.

5. Model Error Analysis

The error of the simulation results was analyzed by using the cold water phase-change energy heat pump system test bench [23]. The physical cold water phase-change energy heat pump experimental table system is shown in Figure 5, which is mainly composed of a water source heat pump unit, an ice melting heat exchanger, a cold water phase-change heat exchanger, and a pump delivery system. Table 5 lists the main parameters of the experimental table equipment. The intermediate water circulating between the phase-change heat exchanger and the water source heat pump was a 30% glycerol solution.
Table 6 lists the parameter values under the experimental conditions; the continuous heating experiment was carried out for 40 min under this condition. The outlet temperature of the intermediate water was read and recorded by a digital thermometer for every 1 min step. The same parameters were input into the established mathematical and physical models, and the simulation results were compared with the experimental results. The results are shown in Figure 6.
The analysis shows that the maximum error between the simulation data and experimental data is 21.2%, and the average error is 9.1%; the error of the model is within the allowable range.

6. Results and Analysis

6.1. Ice Layer Growth Law under Active Icing Condition

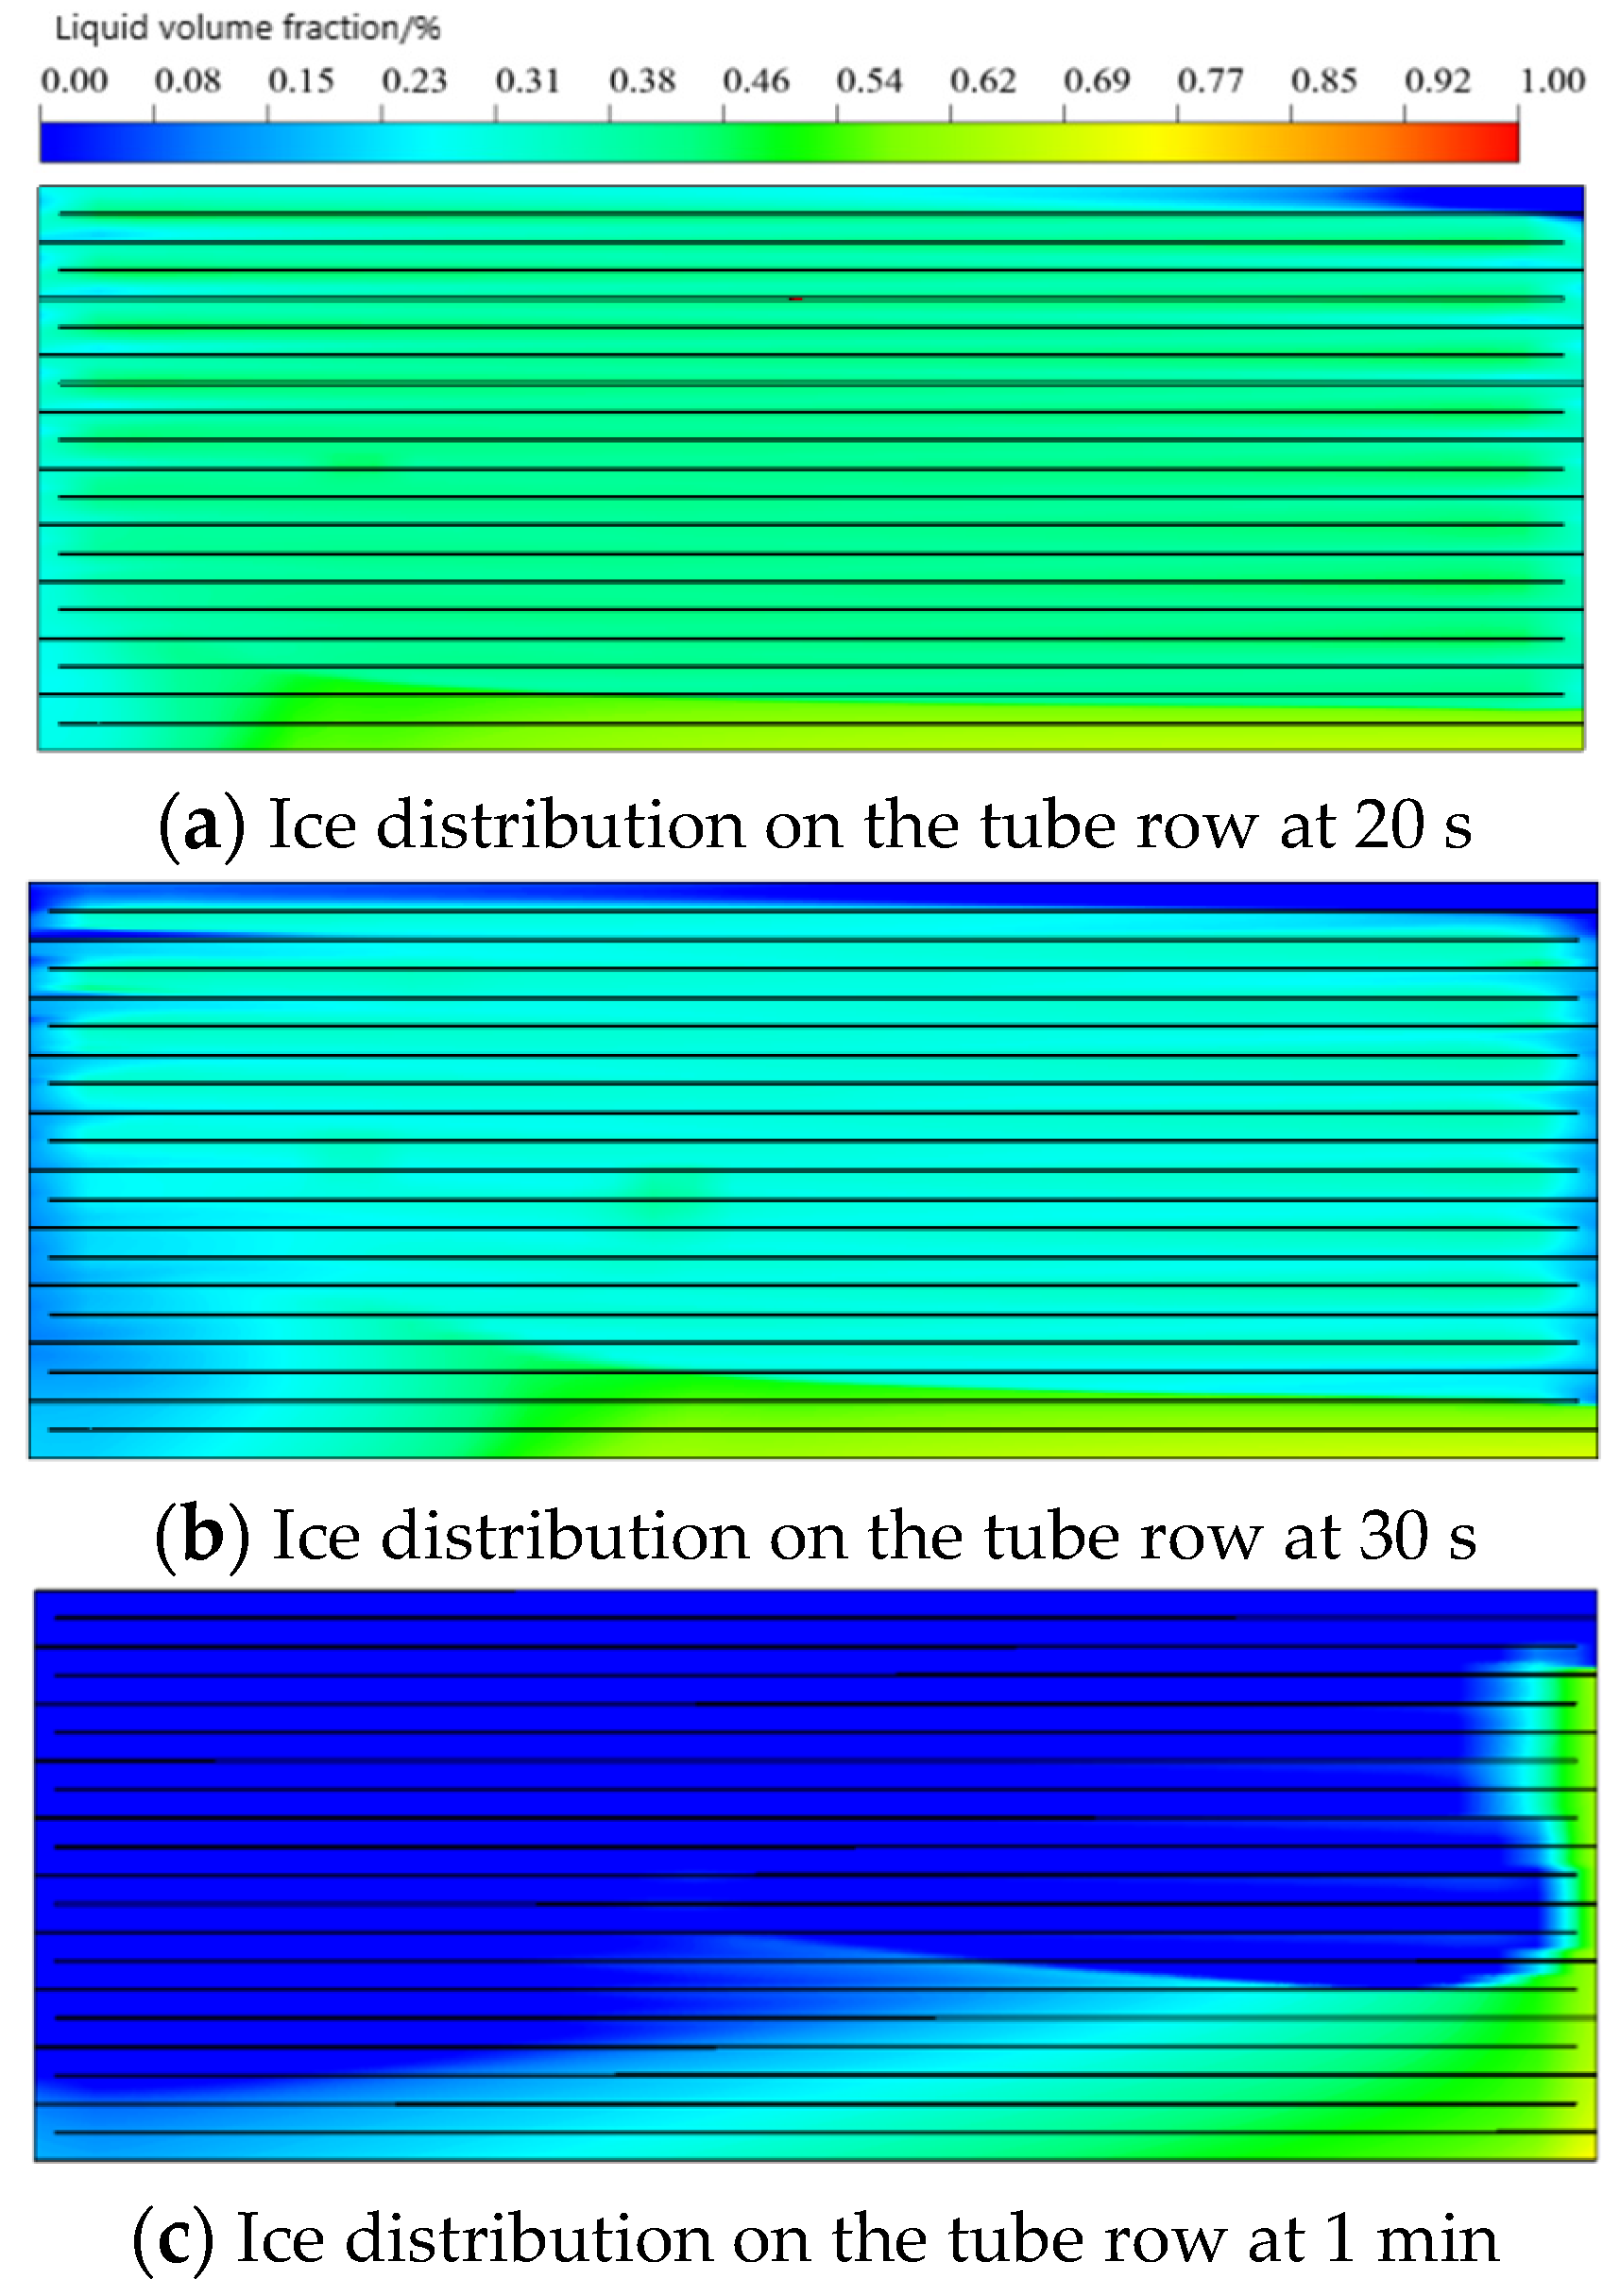
Understanding the ice growth law on the wall of the heat exchange tube row in the cold water phase-change heat exchanger under the active icing condition is of great significance for the design and optimization of the de-icing scraper structure. The heat transfer process for the single-row (heat exchange tube row) was simulated and analyzed under the conditions of −5 °C as the intermediate water inlet temperature, 0.5 m/s as the intermediate water flow rate, 0 °C as the cold water inlet temperature, and 0.1 m/s as the cold water flow rate. The variation of the ice layer distribution on the tube row with time (within 60 s) is shown in Figure 7. The intermediate water enters the heat exchange tube from the entrance above the right side of the heat exchange tube row (shown in the above figure) and flows out from the outlet at the bottom right side after reciprocating the flow in the horizontal direction in the tubing course. In the figure, the different colors represent the liquid-phase fraction of the water, and the blue color represents the liquid-phase volume fraction of 0, that is, the area where cold water completely solidifies into ice.
The analysis shows that the ice layer is first generated at the intermediate water inlet on the wall of the heat exchange tube row, and the ice layer starts to be generated at 20 s. As the heat extraction proceeds, after 20 s–30 s, the cold water on the first row of the heat exchange tube wall (along the direction of the intermediate water flow) gradually generated an ice layer. From 30 s to 1 min, the ice layer grows from the left side of the diagram along the right side and the lower side at the same time. After 1 min, the ice layer is slowly crystallized over the entire heat exchange area.
Figure 8 shows the area of the icing zone on the wall of the heat exchanger tube row and the average growth rate of the ice layer along the wall of the tube row every 30 s. The icing area on the pipe row is the area of the liquid-phase volume fraction (of 0) on the surface where the vertical pipe row wall is located. This result can be directly derived from the simulation results. The average rate of ice growth along the wall of the pipe row can be calculated by the following equation.
v i = S t S t 30 30  
As can be seen from the figure, the fastest growth rate from 30 s to 60 s is 0.79 m2/s on average, and the ice growth rate decreases significantly after 60 s and is only 0.002 m2/s at 180 s. This is because, after about 60 s, the intermediary water in the heat exchanger tube goes completely through the tube so that the outer wall temperature of the heat exchanger tube is almost all below 0 °C. Therefore, at about 60 s, the cold water is heavily iced along the heat exchange tube wall, so the ice growth rate along the heat exchanger tube wall increases dramatically. After 90 s, when almost all the ice covers the heat exchanger tube wall, the ice along the heat exchanger tube wall almost stops growing, and the ice growth rate along the heat exchanger tube wall decreases significantly when the ice started to grow in the direction of the thickening area.

6.2. Heat Transfer Characteristics under Variable Intermediate Water Temperature Conditions

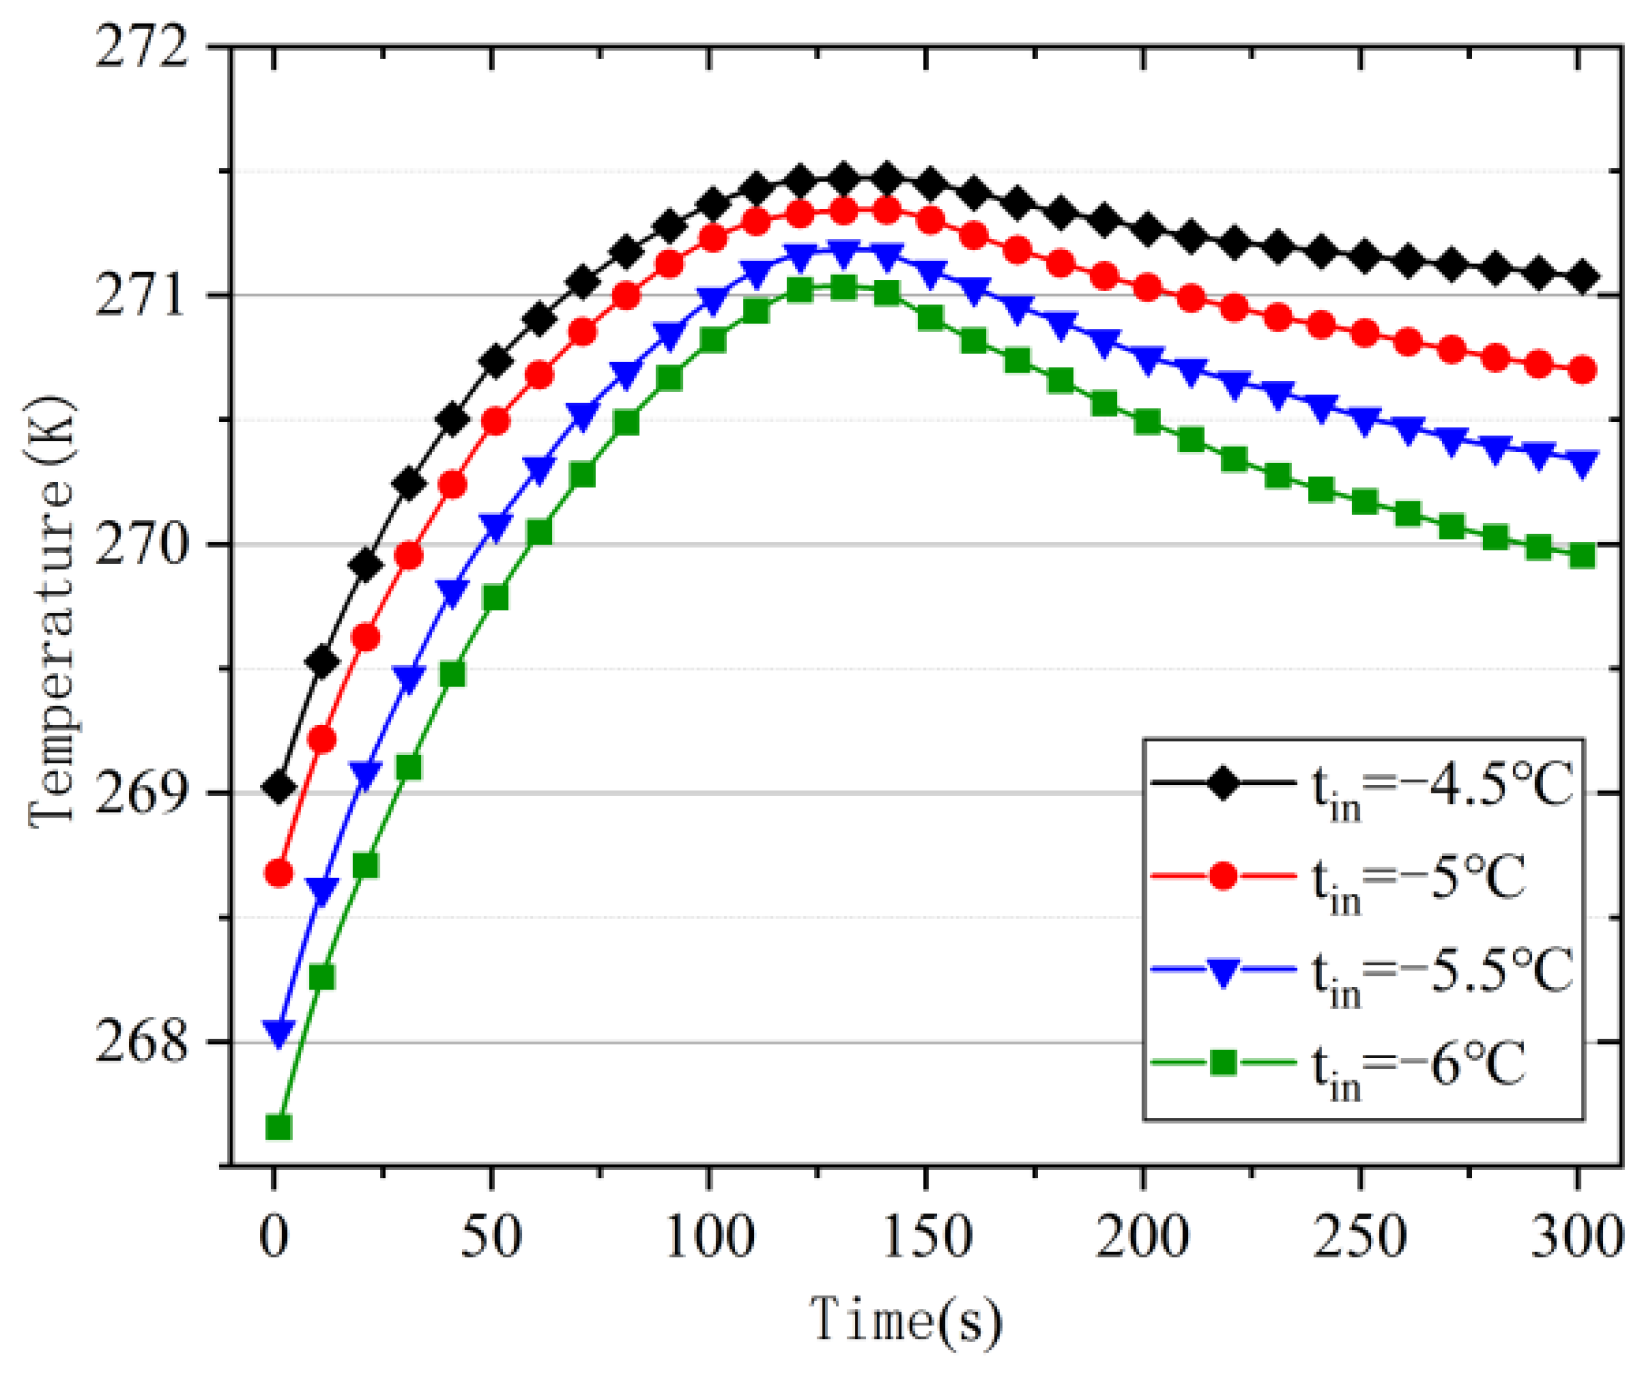
In order to analyze the effect of intermediate water temperature change on the heat transfer characteristics of the CPHE under active icing conditions, the heat transfer process of the single-row heat-exchange-tube row was simulated and analyzed under four operating conditions, with intermediate water inlet temperatures of −4.5, −5, −5.5, and −6 °C, an intermediate water flow rate of 0.5 m/s, a cold water side inlet temperature of 0 °C, and a cold water flow rate of 0.1 m/s. The variation curve of the intermediate side water outlet temperature with time (over 300 s) was obtained, as shown in Figure 9.
From the analysis of Figure 9, it can be seen that, for the variable intermediate water inlet temperature conditions, the intermediate water temperature after 300 s shows the trend of first increasing and then decreasing afterward. At about 120 s, the outlet intermediate water temperature reached the maximum. Then, with the continuous heat extraction of the intermediate water, the cold water outside the heat exchange tube wall froze on the tube wall, and the ice layer gradually thickened so that the heat transfer resistance between the cold water and the intermediate water increased gradually; the heat transfer gradually reduced, and the corresponding intermediate water outlet water temperature gradually reduced. As the intermediate water inlet temperature decreased, the highest intermediate water outlet temperature of each working condition was 271.47, 271.34, 271.18, and 271.03 K, respectively. Then, the corresponding maximum temperature rise for the intermediate water side of each working condition was 2.97, 3.34, 3.68, and 4.03 K, respectively. The decrease in the intermediate water inlet temperature can increase the maximum temperature rise. When the intermediate water inlet temperature decreased by 0.5 °C, the maximum temperature rise of the intermediate water side increased by 11.7% on average.
The process of water temperature drop at the intermediate outlet under various conditions is analyzed below. As can be seen from the figure, the intermediate outlet water temperature of each working condition decreases gradually; this is because of the increase in ice layer thickness, whereby the intermediate water and cold water between the heat transfer temperature difference (between the interface of the cold water and the ice water) decreases gradually. In the same time interval, the heat exchange decreases, that is, the amount of ice decreases. The increased rate of ice thickness slows down, and the increased rate of heat transfer resistance decreases, which leads to a decreased rate of heat exchange over the same time interval, resulting in a lower rate of heat transfer in the same time interval, which, in turn, results in a lower rate of intermediate outlet water temperature, as seen in the figure. As the intermediate inlet water temperature decreases, at 300 s, the outlet intermediate water temperatures corresponding to each working condition were 271.08, 270.7, 270.34, and 269.95 K, respectively. The average decline rates after the intermediate outlet water temperature reached a maximum were 0.0022, 0.0035, 0.0047, and 0.0060 K/s, respectively. The decrease in the intermediate inlet water temperature caused an increase in the average decline rate after the intermediate outlet water temperature reached a maximum. The average decline rate increased by 41.2% per 0.5 °C.
The instantaneous heat transfer coefficient of the cold water phase-change heat exchanger [24] is calculated using Formulas (11)–(14), and the results are shown in Figure 10.
c m m z Δ t m = K A Δ T  
m z = A z v z  
Δ t m = t out t in
Δ T = ( t out t l ) ( t in t l ) ln ( t out t l ) ( t in t l )
From the above analysis, it can be seen that, as the intermediate side inlet water temperature decreased, the average heat transfer coefficients of the CPHE were 0.60, 0.66, 0.71, and 0.75 kW/m2·K for each operating condition. Then, decreasing the intermediate side inlet water temperature can increase the average heat transfer coefficient of the CPHE, but the increase becomes smaller and smaller as the intermediate side inlet water temperature decreases. The average heat transfer coefficient increased by about 50 W/m2·K for each 0.5 K decrease in the intermediate side inlet water temperature. With a decrease in the inlet temperature on the intermediate side, the average decline rate of each condition after the heat transfer coefficient reached a maximum was 0.53, 0.89, 1.14, and 1.43 W/m2·K·s, respectively. It can be seen that reducing the intermediate inlet temperature increases the average decline rate of the heat transfer coefficient. When the intermediate inlet temperature decreases by 0.5 °C, the average decline rate of the heat transfer coefficient increases by about 40.48%. The above analysis shows that reducing the inlet temperature of the intermediate side can effectively improve the instantaneous heat transfer coefficient of the CPHE, but it will greatly improve the decline rate of the heat transfer coefficient.

6.3. Heat Transfer Characteristics under Variable Intermediate Water Velocity Conditions

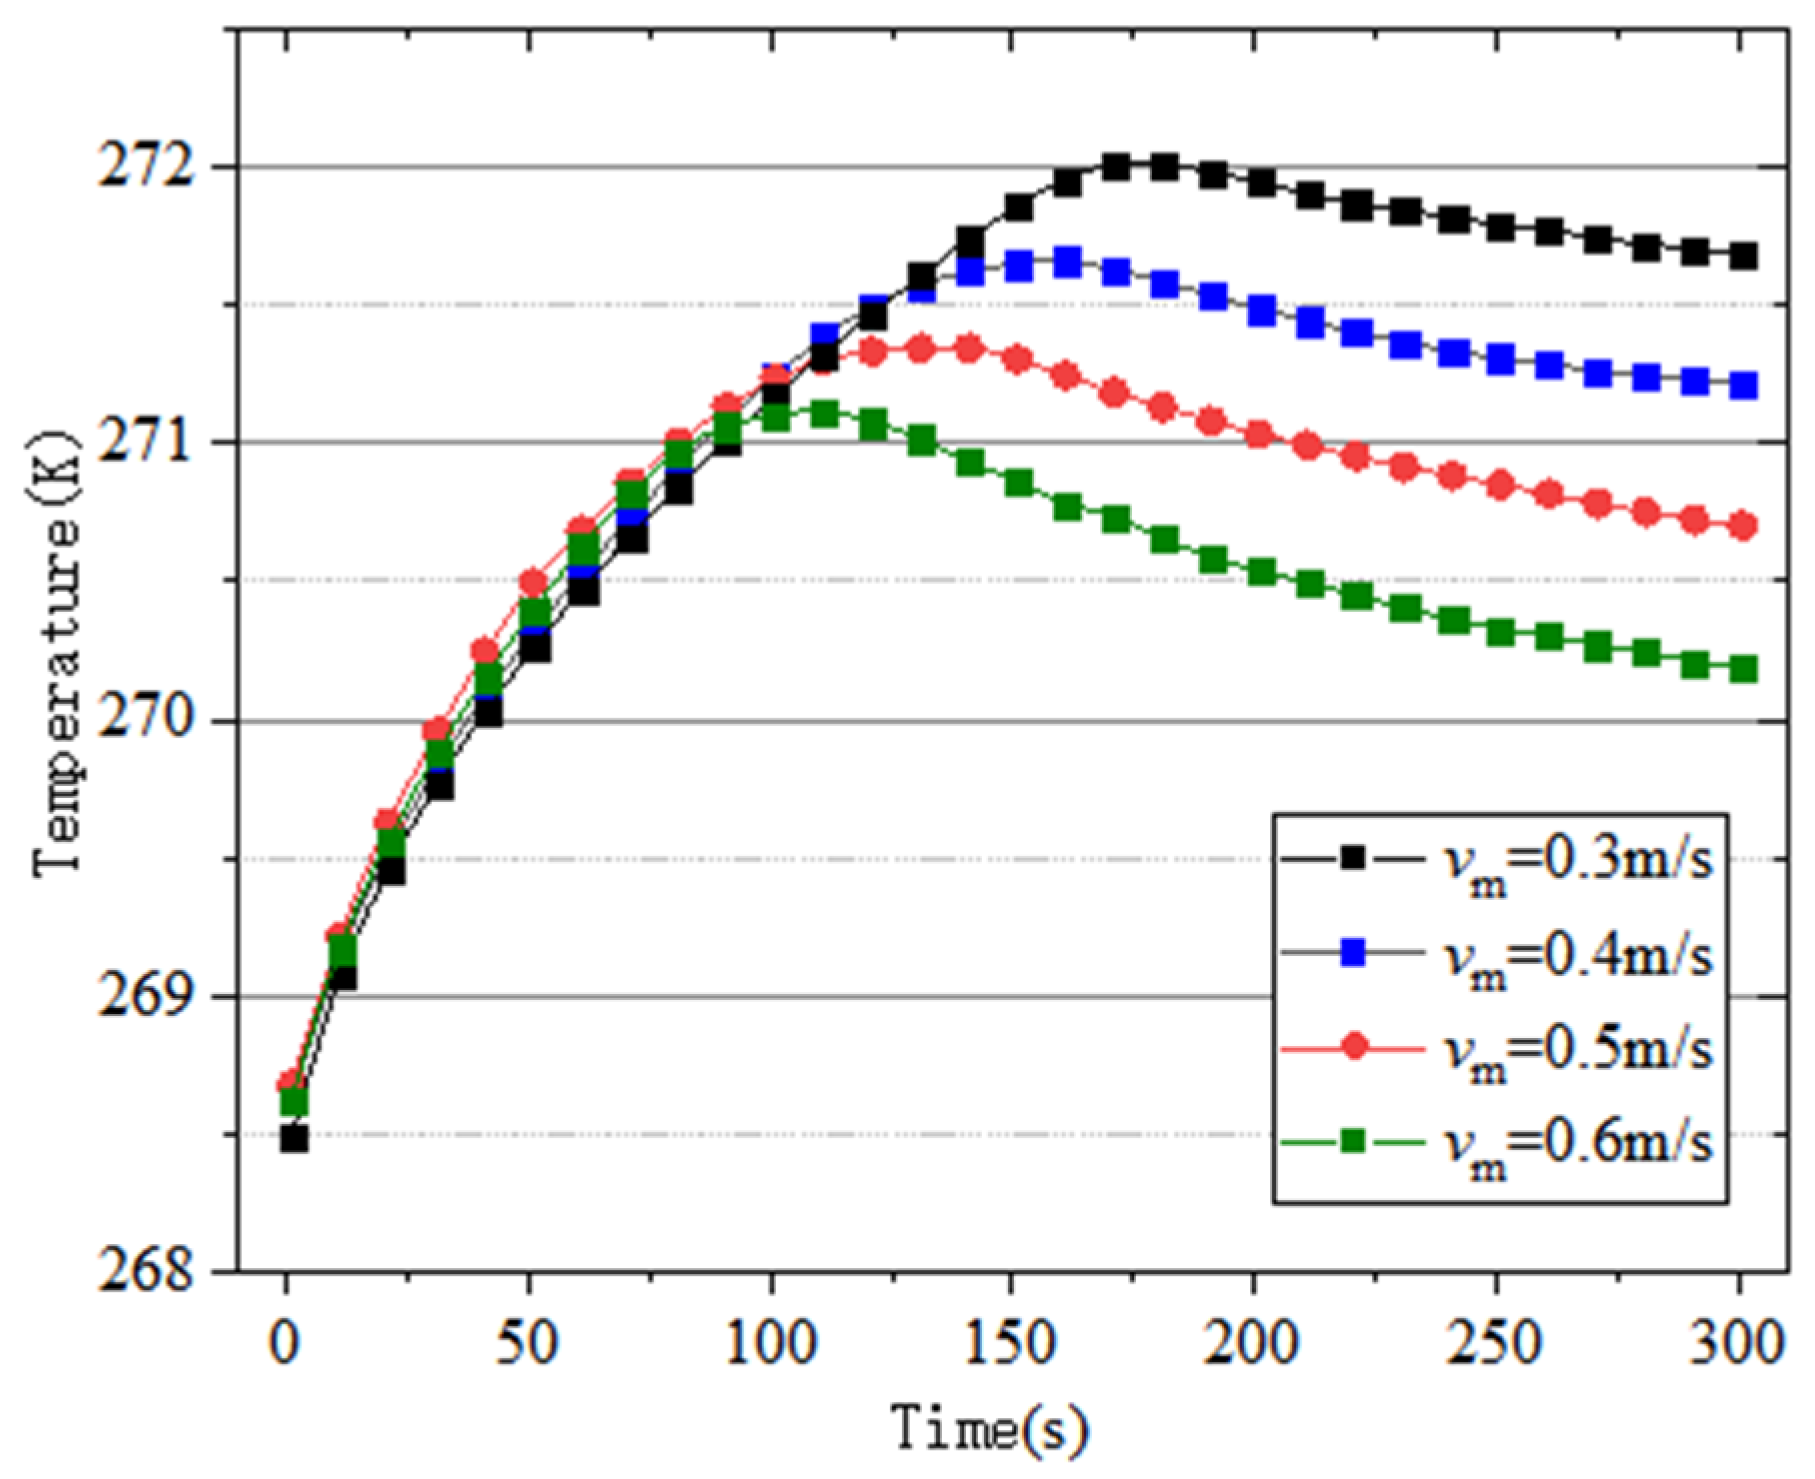
In order to analyze the influence of the intermediate water flow rate in the heat exchanger tube on the heat transfer characteristics of the CPHE (under active icing conditions), the heat transfer process of a single row of heat exchanger tubes was simulated and analyzed under the four conditions of an intermediate side inlet water temperature of −5 °C, the intermediate water flow rates of 0.6, 0.5, 0.4, and 0.3 m/s, a cold water inlet temperature of 0 °C, and a cold water flow rate of 0.1 m/s. The change curve for the outlet temperature of the intermediate water with time (for each condition over 300 s) was obtained, as shown in Figure 11.
From the analysis of Figure 11, it can be seen that, with a decrease in the intermediate water flow rate, the maximum value of the outlet intermediate water temperature (for each working condition) was 272.01, 271.66, and 271.34 K, respectively. When the intermediate water flow rate decreased by 0.1 m/s, the maximum outlet temperature for the intermediate side increased by 0.48 K on average. In addition, with a decrease in the intermediate water flow rate, the time taken for the outlet water temperature (of the intermediate water) to reach the maximum value under each working condition was about 120, 140, 160, and 180 s, respectively. When the intermediate water flow rate decreased by 0.1 m/s, the time taken for the outlet water temperature to reach the maximum value increased by about 20 s. With an increase in intermediate water flow rate, the average decline rate of the outlet water temperature (on the intermediate side) after reaching the maximum was 0.0028, 0.0035, 0.0040, and 0.0051 K/s, respectively. The increase in the intermediate water flow rate increased the decline rate for the outlet water temperature on the intermediate side after reaching the maximum. When the flow rate increased by 0.1 m/s, the average decline rate for the outlet water temperature on the intermediate side increased by 16.3%.
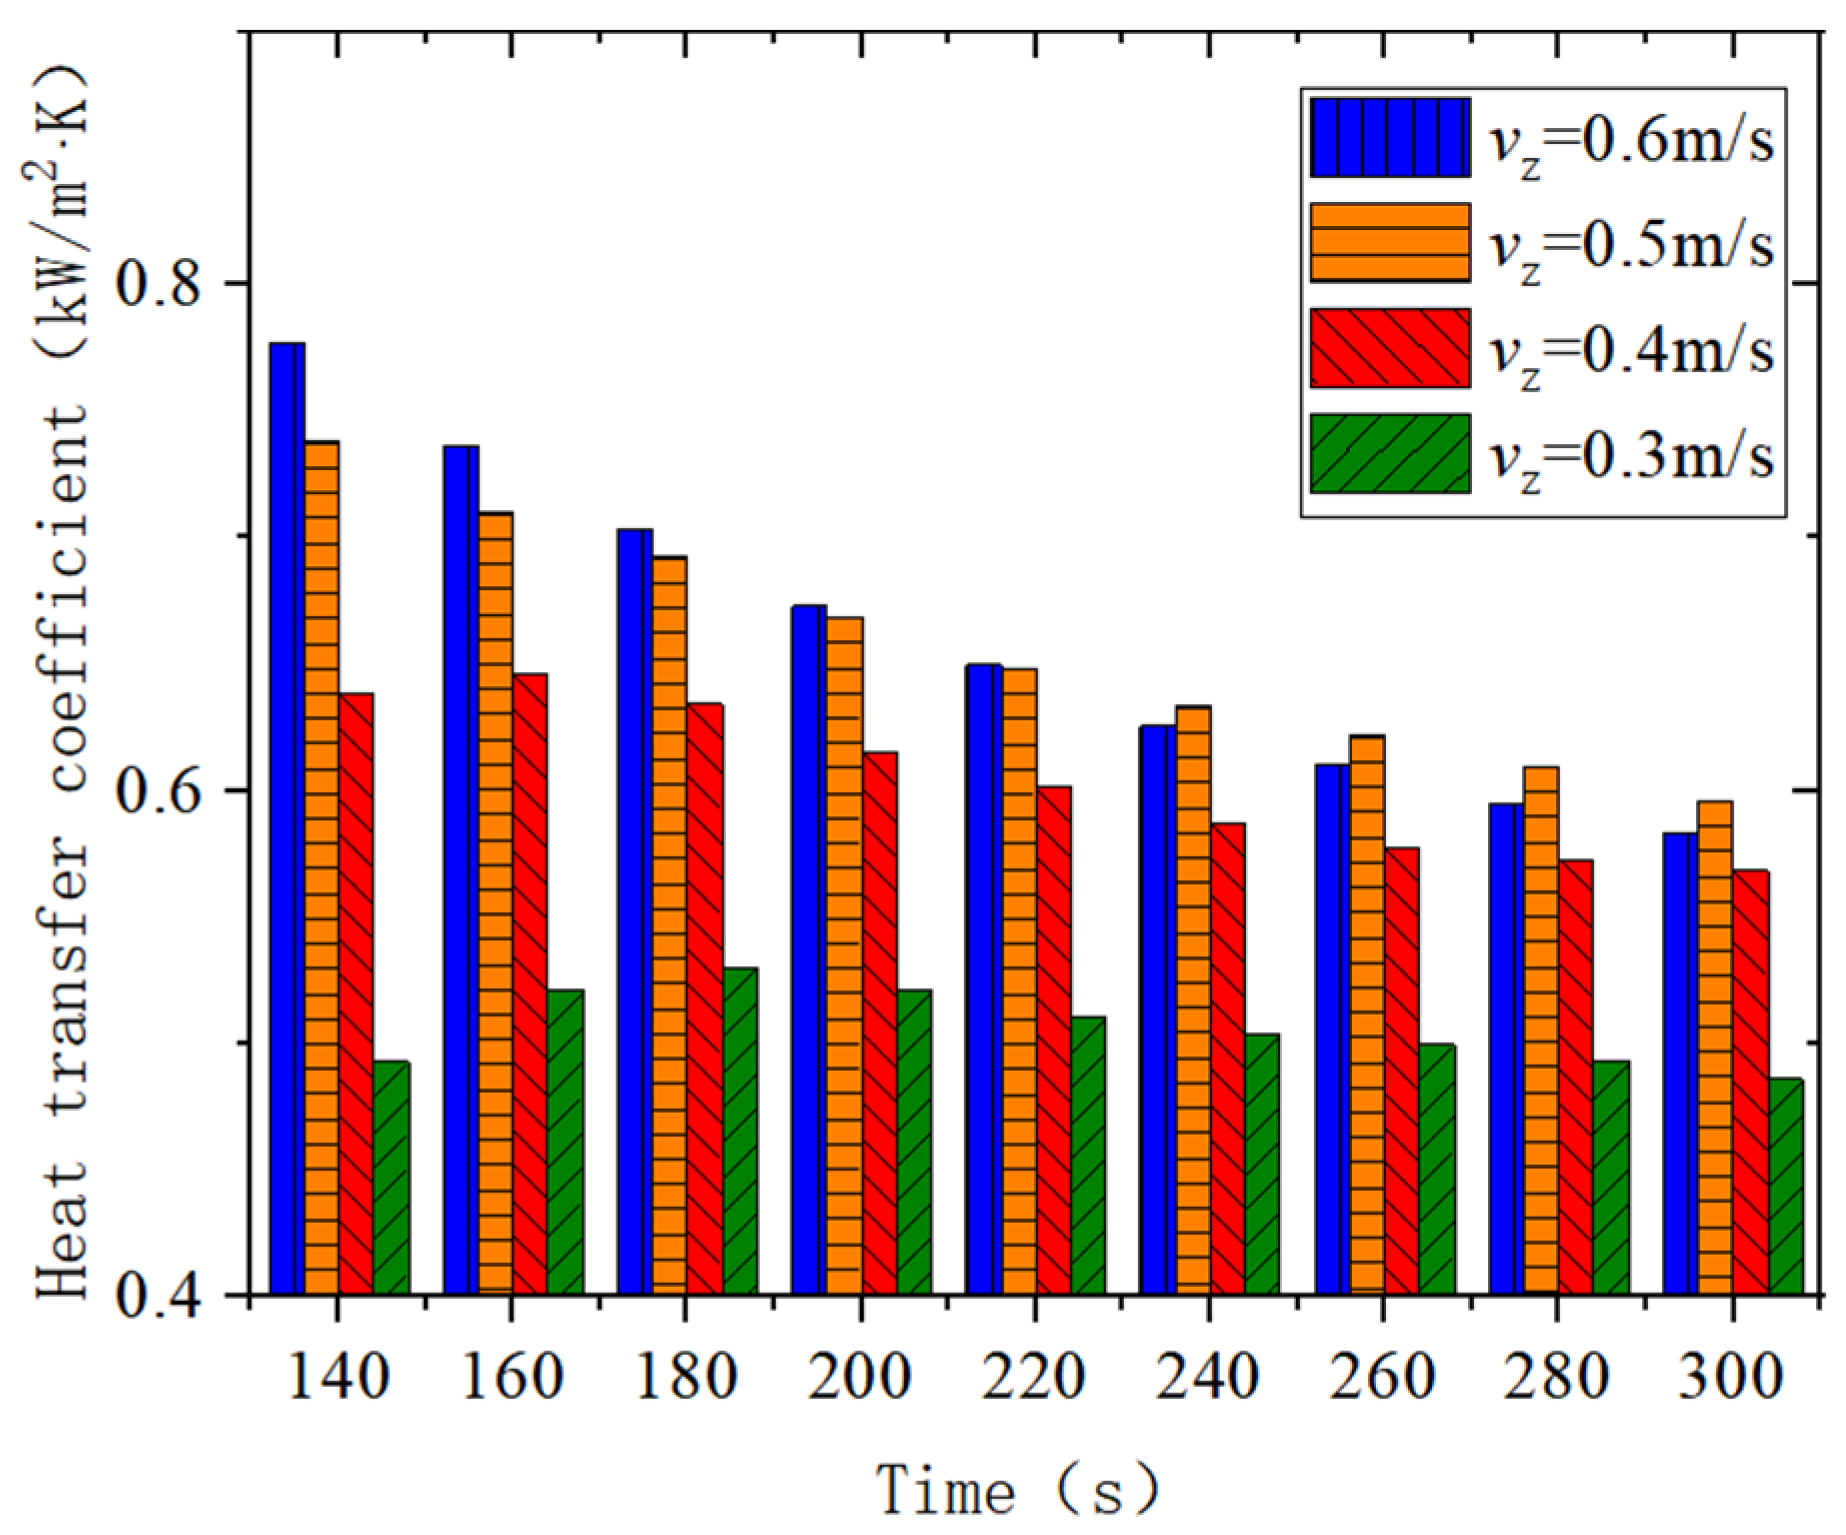
The instantaneous heat transfer coefficient of the CPHE under variable intermediate water flow rate conditions was calculated using Formulas (11)–(14), and the results are shown in Figure 12.
The analysis shows that as the intermediate water flow rate increases, the average heat transfer coefficient of the cold water phase-change heat exchanger (under each operating condition) was 0.51, 0.60, 0.66, and 0.67 kW/m2·K. It can be seen that increasing the flow rate of the intermediate water can increase the average heat transfer coefficient of the CPHE, but the growth rate becomes smaller and smaller. When the flow rate increases from 0.5 m/s to 0.6 m/s, the average heat transfer coefficient only increases by 10 W/m2·K. In addition, with a decrease in the intermediate water flow rate, the instantaneous heat transfer coefficient of the CPHE reaches the maximum at 140, 160, 180, and 200 s, respectively. After reaching the maximum, the heat transfer coefficient begins to decrease. The decline rate of the heat transfer coefficient (under each working condition) with a decrease in the intermediate water flow rate were 1.21, 0.89, 0.55, and 0.37 W/m2·K·s, respectively. It can be seen that the average decline rate for the heat transfer coefficient increased with the increase in the intermediate water flow rate. For every 0.1 m/s increase in the intermediate water flow rate, the average decline rate for the heat transfer coefficient increased by about 35.5%.
From the above analysis, it can be seen that, although the increase in the intermediate water flow rate will cause an increase in the instantaneous heat transfer coefficient, this also increases the average decline rate of the heat transfer coefficient, resulting in a decrease in the average heat transfer coefficient for the CPHE. After the flow rate of the intermediate water side increases to 0.5 m/s, which then increases the flow rate, the effect of the average heat transfer coefficient is very small. Therefore, the maximum flow rate for the intermediate water side should not exceed 0.5 m/s.

6.4. Heat Transfer Characteristics under Variable Cold Water Flow Rate Conditions

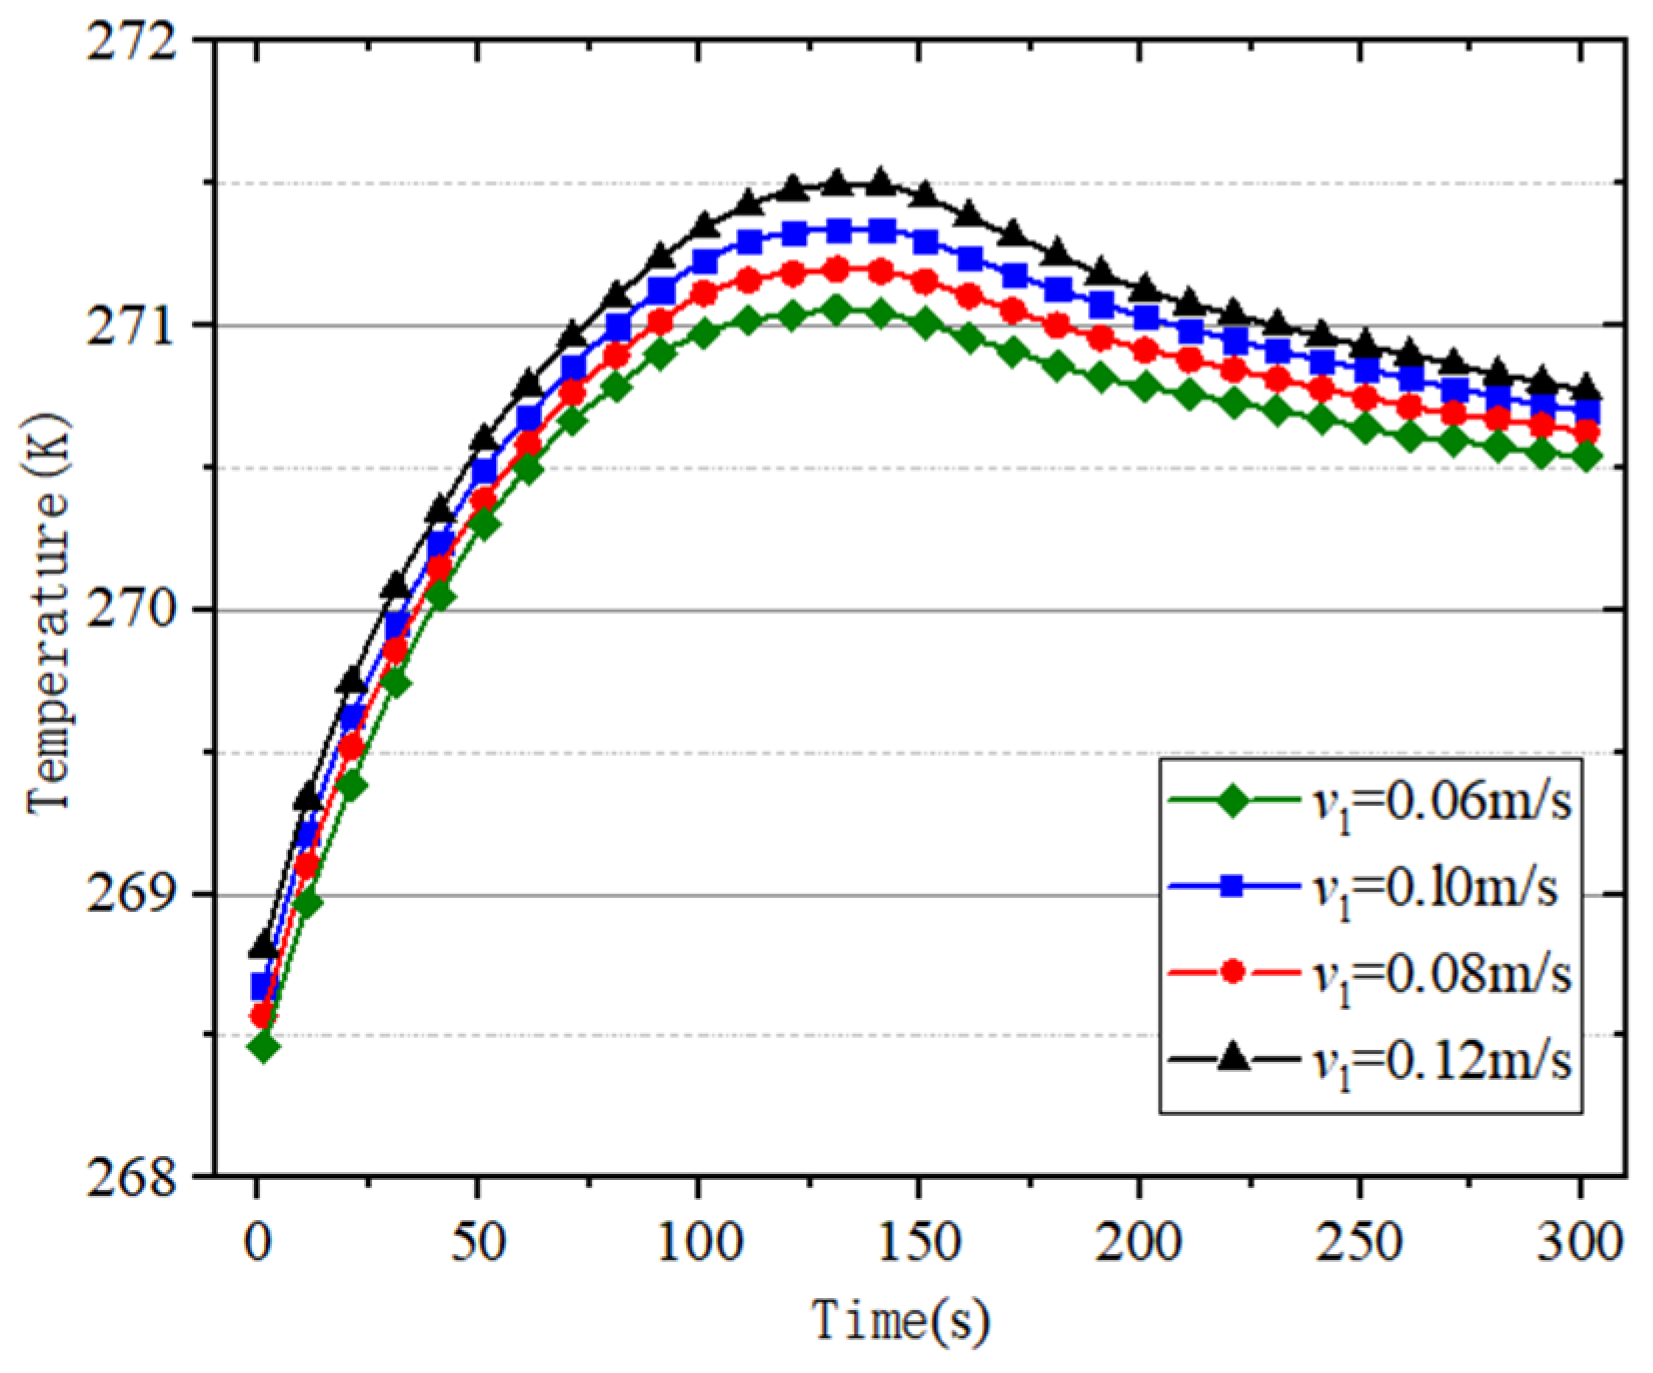
In order to analyze the influence of the cold water side flow rate on the heat transfer characteristics of the CPHE under icing conditions, the heat transfer process of a single heat exchange row was simulated under four conditions, with an intermediate side inlet water temperature of −5 °C, an intermediate water flow rate of 0.5 m/s, a cold water side inlet water temperature of 0 °C, and a cold water side flow rate of 0.06, 0.08, 0.1, and 0.12 m/s, respectively. The variation curves of the intermediate side outlet water temperature with time (for each working condition after 300 s) were obtained, as shown in Figure 13.
The analysis shows that, with an increase in cold water flow rate, the intermediate water side outlet water temperature increases, and the maximum of the intermediate water side outlet water temperature (under each working condition) was 271.04, 271.19, 271.34, and 271.49 K, respectively. Then, for every 0.02 m/s increase in the cold water side flow rate, the maximum intermediate water side outlet water temperature increases by 0.15 K on average. For each working condition, with an increase in the cold water side flow rate, the average decline rate for the intermediate side outlet water temperature after reaching the maximum value was 0.0032, 0.0035, 0.0040, 0.0047 K/s in order; then, increasing the cold water flow rate increased the drop rate after the intermediate side outlet water temperature reached its maximum value, and the higher the cold water flow rate, the greater the increase in the drop rate. The average intermediate water flow rate for each increase of 0.02 m/s, with the average rate of decline for the intermediate side of the outlet water temperature after reaching the maximum value, increased by about 12.03%.
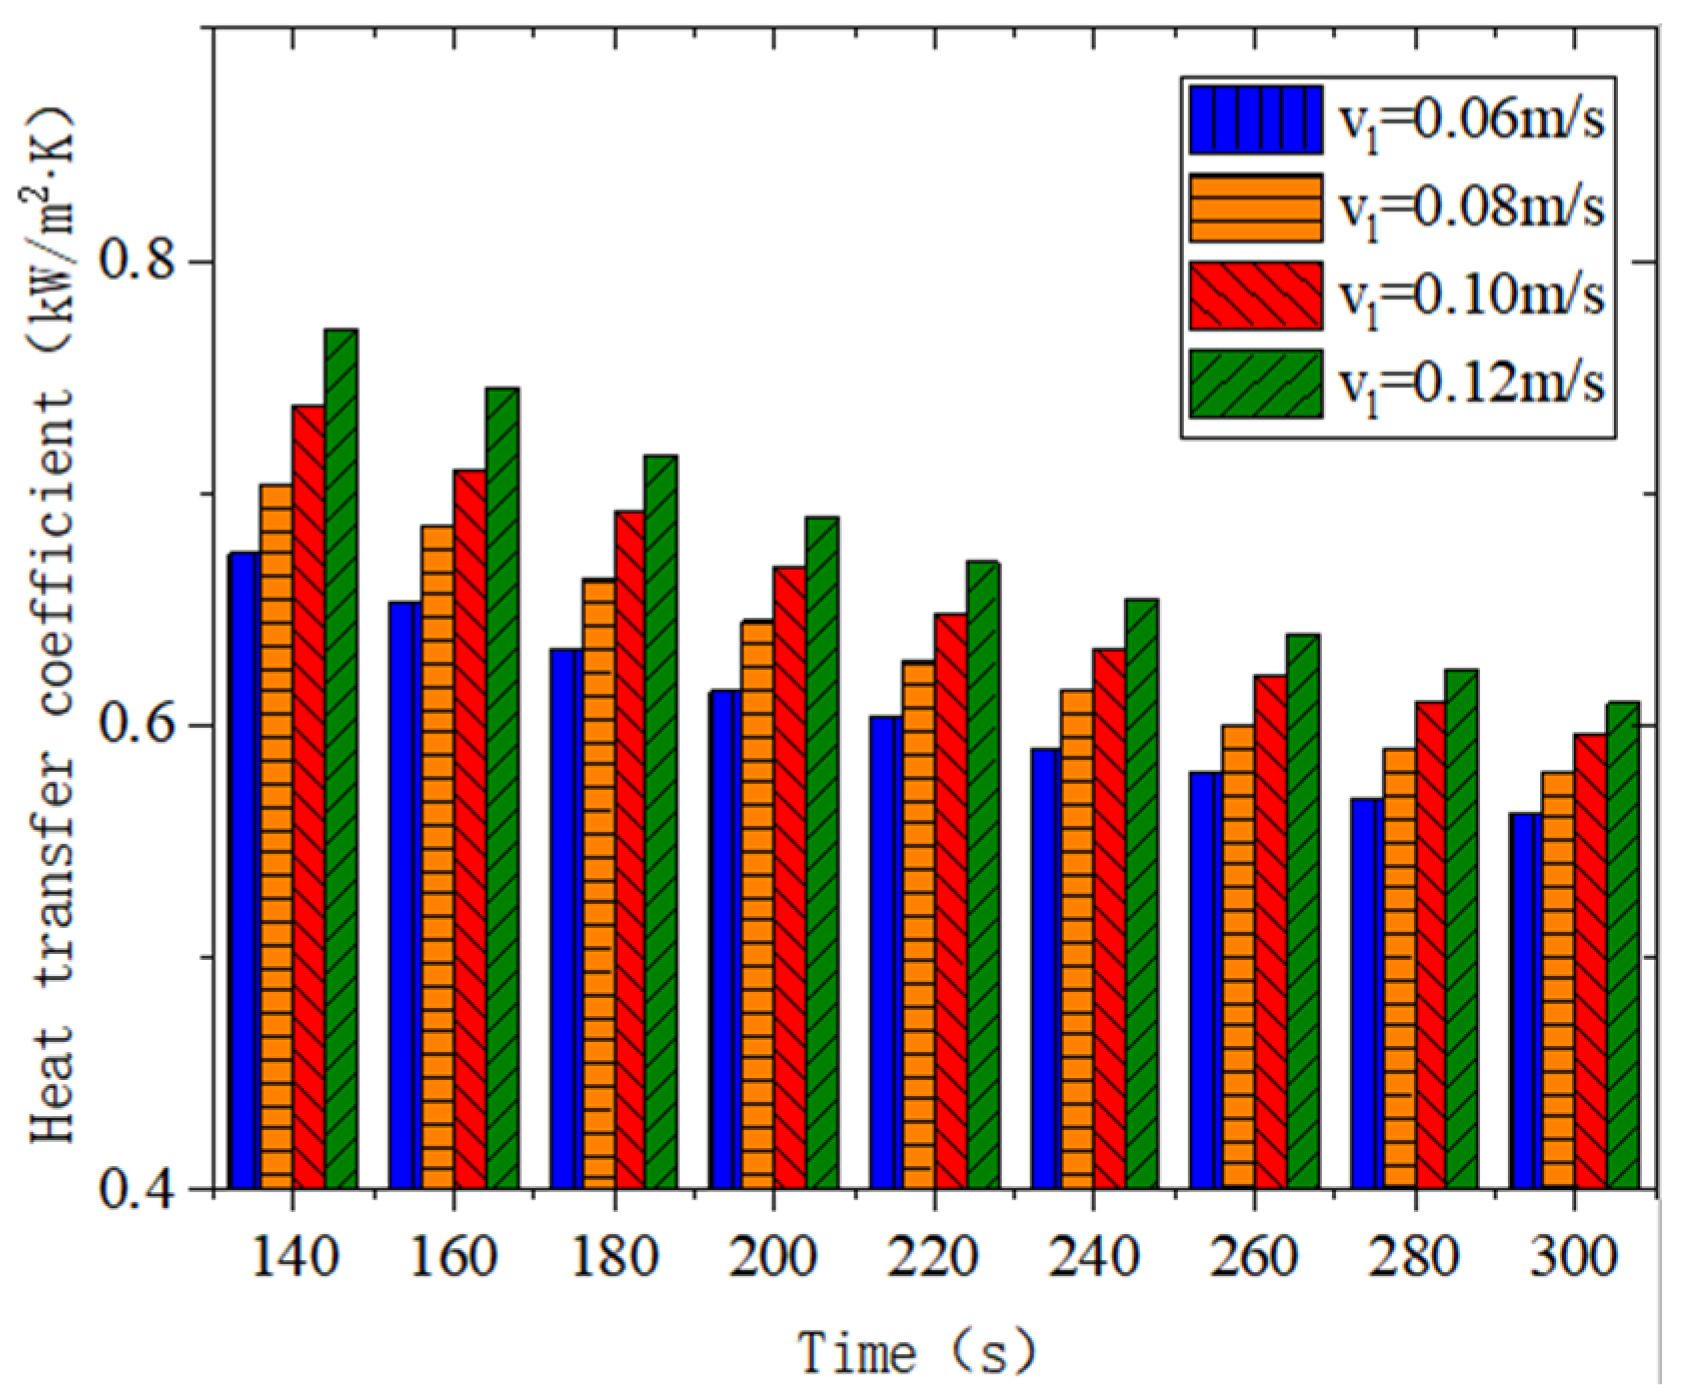
The Formulas (11)–(14) were used to calculate the instantaneous heat transfer coefficient of the CPHE under the conditions of variable cold water flow rates, and the results are shown in Figure 14.
From the analysis of Figure 14, it can be seen that, with the cold water flow rate increases, the average heat transfer coefficient of the CPHE, corresponding to each working condition, was 0.61, 0.63, 0.66, and 0.68 kW/m2·K, respectively. It can be seen that increasing the cold water flow rate can increase the average heat transfer coefficient of the CPHE, and for every 0.02 m/s increase in cold water flow rate, the average heat transfer coefficient increased by 0.02 kW/m2·K. With an increase in the cold water flow rate, the decline rate of the heat transfer coefficient for each working condition was 0.70, 0.77, 0.89, and 1.01 W/m2·K·s, in that order; it can be seen that an increase in cold water flow rate will lead to an increase in the decline rate of the heat transfer coefficient; with an increase of 0.02 m/s, the rate of decrease in the heat transfer coefficient increases about 13.03%.

7. Conclusions

The growth law of an ice layer along the wall of a tube in cold water phase-change heat exchangers, under active icing conditions, was simulated and analyzed, and the influence of inlet temperature, intermediate water flow rate, and cold water flow rate in the heat transfer process within a cold water phase-change heat exchanger was analyzed. The following conclusions were obtained:
(1) The most significant effect on heat transfer performance in the cold water phase-change heat exchanger is the change in the inlet water temperature on the intermediate side. For each 0.5 °C decrease in the inlet water temperature on the intermediate side, the average heat transfer coefficient increases by about 50 W/m2·K, and the decline rate for the heat transfer coefficient increases by about 40.48% after reaching the maximum value;
(2) The influence of intermediate water-flow-rate change on the heat transfer process in cold water phase-change heat exchangers is smaller than that of the inlet water temperature on the intermediate side. The increase in the intermediate water flow rate can improve the average heat transfer coefficient in the cold water phase-change heat exchanger, but the growth rate becomes smaller and smaller. The maximum flow rate for the intermediate water side should not exceed 0.5 m/s;
(3) The change in the cold water flow rate has a small effect on the heat transfer process in cold water phase-change heat exchangers. For every 0.02 m/s increase in the cold water flow rate, the average heat transfer coefficient increases by 20 W/m2·K, and the average decline rate increases by 12.03% after the outlet water temperature of the intermediate side reaches the maximum.

Author Contributions

Conceptualization, R.W.; methodology, C.L.; software, C.L. and H.Z.; validation, R.W., H.Y. and L.X.; formal analysis, C.L.; writing—original draft preparation, C.L.; writing—review and editing, R.W.; funding acquisition, H.Y. and R.W. All authors have read and agreed to the published version of the manuscript.

Funding

This research was funded by the “Demonstration of low-grade energy heating and cooling technology and its application” (19-6-1-79-NSH), a project of Qingdao Municipal People’s Livelihood Science and Technology Program.

Data Availability Statement

The data used to support the findings of this study are available from the corresponding author upon request.

Conflicts of Interest

The authors declare no conflict of interest. The funders had no role in the design of the study; in the collection, analyses, or interpretation of data; in the writing of the manuscript, or in the decision to publish the results.

Nomenclature

Nomenclature Nomenclature
t time (s) g gravitational acceleration (m·s−2)
q total heat release (kJ/kg) S p decayed momentum (N/m3)
v velocity vector (m/s) ε very small value to prevent divergence, Equal to 0.001
k thermal conductivity (W/m·K) A mush solidification zone constant
T Temperature (K) S m mass added to the continuous phase (kg/m2·s)
S other source items v i rate of ice formation on pipe rows (m2/s)
h s apparent heat (kJ/kg) S t area of ice on the pipe row at time t (m2)
h l latent heat (kJ/kg) S t 30 area of ice on the pipe row at time t-30 (m2)
h ref the corresponding enthalpy at the reference temperature (kJ/kg) c m specific heat capacity of intermediate water (J/kg·K)
Δ h enthalpy variable (kJ/kg) m z mass flow rate of intermediate water (kg/s)
T ref reference temperature (K) Δ t m import and export temperature difference of the intermediate water (K)
c p specific heat capacity at constant pressure (kJ/kg·K) K heat transfer coefficient of the CPHE (W/m2·K)
β volume fraction of liquid phase A iheat transfer area of single-row tube (m2)
r latent heat of phase change for complete solidification (kJ/kg) Δ T logarithmic mean temperature difference of CPHE (K)
p pressure (Pa) A z sectional area of single heat exchange tube (m2)
μ dynamic viscosity (Pa·s) v z intermediate water velocity (m/s)
F momentum source term t out   intermediate water outlet temperature (K)
Greek symbols t in intermediate water inlet temperature (K)
ρ density (kg/m3) t l cold water temperature (K)
Acronym
CPHE cold water phase change heat exchanger
p phase-change energy heat pump
EVAP evaporator
COND condenser

References

  1. Gaur, A.S.; Fitiwi, D.Z.; Curtis, J. Heat pumps and our low-carbon future: A comprehensive review. Energy Res. Soc. Sci. 2021, 71, 101764. [Google Scholar] [CrossRef]
  2. Chen, Q.; Wei, W.; Li, N. Techno-economic control strategy optimization for water source heat pump coupled with ice storage district cooling system. Int. J. Refrig. 2022, 138, 148–158. [Google Scholar] [CrossRef]
  3. Xu, X.; Xu, Z.; Li, G. Research and development of photovoltaic air source heat p-ump. J. Sol. Energy 2022, 43, 356–361. (In Chinese) [Google Scholar]
  4. Ma, G.; Sun, Y.; Cong, D.; Wu, Z.; Yang, W. Simulation study on sand erosion and wear of air source heat pump heat exchange. Fluid Mach. 2021, 49, 62–69. (In Chinese) [Google Scholar]
  5. Li, H.; Cai, Y. Experimental study on closed cooling tower ground source heat pump system in summer. Fluid Mach. 2019, 47, 81–88. (In Chinese) [Google Scholar]
  6. Liu, J.; Wan, P.; Guo, J.; Zhou, E.; Guo, W. Optimization of solar ground source heat pump combined heating system. Therm. Sci. Technol. 2019, 18, 155–162. (In Chinese) [Google Scholar]
  7. Yan, B.; Sun, J.; Wang, X.; Li, X.; Sun, F.; Fu, D. Suitability zoning of groundwater source heat pump in Shijiazhuang based on gis-fahp. J. Jilin Univ. (Earth Sci.) 2021, 51, 1172–1181. [Google Scholar]
  8. Yuanyuan, S. Research and Application of Lake Water Source Heat Pump System in Cold Area. Master’s Thesis, Qingdao University, Qingdao, China, 2016. [Google Scholar]
  9. Fu, Y.; Pan, L.; Liu, Y.; Liang, Y. Research on energy saving control method of sewage source heat pump system. Therm. Power Engi-Neering 2020, 35, 80–88. (In Chinese) [Google Scholar]
  10. Xinrui, Z. Research on a New Absorption Refrigeration and Heat Pump System for Efficient Recovery of Industrial Waste Heat. Master’s Thesis, Shanghai Jiaotong University, Shanghai, China, 2019. [Google Scholar]
  11. An, M.; Zhao, X.; Xu, Z.; Wang, R. Coupled compression absorption high temperature heat pump cycle for industrial waste heat recovery. J. Shanghai Jiaotong Univ. 2021, 55, 434–443. [Google Scholar]
  12. Wu, S.; Yunzhun, F.; Lijie, C. Experimental study on refrigeration performance of closed river water source heat pump system. Fluid Mach. 2018, 46, 63–67 + 28. (In Chinese) [Google Scholar]
  13. Zhang, Y.; Jiaqi, Y.; Gang, W. Influence of multi-source uncertainty on the performance of surface water source heat pump system. HVAC 2022, 52, 138–143. (In Chinese) [Google Scholar]
  14. Yidong, Q. Performance Analysis and Operation Strategy Optimization of Energy Storage Surface Water Source Heat Pump System. Master’s Thesis, Zhejiang University, Hangzhou, China, 2020. [Google Scholar]
  15. Wang, W.; Lianghong, W.; Zhenzu, L.; Li, J.; Jia, R.; Hongqiang, Z. Optimal scheduling of surface water source heat pump units based on neighborhood adaptive particle swarm optimization algorithm. Syst. Sci. Math. 2021, 41, 1520–1532. (In Chinese) [Google Scholar]
  16. Chengliang, X.; Yanjie, L.; Zhang, J.; Sun, C.; Huanxin, C.; Jiangyu, W.; Huang, Y. Study on operation strategy optimization of a groundwater source heat pump system. J. Refrig. 2018, 39, 72–76. (In Chinese) [Google Scholar]
  17. Ronghua, W.; Zonghui, Z.; Xu, L.; Li, K.; Yuanyuan, S.; Yu, H.; Shirui, T.; Yinghui, Z.; Dexing, S.; Yusheng, X.; et al. A Cold Water Phase Change Energy Heat Extraction Device and Its System. C.N. Patent 108036549a, 15 May 2018. [Google Scholar]
  18. Wenfang, C. Study on the Characteristics of Water Source Heat Pump Air Conditioning at Low Temperature. Master’s Thesis, Tianjin University of Science and Technology, Tianjin, China, 2013. [Google Scholar]
  19. Vakiloroaya, V.; Samali, B.; Fakhar, A.; Pishghadam, K. A review of different strategies for HVAC energy saving. Energy Convers. Manag. 2014, 77, 738–754. [Google Scholar] [CrossRef]
  20. Vasiliev, A.N.; Ershova, I.G.; Belov, A.A.; Timofeev, V.N.; Uhanova, V.Y.; Sokolov, A.V.; Smirnov, A.A. Energy-saving system development based on heat pump. Amazon. Investig. 2018, 7, 219–227. [Google Scholar]
  21. Chua, K.J.; Chou, S.K.; Yang, W.M. Advances in heat pump systems: A review. Appl. Energy 2010, 87, 3611–3624. [Google Scholar] [CrossRef]
  22. Niezgoda-Żelasko, B. The enthalpy-porosity method applied to the modelling of the ice slurry melting process during tube flow. Procedia Eng. 2016, 157, 114–121. [Google Scholar] [CrossRef] [Green Version]
  23. Sánta, R.; Garbai, L.; Fürstner, I. Optimization of heat pump system. Energy 2015, 89, 45–54. [Google Scholar] [CrossRef]
  24. Nenkaew, P.; Tangthien, C. A study of Transient Performance of a Cascade Heat Pump System. Energy Procedia 2015, 79, 131–136. [Google Scholar] [CrossRef]
Figure 1. PCHP system schematic diagram.
Energies 15 07392 g001
Figure 2. Structural parameters of cold water phase-change heat exchanger and heat exchange square tube.
Energies 15 07392 g002
Figure 3. The geometric model.
Energies 15 07392 g003
Figure 4. Results of dividing the grid.
Energies 15 07392 g004
Figure 5. PCHP (Phase-change heat pump) system experimental table.
Energies 15 07392 g005
Figure 6. Comparison between simulation data and experimental data.
Energies 15 07392 g006
Figure 7. Change in ice layering on the tube row within 1 min under the working condition.
Energies 15 07392 g007
Figure 8. Ice area and growth rate on the tube row.
Energies 15 07392 g008
Figure 9. Outlet intermediate water temperature under variable intermediate water temperature conditions.
Energies 15 07392 g009
Figure 10. Heat transfer coefficient of heat exchange under variable intermediate water temperature conditions.
Energies 15 07392 g010
Figure 11. Intermediate flow velocity at the outlet under variable water temperatures.
Energies 15 07392 g011
Figure 12. Heat transfer coefficient for heat exchange under variable flow rates.
Energies 15 07392 g012
Figure 13. Outlet temperature of intermediate water under variable cold water flow rates.
Energies 15 07392 g013
Figure 14. Heat transfer coefficient for heat exchange under variable cold water flow rates.
Energies 15 07392 g014
Table 1. Structural parameters of heat exchange square tube.
ParametersabcdH
Value/(mm)20.55616.5523000
Table 2. Properties of the generated mesh.
ParametersValue
    Sizing
        TransitionSlow
        Span angle centerFine
        Curvature normal angle90°
        Min cell size [m3]2.1 × 10⁻⁹
        Max face size [m2]1.6 × 10⁻⁴
        Growth rate 1.2
    Quality
        SmoothingMedium
    Statistics
        Elements3,200,000
Table 3. Value setting of the Under-Relaxation Factors.
Under-Relaxation FactorsNumerical Value
Pressure0.3
Density1
Body Forces1
Momentum0.5
Turbulent Kinetic Energy0.8
Specific Dissipation Rate0.8
Turbulent Viscosity1
Liquid Fraction Update0.5
Energy1
Table 4. Thermophysical properties of the materials in the model.
MaterialsDensity
[kg/m3]
Specific Heat Capacity
[J/kg·K]
Thermal Conductivity
[W/m·K]
Latent Heat
[J/kg]
Solidification Temperature
[K]
Solid
    Steel803046048//
Fluid
    Intermediate water107936780.48315,325256
    Cold water9984182User-Defined Function (UDF)333,193273
Table 5. Parameter table of experimental equipment used for the phase-change energy heat pump system.
Equipment NameRelated Parameters
Water source heat pump unitRated heating capacity: 326 kW
Rated heating power: 87 kW
Source side rated flow: 68 m3/h
End side rated flow: 83 m3/h
Source side rated inlet and outlet water temperature: −1 °C/−4 °C
End side rated inlet and outlet water temperature: 45 °C/50 °C
Cold water phase change machineHeat transfer rate: 300 kW
Rated inlet and outlet water temperature of primary side: 2 °C/0 °C
Secondary side rated inlet and outlet water temperature: −5 °C/−1 °C
Intermediate circulation pumpRated power: 7.5 kW
Flow rate: 107 m3/h
Head: 12 m
Cold water circulation pumpRated power: 4 kW
Flow rate: 96 m3/h
Head: 10 m
Table 6. Parameters under experimental conditions.
ParametersValue/Unit
Intermediate water inlet temperature−5 °C
Intermediate water flow rate0.5 m/s
Cold water inlet temperature2 °C
Cold water flow rate0.1 m/s
Publisher’s Note: MDPI stays neutral with regard to jurisdictional claims in published maps and institutional affiliations.