1. Introduction
The insulation state of gas-insulated switchgear (GIS) is closely related to the security of the power grid, and partial discharge (PD) is one of the critical indicators reflecting the internal insulation state of GIS [
1,
2]. The damage degree of insulation caused by different types of PD is quite different, so it is necessary to identify the PD signal in GIS to ensure GIS’s safe and stable operation [
3,
4,
5]. The feature extraction of PD is the key to affecting the recognition effect [
6,
7]. Currently, PD diagnosis methods mostly rely on statistics of characteristic parameters (e.g., phase, amplitude, and capacity of the discharge signal), and ignore the characteristic information of the discharge pulse itself. Therefore, the requirements for the statistical quantity of PD signal are relatively high, and discharge data of multiple power frequency cycles need to be counted [
8]. The PD pulse itself carries rich feature information, and the features of different defects are different. Effective use of these features is of great significance to PD detection.
In recent years, scholars have conducted a lot of research on the feature extraction of PD pulse. In [
9], PD time-domain waveform images were collected and converted into one-dimensional for pattern recognition. In [
10], a feature extraction method combining wavelet packet analysis and singular value decomposition was adopted to extract features from frequency information. However, the pulse of PD is transient and unstable. Discharge occurs instantaneously, and the time and number of discharge pulses are random. The time-varying information of PD signal is difficult to be represented by simple time-domain or frequency-domain analysis, and the performace of time-frequency joint analysis method is better than the conventional single domain analysis in diagnosing discharge characteristics [
11]. As a time-frequency analysis method, wavelet transform can extract features from both time and frequency. By using its aspects of multi-resolution analysis, wavelet transform can characterize the local features of signals and provide more feature information for pattern recognition [
12].
With the rapid development of deep learning, the convolutional neural network (CNN) has achieved good results in PD pattern recognition due to its powerful feature extraction ability. Compared with artificial neural networks and support vector machine, the training parameters are greatly reduced, and the recognition accuracy is improved [
13,
14,
15,
16,
17]. In [
18], a light-scale CNN was used to identify the simulated GIS PD data, which solved the problem of insufficient feature utilization. In [
19], CNN and long and short-term memory networks were combined to improve the recognition accuracy by fusing the temporal and spatial features of PD signals. Considering the effect of CNN on PD recognition, this paper selects CNN to extract the features of the PD pulse. However, when the one-dimensional signal or the processed two-dimensional time-frequency diagram is used as the input alone, the local features of the PD pulse are seriously lost. A PD pattern recognition method based on dual-channel CNN is proposed to solve this problem, which fully utilizes the advantages of 1-D CNN and 2-D CNN.
This paper proposes an improved feature fusion convolutional neural network (IFCNN) model for PD pattern recognition. The time-domain features of the PD pulse are characterized by the feature sequence composed of discrete data points. The signal is subjected to wavelet transform, and the corresponding wavelet time-frequency diagram supplements the local features of the discharge transient signal. The CNN model with two parallel channels is used to extract the features of the time-domain feature sequence and wavelet time-frequency diagram. The local features of the discharge pulse in the time domain and frequency domain are mined through feature fusion. The dual-channel model is improved to avoid the loss of features in the training process. Specifically, a one-dimensional CNN is used to process the PD time-domain feature sequence, and a 1 × 1 convolutional layer is added after the convolutional layer to increase the nonlinearity of the one-dimensional model. A two-dimensional CNN is used to extract the features of the wavelet time-frequency diagram, and the shallow features are reduced in dimension and fused with the deep features. The improved dual-channel CNN model can automatically extract the time-frequency features of PD pulses in different dimensions. The main contributions of this paper are as follows:
- (1)
An IFCNN model is proposed for PD pattern recognition by extracting the features of PD pulses, which avoids counting a large number of discharge characteristic parameters. The improved model combines the advantages of 1-D CNN and 2-D CNN. It can automatically extract and fuse the features of the time-domain feature sequence and wavelet time-frequency diagram and obtain more feature information.
- (2)
The PD pulse signal is collected by experiment. At the same time, the mathematical model is used to simulate the PD source to obtain data to ensure the randomness of the signal and reflect the characteristics of the discharge pulse, avoiding the collection of a large amount of experimental data. The improved model is used to extract features automatically for training. The lightweight structure of the model makes it possible to apply in the field environment conveniently.
- (3)
The feasibility of the model is verified by experiments and compared with 1-D CNN and 2-D CNN of the same specification. The results show that the improved model has higher recognition accuracy by fusing the time-frequency features of different dimensions.
2. Proposed Method
2.1. Convolutional Neural Network
CNN is a feedforward neural network that can directly input the original image and avoid complex processing of the original signal. In recent years, it has been widely used in the field of pattern recognition [
20,
21,
22]. CNN can extract the features of input data layer by layer and get the essential abstract representation of features.
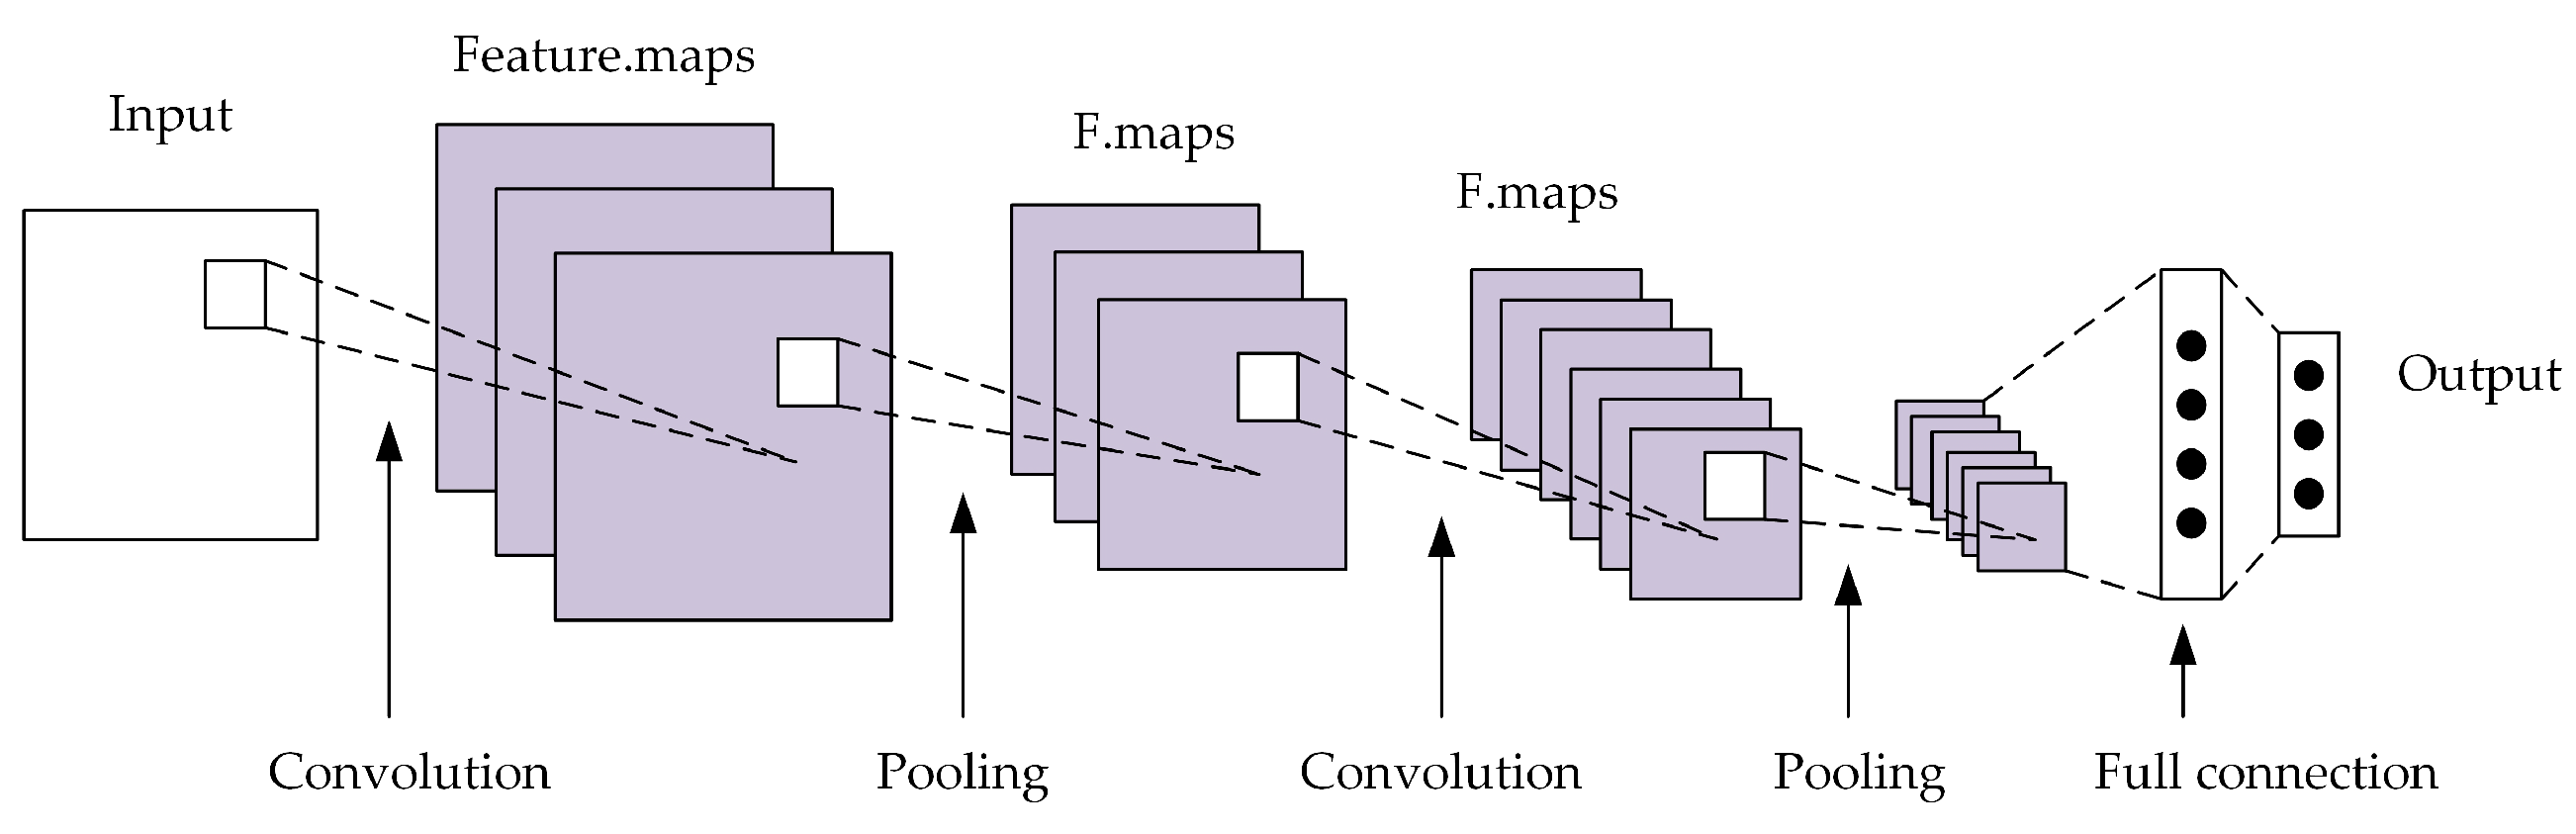
Figure 1 shows typical convolutional neural networks usually include an input layer, convolution layer, pooling layer, fully connected layer, and output layer. The convolution layer uses multiple convolution kernels to perform convolution calculations on the input data, extracts the corresponding data features, and then connects to the next layer through bias calculation and activation function. A mathematical formula can express the process:
where
represents the output feature map of the
ith layer,
represents the input feature map of the
ith layer,
is the weight matrix of the
ith convolution kernel,
is the offset vector of the
ith layer, and
is the activation function. The main activation functions are
,
, and
.
The pooling layer is generally divided into maximum pooling, mean pooling, and random pooling, which are used to reduce the output parameters of the convolution layer. The fully connected layer connects the features of the previous layer, and extracts and reduces the dimension of the features again. Finally, the output layer calculates the one-dimensional output sequence and obtains the probability value of each class to which the classification target belongs.
2.2. Improved Feature Fusion Convolutional Neural Network
In this paper, the IFCNN is used to extract the features of PD pulse to realize PD pattern recognition. The PD pulse waveform is a curve that changes the discharge intensity with time. The 1-D CNN can better express one-dimensional information of the PD pulse voltage, which is suitable for feature extraction of the time-domain waveform [
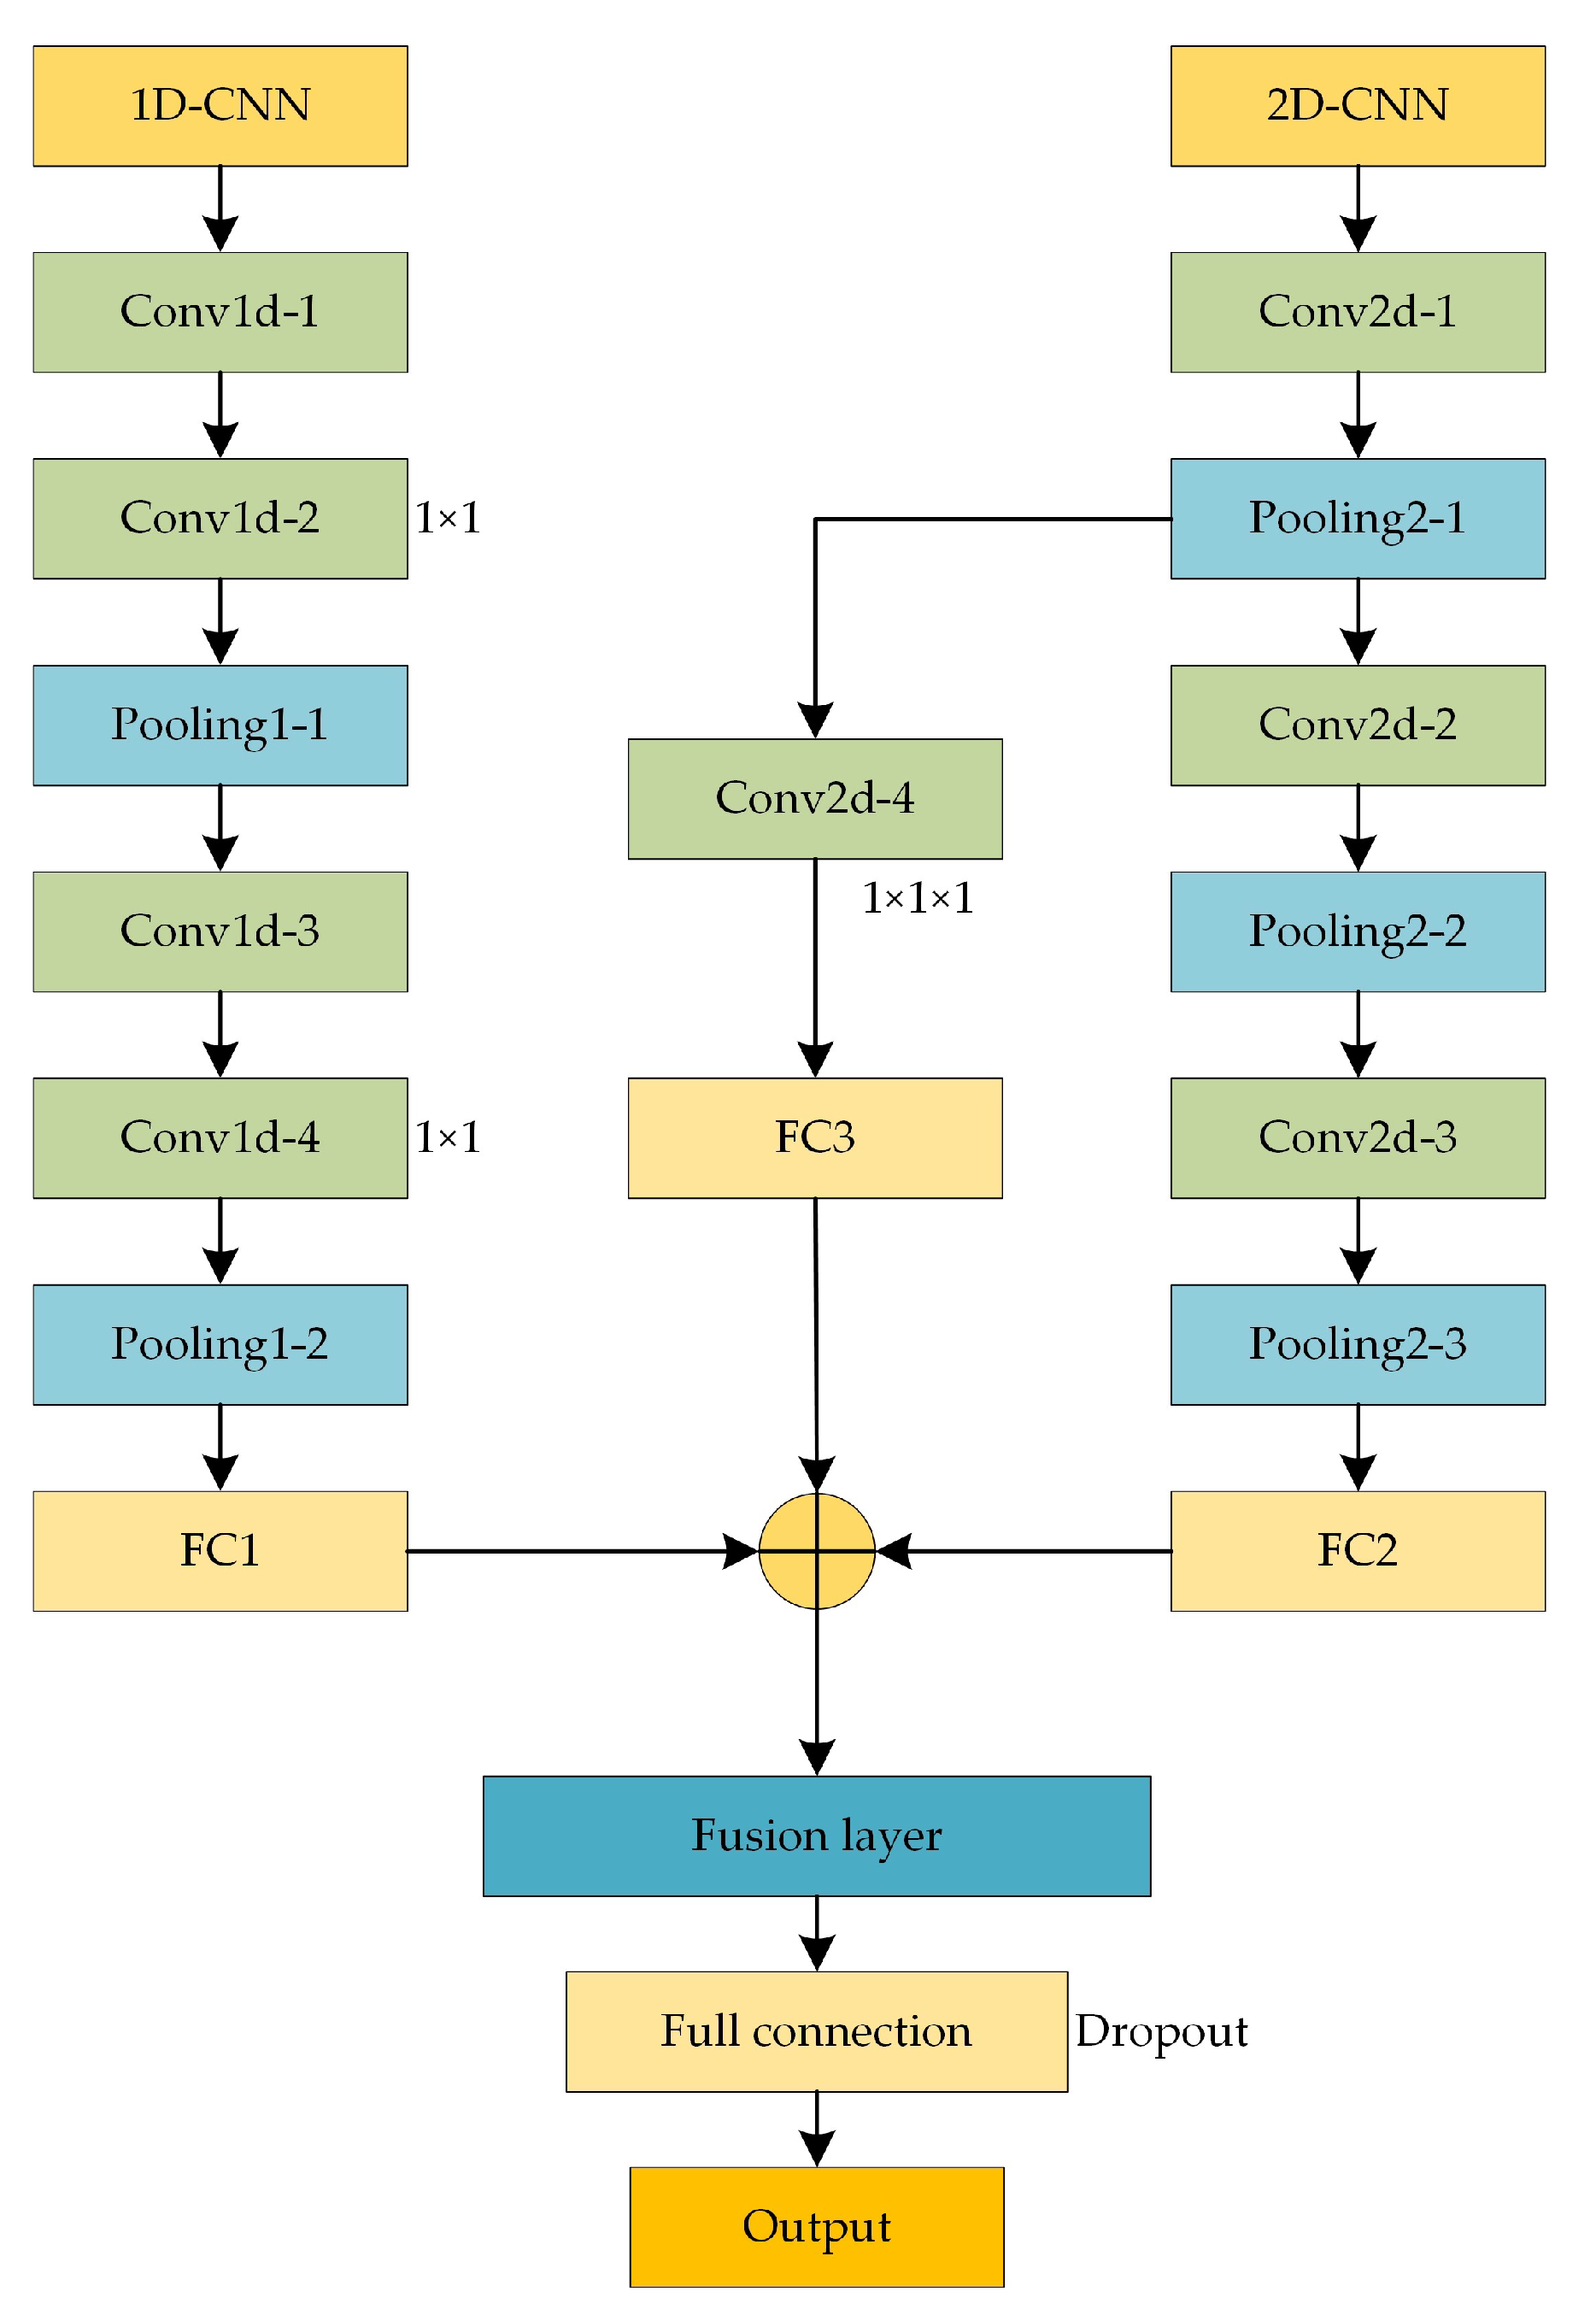
9]. Therefore, the time-domain waveform features of PD pulse are transformed into one dimension, and 1-D CNN is used to extract the features. At the same time, the wavelet transform is applied to the signal, and the wavelet time-frequency diagram supplements the frequency-domain features of the PD signal extracted by the 2-D CNN. The specific model structure of IFCNN is shown in
Figure 2. The model is composed of two parallel channels. The 1D-CNN inputs the one-dimensional time-domain feature sequence of the PD pulse, and the 2D-CNN inputs the two-dimensional wavelet time-frequency diagram. Both channels use convolutional and pooling layers alternately to extract features.
The 1D-CNN uses one-dimensional convolution and pooling kernels to adapt to the input one-dimensional time-domain feature sequence. It adds a 1 × 1 convolution layer after the ordinary convolution layer to access more activation functions and improve the nonlinear fitting ability of the one-dimensional network. The 2D-CNN uses a large convolution kernel in the first convolutional layer to increase the receptive field and obtain more features. In the feature extraction process, the shallow features pass through fewer convolution layers, the feature resolution is high, and the features contain more feature information, but the deep features have better semantics. To avoid the loss of features, the deep layer and shallow layer features are fused [
23]. The traditional feature fusion directly characterizes the features of the two layers as feature vectors. It sends them to the fully connected layer, leading to too many parameters in the fully connected layer, resulting in a bloated model. Here, the output of the features by the first pooling layer of the network is passed through a 1 × 1 × 1 convolution layer to compress the feature channel to reduce the dimension of the data and retain the significant features, to realize the fusion of cross-channel features. The fully connected layer stretches the features of 1D-CNN and deep and shallow layers of 2D-CNN into feature vectors, and the feature vectors are spliced in the fusion layer to achieve feature fusion. The fully connected layer is used to continue the feature extraction and dimension reduction of the fused features. Finally, the Softmax classifier is used to to calculate the discharge type probability to achieve the PD classification.
In the IFCNN model, ReLU is selected as the activation function. To avoid gradient disappearance and explosion, the BN layer is used after the convolution layer to normalize the data and enhance the model’s generalization ability. The pooling layer selects the maximum pooling to obtain the maximum value of the local area of the data to reduce the dimension. A fully connected layer is used after the fusion layer to prevent overfitting. The Dropout operation is used to randomly remove some neurons to solve the problem that the dimension of the feature vector increases after feature fusion.
3. PD Pattern Recognition
3.1. Data Acquisition
3.1.1. Experimental Data
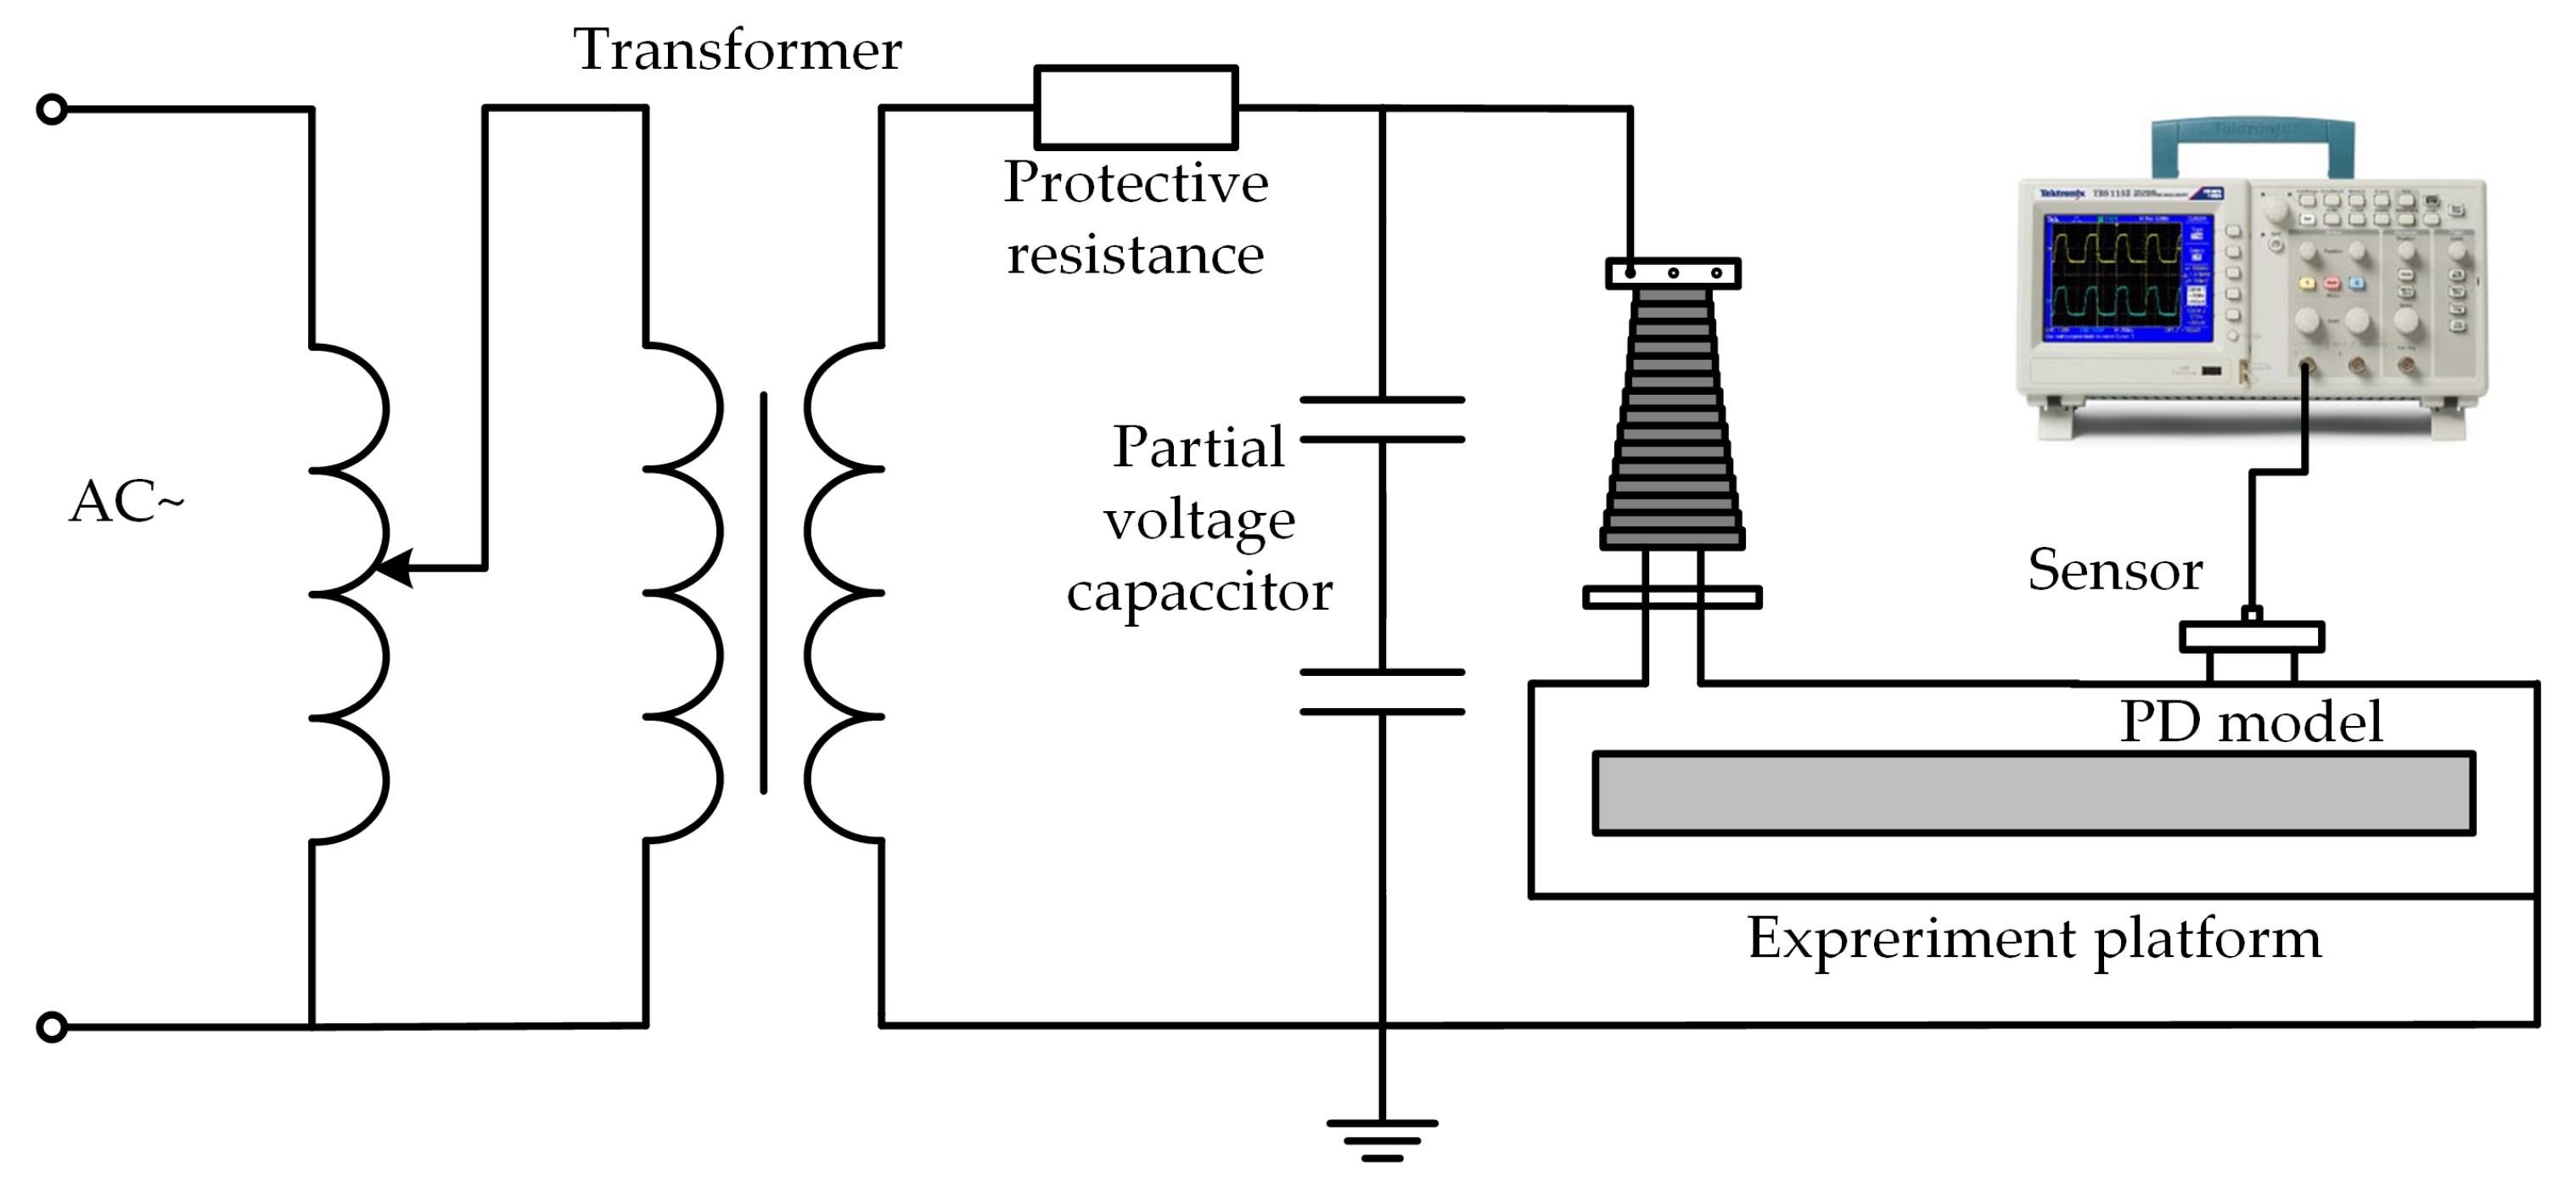
Four typical PD defect models, including point discharge, surface discharge, air gap discharge and suspended discharge were selected for pattern recognition according to the possible defect types in field GIS. The experiment circuit is shown in
Figure 3.
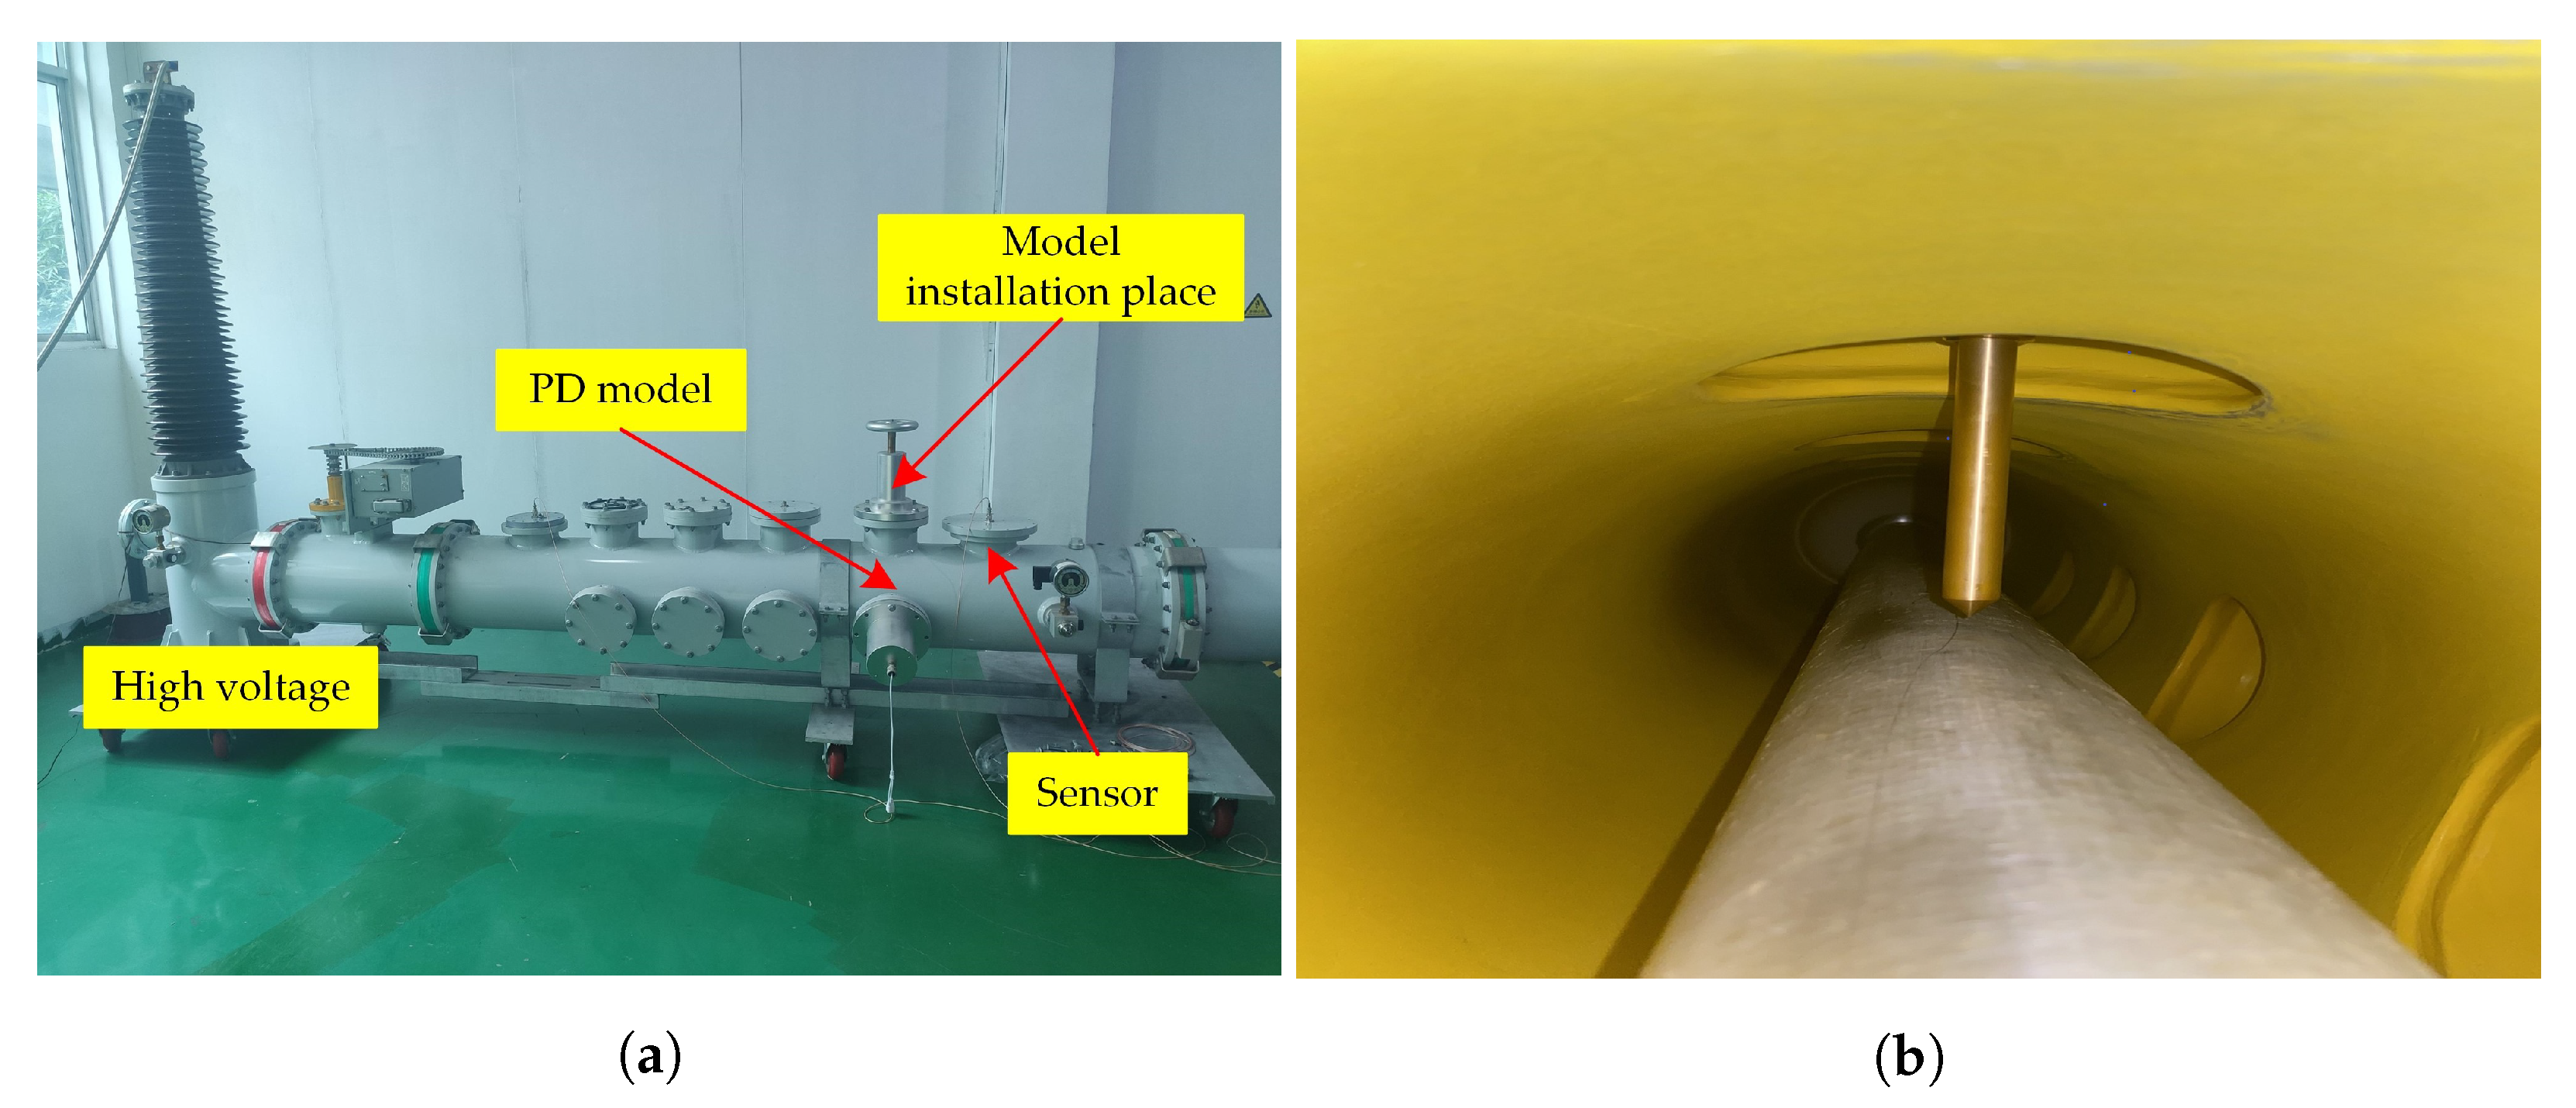
The power frequency high voltage control platform was used to apply high voltage to the PD defect model to generate PD signals.
Figure 4 shows the experiment platform (
Figure 4a) and the side view installation location (
Figure 4b) of the defect. Four typical PD defect models are shown in
Figure 5. The point discharge model simulated the presence of protrusions on the conductor surface in GIS. The surface discharge model simulated the existence of insulation defects on the surface of solid insulating materials in GIS. The air gap discharge model simulated the air gap inside the solid insulating material in GIS. The suspended discharge model simulated the poor contact of the conductor parts of GIS. When the conductor parts are energized, the potential difference between the potential suspension of the conductor parts and the surrounding parts will produce discharge.
The experiment adopted the method of stepwise pressurization, and the discharge pulse data were recorded and stored [
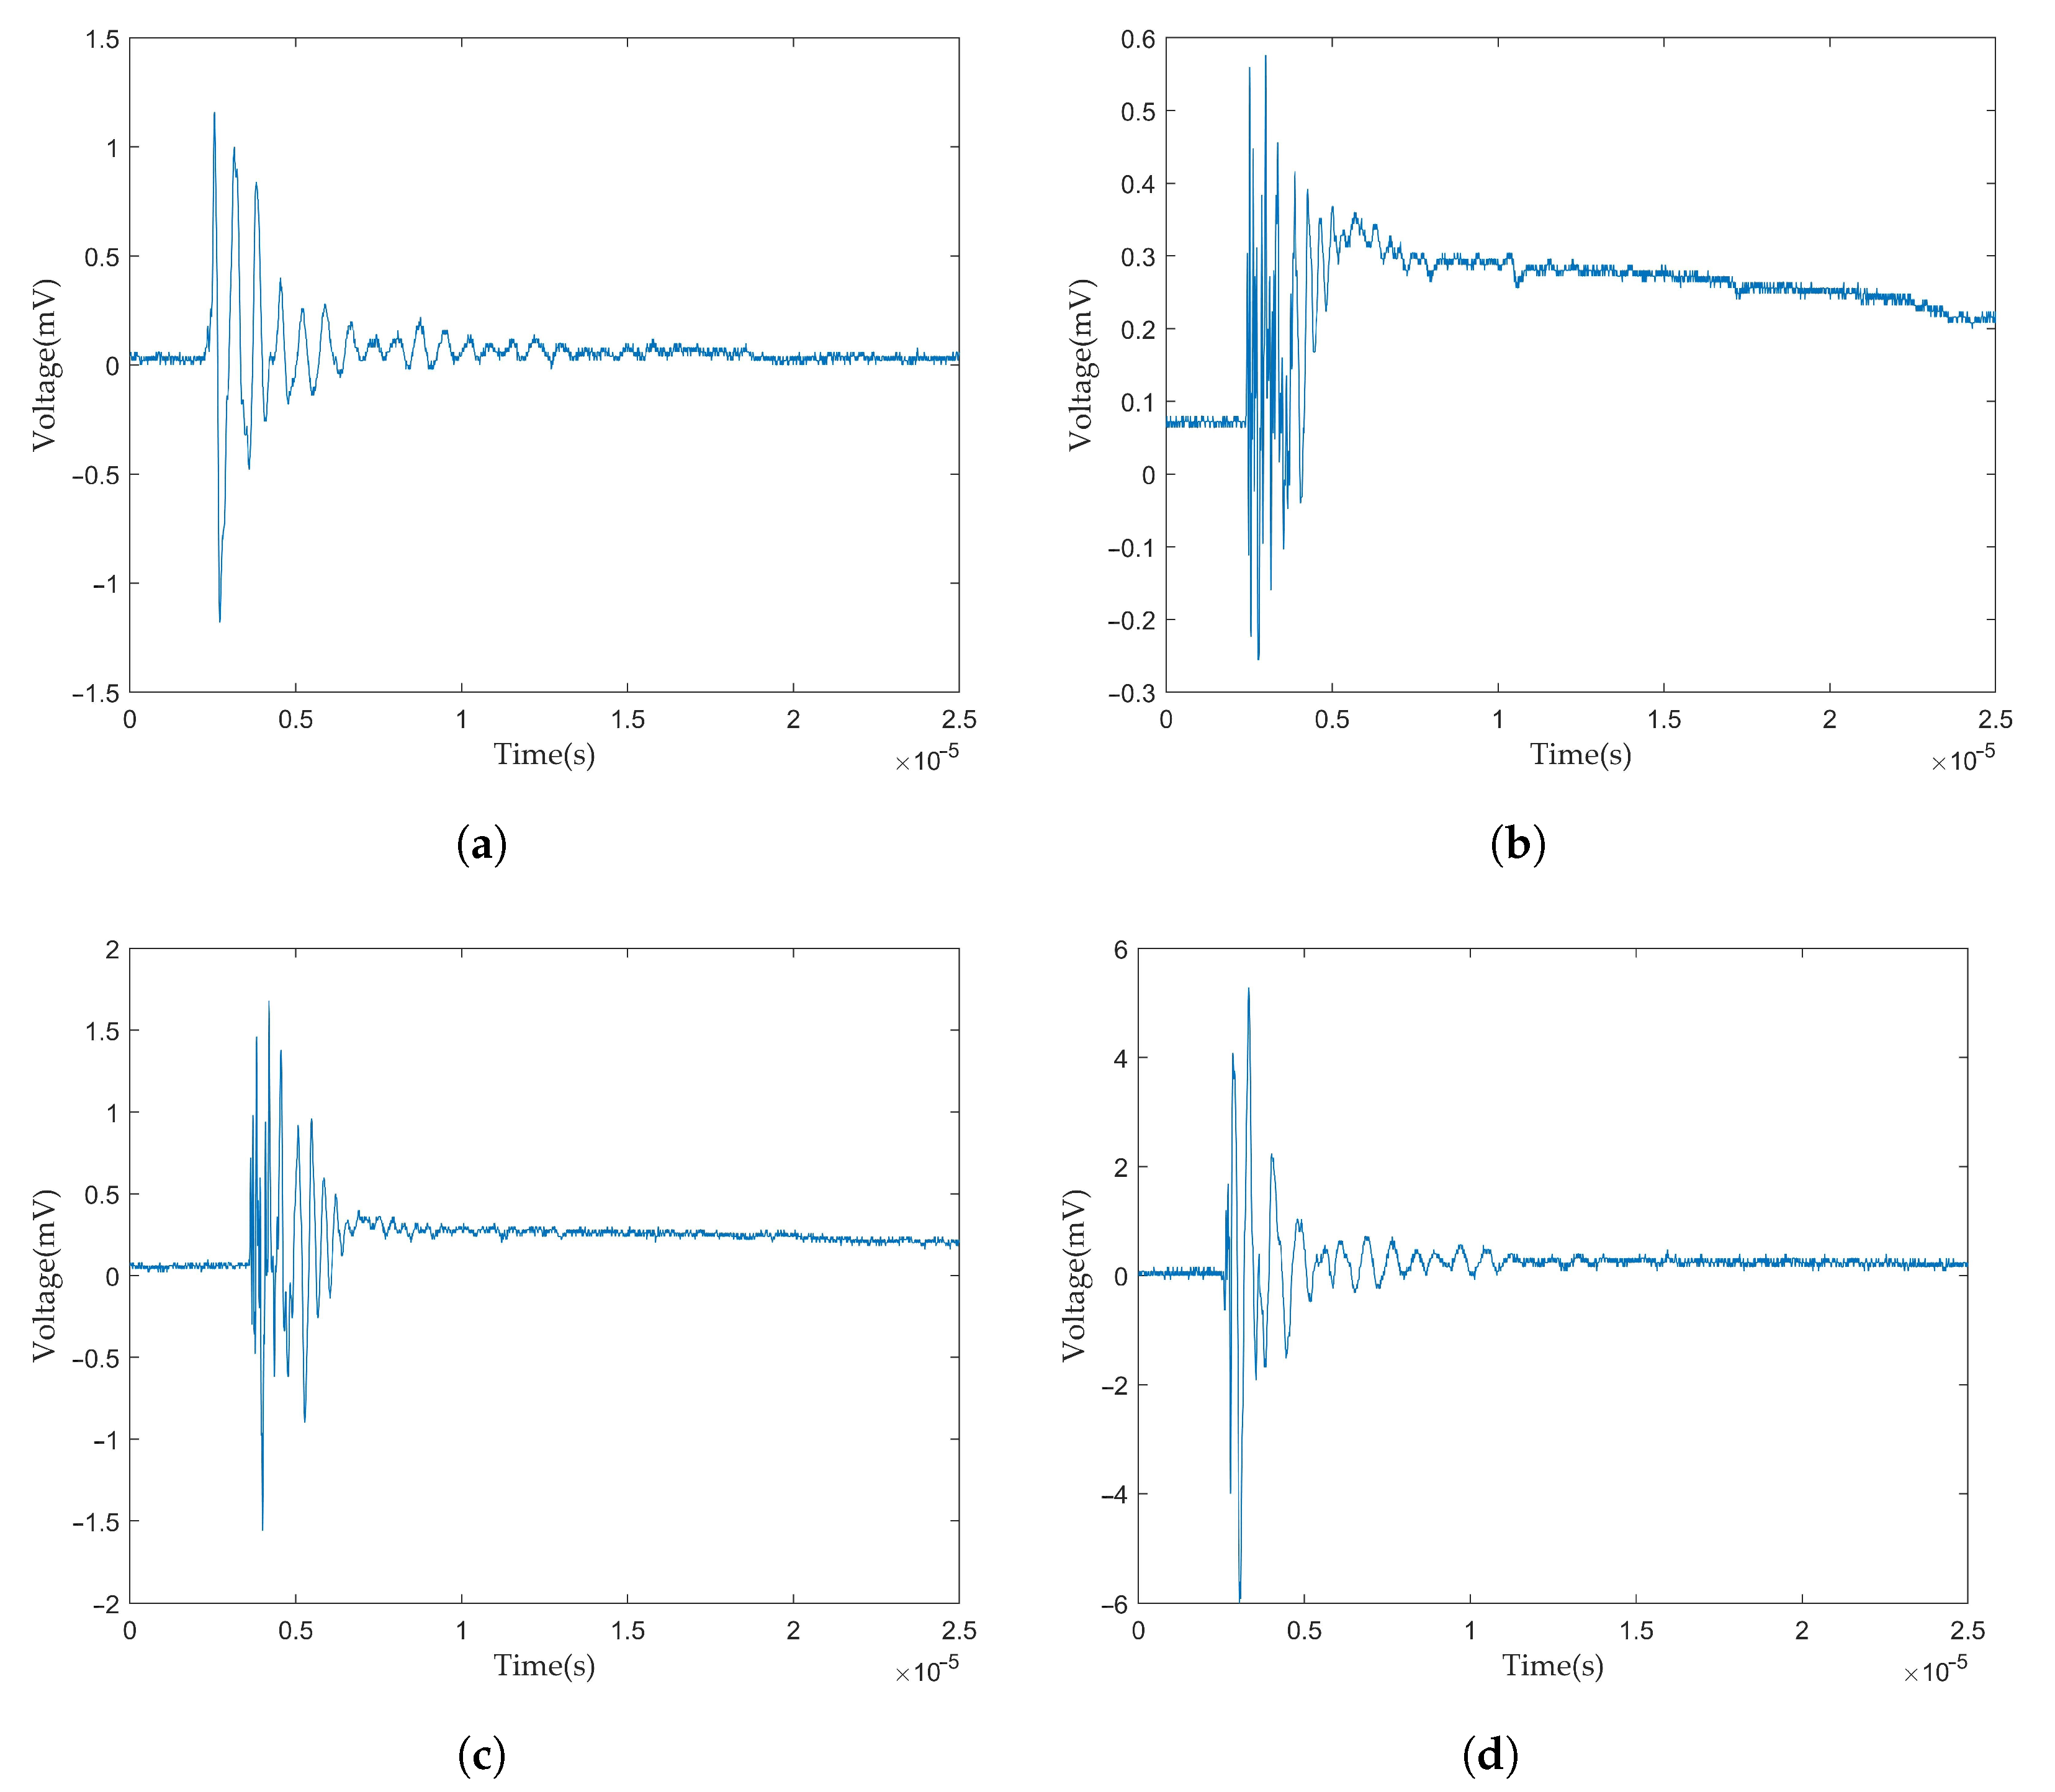
24]. The sensor was a microwave antenna. A front RF amplifier was designed internally. Before signal transmission, it was amplified to improve the signal-to-noise ratio. The gain of the amplifier was 10 dB. A high pass filter was built in the channel to filter out interference signals. The detection frequency band of the sensor was 300 MHz to 1500 MHz, and the mean effective height was 9 mm. An oscilloscope was used to collect signals. The oscilloscope model was Tektronix7104 (bandwidth 1 GHz, maximum sampling rate 20 GSa/s). The oscilloscope sampling frequency was set to 10 MSa/s, and discrete data points were used to represent the waveform. The pulse waveforms of four kinds of PD signals are shown in
Figure 6.
3.1.2. Simulation Data
To obtain as many PD fault samples as possible to reflect the characteristics of PD pulses and improve the accuracy of pattern recognition in this scheme, mathematical discharge models were used to simulate the PD source of typical PD defects to obtain the discharge data. Two mathematical models of single exponential decay oscillation pulse (SDOP) and double exponential decay oscillation pulse (DDOP) were used for simulation [
25]. The expression can be expressed as:
where
A is the signal amplitude,
f is the signal oscillation frequency, and
is the signal attenuation constant.
Both discharge models are established based on the
measurement method, which is close to the actual PD signal obtained by the pulse current method, and can represent the signal collected in the project. The pulse waveforms of the two discharge mathematical models are shown in
Figure 7.
The point, air gap, and suspended discharge were all superimposed by SDOP. The frequency of point discharge and air gap discharge is relatively low, the amplitude of the suspended discharge pulse is larger and the attenuation is more intense. DDOP superimposed the surface discharge. Referring to the PD simulation parameters in [
26] and fitting the waveforms collected in the experiment, the statistical parameters were obtained to establish the PD source model. The specific parameters are shown in
Table 1.
The simulated PD signals were collected in the simulated actual noise environment, and the simulated PD time-domain signals are shown in
Figure 8.
3.2. Feature Extraction
3.2.1. Wavelet Transform
Wavelet transform is a local transform in the time domain and frequency domain. Wavelet transform performs multi-scale refinement analysis on the signal through scaling and translation operations, which can effectively extract the local features of the signal, and has a good effect on processing transient and non-stationary signals. In recent years, wavelet transform has often been used for de-noising PD signals [
27,
28], and has some applications in PD pattern recognition. For
, its continuous wavelet transform can be expressed as:
The basis function of wavelet transform is:
where
is the wavelet function.
a is the scale factor, which is related to the frequency and controls the expansion and contraction of the wavelet function.
b is the translation factor, which is related to time and controls the translation of the wavelet function.
is the result of scaling and shifting the wavelet function, and
is introduced for normalization.
Moving the wavelet in the time domain and taking the inner product with , the obtained wavelet coefficient reflects the similarity between the corresponding period signal and the current scale wavelet. The wavelet coefficients at different frequencies can be obtained by changing the frequency of the wavelet and stretching the length of the wavelet. Wavelet transform provides a window that changes with frequency. When dealing with high frequency, the time window is compressed and the time resolution is higher. Wavelet transform can adapt to the requirements of time-frequency analysis and select the resolution according to the characteristics of the signal. It can extract the local features of the PD signal. Compared with short-time Fourier transform, wavelet transform overcomes the problem that the window does not change with frequency. As long as the wavelet transform chooses a proper wavelet basis function, the time-frequency spectrum have a good focus and is more realistic than other transforms such as Hilbert-Huang.
3.2.2. Time-Frequency Analysis
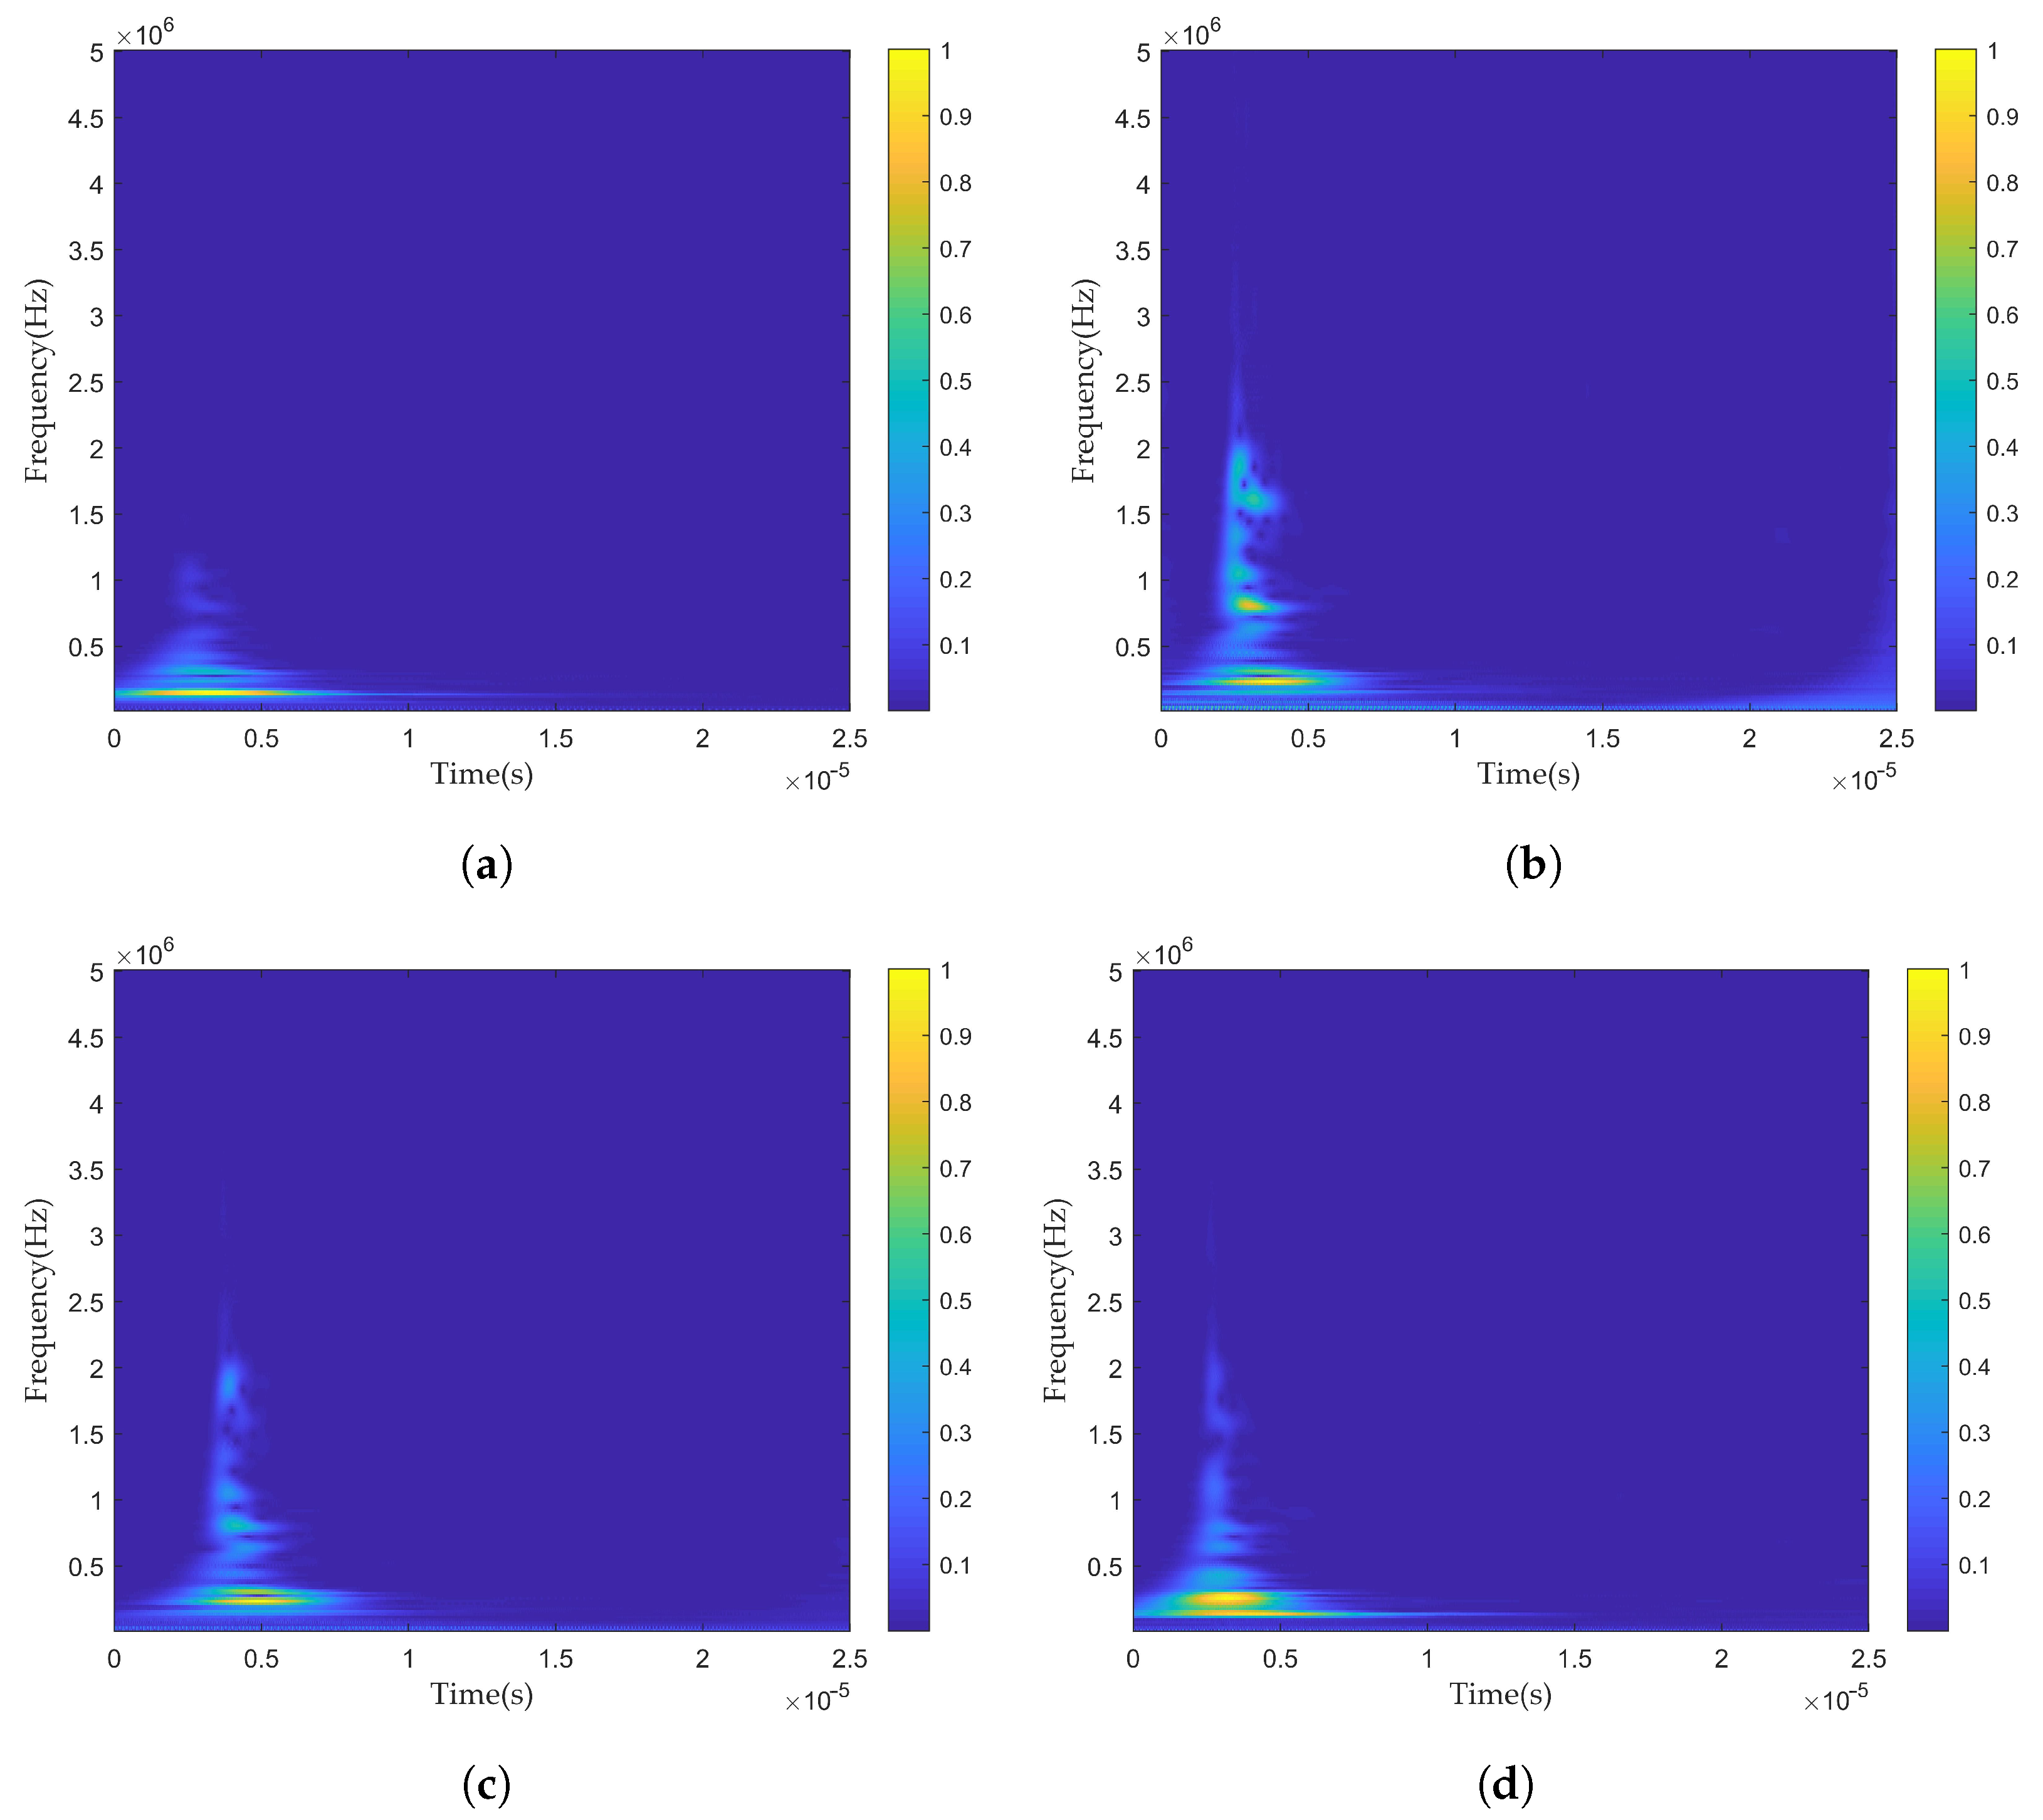
For the PD pulses collected in the experiment, their time-domain features were represented by feature sequences composed of 2500 discrete sampling points. The complex Morlet wavelet was selected as the wavelet function. The PD pulse signals were subjected to wavelet transform, and the obtained wavelet time-frequency diagrams are shown in
Figure 9.
For the simulated PD time-domain signals, the wavelet threshold de-noising method was used for processing [
29]. The signals were decomposed to the fifth layer using Sym3 wavelet function, and the signals were processed with a soft threshold to eliminate noise. The pulses of various simulated PD signals were effectively intercepted to facilitate the extraction of features for subsequent PD pattern recognition. The time-domain feature sequences were also used to describe the discharge pulse waveforms. Wavelet transform was performed on the intercepted PD pulse signals to obtain time-frequency features. A complex Morlet wavelet was used for the wavelet transform to obtain wavelet time-frequency diagrams of various simulated PD pulses.
3.3. Model Training
Taking the time-domain feature sequence of PD pulse and the corresponding wavelet time-frequency diagram as a set of samples, 500 samples were selected for each of the four types of PD, including 200 experimental data and 300 simulated data. All samples were divided into a training set and validation set according to the ratio of 8:2. The data set was preprocessed, the discharge amplitudes of the time-domain feature sequences were normalized, the diagrams were grayed, and the corresponding labels were marked on the data set. The processed data set was input into the IFCNN model for supervised learning. The gradient descent algorithm was used in the training process, and the cross-entropy function was used as the loss function, which can be generally expressed as:
where
is the tag value, and
is the predicted value.
Through iterative training, the weights between each layer were updated until the error reached the set expected value, the training was ended, and the trained model was saved. Finally, PD test data of unknown type was input into the trained model to verify the recognition effect of the model.
4. Results and Analysis
4.1. Training Process
The Pytorch framework based on Python3.6 was used to write the IFCNN model in this paper. The experimental hardware environment was an i7-6700HQ processor and 8G memory, and the software environment was the Windows10 operating system. The specific parameters of each layer of the IFCNN model built are shown in
Table 2.
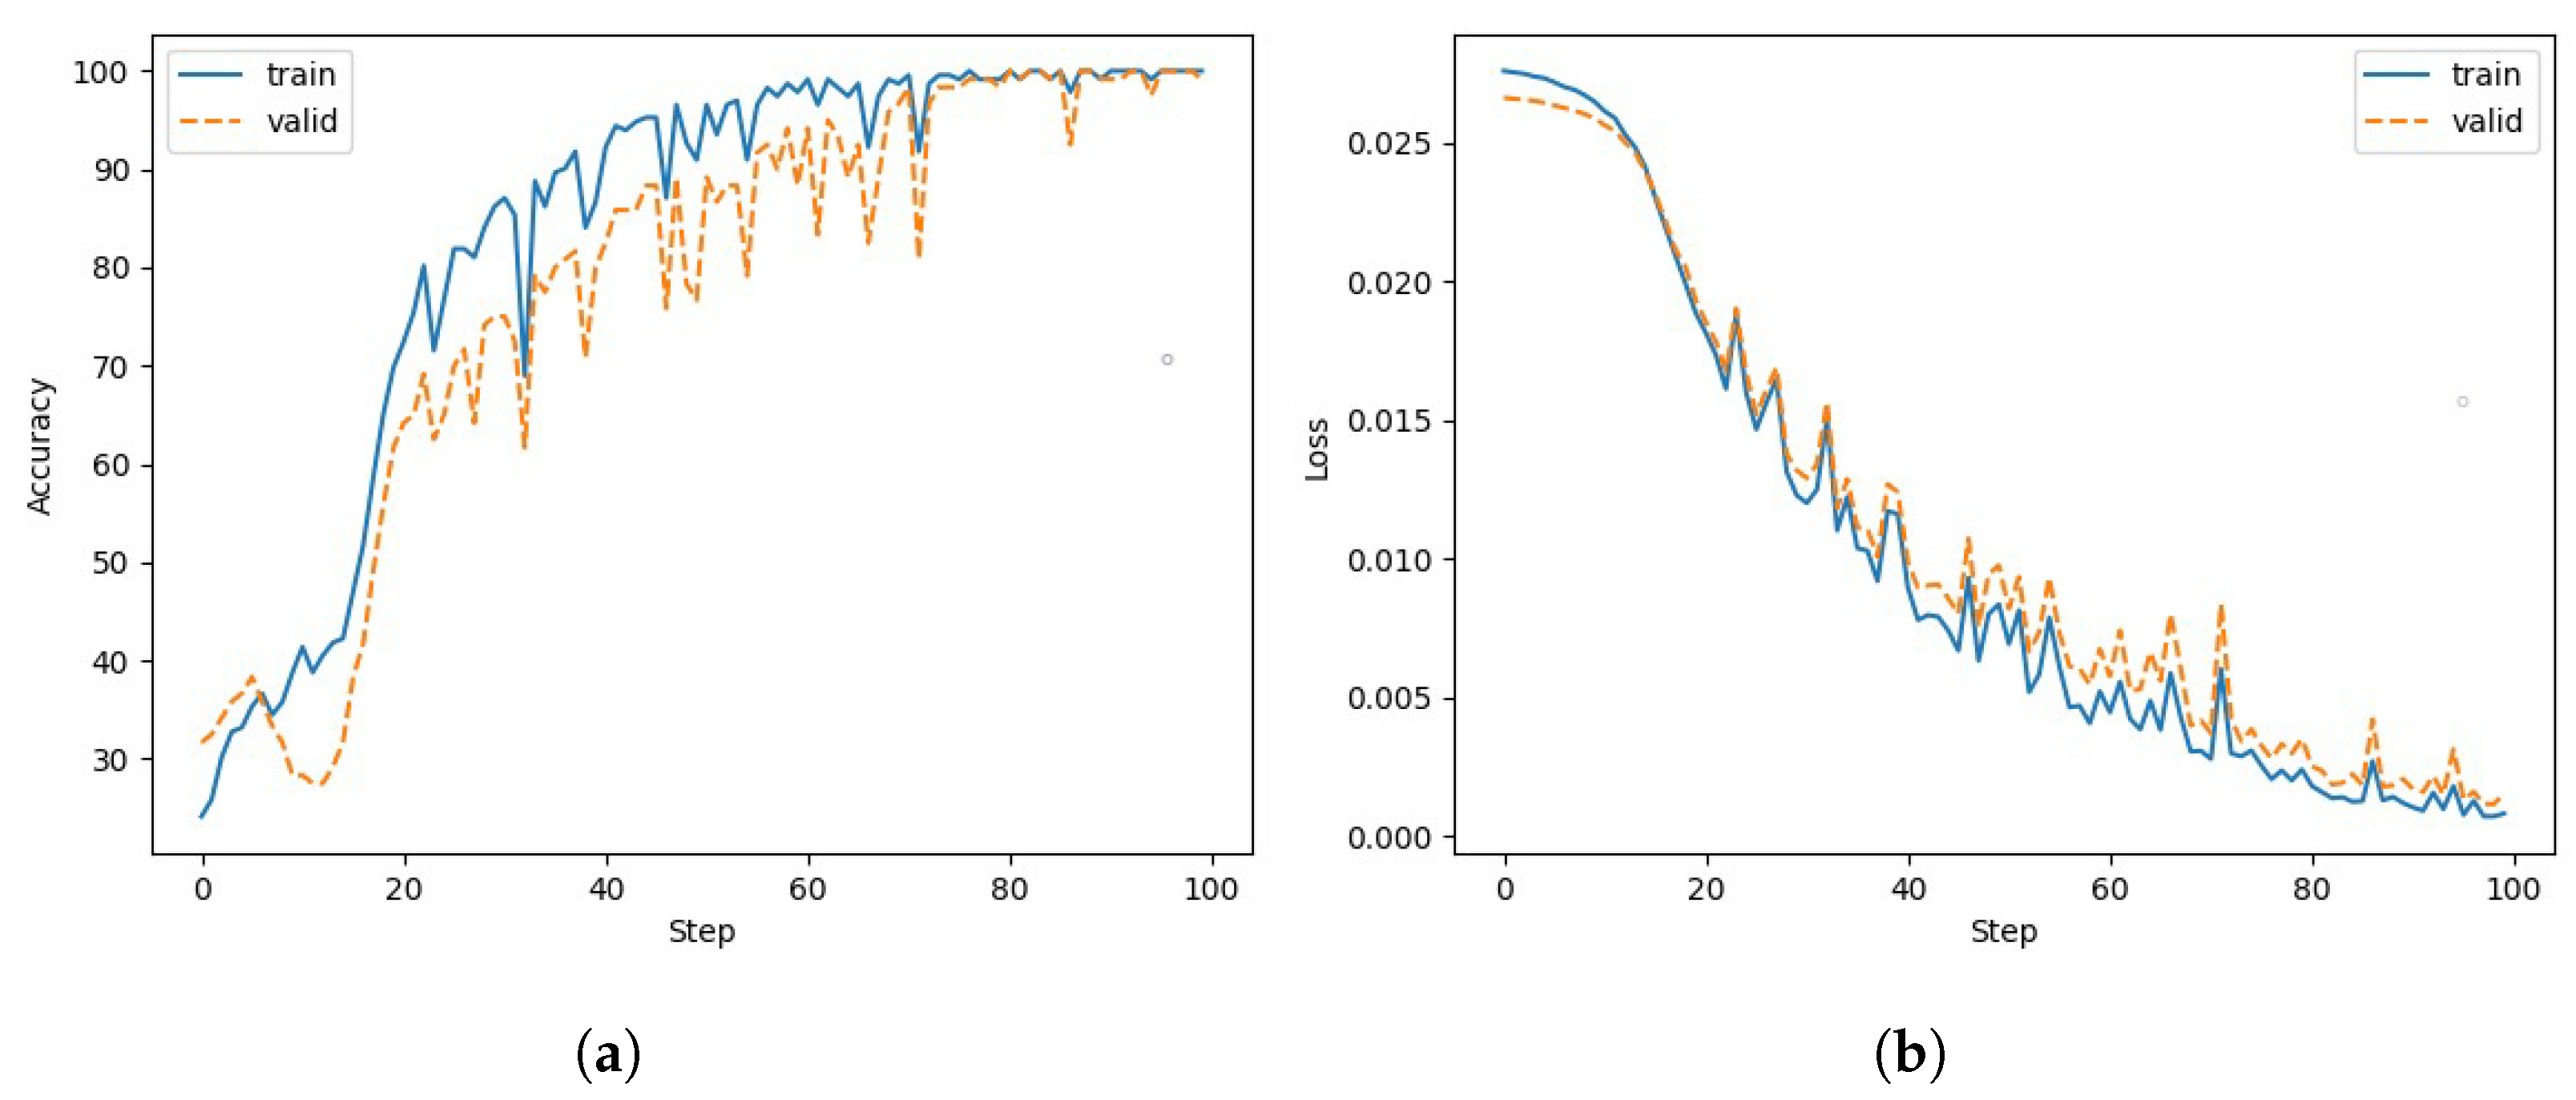
The learning rate was set to 0.005, the number of iterations was set to 100, and the Batchsize was set to 64. The accuracy and loss curves of the training set and validation set in the training process are shown in
Figure 10. As the number of iterations increases, the accuracy gradually increases and tends to be stable. The structure of the improved model is lightweight, and the training speed is fast. The model is suitable for PD pattern recognition.
4.2. Accuracy Analysis of Pattern Recognition
The PD test data were inputted into the trained model for recognition, and the recognition accuracy
was used to evaluate the ability of PD recognition. The calculation
is:
where
is the number of samples whose identification type is consistent with the actual type, and
is the total number of samples.
The confusion matrix of IFCNN pattern recognition results is shown in
Figure 11, where 0, 1, 2 and 3 represent point discharge, surface discharge, air gap discharge and suspended discharge, respectively. It can be seen from the data in the figure that the IFCNN model has a high recognition accuracy, and the recognition accuracy of surface discharge reaches 98.3%. In order to ensure the stability of the model, the model was trained ten times, and the standard deviation of the overall recognition accuracy was 1.95.
In this paper, the experimental data and simulation data were combined with expanding the data set. In order to verify its impact on the experimental results, the experimental data and simulation data were separately used for testing. The identification results are shown in
Table 3. The results show that the improved models have a good recognition effect.
The quality of wavelet transform feature extraction depends on the similarity between the wavelet waveform and the measured signal waveform. Different wavelet functions were used to verify the influence of different wavelet functions on pattern recognition accuracy. The appropriate center frequency was selected to perform wavelet transform on PD signals. The wavelet functions commonly used for signal processing include Bior, Sym, Db, and Morlet. The processed data sets were respectively input into the IFCNN model for testing. The pattern recognition results are shown in
Table 4.
The results in
Table 4 show that the recognition accuracy is higher using the complex Morlet wavelet. The complex Morlet wavelet function is a complex-valued function multiplied by a Gaussian function and a complex trigonometric function, and its waveform characteristics are more similar to the PD pulse waveform. The complex Morlet wavelet function can reflect the time-domain and frequency-domain features of the discharge signal and obtain the distribution of signal energy with time and frequency.
4.3. Comparison of Different Methods
To verify the effect of the proposed method on the feature extraction and classification of PD pulses, the time-domain feature sequences, and wavelet time-frequency diagrams were input into the 1D-CNN and 2D-CNN of the same specification for comparative experiments. The recognition accuracy was compared using the same data set. The pattern recognition results of different methods are shown in
Table 5.
It can be seen from the data in
Table 5 that the recognition accuracy of the IFCNN has reached 95.8%, and the recognition accuracy is much higher than that of the single-channel CNN. Due to the similarity of the pulse waveforms of air gap discharge and suspended discharge, the accuracy of pattern recognition is low when only the time-domain feature sequences are used to extract the time-domain features of PD pulses. The wavelet time-frequency diagrams extract features from both the time and frequency domains, improving recognition accuracy. The improved algorithm in this paper fuses the two features and avoids the problem of insufficient feature utilization through structural improvement, which further improves the recognition accuracy. During the training process, the improved model converges faster under the same number of iterations.
5. Conclusions
In this paper, an IFCNN model is constructed to extract the features of PD pulses, and PD pattern recognition is realized by using the features of the pulse signal in the time domain and frequency domain, which solves the problem that traditional detection methods need a large amount of statistical discharge data. The improved model takes the one-dimensional time-domain feature sequence of PD pulse and wavelet time-frequency diagram as input signals, uses the two-channel CNN to extract the features, fuses the extracted fault information, and finally uses the Softmax layer to realize the classification of PD. The method combines the advantages of 1D-CNN and 2D-CNN, fuses the time-frequency features of different dimensions, and mines more feature information.
The data set was established to train and test the models by establishing four typical PD defect models and using mathematical models to obtain the discharge pulse data of different PD types. Compared to the pattern recognition effect of the improved model with 1D-CNN and 2D-CNN, the overall recognition rate of the IFCNN model reaches 95.8%, followed by 2D-CNN (89.2%) and 1D-CNN (78.3%). The recognition effect of IFCNN is higher than the traditional single-channel model, due to the reason that can fully extract the time-frequency features of the discharge pulse and further retain the feature information through structural optimization. In the actual field environment, different sensors and measuring circuits may affect the features of the collected discharge pulses. In order to ensure the recognition accuracy of the improved algorithm, the algorithm can be trained by re-collecting the discharge pulse data, then use the features of the extracted discharge pulse to realize PD recognition. The improved algorithm extracts the features of the attenuation period of the single pulse. It is unnecessary for the collector to collect the discharge data of multiple power frequency cycles, leading the little storage space for hardware devices. The structure of the improved algorithm is lightweight, the number of convolution layers and the requirements for the operating system are small are small, the model can be recognized when it is transplanted to the embedded system, and also be easily applied to the field environment.
Author Contributions
Conceptualization, J.Z. and Z.C.; methodology, J.Z., Z.C. and Q.W.; software, Z.C.; validation, J.Z., Z.C. and W.X.; formal analysis, Z.C. and W.X.; investigation, Z.C. and Q.W.; resources, J.Z. and H.Q.; data curation, J.Z., Z.C. and Q.W.; writing—original draft preparation, Z.C.; writing—review and editing, J.Z., Z.C. and W.X.; visualization, Z.C.; supervision, J.Z. and H.Q. All authors have read and agreed to the published version of the manuscript.
Funding
This research was funded by the Postgraduate Research & Practice Innovation Program of Jiangsu Province under the grant number [SJCX21_1283].
Conflicts of Interest
The authors declare no conflict of interest.
References
- Thi, N.; Do, T.D.; Jung, J.R.; Jo, H.; Kim, Y.H. Anomaly Detection for Partial Discharge in Gas-Insulated Switchgears Using Autoencoder. IEEE Access 2020, 8, 152248–152257. [Google Scholar] [CrossRef]
- Khan, Q.; Refaat, S.S.; Abu-Rub, H.; Toliyat, H.A. Partial Discharge Detection and Diagnosis in Gas Insulated Switchgear: State of the Art. IEEE Electr. Insul. Mag. 2019, 35, 16–33. [Google Scholar] [CrossRef]
- Jing, Q.; Yan, J.; Lu, L.; Xu, Y.; Yang, F. A Novel Method for Pattern Recognition of GIS Partial Discharge via Multi-Information Ensemble Learning. Entropy 2022, 24, 954. [Google Scholar] [CrossRef] [PubMed]
- Gao, A.; Zhu, Y.; Cai, W.; Zhang, Y. Pattern Recognition of Partial Discharge Based on VMD-CWD Spectrum and Optimized CNN With Cross-Layer Feature Fusion. IEEE Access 2020, 8, 151296–151306. [Google Scholar] [CrossRef]
- Song, S.; Qian, Y.; Wang, H.; Zang, Y.; Sheng, G.; Jiang, X. Partial Discharge Pattern Recognition Based on 3D Graphs of Phase Resolved Pulse Sequence. Energies 2020, 13, 4103. [Google Scholar] [CrossRef]
- Haikun, S.; Kwok, L.; Feng, L. Partial Discharge Feature Extraction Based on Ensemble Empirical Mode Decomposition and Sample Entropy. Entropy 2017, 19, 439. [Google Scholar]
- Wang, K.; Li, J.; Zhang, S.; Gao, F.; Cheng, H.; Liu, R.; Liao, R.; Grzybowski, S. A New Image-Oriented Feature Extraction Method for Partial Discharges. IEEE Trans. Dielectr. Electr. Insul. 2015, 22, 1015–1024. [Google Scholar] [CrossRef]
- Xu, C.; Chen, J.; Liu, W.; Lv, Z.; Li, P.; Zhu, M. Pattern Recognition of Partial Discharge PRPD Spectrum in GIS Based on Deep Residual Network. High Volt. Eng. 2022, 48, 1113–1123. [Google Scholar]
- Wan, X.; Song, H.; Luo, L.; Li, Z.; Sheng, G.; Jiang, X. Application of Convolutional Neural Networks in Pattern Recognition of Partial Discharge Image. Power Syst. Technol. 2019, 43, 2219–2226. [Google Scholar]
- Zhao, X.; Liu, X.; Meng, Y.; Liu, S.; Chai, Q.; Wu, P.; Meng, G. Partial Discharge Pattern Classification by Singular Value Decomposition of Wavelet Packet Energy Features. J. Xi’An Jiaotong Univ. 2017, 51, 116–121. [Google Scholar]
- Ren, Z. Identification of Gabor Distribution Characteristics of Partial Discharge on Typical SF6 Gas Insulated Defects. High Volt. Appar. 2015, 51, 142–148. [Google Scholar]
- Li, P.; Tian, Q.; Huo, M.; Chen, X.; Lin, Y.; Li, J. Recognition Method of Partial Discharge Type of Transformer Based on Wavelet Transform and Hog Feature. Electr. Drive 2021, 51, 52–56. [Google Scholar]
- Liu, B.; Zheng, J. Partial Discharge Pattern Recognition in Power Transformers Based on Convolutional Neural Networks. High Volt. Appar. 2017, 53, 70–74. [Google Scholar]
- Song, H.; Dai, J.; Sheng, G.; Jiang, X. GIS Partial Discharge Pattern Recognition via Deep Convolutional Neural Network under Complex Data Source. IEEE Trans. Dielectr. Electr. Insul. 2018, 25, 678–685. [Google Scholar] [CrossRef]
- Wang, Y.; Yan, J.; Yang, Z.; Wang, J.; Geng, Y. A Novel 1DCNN and Domain Adversarial Transfer Strategy for Small Sample GIS Partial Discharge Pattern Recognition. Meas. Sci. Technol. 2021, 32, 125118. [Google Scholar] [CrossRef]
- Huang, X.; Xiong, J.; Zhang, Y.; Liang, J. Partial Discharge Pattern Recognition of Switchgear Based on Residual Convolutional Neural Network. J. Phys. Conf. Ser. 2020, 1659, 012057. [Google Scholar] [CrossRef]
- Florkowski, M. Classification of Partial Discharge Images Using Deep Convolutional Neural Networks. Energies 2020, 13, 5496. [Google Scholar] [CrossRef]
- Wang, Y.; Yan, J.; Yang, Z.; Liu, T.; Zhao, Y.; Li, J. Partial Discharge Pattern Recognition of Gas-Insulated Switchgear via a Light-Scale Convolutional Neural Network. Energies 2019, 12, 4674. [Google Scholar] [CrossRef]
- Liu, T.; Yan, J.; Wang, Y.; Xu, Y.; Zhao, Y. GIS Partial Discharge Pattern Recognition Based on a Novel Convolutional Neural Networks and Long Short-Term Memory. Entropy 2021, 23, 774. [Google Scholar] [CrossRef] [PubMed]
- Wang, Y.; Yan, J.; Sun, Q.; Li, J.; Yang, Z. A MobileNets Convolutional Neural Network for GIS Partial Discharge Pattern Recognition in the Ubiquitous Power Internet of Things Context: Optimization, Comparison, and Application. IEEE Access 2019, 7, 150226–150236. [Google Scholar] [CrossRef]
- Peng, X.; Yang, F.; Wang, G.; Wu, Y.; Li, L.; Li, Z. A Convolutional Neural Network-Based Deep Learning Methodology for Recognition of Partial Discharge Patterns from High-Voltage Cables. IEEE Trans. Power Deliv. 2019, 34, 1460–1469. [Google Scholar] [CrossRef]
- Sun, Y.; Ma, S.; Sun, S.; Liu, P.; Zhang, L.; Ouyang, J.; Ni, X. Partial Discharge Pattern Recognition of Transformers Based on MobileNets Convolutional Neural Network. Appl. Sci. 2021, 11, 6984. [Google Scholar] [CrossRef]
- Li, H.; Zhu, Y.; Wang, J. Transformer PRPD Pattern Recognition Based on Multi-layer Feature Fusion CNN. Electr. Meas. Instrum. 2020, 57, 63–68. [Google Scholar]
- Nasr, E.A.; Shahabi, S.; Kordi, B. Partial Discharge Detection and Identification at Low Air Pressure in Noisy Environment. High Volt. 2021, 6, 850–860. [Google Scholar] [CrossRef]
- Xiao, S.; Chen, B.; Shen, D.; Chen, H. Application of Improved VMD and Threshold Algorithm in Partial Discharge Denoising. J. Electron. Meas. Instrum. 2021, 35, 206–214. [Google Scholar]
- Zhang, M. Study on Partial Discharge Feature Extraction and Pattern Recognition of High Voltage Switchgear. Master’s Thesis, Shanghai DianJi University, Shanghai, China, 2020. [Google Scholar]
- Hussein, R.; Shaban, K.B.; El-Hag, A.H. Wavelet Transform With Histogram-Based Threshold Estimation for Online Partial Discharge Signal Denoising. IEEE Trans. Instrum. Meas. 2015, 64, 3601–3614. [Google Scholar] [CrossRef]
- Jian, L. Wavelet De-noising of Partial Discharge Signals Based on Genetic Adaptive Threshold Estimation. IEEE Trans. Dielectr. Electr. Insul. 2012, 19, 543–549. [Google Scholar]
- Mi, H.; Wang, X.; Ren, G.; Zhen, Y. De-noising for White Noise in Partial Discharge Signals by Adaptive Wavelet Threshold Estimation. High Volt. Appar. 2021, 57, 94–101. [Google Scholar]
| Publisher’s Note: MDPI stays neutral with regard to jurisdictional claims in published maps and institutional affiliations. |
© 2022 by the authors. Licensee MDPI, Basel, Switzerland. This article is an open access article distributed under the terms and conditions of the Creative Commons Attribution (CC BY) license (https://creativecommons.org/licenses/by/4.0/).


