Abstract
In this study, three-dimensional numerical simulations were established for a honeycomb ceramic conduit, and the effects of the inlet methane volume fraction, inlet velocity, and the conduit length on the gas temperature and flow resistance in the conduit were investigated. The simulation results indicate that the mean gas temperature first rises rapidly and then slowly, with an increasing inlet methane volume fraction. The mean gas temperature increases slightly with an increasing inlet velocity, and first increases and then decreases with an increasing conduit length. As the inlet methane volume fraction increases, the conduit pressure loss increases, but the increase rate gradually slows down. The conduit pressure loss increases approximately linearly with an increasing inlet velocity and conduit length. A prediction model for the pressure loss in the conduit was obtained by a theoretical analysis. The theoretical results agree well with the simulation results, and the deviations between the theoretical and simulation results were in the range of 3.7% to 12.3%. When the mean gas temperature in the conduit was less than 1000 K, the deviations were less than 6.5%.
1. Introduction
Ventilation air methane (VAM) contributed 64% of coal mine methane emissions [1]. Due to the low methane volume fraction and the large volume, the capture and utilization of VAM is a significant problem. Oxidation technology for VAM has attracted extensive attention from scholars [2,3,4,5]. VAM utilization technologies can be separated into catalytic oxidation and thermal oxidation [1,6]. The thermal flow-reversal reactor (TFRR) and the catalytic flow-reversal reactor (CFRR) are the most commonly used technologies for VAM utilization. Gosiewski et al. [7,8] compared the advantages and disadvantages of the CFRR and the TFRR in the treatment of VAM. The results indicated that the thermal efficiency of the TFRR was higher than that of the CFRR, with a methane volume fraction higher than 0.4%. In considering heat recovery, the TFRR is the most advantageous solution, economically and technically.
To determine the mechanism of the thermal oxidation of methane, many experimental studies have been carried out. Gosiewski and Pawlaczyk et al. [9,10,11] found that there was a large amount of carbon monoxide in the intermediate product of the methane oxidation reaction and proposed simple thermal oxidation reaction mechanism models for methane. Wang et al. [12] investigated the homogeneous combustion of an ultralow-concentration methane–air mixture, in a cylindrical quartz reactor through experiments, and the results indicated that the two-step reaction mechanism can perfectly describe the methane oxidation process in empty reactors and reactors equipped with honeycomb ceramics.
Zheng et al. [13] developed a small-scale TFRR and studied the influences of the flow rate, the methane volume fraction, the reversing cycle time, and the reaction temperature on methane oxidation. Lü et al. [14] designed and built a 1000 m3/h TFRR. The experimental results showed that a larger air volume, a higher methane volume fraction, and a longer switching time would lead to a longer high-temperature zone of the reactor. Li et al. [15] developed an experimental investigation on a TFRR at the Dafosi coal mine in China. The TFRR can recover approximately 31.61% to 46.82% of the energy for power generation, under stable operating conditions. Gosiewski et al. [16] concluded that the central built-in heat exchange method is more likely to cause thermal asymmetry than the air extraction method, through experiments and numerical simulations. Gao et al. [17] established experiments and numerical simulations to study the effect of honeycomb ceramic on the heat extraction efficiency and heat transfer modes. Liu et al. [18] tested the thermal fatigue performance of mullite ceramics in a TFRR and found that the thermal fatigue life of the ceramic bed was approximately 1–8 months. Lan et al. [19,20,21,22] conducted numerical simulations and full-scale experiments to study the influences of the intake methane volume fraction, the flow rate, and the cycle time on the thermal behavior and heat recovery efficiency in a TFRR. Gosiewski et al. [23] proposed a simplified CFD model to simulate the flow resistance and uniformity of the TFRR, and the simulation results were in good agreement with the experimental results, proving that the model can be applied in practice to guide the design of future devices.
Thus far, previous research has mostly focused on the working stability and methane oxidation efficiency of TFRRs, but there are few studies on their flow resistance. The honeycomb ceramic bed is one of the key components of the TFRR. The flow resistance in the honeycomb ceramic is the most important energy consumption of the reactor, and its value directly affects the selection of the reactor processing capacity and the fan power. In this research, three-dimensional numerical simulations were established to study the dynamic characteristics of the gas temperature and the pressure distributions in a honeycomb ceramic conduit, and the influences of the inlet methane volume fraction, inlet velocity, and conduit length on the flow resistance in the honeycomb ceramic conduit were analyzed.
2. Numerical Simulation Models and Methods
A number of honeycomb ceramics were installed, in parallel, on the flow cross section of the TFRR. Each piece of honeycomb ceramic is composed of hundreds of parallel conduits. The distributions of the flow and temperature fields between parallel conduits are basically the same. In this study, the TFRR was simplified as a single honeycomb ceramic conduit.
A single honeycomb ceramic conduit model is shown in Figure 1. The cross section of the conduit was square, the inner side length was d, the half thickness of the conduit wall was δ, and the conduit length was L. For simplification, it was assumed that (1) radiation heat transfer was ignored; (2) the gas was an incompressible ideal gas; and (3) the outside walls of the conduit were adiabatic.
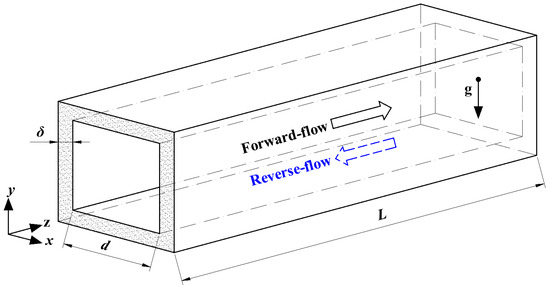
Figure 1.
Physical model of the honeycomb ceramic conduit.
The governing equations for the flow and heat transfer process in the honeycomb ceramic conduit are expressed as follows:
In the above equations, the subscript “g” represents gas, and the subscript “s” represents honeycomb ceramic. ρ is density; t is time; V is the velocity vector; p is the pressure; g is the acceleration of gravity; cp is the specific heat; λ is the thermal conductivity; and Ji, hi, and Ri are the diffusion flux, specific enthalpy, and volumetric rate of production of the i-th species, respectively. τ is the viscous stress tensor and was calculated as follows:
where μ is the gas viscosity.
The velocity inlet boundary was applied for the inlet of the conduit, and the gas velocity, temperature, and volume fraction of each component were given at the inlet. The temperature of the inlet gas was 300 K for all cases. The boundary condition of the pressure outlet was applied for the conduit outlet. The outer walls of the honeycomb ceramic conduit adopted an adiabatic boundary.
The software FLUENT was employed to solve the equations. The laminar viscous model was applied in this research. The two-step mechanism was applied for the methane–air reaction, due to the consideration of time consumption and accuracy. The specific heat, thermal conductivity, and viscosity of the methane–air mixture were computed by the mixing law, ideal gas mixing law, and Sutherland, respectively. Convection terms were handled using the second order of the upwind method, while diffusion terms were handled using the central difference approximation. The PISO approach was used to solve the pressure–velocity coupling. Unsteady terms were handled by the first order implicit scheme. Model verification has been presented in detail in the author’s previous studies, as shown in reference [22].
3. Simulation Results and Analysis
3.1. Periodic Migration of the Gas Temperature and Pressure Distributions in Honeycomb Ceramic Conduits
A complete operating cycle of the TFRR consists of a forward-flow process and a reverse-flow process. In the half cycle of the forward-flow, the gas enters from the left and exits from the right. After half a cycle, the gas flow direction changes. The original pressure outlet is changed to the velocity inlet, and the original velocity inlet is changed to the pressure outlet. Then, the gas flows in from the right and flows out from the left. The flow enters a cyclic steady state after many cycle repetitions. The cases discussed below in this research are in the cyclic steady state.
Figure 2 presents profiles of the gas temperature, the methane volume fraction, and the pressure in the conduit at four moments in a cycle. In this case, the conduit length, L, was 0.3 m, the inlet methane volume fraction, YCH4,in, was 1 vol%, the inlet velocity, uin, was 1 m/s, and the cycle time, tc, was 120 s.
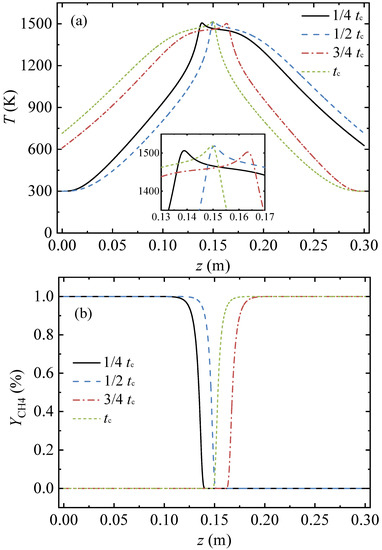
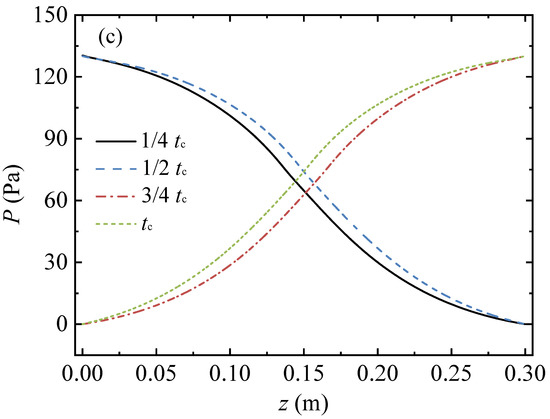
Figure 2.
Migration process of the gas temperature, methane volume fraction, and pressure profiles along the arial direction in a full cycle: (a) gas temperature profiles, (b) profiles of methane volume fraction, and (c) pressure profiles.
At the moment of the 1/4 cycle, the gas entered from the left of the conduit, the gas was heated by the hot conduit, and then the oxidation reaction of methane occurred. The methane volume fraction dropped from 1 vol% (at z = 0.118 m) to 0 (at z = 0.141 m), as shown in Figure 2b. The gas temperature rose sharply and reached a peak of 1506 K at z = 0.139 m. The high temperature gas then transferred heat to the conduit, while its own temperature gradually decreased. The cooled gas was discharged from the right side of the conduit. At the moment of 1/2 cycle, the point with the peak temperature of 1519 K moved to the point of z = 0.1505 m, the methane volume fraction dropped to 0 at z = 0.1525 m, and the gas temperature at z = 0.3 m increased as time passed.
Then the flow direction reversed. The gas entered from the right and exited from the left. At the moment of 3/4 cycle, the point with the peak temperature of 1503 K was at z = 0.1635 m. At the end moment of the cycle, the point with the peak temperature of 1519 K shifted from z = 0.1635 m to z = 0.1495 m. As shown in Figure 2a, the temperature profiles of the first and the second half cycles were symmetrical along the center point of the conduit. As time passed the heat stored in the entrance side of the conduit was carried away by feeding cold gas. It takes more conduit length for the cold gas to be heated to the peak temperature, hence, the point with the peak temperature moved along the flow direction as time passed.
As the boundary condition of the pressure outlet was applied for the conduit outlet, the pressures of the conduit outlet for the four moments were constant at 0 Pa. The pressure profiles in the conduit exhibited an S-shape, as shown in Figure 2c. The pressure in the middle region of the conduit changed more sharply than those in the inlet and outlet regions. The pressure profiles of the first and the second half cycles were symmetrical along the center point of the conduit.
At the four moments, the mean gas temperatures in the conduit were 955.87 K, 952.91 K, 955.96 K, and 952.97 K, respectively; the difference between the maximum and minimum values was 3.05 K; and the change rate was 0.3%. Meanwhile, the pressure differences between the conduit inlet and outlet for the four moments were 130.36 Pa, 130.06 Pa, 130.21 Pa, and 130.09 Pa, respectively. The pressure difference between the conduit inlet and outlet remained almost constant throughout the cycle. Hence, the gas temperature and pressure profiles at the end of the half cycle of the reverse-flow represented the characteristics of the total cycle and were selected for the following analysis.
3.2. Effect of Inlet Methane Volume Fraction on Conduit Resistance Characteristics
When the inlet methane volume fraction changes, the temperature distribution in the ceramic conduit changes, thereby affecting the pressure loss in the conduit. Figure 3 presents the gas temperature and pressure gradient profiles in the honeycomb ceramic conduit under various inlet methane volume fractions. In this series of cases, the conduit length L = 1.8 m, the inlet velocity uin = 1 m/s, and the cycle time tc = 120 s.
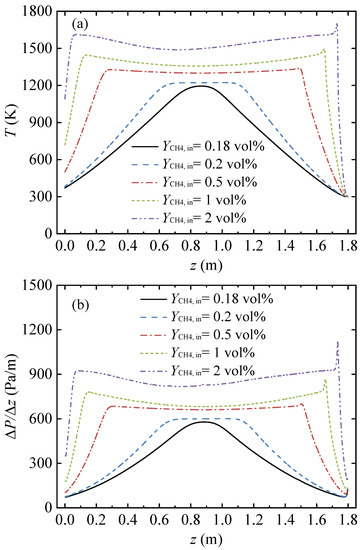
Figure 3.
Gas temperature and pressure gradient profiles along the arial direction in the conduit, with various feed methane volume fractions. (a) Gas temperature profiles and (b) pressure gradient profiles.
The inlet methane volume fraction had a considerable influence on the gas temperature distribution, as shown in Figure 3a. When the inlet methane volume fraction was 0.18%, the length of the high temperature section in the conduit middle was 0, and the temperature distribution curve was parabolic. For inlet methane volume fractions of 0.2% and 0.5%, a high temperature area with equal temperature values was formed in the middle of the conduit, and the temperature distribution curve was a trapezoid. For inlet methane volume fractions of 1% and 2%, the temperature curve in the middle of the conduit was concave downward, and the overall temperature distribution curve was saddle-shaped.
As shown in Figure 3b, the change behavior of the pressure gradient curve was very similar to the change behavior of the gas temperature curve. With an increase in the inlet methane volume fraction, the pressure gradient curve underwent a transformation process from a parabolic shape to a trapezoidal shape and then to a saddle shape. Due to the high temperature in the conduit middle region, the pressure gradient in the middle region was large, and the curve was very flat. The pressure gradient changed sharply with the change in the gas temperature around the inlet and outlet of the conduit. As the inlet methane volume fraction increased, the pressure gradient of the high-pressure gradient region in the conduit center rose, and the length of the high-pressure gradient region increased.
3.3. Effect of the Inlet Velocity on the Conduit Resistance Characteristics
Figure 4 shows the gas temperature and the pressure gradient profiles under various inlet velocities. In this series of cases, the conduit length L = 1.8 m, the inlet methane volume fraction YCH4,in = 1 vol%, and the cycle time tc = 120 s. With an increased inlet velocity, the point of the peak temperature moved away from the gas inlet, the length of the high temperature region gradually shortened, and the gas temperature distribution changed from a saddle shape to a trapezoid shape. The gas temperature in the middle area increased with the increase in the inlet velocity.
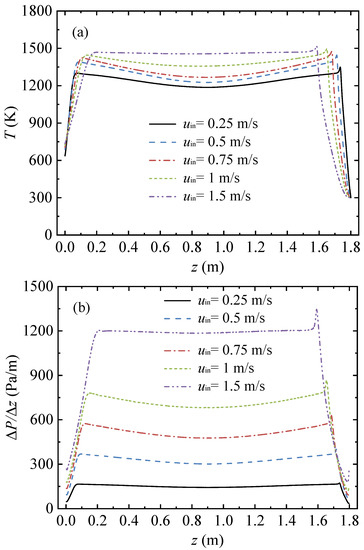
Figure 4.
Gas temperature and pressure gradient profiles along the arial direction in the conduit, with various inlet velocities: (a) gas temperature profiles and (b) pressure gradient profiles.
As shown in Figure 4b, the pressure gradient curve was significantly influenced by the increase in the inlet velocity. There was a sharp rise in the value of the pressure gradient in the middle area with the increase in the inlet velocity. As the inlet velocity rose, the length of the high-pressure gradient region in the conduit center decreased, and the pressure gradient rose.
3.4. Effect of Conduit Length on Conduit Resistance Characteristics
Figure 5 shows the gas temperature and pressure gradient profiles under various conduit lengths. In this series of cases, the inlet methane volume fraction YCH4,in = 1 vol%, the inlet velocity uin = 1 m/s, and the cycle time tc = 120 s.
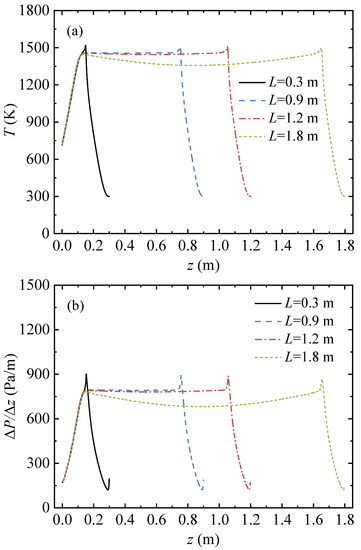
Figure 5.
Gas temperature and pressure gradient profiles along the arial direction in the conduit, with various conduit lengths: (a) gas temperature profiles and (b) pressure gradient profiles.
When the conduit length was 0.3 m, the length of the high temperature region was 0. The gas temperature rose sharply along the flow direction (from the right side to the left) and reached a peak of 1518.7 K at z = 0.1495 m, and then dropped to 715.1 K at z = 0 m. When the conduit length increased from 0.3 m to 1.2 m, the length of the high temperature zone increased linearly from 0 to 0.918 m, a high temperature platform area appeared in the center of the conduit, and the temperature distribution of the gas transformed into a trapezoid. When the conduit length increased from 1.2 m to 1.8 m, the length of the high temperature zone continued to increase linearly, to 1.517 m. The temperature at both ends of the high temperature zone did not change significantly, but the temperature in the central zone decreased, and the temperature distribution of the gas transformed into a saddle shape.
As shown in Figure 5b, as the conduit length increased, the length of the high-pressure gradient region in the conduit center increased. When the conduit length increased from 0.9 m to 1.2 m, the pressure gradient at the conduit center was almost unchanged. When the conduit length continued to increase to 1.8 m, the pressure gradient at the conduit center dropped.
4. Theoretical Analyses of the Pressure Loss in the Honeycomb Ceramic Conduit
4.1. Theoretical Analysis Model
For the simplification of the theoretical analysis, it was assumed that (1) the gas was an incompressible ideal gas, and (2) the mixture of methane and air was simplified to air, due to the low concentration of methane.
To determine the gas flow state in the honeycomb ceramic conduit, the Reynolds number (Re) in the conduit was calculated as follows:
where dm is the equivalent diameter of the conduit. Gas viscosity is related to temperature and can be calculated using the Sutherland empirical formula [24], as follows:
where S is the Sutherland constant, and μ0 is the gas viscosity at temperature T0. For air, T0 = 273 K, μ0 = 1.716 × 10⁻⁵ kg/(m·s), and S = 111 K.
The gas velocity at the inlet of the honeycomb ceramic conduit was on the order of 100 m/s; the gas composition was close to that of air, the density was on the order of 100 kg/m3, and the viscosity was on the order of 10−5 kg/(m·s). The size was on the order of 10−3 m. Hence, the Reynolds number, Re, was on the order of 102, and the flow in the conduit was laminar.
According to the Darcy–Weisbach equation, the head loss, hl, resulting from the fluid friction and the effect of the fluid viscosity in the conduits can be calculated as [25], as follows:
where f is a friction factor. The friction factor, f, in the laminar flow was calculated as [25], as follows:
According to the ideal gas state equation, the relationship between the gas flow velocity, u, and the gas flow velocity, uin, at temperature, Tin, is as follows:
Substituting Equations (6)–(10) into Equation (8), the head loss in the conduit is given as:
The mean gas temperature in the honeycomb ceramic conduit, , is given as follows:
Using the mean gas temperature, , as the characteristic temperature, the pressure loss, ΔP, in the conduit is given as follows:
Equation (13) shows that when other parameters are constant, the pressure loss in the ceramic conduit has a linear relationship with the conduit length and the inlet velocity and has, approximately, a linear relationship with the 1.5 power of the mean gas temperature in the conduit.
4.2. Comparison of Theoretical Results and Simulation Results
Figure 6 shows the mean gas temperature and pressure loss in the honeycomb ceramic conduit for all the simulation cases and compares the simulation results with the theoretical results. Figure 6a indicates that, with an increase in the inlet methane volume fraction, the mean gas temperature first increased rapidly and then slowly increased linearly, and that the pressure loss also exhibited a trend of, first, a rapid increase, and then a linear increase. Figure 6b shows that the mean gas temperature increased slightly and slowly with the increase in the inlet velocity. The pressure loss rose approximately linearly with the increase in the inlet velocity. Figure 6c shows that the pressure loss exhibited a linear and rapid increase with the increase in the conduit length. As shown in Figure 6, the theoretical results of the pressure loss in the honeycomb ceramic conduits were always slightly larger than the numerical simulation results for all cases.
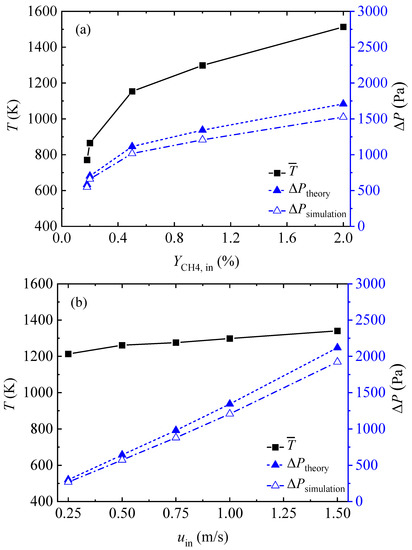
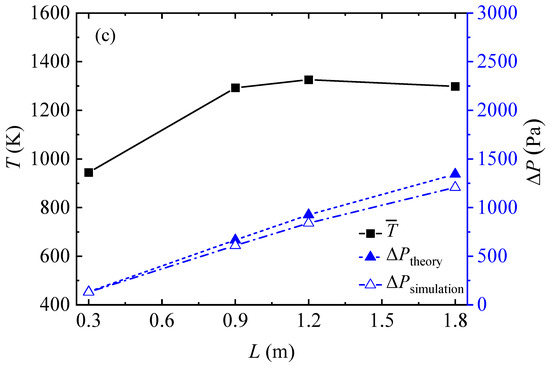
Figure 6.
Mean gas temperatures and pressure losses obtained by theory and simulation for all cases: (a) various inlet methane volume fractions, (b) various gas velocities, and (c) various conduit lengths.
It is interesting to find that in Figure 6c, as the conduit length increases, the mean gas temperature rises for the first three length cases, and then drops for the length of 1.8 m. As shown in Figure 5a, the length and temperature distribution of the inlet section and outlet section were basically the same for the different conduit length conditions. The length of the middle–high temperature section increased with the increase in the conduit length. The temperature distribution in the high-temperature section showed a curve of high at both ends and low in the middle. For the case with a conduit length of 1.8 m, the depression of the temperature distribution curve in the high temperature section was very obvious and induced the average temperature in the conduit to be lower than that in the case with a conduit length of 1.2 m.
Figure 7 presents the deviations between the theoretical and simulation results for all cases. As the inlet methane volume fraction was low, the theoretical result and the simulation result were in good agreement, with a deviation of 6.3%. As the inlet methane volume fraction rose, the difference between the two results increased to 12.1%. For the different inlet velocities, the deviations between the two results decreased from 12.3% to 10.2%, with an increase in the inlet velocity. For the cases of different conduit lengths, the deviations between the two results increased from 3.7% to 11.2%, with the increase in the conduit length.
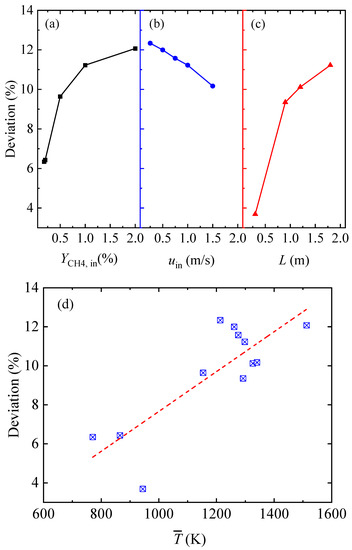
Figure 7.
Deviations between the theoretical and simulation results for all cases: (a) various inlet methane volume fractions, (b) various gas velocities, (c) various conduit lengths, and (d) various mean gas temperatures.
As shown in Figure 7d, the main reason for the deviations between the theoretical and the simulation results may have been the high mean gas temperature. The red trend line in Figure 7d shows that the deviations generally increased with the increase in the mean temperature. The deviations with a mean temperature of less than 1000 K were much lower than those with a mean temperature of higher than 1000 K. Another reason for the deviations was that the mixture of methane and air was simplified to air. This simplification brought about the differences in the physical parameters between the mixture and the air, which, in turn, affected the calculation of the pressure loss.
5. Conclusions
In this study, three-dimensional numerical simulations were developed for a single honeycomb ceramic conduit, and the effects of the inlet methane volume fraction, inlet velocity, and conduit length on the thermal pressure loss of the conduit were analyzed. The main conclusions of the current study are as follows:
- (1)
- As the inlet methane volume fraction increases, the mean gas temperature in the conduit first rises sharply and then gradually. When the inlet velocity rises, the mean gas temperature increases slightly and slowly. When the conduit length increases, the mean gas temperature first rises and then drops.
- (2)
- The higher the gas temperature in the conduit is, the greater the pressure gradient. The pressure gradient in the central region of the honeycomb ceramic conduit increases with an increasing inlet velocity and inlet methane volume fraction and is slightly impacted by the conduit length.
- (3)
- As the inlet methane volume fraction rises, the conduit pressure loss increases, but the rate of increase slows down. The conduit pressure loss increases approximately linearly with the increasing inlet velocity and conduit length.
- (4)
- A theoretical prediction model for the pressure loss in the conduit was proposed, and the theoretical results agreed well with the simulation results. The deviation between the theoretical and the simulation results increased from 6.3% to 12.1% with an increase in the inlet methane volume fraction, decreased from 12.3% to 10.2% with an increase in the inlet velocity, and increased from 3.7% to 11.2% with an increase in the conduit length.
Author Contributions
Data curation, B.L.; funding acquisition, B.L. and P.-C.L.; methodology, B.L. and P.-F.G.; project administration, P.-C.L.; software, B.L. and P.-F.G.; supervision, Y.-R.L. and P.-C.L.; validation, B.L.; writing—original draft, B.L.; writing—review and editing, Y.-R.L. and J.-J.Y. All authors have read and agreed to the published version of the manuscript.
Funding
This research was funded by the Chongqing Natural Science Foundation, grant number: cstc2020jcyj-bshX0125, and the Chongqing Construction Science and Technology Plan Project, grant number: CKZ2021 No. 4–3.
Institutional Review Board Statement
Not applicable.
Informed Consent Statement
Not applicable.
Data Availability Statement
The data presented in this study are available on request from the corresponding author.
Conflicts of Interest
The authors declare no conflict of interest.
References
- Su, S.; Beath, A.; Guo, H.; Mallett, C. An assessment of mine methane mitigation and utilisation technologies. Prog. Energy Combust. 2005, 31, 123–170. [Google Scholar] [CrossRef]
- Karakurt, I.; Aydin, G.; Aydiner, K. Mine ventilation air methane as a sustainable energy source. Renew. Sustain. Energy Rev. 2011, 15, 1042–1049. [Google Scholar] [CrossRef]
- Baris, K. Assessing ventilation air methane (VAM) mitigation and utilization opportunities: A case study at Kozlu Mine, Turkey. Energy Sustain. Dev. 2013, 17, 13–23. [Google Scholar] [CrossRef]
- Wang, W.; Wang, H.; Li, H.; Li, D.; Li, H.; Li, Z. Experimental Enrichment of Low-Concentration Ventilation Air Methane in Free Diffusion Conditions. Energies 2018, 11, 428. [Google Scholar] [CrossRef]
- Lin, H.; Chen, G.; Wu, F.; Li, H.; Chao, Y. An Experimental and Numerical Study on Supported Ultra-Lean Methane Combustion. Energies 2019, 12, 2168. [Google Scholar] [CrossRef]
- Karakurt, I.; Aydin, G.; Aydiner, K. Sources and mitigation of methane emissions by sectors: A critical review. Renew. Energy 2012, 39, 40–48. [Google Scholar] [CrossRef]
- Gosiewski, K.; Matros, Y.S.; Warmuzinski, K.; Jaschik, M.; Tanczyk, M. Homogeneous vs. catalytic combustion of lean methane–air mixtures in reverse-flow reactors. Chem. Eng. Sci. 2008, 63, 5010–5019. [Google Scholar] [CrossRef]
- Gosiewski, K.; Pawlaczyk, A. Catalytic or thermal reversed flow combustion of coal mine ventilation air methane: What is better choice and when? Chem. Eng. J. 2014, 238, 78–85. [Google Scholar] [CrossRef]
- Gosiewski, K.; Pawlaczyk, A.; Warmuzinski, K.; Jaschik, M. A study on thermal combustion of lean methane–air mixtures: Simplified reaction mechanism and kinetic equations. Chem. Eng. J. 2009, 154, 9–16. [Google Scholar] [CrossRef]
- Pawlaczyk, A.; Gosiewski, K.J. Simplified Kinetic Model for Thermal Combustion of Lean Methane–Air Mixtures in a Wide Range of Temperatures. Int. J. Chem. React. Eng. 2013, 11, 111–121. [Google Scholar] [CrossRef]
- Pawlaczyk, A.; Gosiewski, K. Combustion of lean methane–air mixtures in monolith beds: Kinetic studies in low and high temperatures. Chem. Eng. J. 2015, 282, 29–36. [Google Scholar] [CrossRef]
- Wang, Y.; Liu, Y.; Cao, Q.; Wang, C.A.; Che, D. Homogeneous combustion of fuel ultra-lean methane–air mixtures: Experimental study and simplified reaction mechanism. Energy Fuels 2011, 25, 3437–3445. [Google Scholar] [CrossRef]
- Zheng, B.; Liu, Y.; Liu, R.; Meng, J. Oxidation of coal mine ventilation air methane in thermal reverse-flow reactor. J. China Coal Soc. 2009, 34, 1475–1478. [Google Scholar]
- Lü, Y.; Jiang, F.; Xiao, Y. Experimental study of coal mine ventilation air methane oxidization. J. China Coal Soc. 2011, 36, 973–977. [Google Scholar]
- Li, Q.; Lin, B.; Yuan, D.; Chen, G. Demonstration and its validation for ventilation air methane (VAM) thermal oxidation and energy recovery project. Appl. Therm. Eng. 2015, 90, 75–85. [Google Scholar] [CrossRef]
- Gosiewski, K.; Pawlaczyk, A.; Jaschik, M. Energy recovery from ventilation air methane via reverse-flow reactors. Energy 2015, 92, 13–23. [Google Scholar] [CrossRef]
- Gao, Z.; Liu, Y.; Gao, Z. Influence of packed honeycomb ceramic on heat extraction rate of packed bed embedded heat exchanger and heat transfer modes in heat transfer process. Int. Commun. Heat Mass Transfer 2015, 65, 76–81. [Google Scholar] [CrossRef]
- Liu, Y.Q.; Shang, Q.H.; Zhang, D.H.; Wang, Y.X.; Sun, T.T. Thermal fatigue life prediction of ventilation air methane oxidation bed. Strength Mater. 2016, 48, 8–13. [Google Scholar] [CrossRef]
- Zou, W.; Lan, B.; Kang, J. Multi-bed type oxidation reactor applied to the coal mine ventilation air methane. In 3rd International Symposium on Mine Safety Science and Engineering; McGill University: Montreal, QC, Canada, 2016; pp. 248–253. [Google Scholar]
- Lan, B.; Li, Y. Numerical simulation of thermodynamic performance in honeycomb ceramic channel. In 3rd International Symposium on Mine Safety Science and Engineering; McGill University: Montreal, QC, Canada, 2016. [Google Scholar]
- Lan, B.; Li, Y.; Zhao, X.; Kang, J. Industrial-Scale Experimental Study on the Thermal Oxidation of Ventilation Air Methane and the Heat Recovery in a Multibed Thermal Flow-Reversal Reactor. Energies 2018, 11, 1578. [Google Scholar] [CrossRef]
- Lan, B.; Li, Y. Numerical study on thermal oxidation of lean coal mine methane in a thermal flow-reversal reactor. Chem. Eng. J. 2018, 351, 922–929. [Google Scholar] [CrossRef]
- Gosiewski, K.; Pawlaczyk-Kurek, A. Impact of Thermal Asymmetry on Efficiency of the Heat Recovery and Ways of Restoring Symmetry in the Flow Reversal Reactors. Int. J. Chem. React. Eng. 2019, 17, 20180021. [Google Scholar] [CrossRef]
- White, F.M. Viscous Fluid Flow, 3rd ed.; McGraw-Hill: Singapore, 2006. [Google Scholar]
- Brown, G.O. The history of the Darcy-Weisbach equation for pipe flow resistance. Environ. Water Resour. Hist. 2002, 38, 34–43. [Google Scholar]
Publisher’s Note: MDPI stays neutral with regard to jurisdictional claims in published maps and institutional affiliations. |
© 2022 by the authors. Licensee MDPI, Basel, Switzerland. This article is an open access article distributed under the terms and conditions of the Creative Commons Attribution (CC BY) license (https://creativecommons.org/licenses/by/4.0/).