Article

Experimental and Numerical Study on the Elimination of Severe Slugging by Riser Outlet Choking

1
School of Low-Carbon Energy and Power Engineering, China University of Mining and Technology, Xuzhou 221116, China
2
State Key Laboratory of Multiphase Flow in Power Engineering, Xi’an Jiaotong University, Xi’an 710049, China
*
Author to whom correspondence should be addressed.
Energies 2022, 15(19), 7284; https://doi.org/10.3390/en15197284
Submission received: 26 August 2022 / Revised: 18 September 2022 / Accepted: 26 September 2022 / Published: 4 October 2022
(This article belongs to the Special Issue Challenges and Research Trends of Multiphase Flow)

Abstract

:
Severe slugging is an unstable multiphase flow pattern occurs in a pipeline riser with low gas and liquid flowrates. It is highly undesired in practical operation because of the pressure and mass flow oscillations induced. Riser outlet choking has shown effectiveness in eliminating or reducing the severity of the slugging. This work presents an experimental and numerical study on the elimination of severe riser-induced slug by means of riser outlet choking. The test loop consists of a horizontal pipeline with 50 mm i.d. and 15 m in length, followed by a downward inclined section and a vertical riser of 2 m. It was found that by choking the flow at riser outlet, flow pattern in the riser changes from severe slugging first into slug flow and then into bubbly flow. The recognition of the flow regimes was basically according to the trends of the riser base pressure. The flow patterns were characterized in terms of pressure at riser base, as well as liquid holdup at riser top. A numerical model was developed accordingly using OLGA to investigate the dynamic behavior in the process of riser outlet choking.

1. Introduction

In the offshore petroleum industry, hydrocarbons are usually transferred from the subsea pipeline to the facilities at platform by means of upward risers [1]. Since the mixture of crude oil and natural gas are often transported simultaneously in the pipelines with complex configuration, a variety of gas-liquid multiphase flow patterns can be assumed and severe slugging is one of the most common phenomena [2]. It is a cyclic process characterized by four repeating processes, i.e., slug development, liquid production, gas penetration into the riser, and liquid fallback [3]. Severe slugging has been studied extensively by many researchers, both in vertical risers [4,5,6,7,8] and in flexible risers [9,10,11,12,13]. It is widely agreed on that the blockage of the passage of pipeline gas into the riser is the essential condition for the formation of slugging. During liquid production, the pressure of the gas blocked in the pipeline increases as the head of liquid slug propagates towards the outlet. Once the pipeline pressure is sufficient to overcome the hydrostatic head of the liquid slug, gas in the pipeline will expand into the riser vigorously, and consequently, a blowout will occur. Finally, the remaining liquid in the riser falls back to the base and the four stages described above repeats [14].
Severe slugging in subsea pipeline might induce operational problems. The rapidly moving liquid slugs apply a complex load on the riser with variable bending stresses and flexural deflections [15,16]. Consequently, the dynamic response of flexible risers excited by slug flow results in cyclic fatigue stresses, which might cause fatigue damage at a point of cyclic fatigue stress concentration [17,18,19]. In addition, severe slugging generates long liquid slugs with a length more than one riser-pipe heights in each individual period, which could cause flooding of the gas-liquid separator [20]. Because of the negative impacts it poses to the entire oil and gas production system, this type of riser-induced slugging is undesired in operation. As offshore petroleum exploration is heading into deeper waters, and the problems are expected to be even worse considering the length of the risers. Therefore, being able to address this issue is of great importance.
The elimination or suppression of severe slugging has been studied extensively and many methods have been presented. Gas lift is one of the methods for the current applications [21]. External gas from platform is injected into the bottom of the riser, causing flow regime transfer from slug flow to dispersed bubbly flow or annular flow, depending on the amount of the gas injected [22]. However, it is not an economical approach for field operations since gas injection requires a large compressor and a pipe transporting gas to riser base. Moreover, potential problems like Joule-Thomson cooling may be caused [23]. Backpressure increase is another solution for eliminating of severe slugging [24]. By increasing system pressure, liquid holdup in pipeline increases, which in turn decreases gas holdup. Therefore, the area occupied by severe slugging in the flow pattern map will be decreased and slugging occurs at lower gas and liquid velocities. However, it is not considered as a feasible option for offshore platform especially those in deepwaters, since the increase in system pressure would significantly reduce the production capacity of the reservoir. Slug catchers installed at the exit of the pipeline accommodate slugging by means of separating the phases [25]. Besides, they also serve as a temporary storage for liquid received. Nevertheless, it is not viable for offshore platform due to the drawbacks of its huge weight and volume.
Recently, there are several new solutions proposed to address severe slugging issue, such as by pass [26], venturi [27], and helical pipe device [28]. Detail of the frequently used technologies for severe slugging attenuation can be found in Mokhatab et al. [29].
Among the above solutions, riser topside choking is a relatively effective and economical slug-mitigation option. Schmidt et al. [23] found that steady flow can be obtained provided that the gas in the riser is suppressed before it approaches the choking valve. This method was verified in a theoretical way by Taitel [30]. Bendiksen et al. [31] performed a study on terrain-induced slug and its suppression by riser outlet choking. Farghaly [32] conducted a study in a functioning offshore pipeline and concluded that flow stability in a riser can be eventually formed by careful choking. Jansen et al. [22] carried out an experimental study on a low-pressure facility and pointed out that choking is able to reduce the severity of severe riser slug effectively, and thus, suppress the gas expansion velocities by increasing the back pressure. However, in spite of the achievement, it is found that the mechanism of choking is not understood thoroughly. The previous studies have focused primarily on flow stabilities and less attention has been paid on the flow structure development in the process of choking; therefore, flow patterns induced by topside choking have rarely been investigated and reported.
In terms of the numerical simulation, there are a number of studies comparing experimental results with transient code predictions [9,11,24,33]. Park et al. developed a model-based automatic controller by estimating the transfer function utilizing the OLGA model [34]. Elimination of severe slugging was achieved while increasing the flow rate than the case with manual choking. De Azevedo et al. investigated stability for severe slugging including self-lifting by using a stability solver, in which a numerical linear stability analysis was applied to a mathematical model for flow in a pipeline riser system [35]. Nevertheless, research on the ability of simulators to describe the detailed characteristics of the flow regimes induced by choking has rarely been reported to the best knowledge of the authors. Comparisons between experimental results and numerical simulations are still highly needed to overcome the challenges to the code for the simulation of riser topside choking on the elimination of severe slugging in a complex pipeline. This would also contribute to a better accuracy of predictions.
This study presents the experimental and numerical results of the elimination of severe riser-induced slug by choking at the riser outlet. In what follows, the experimental design is described in Section 2; Section 3 presents the model developed based on the OLGA code; details of the experimental investigation and numerical predictions are presented in Section 4; and finally, the major findings of this paper are summarized in Section 5.

2. Experimental Design

2.1. Test Loop

The experimental test rig mainly consists of four parts: the water and air supply devices, measurement and choking devices, test section, and gas-liquid separator, as is shown in Figure 1. The test section with 50 mm I.D. consists of a horizontal pipe (15 m), a downwardly inclined pipe (−2°, 2 m), and an upward vertical riser (2 m). The test loop was made of transparent plastic material so that the flow in the loop can be observed visually. A manual ball valve with 50 mm I.D. was also included at the top of the riser. The choke valve has an approximate equal percentage flow characteristic.
In this study, water and air were used as the working fluids. Tap water was supplied by a centrifugal pump with a capacity of 20 m3/h. Compressed air supplied by a screw compressor was filtered before being introduced into the gas-liquid mixer. A maximum gas volumetric flowrate of 180 m3/h at in situ conditions can be reached. A buffer tank was employed to prevent the instabilities introduced by the screw compressor. After being tested, the working mixtures were discharged into a separator. To reduce the siphon effect [28], the mixture was separated immediately after testing. After being separated, the liquid phase was pumped back to the storage tank.

2.2. Measurement Techniques

The water and air velocity were measured by rotermeters. The measurement devices were carefully calibrated before performing the experiments. In order to identify the flow patterns, the pressure at the base of the riser was recorded and investigated, since the riser bottom pressure essentially contains sufficient information of the development of the flow in the test loop. Keller pressure transducers (accuracy 0.1%) installed at the riser base was used to measure the pressure. In addition, inlet pressure is also monitored for reference of phase velocities to pipe conditions.

3. OLGA Model

An OLGA simulator was used to build a transient model of the test rig described in Section 2. The numerical simulations were carried out with an attempt to find out to what extent the dynamic behavior of the flow regimes induced by choking can be reproduced by the OLGA software. OLGA is one-dimensional, commercially available software [36]. It was developed according to the two-fluid model developed by Bendiksen et al. [37]. This model comprises three separate mass balance equations for gas, continuous liquid film, and liquid droplets, respectively. These three equations are coupled by interfacial mass transfer terms. Additionally, two momentum balance equations are also used: one is for the continuous liquid phase, while the other is for the combination of gas phase and possible liquid droplets. An OLGA model mainly consists of three parts, i.e., a pipeline model, fluids’ PVT description, and the specifications for the boundary conditions.

3.1. Pipeline Riser Model

The geometry model was built according to the experimental test loop. Table 1 gives the properties of the pipe. It should be noted that a horizontal lead with 1 m in length at the riser outlet was also included in the geometry model to avoid numerical instability [9,13]. In the model, the pipe was discreted such that there were at least two elements in each individual pipe section.

3.2. Fluids PVT Description

The properties of air-water mixtures were calculated by PVTsim, with air treated as a mixture of oxygen and nitrogen. The equation of Peng and Robinson [38] was used for the determination of PVT behavior. In order to prevent the PVT table error, a wide range of pressure and temperature limits were determined as inputs to the PVT table [29]. The range of pressure was from 0.5 to 20 bar, and temperature from 5 to 50 °C.

3.3. Boundary Conditions

To simulate the instabilities correctly, it is required to specify the boundary conditions sufficiently close to the behavior of the real operations. In a conventional manner for simulation investigations of multiphase pipelines using OLGA, the boundary conditions of the model are specified at the inlet with a constant mass flowrate and at the outlet with constant pressure. The simulations were performed at a constant outlet pressure equals to the average separator working pressure, i.e., 101 kPa, in this study. The temperature of working fluid in the present model was kept at a constant value of 20 °C. Besides, mass and heat transfer between the external environment and the testing fluid was not considered for convenience. The Frozen model is used to calculate the critical flow through the choke. The choke opening was set according to the experiments. In the simulation, the flow characteristic of the choke valve was incorporated in the model.
In this simulation, the time step varied in the range of 0.001–0.2 s. The minimum value was set to ensure actual simulation times, while the maximum was set to avoid the errors caused by pressure and volume temperature (PVT) table [13]. Initialization data were determined to assure convergence of the calculation in the start stages of simulation.

4. Result and Discussion

Severe slugging, slug flow, and bubbly flow were observed in the process of riser outlet choking. The experimental campaign and the numerical simulations carried out with gas superficial velocity at in situ conditions UGS = 0.08 m/s and liquid superficial velocity ULS = 0.09 m/s are presented in this study. Experimental data of riser base pressure and outlet liquid production are used to characterize the flow patterns.

4.1. Experimental Results

4.1.1. Pressure Cycling Characteristics

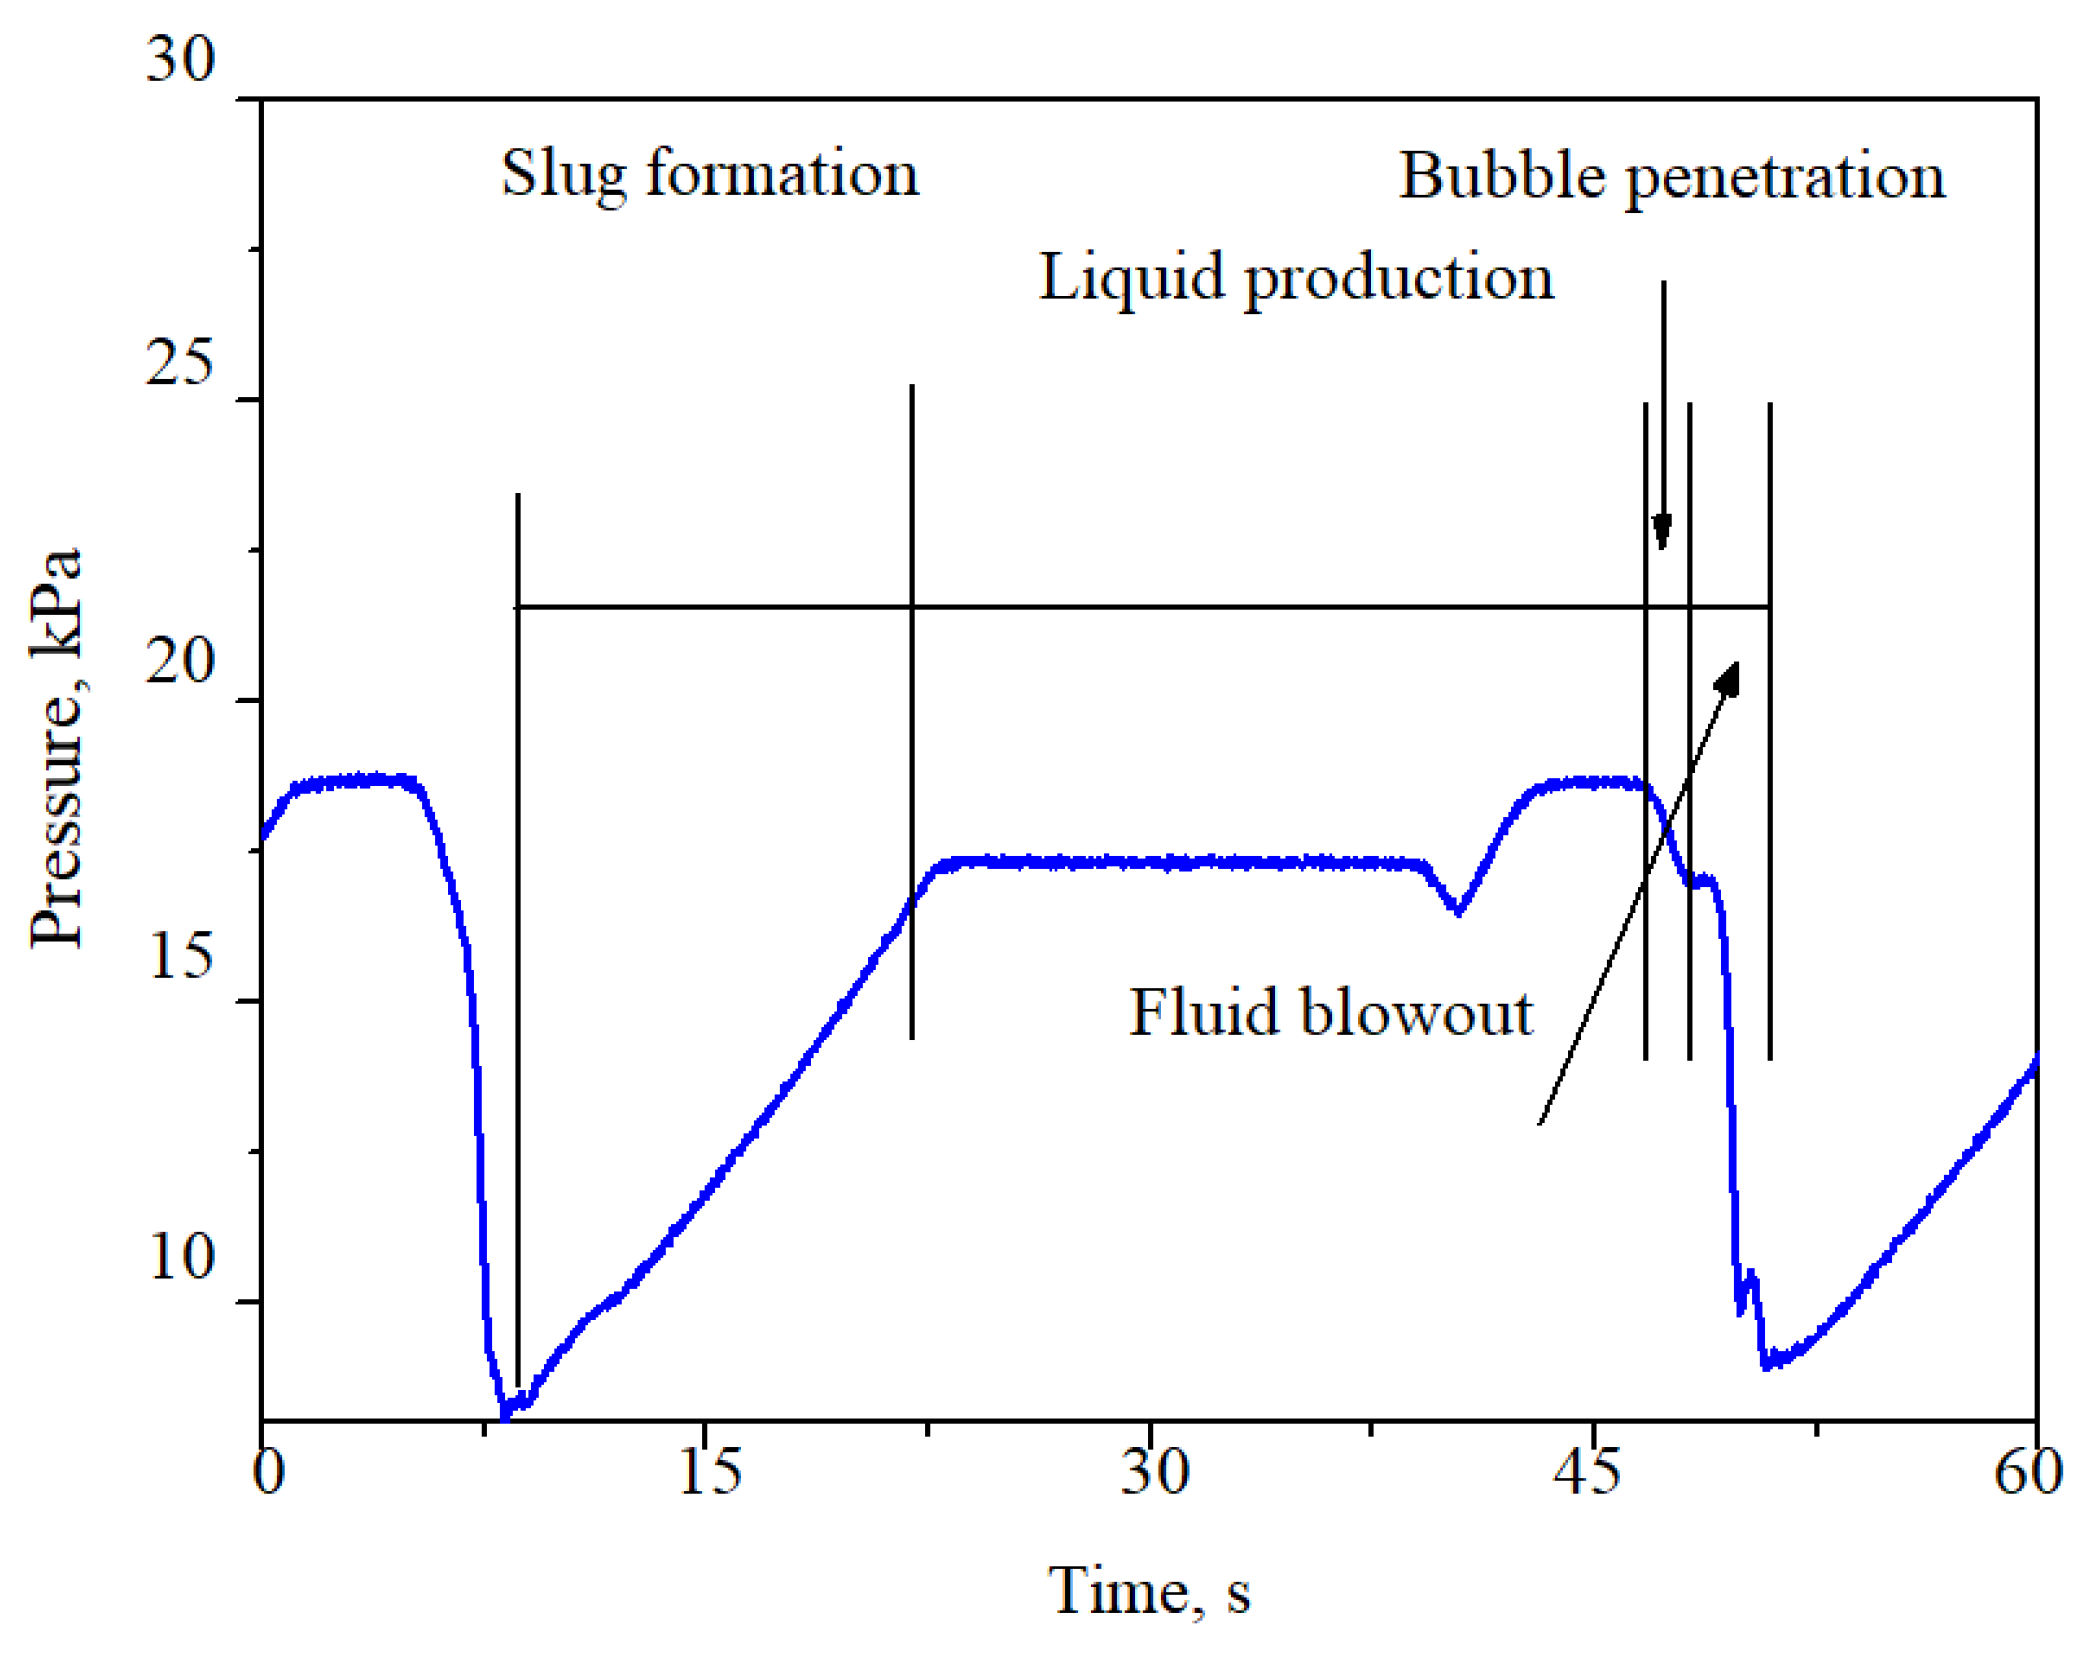
Figure 2 illustrates the experimental result of the riser base pressure profile measured during severe slugging. Similar to the cases in flexible risers, the severe slugging process in vertical riser also comprises four basic stages, including: (1) slug development, (2) slug production, (3) gas penetration, and (4) fluid blowout. In the slug development stage, liquid accumulates at the riser bottom, and thus, the incoming gas is trapped in the pipeline. With continued liquid flow from the inlet, both the slug head in the vertical pipe and the slug tail in the pipeline rise simultaneously. Simultaneously, the pressure of the gas blocked in the pipeline increases with slug head rising along the riser. Consequently, slug production starts and the tail of the slug in the pipeline begins to move towards the bottom of the riser. In the process of slug production, the riser bottom pressure is constant, whereas the pressure of the blocked gas increases. Once the gas pressure is sufficient to overcome the liquid column in the riser, gas penetration into the riser occurs and the volume-averaged void fraction in the riser increases, resulting in a decrease in the hydrostatic pressure. The steady increase in pressure corresponds to slug formation, and the sharp decrease is caused by gas blowout. The stage of riser base pressure operating at a constant valve, i.e., 21 kPa in the experiments, indicates the stage of pure liquid slug delivery.
It is worth noting that compared with severe slugging in an S-shaped riser where gas blowout is initiated by gas penetration into the upper limb [11,29], fluid blowout occurs immediately after the penetration of gas into the vertical riser. As can be seen from Figure 2, the drop of riser-base pressure during the stage of slug production indicates gas intrusion.
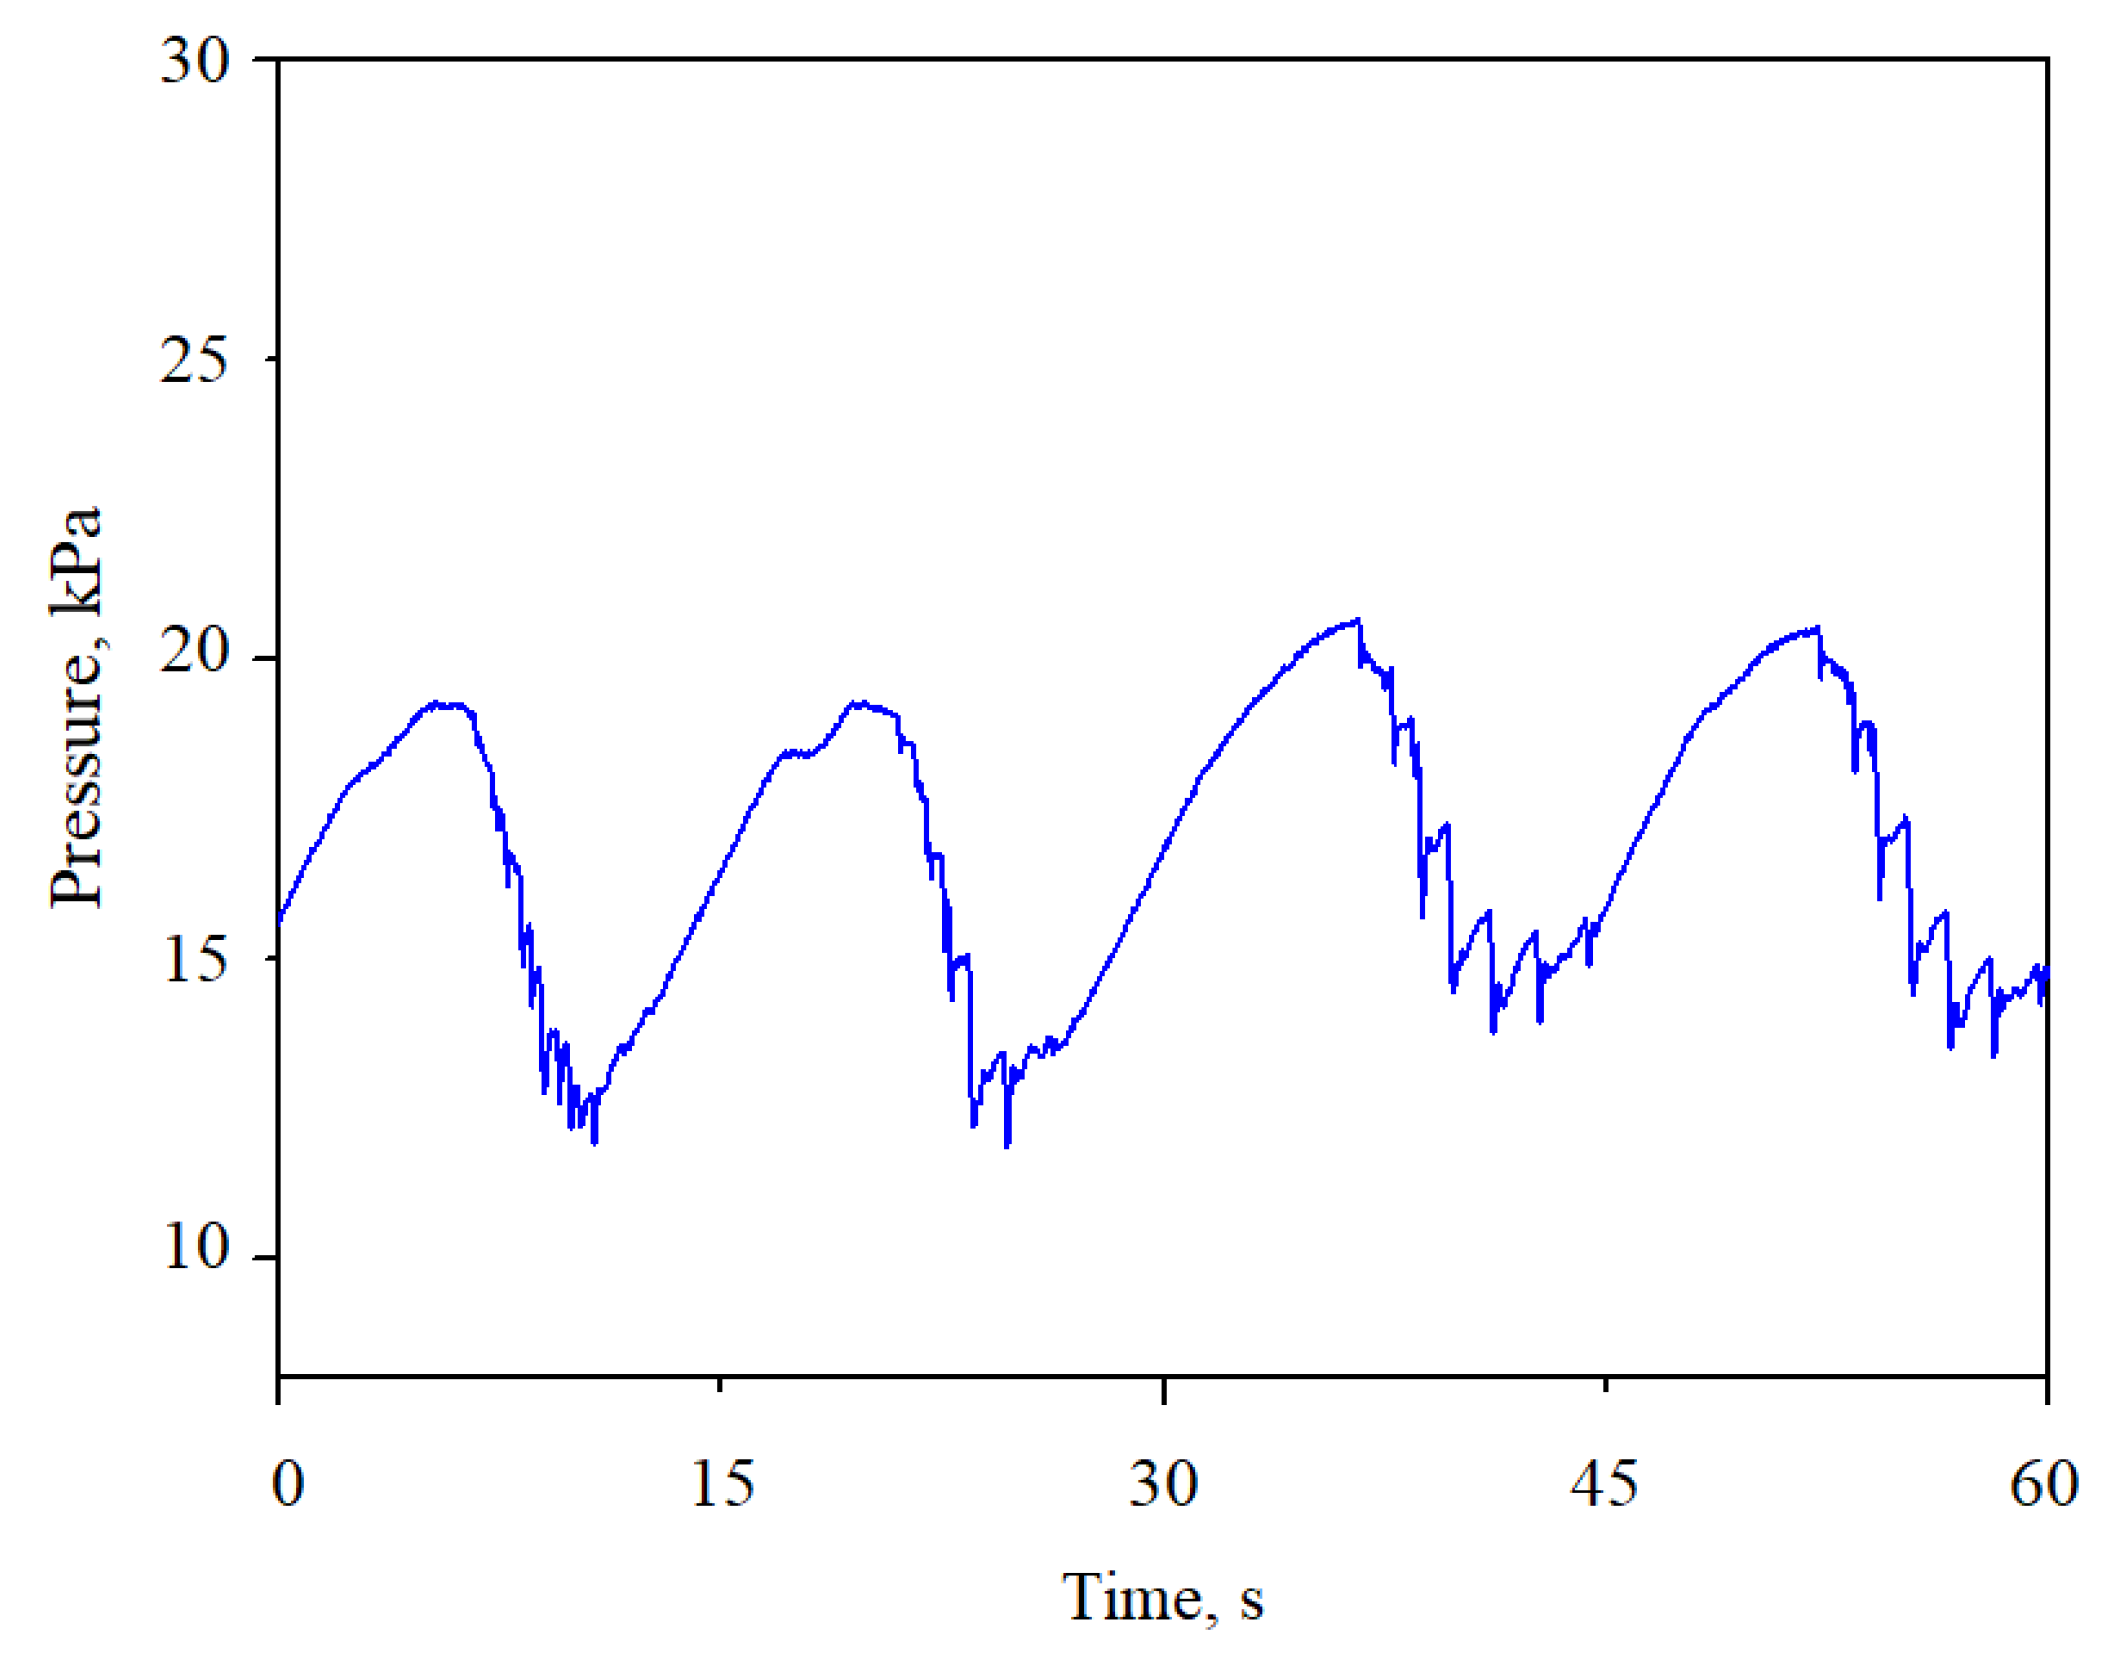
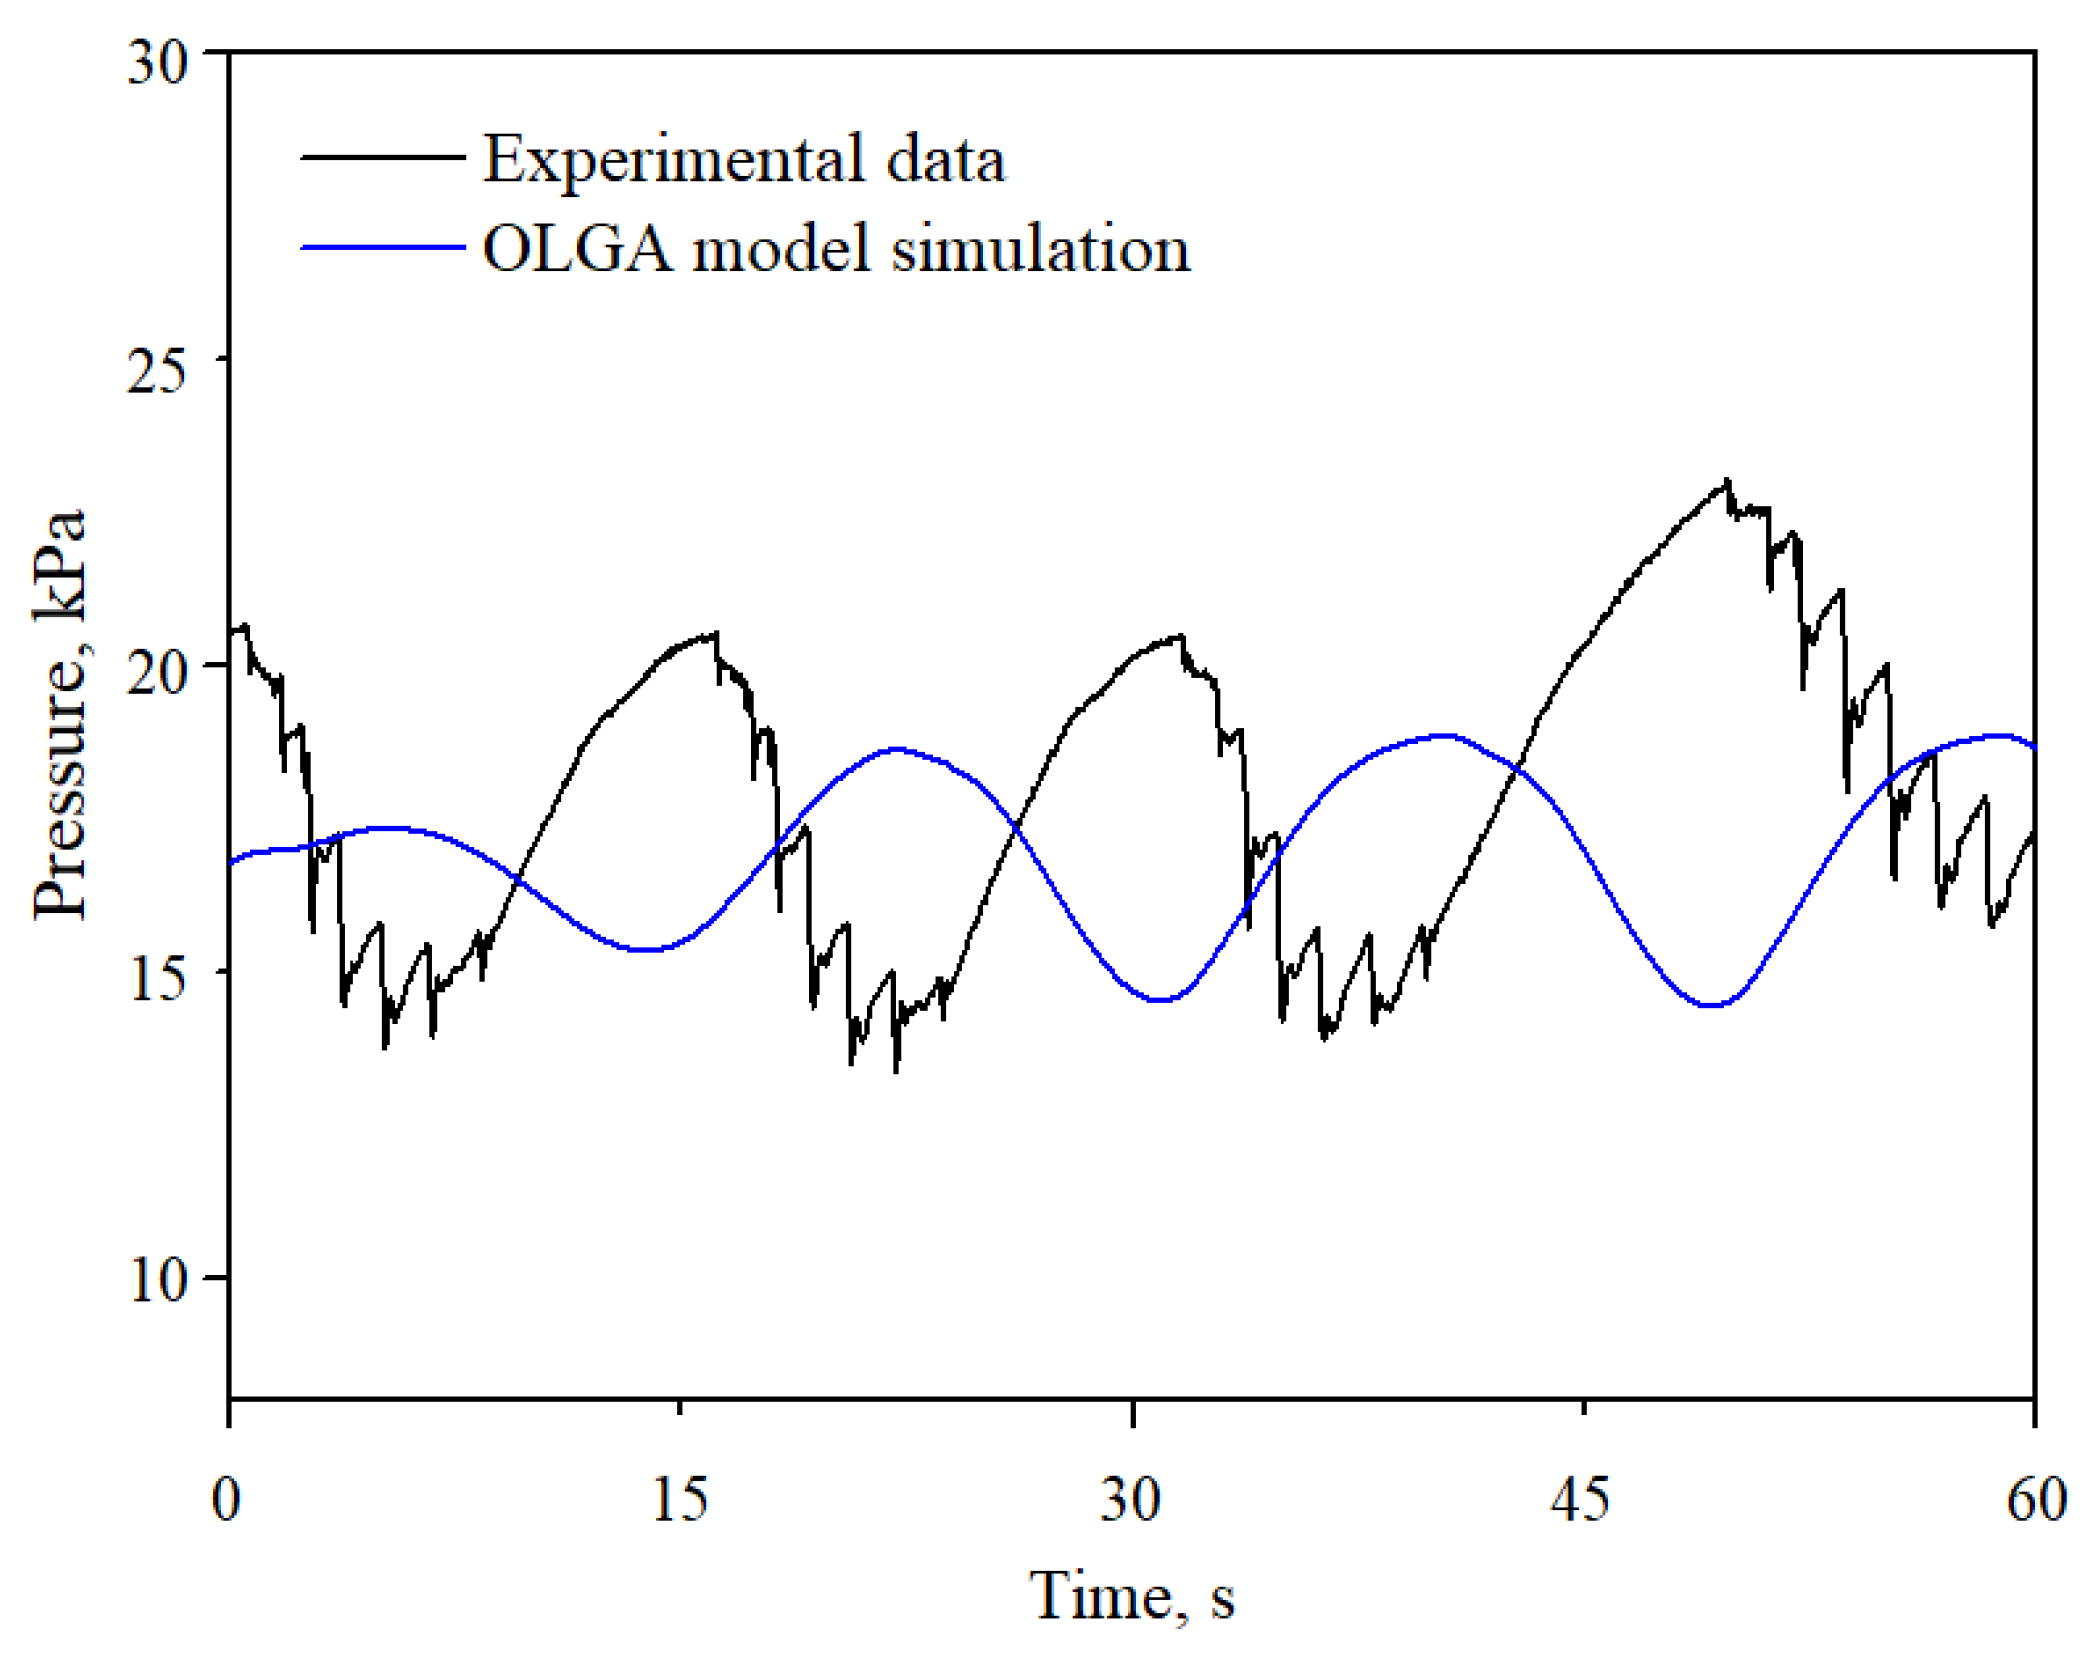
Figure 3 shows the experimental result of riser-base pressure during choking-induced slug flow. It can be seen that the measured pressure first reaches its maximum value and then begins to decrease. The cycle time of slug flow is also found to be lower than that of severe slugging.
As mentioned above, during severe slugging operation, a great amount of gas flow into the riser vigorously once its pressure is sufficient to counter the hydrostatic head of liquid slug in the riser. The intrusion of pipeline gas tends to lift the liquid slug and results in fluid blowout. However, with a reduction in valve opening to a certain degree, pressure drop over the choke increases, and consequently, causes an increase in back pressure. The back pressure suppresses the expansion of the gas phase trapped in the downward inclined section. Finally, the gas penetrates into the riser in terms of large individual bubble with a spherical cap similar to the Taylor bubble. This causes a substantial increase in pressure drop across the topside valve, which was also observed by Jansen et al. [22]. Therefore, slug acceleration and gas blowout are, consequently, suppressed, leading to the formation of slug flow. Compared with severe slugging, the stage of liquid fall back is absent and the slugs only develop in the riser during slug flow.
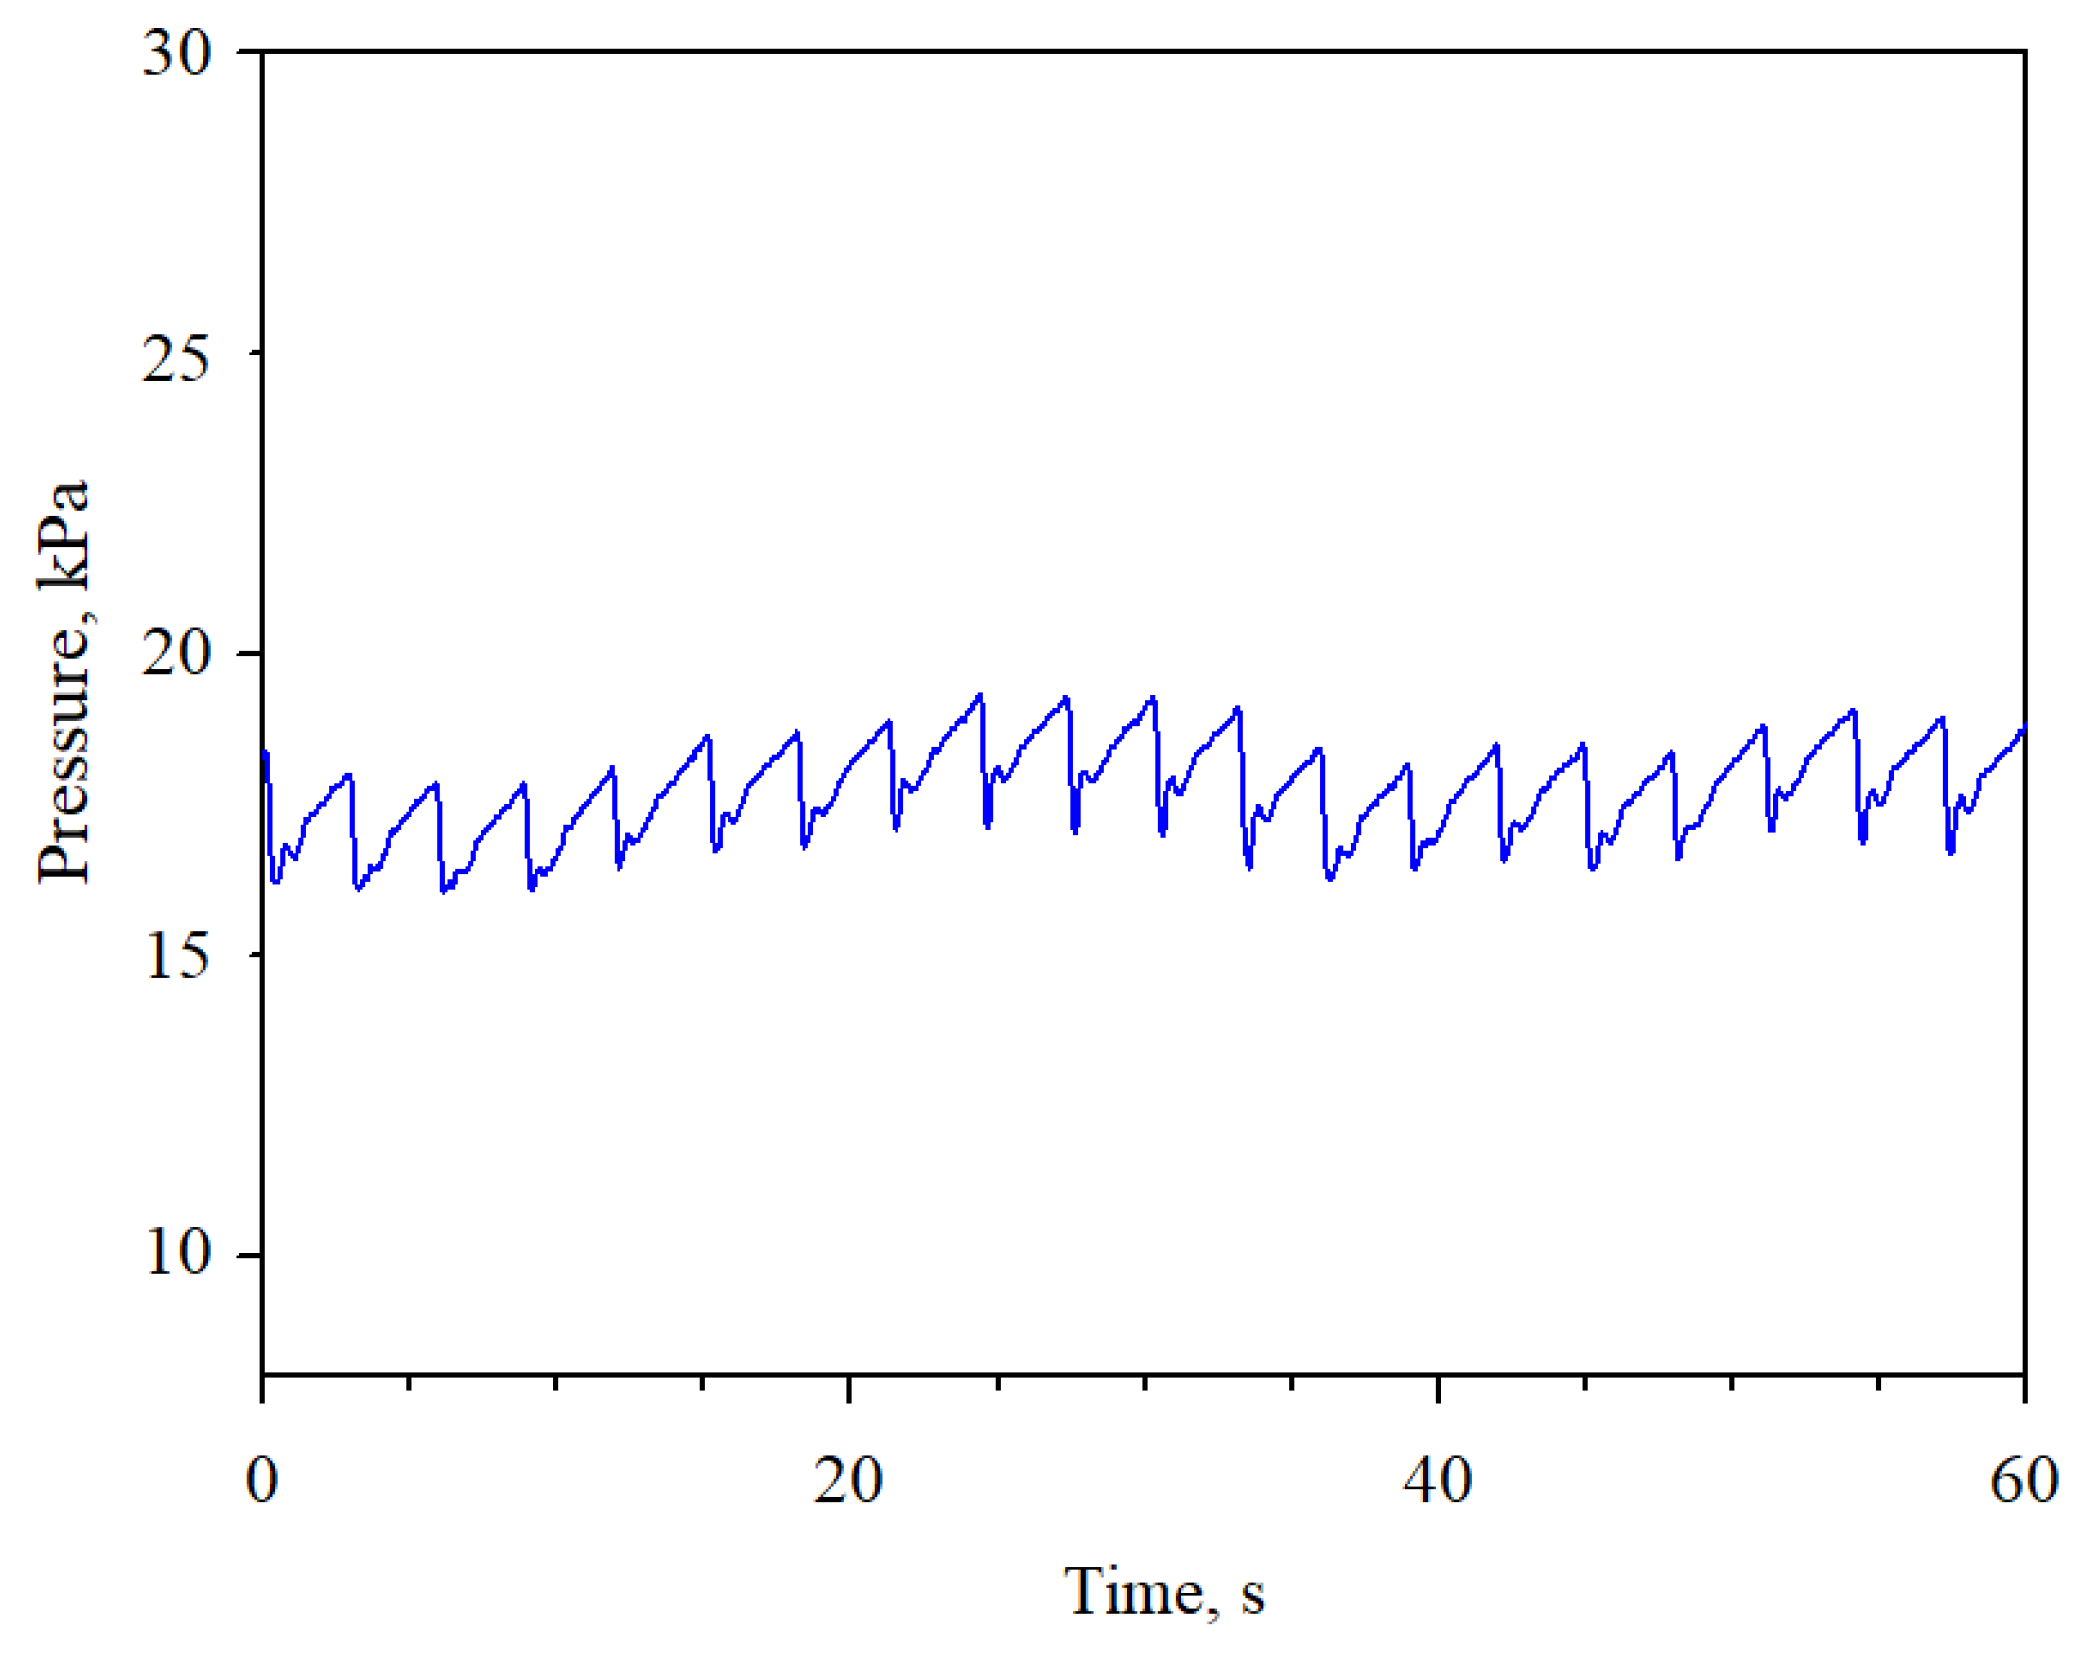
As the degree of choking increased further, the subsequent increase in pressure drop over the choking valve contributes to a substantial increase in the back pressure. As a consequence, the blocked pipeline gas intrudes into the vertical pipe in terms of dispersed small bubbles having different diameters, and thereby, bubbly flow eventually occurs. The measured trace of riser-base pressure during choking-induced bubbly flow is shown in Figure 4. It is observed that the two-phase air-water flow in bubbly flow pattern oscillates roughly stable with irregular fluctuations of small amplitudes. Moreover, pressure fluctuations and cycle time of bubbly flow is extremely decreased compared to those experienced in both severe slugging and slug flow, increasing the slug frequency (Figure 5 and Figure 6). Since the oscillation frequency depends directly on the frequency at which gas bubbles enter the riser, liquid slug during bubbly flow is expected to be shorter in length than those in severe slugging and slug flow.
In a pipeline riser system, the pressure at the inlet is of major interest. Figure 7 presents the response of the maximum pressure at pipeline inlet in the process of choking. It can be observed that for valve opening between 1 and 0.3, the maximum pressure is constant and is insensitive to valve position. For a valve opening less than 0.3, the maximum pressure at the pipeline inlet increases rapidly with valve position reduction.

4.1.2. Liquid Production

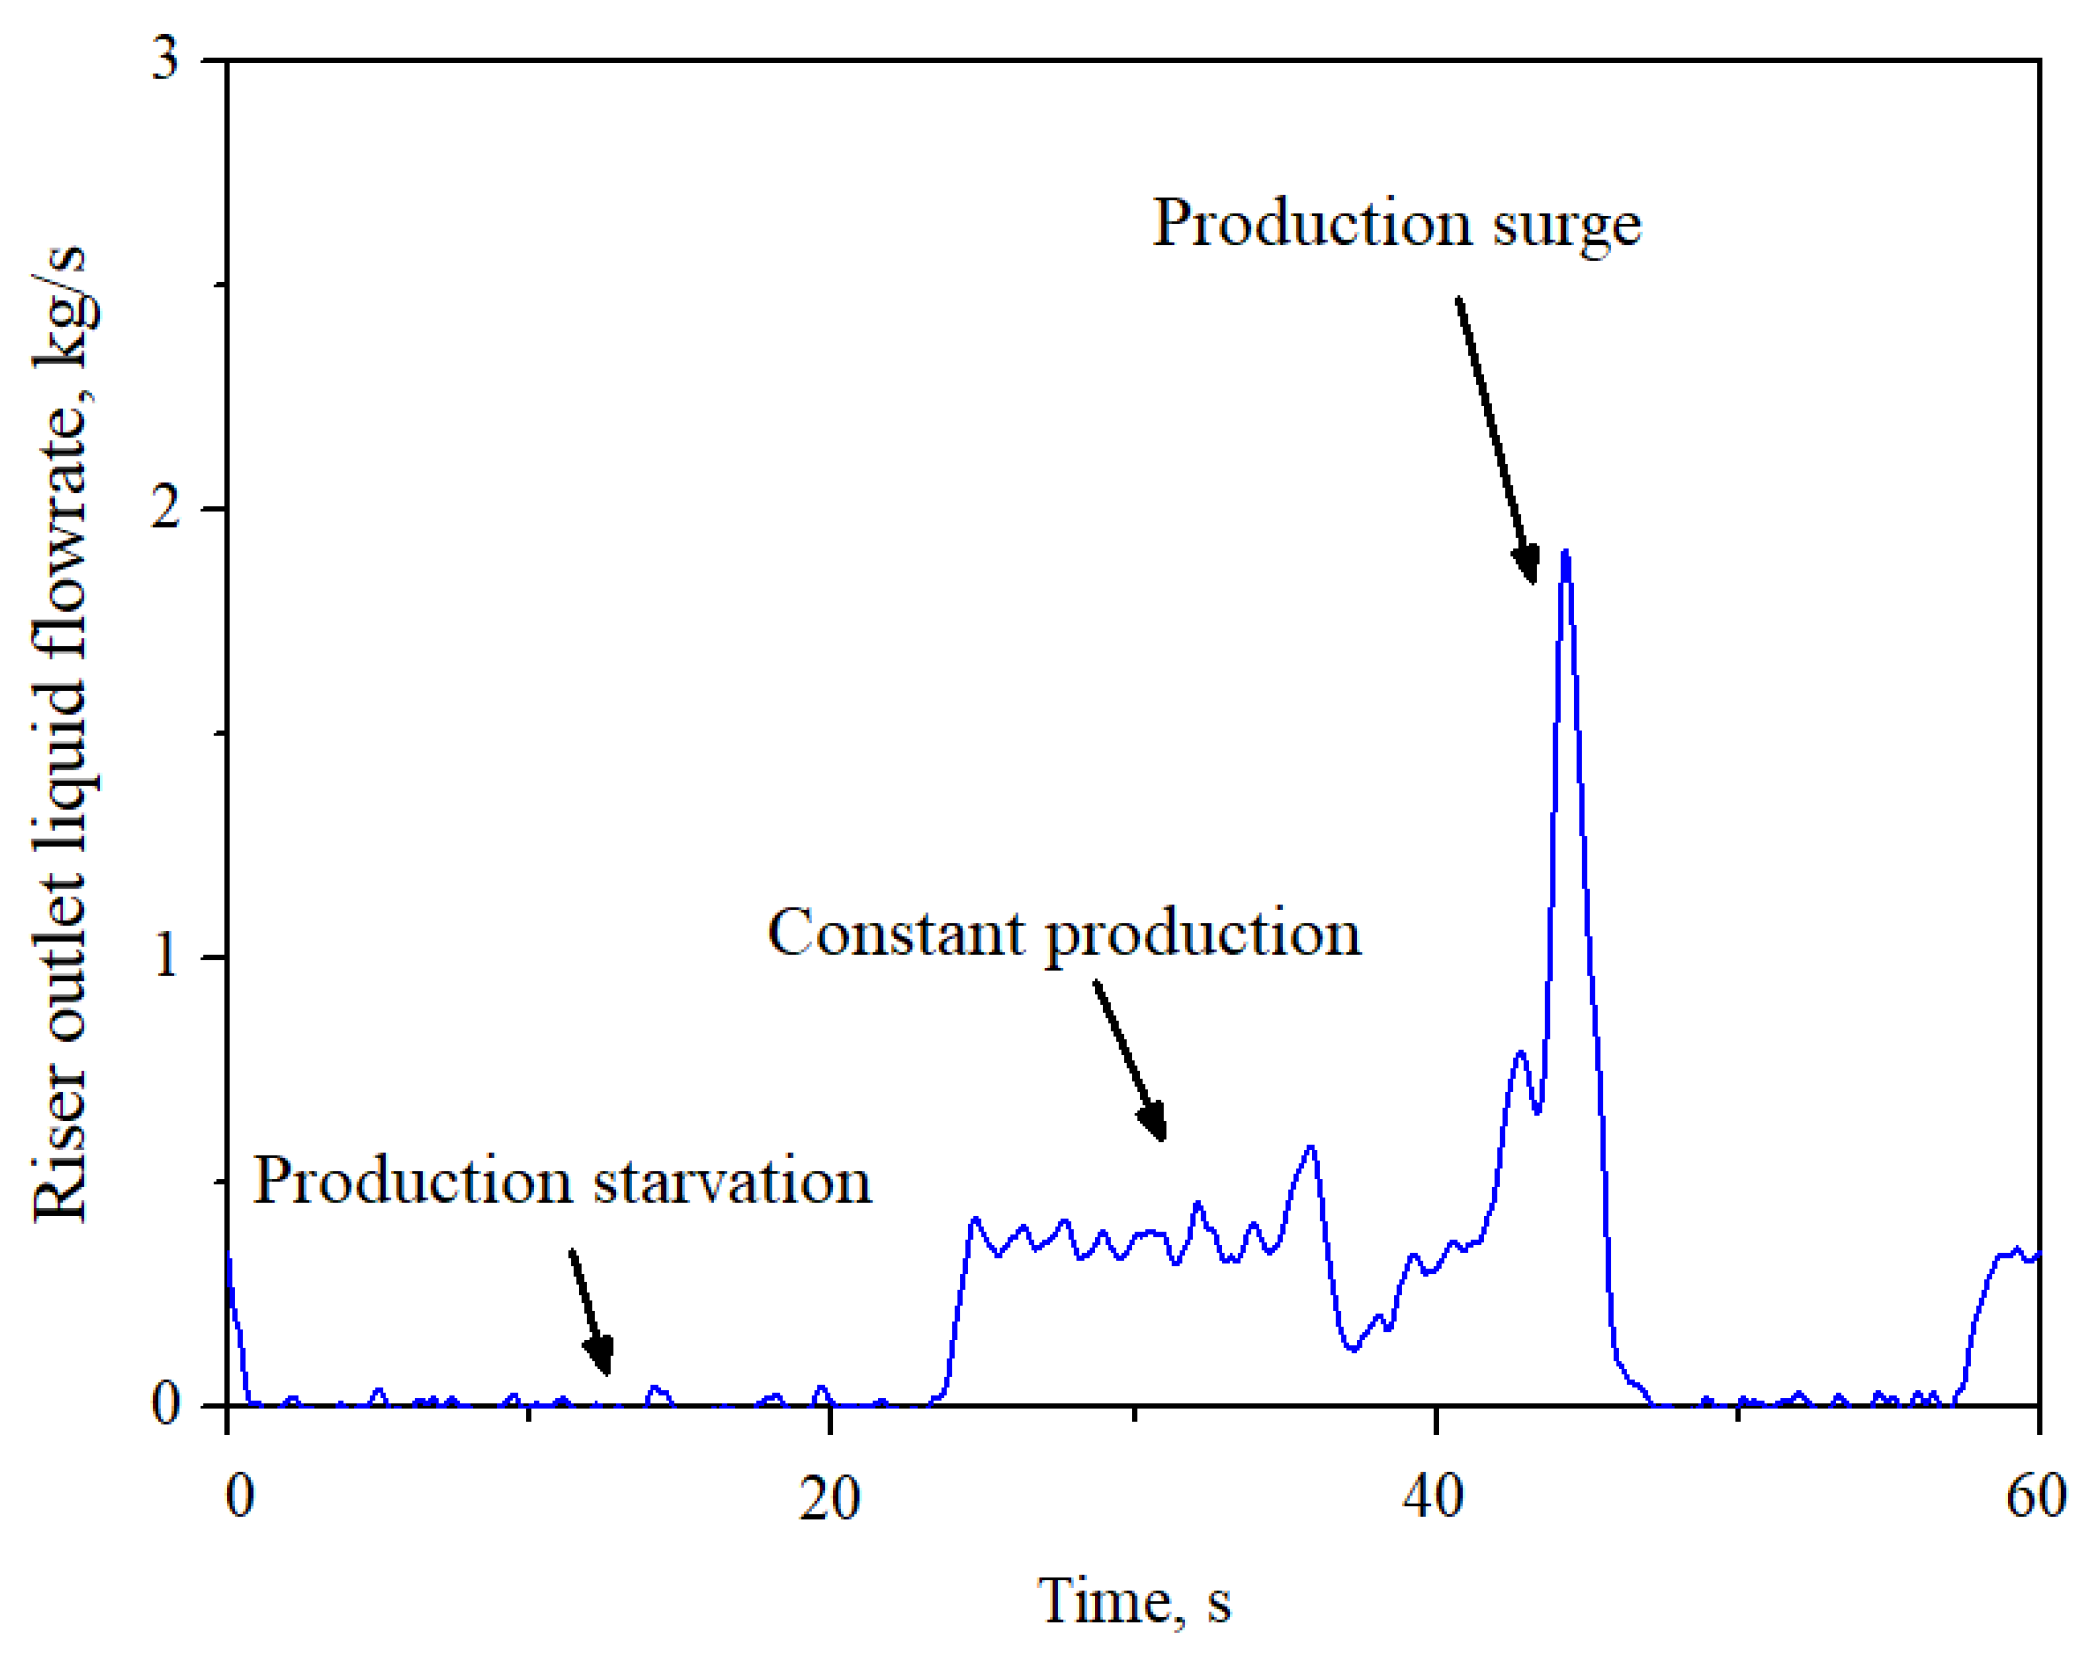
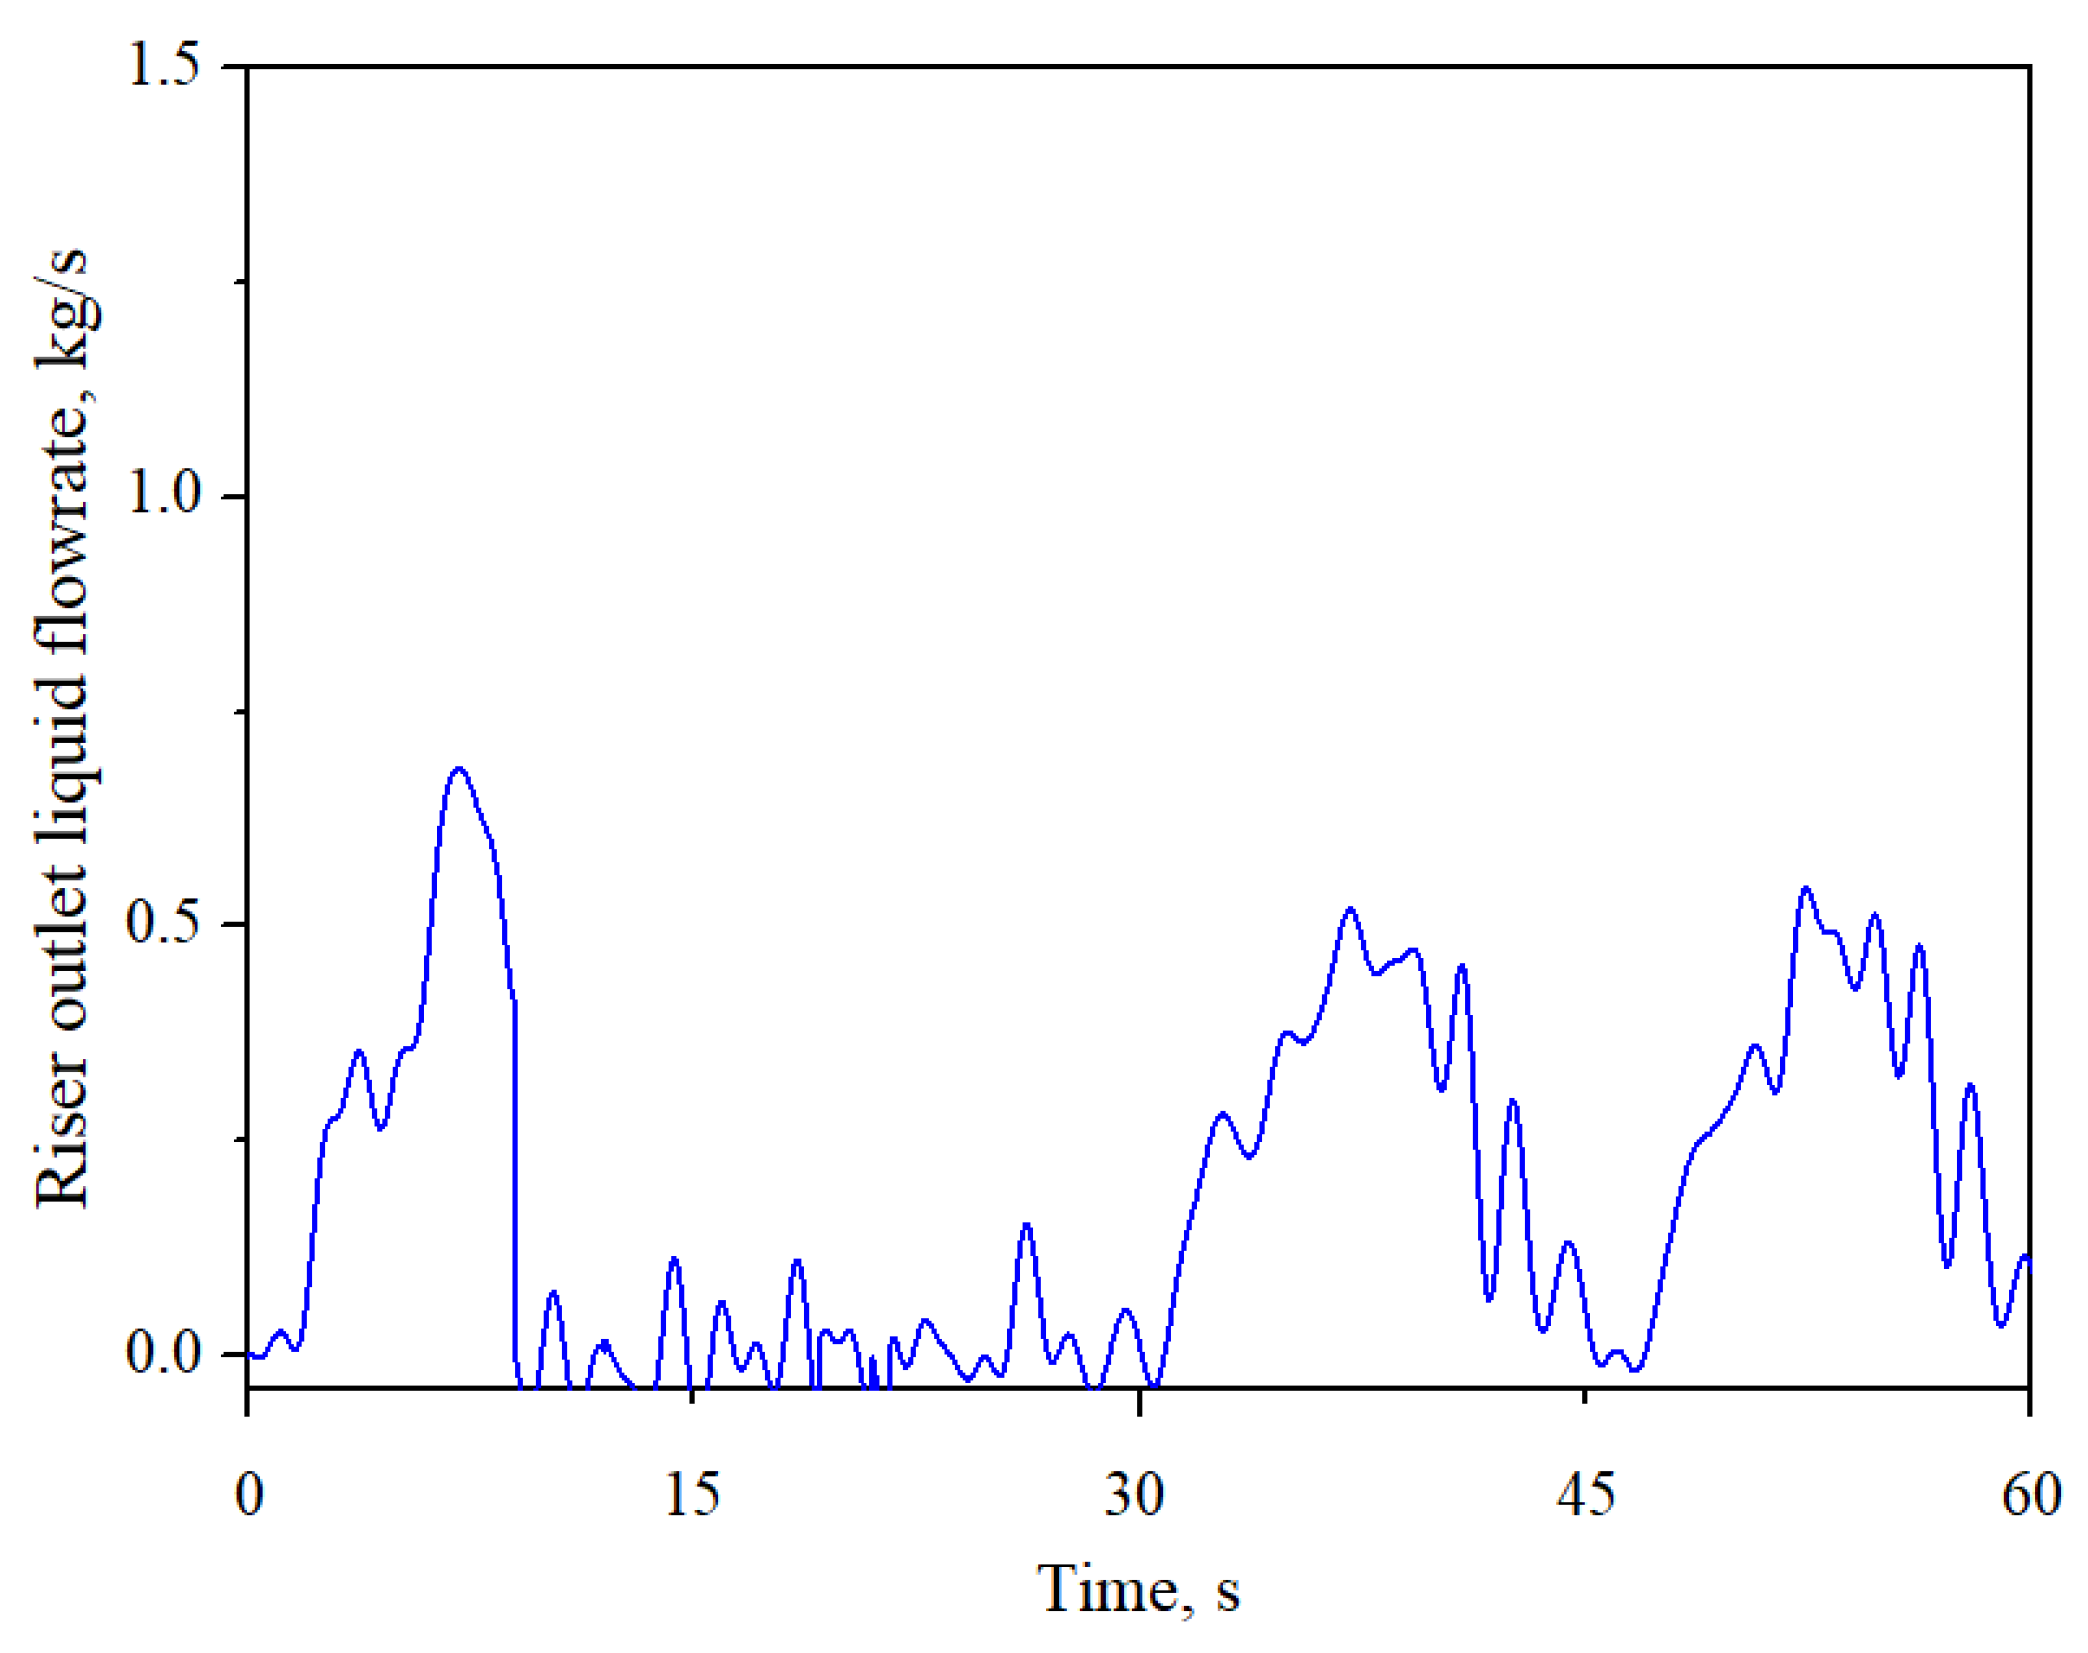
The experimental profile of liquid slug production during the flow of severe slugging is given in Figure 8. The results were obtained based on the analysis of the topside separator mass balance. As can be seen, liquid production in severe slugging is mainly made up of three stages in each individual period: the stage of liquid production starvation, the stage of stable liquid slug production, as well as the transient production. The liquid production starvation stage is due to the stage of liquid slug development, while the constant liquid production is associated with slug production.
In severe slugging, the bubbles in the riser move upward along the vertical pipe, resulting in an increase of the void fraction, and thus, the hydrostatic pressure induced by the liquid slug decreases. Consequently, pipeline gas expands into the riser and causes gas blowout, resulting in the surge production rate. This is inconsistent with the result in flexible riser presented Montgomery [11]. It is obvious from Figure 8 that the maximum liquid flowrate at the riser outlet could be accelerated to several times of that at the constant liquid production stage.
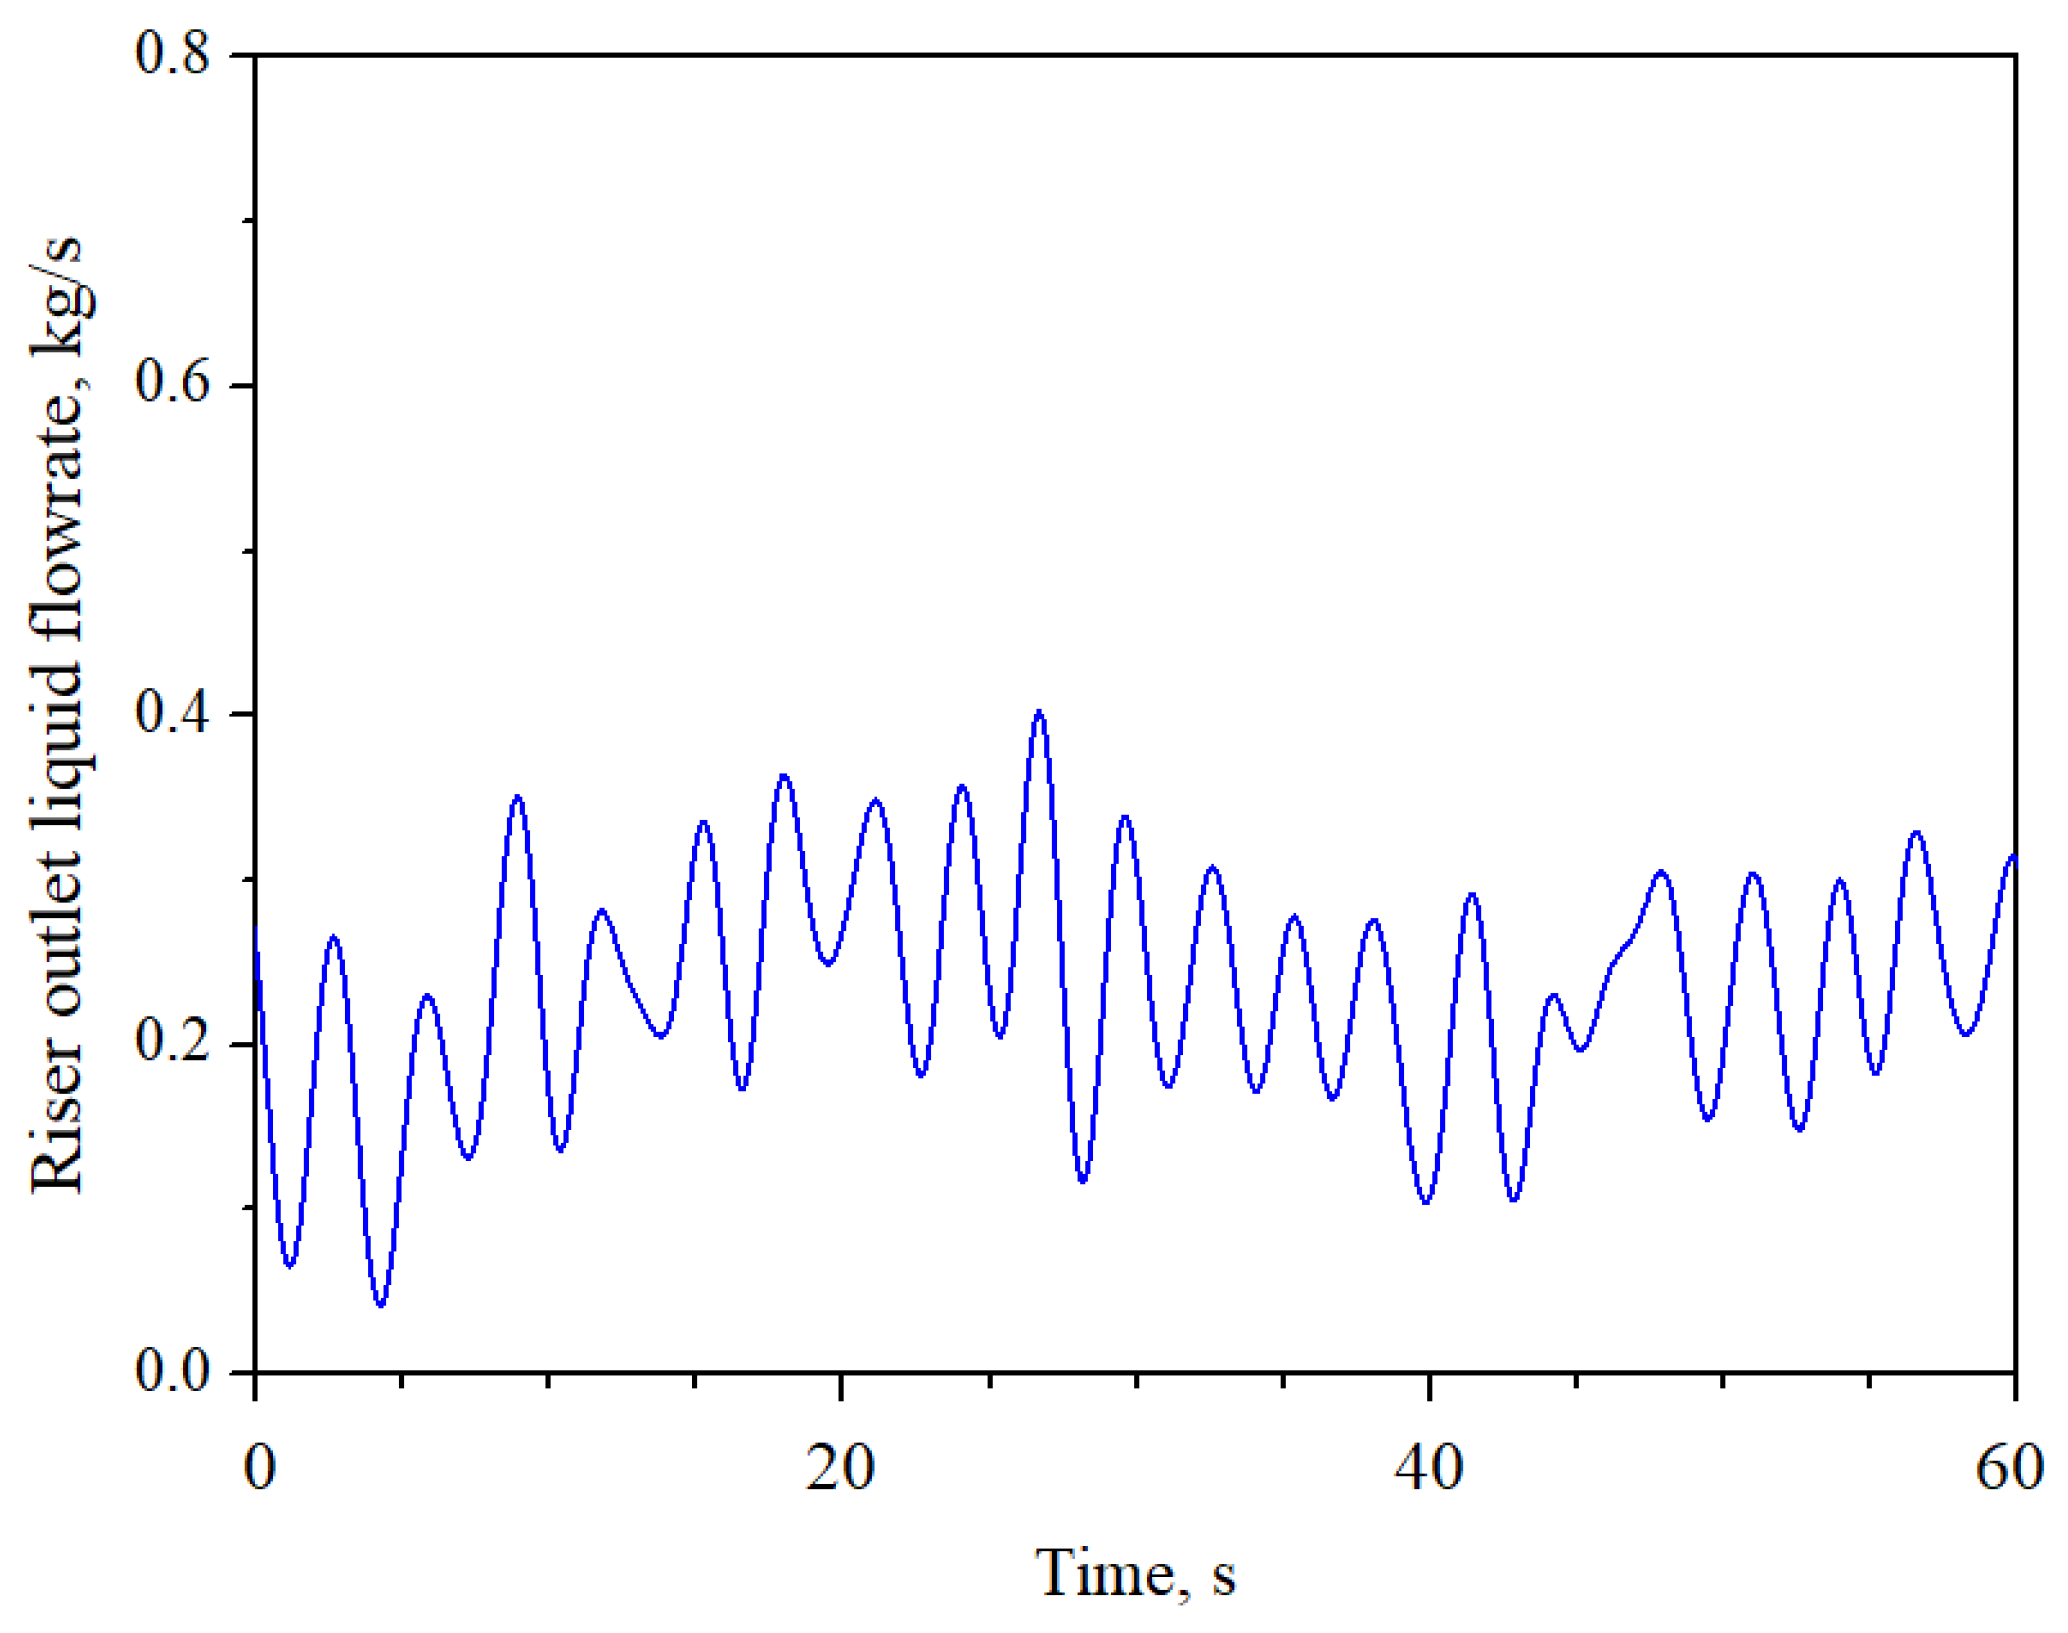
Liquid production profiles during choking-induced slug and bubbly flow are shown in Figure 9 and Figure 10, respectively. As is indicated, the slug production during slug flow is characterized by intermittent transient liquid production.
As can be seen in Figure 10, the bubbly flow does not cause liquid production starvation and transient surges. There is a continuous delivery of liquid from the riser. Since the slug acceleration is counteracted by the increase of the pressure drop over the choking valve, the maximum liquid flowrate at the riser outlet is suppressed. The transient surges caused by the penetration of the pipeline gas into the riser are extremely low compared to those associated with severe slugging.

4.1.3. Liquid Holdup

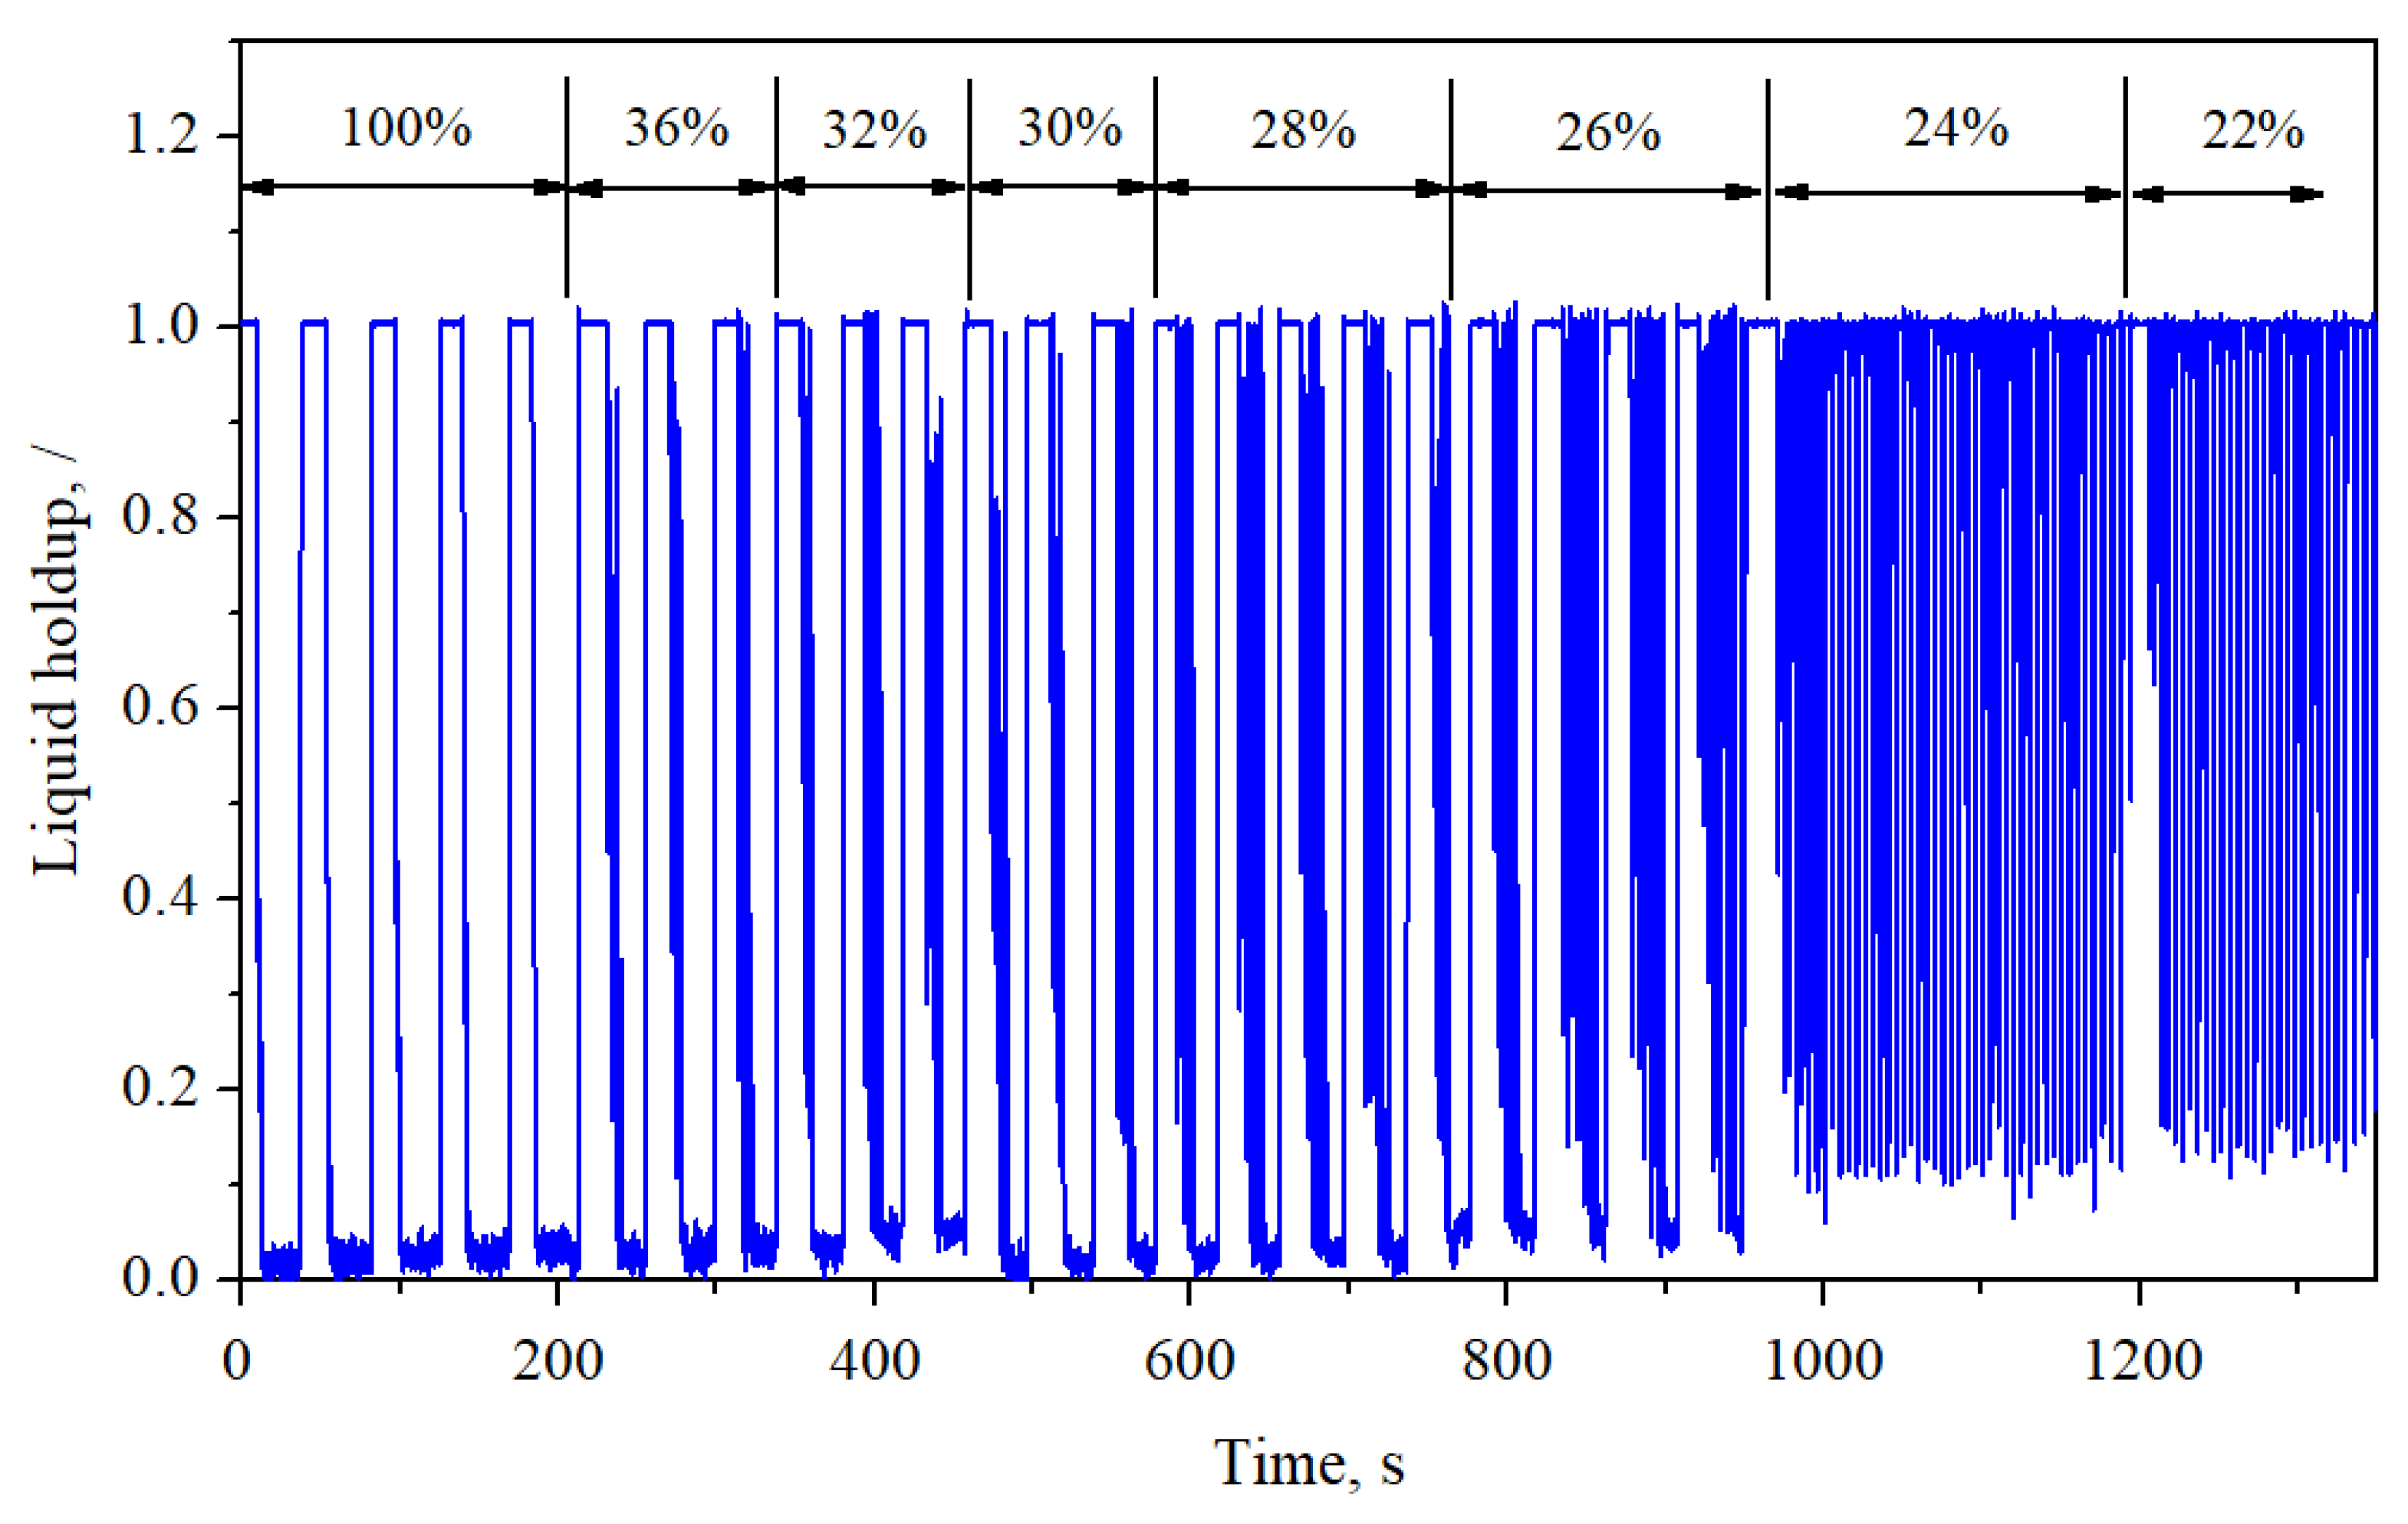
Figure 11 shows the experimental data for liquid holdup at the riser top in the process of riser topside choking. Liquid holdup that equals 0 indicates the presence of gas phase, whereas the liquid phase corresponds to a liquid holdup equal to 1. As expected, the trend associated with the pressure cycling is reflected in the liquid holdup characteristics. The time period of oscillations in the liquid holdup is the same as the one observed in the riser base pressure trace.

4.2. Simulation Results and Comparisons

This section presents the numerical simulations performed for the experimental results. Comparisons between experimental and simulated results for each flow pattern are also given.

4.2.1. Riser Base Pressure Cycling Characteristics

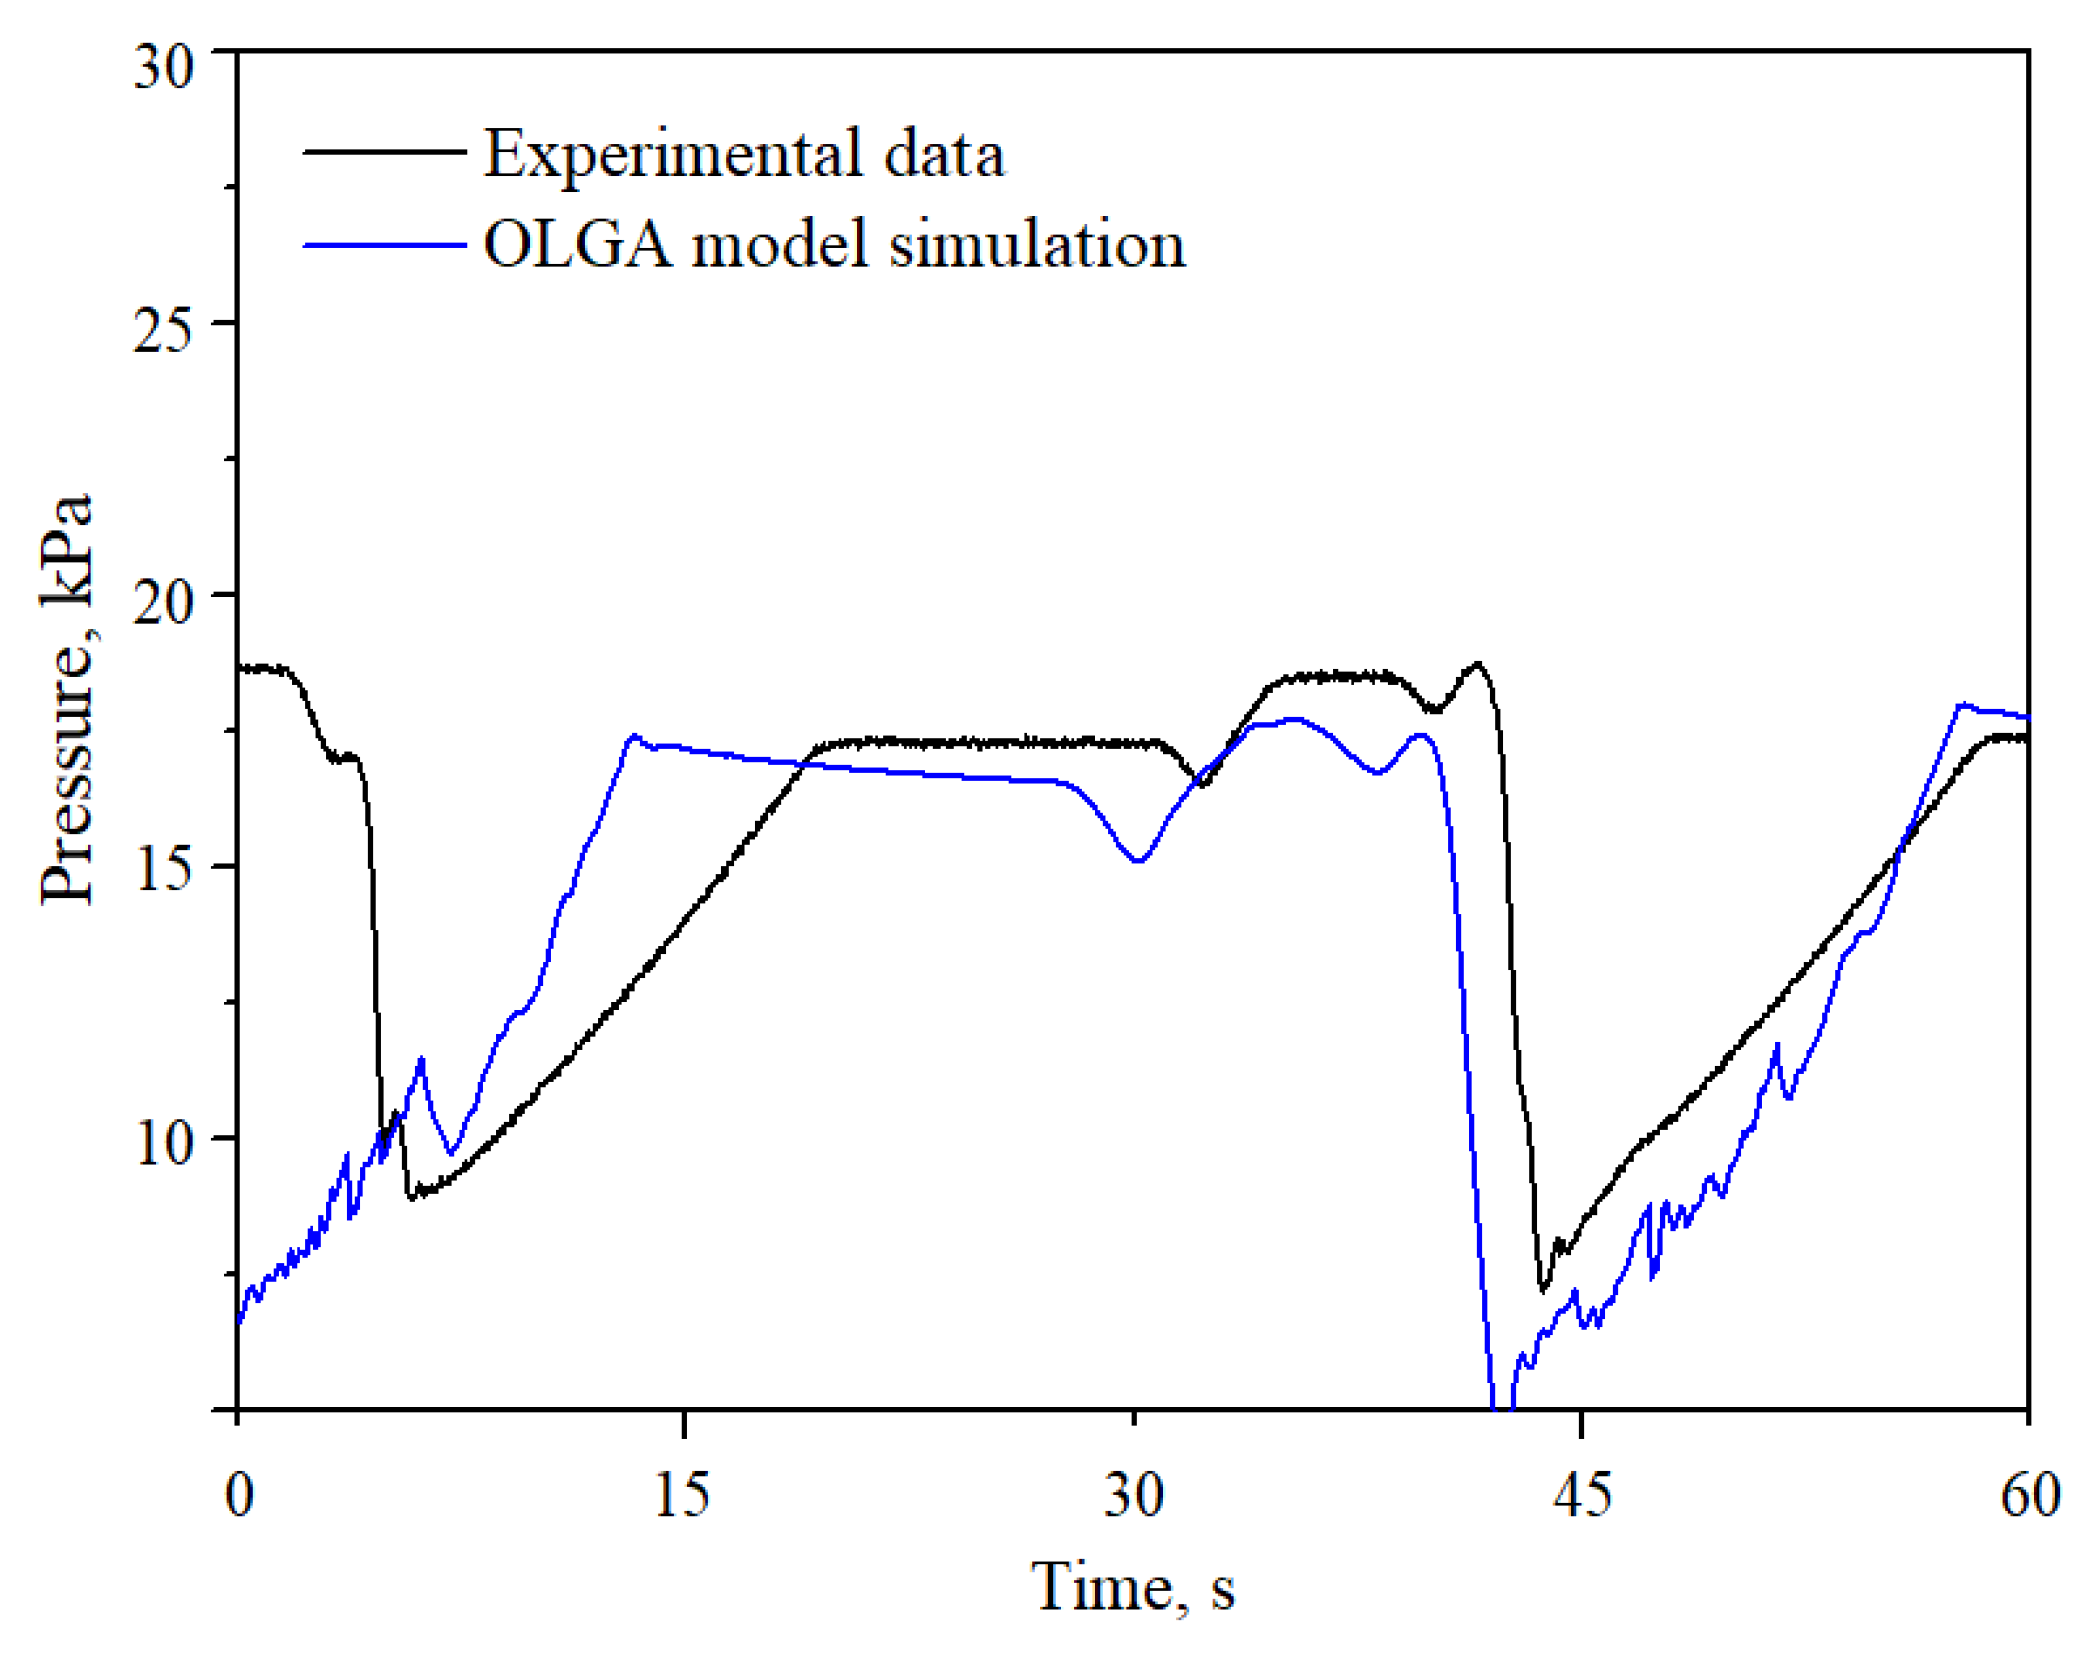
A reasonable agreement with respect to time period during severe slugging can be found in Figure 12. The measured time period is 30 s, whereas the predicted value is 33 s. Note that the feature of multiple gas intrusions into the riser is satisfactorily reproduced by the numerical simulation. However, the simulation underestimates the minimum riser base pressure. The measured value is 7 kPa, whereas the predicted value is 5 kPa. This discrepancy is mainly attributed to the inaccurate estimation of the liquid inventory in the code [9].
Figure 13 compares the numerical and experimental results for pressure at riser-base during choking-induced slug flow. A good agreement can be observed. The measured time period is 15 s, whereas the numerical model predicts a slightly higher value of 19 s. However, the maximum pressure in slug flow was underpredicted, whereas the minimum pressure was overpredicted. This disagreement is also probably due to the inaccurate estimation of liquid inventory in the code [9].
The OLGA model can predict bubbly flow induced by riser outlet choking on severe slugging. The simulation was performed without using slug tracking module in this study, since flow pattern in pipeline was stratified in experiment. Therefore, it is not able to track the rolling wave and pseudo slug in pipeline. As a result, stable smooth pressure was produced by OLGA in bubbly flow, as indicated in Figure 14.
Figure 15 compares the numerical and experimental bifurcation map for the pressure at the riser base. The upper lines in the map show the maximum pressure at a particular valve opening and the lower lines show the minimum pressure. The point at which the two lines meet indicates the occurrence of stable flow. A bifurcation map can be used to determine the optimal valve opening at which the system can be stabilized at a minimum system pressure with a maximum valve opening. For the pipeline riser system studied in the present work, the experimental lines meet at around 0.22 valve opening. For a valve opening between 1 and 0.22, the riser-base pressure oscillates between minimum and maximum pressure points as a result of severe slugging and slug flow. For a valve opening up to 0.22, bubbly flow forms and the system operates at a pressure slightly higher than the maximum pressure induced by severe slugging.
The bifurcation map also reveals that for valve opening between 1 and 0.22, the maximum pressure maintains constant, while the minimum pressure increases slightly with a decrease of valve opening. For valve openings less than 0.22, the riser-base pressure increases sharply while the valve opening decreases. The model globally underpredicts the minimum pressure during severe slugging mainly because of the incorrect estimation of the pipeline gas compression behavior in the model.

4.2.2. Liquid Production Characteristics

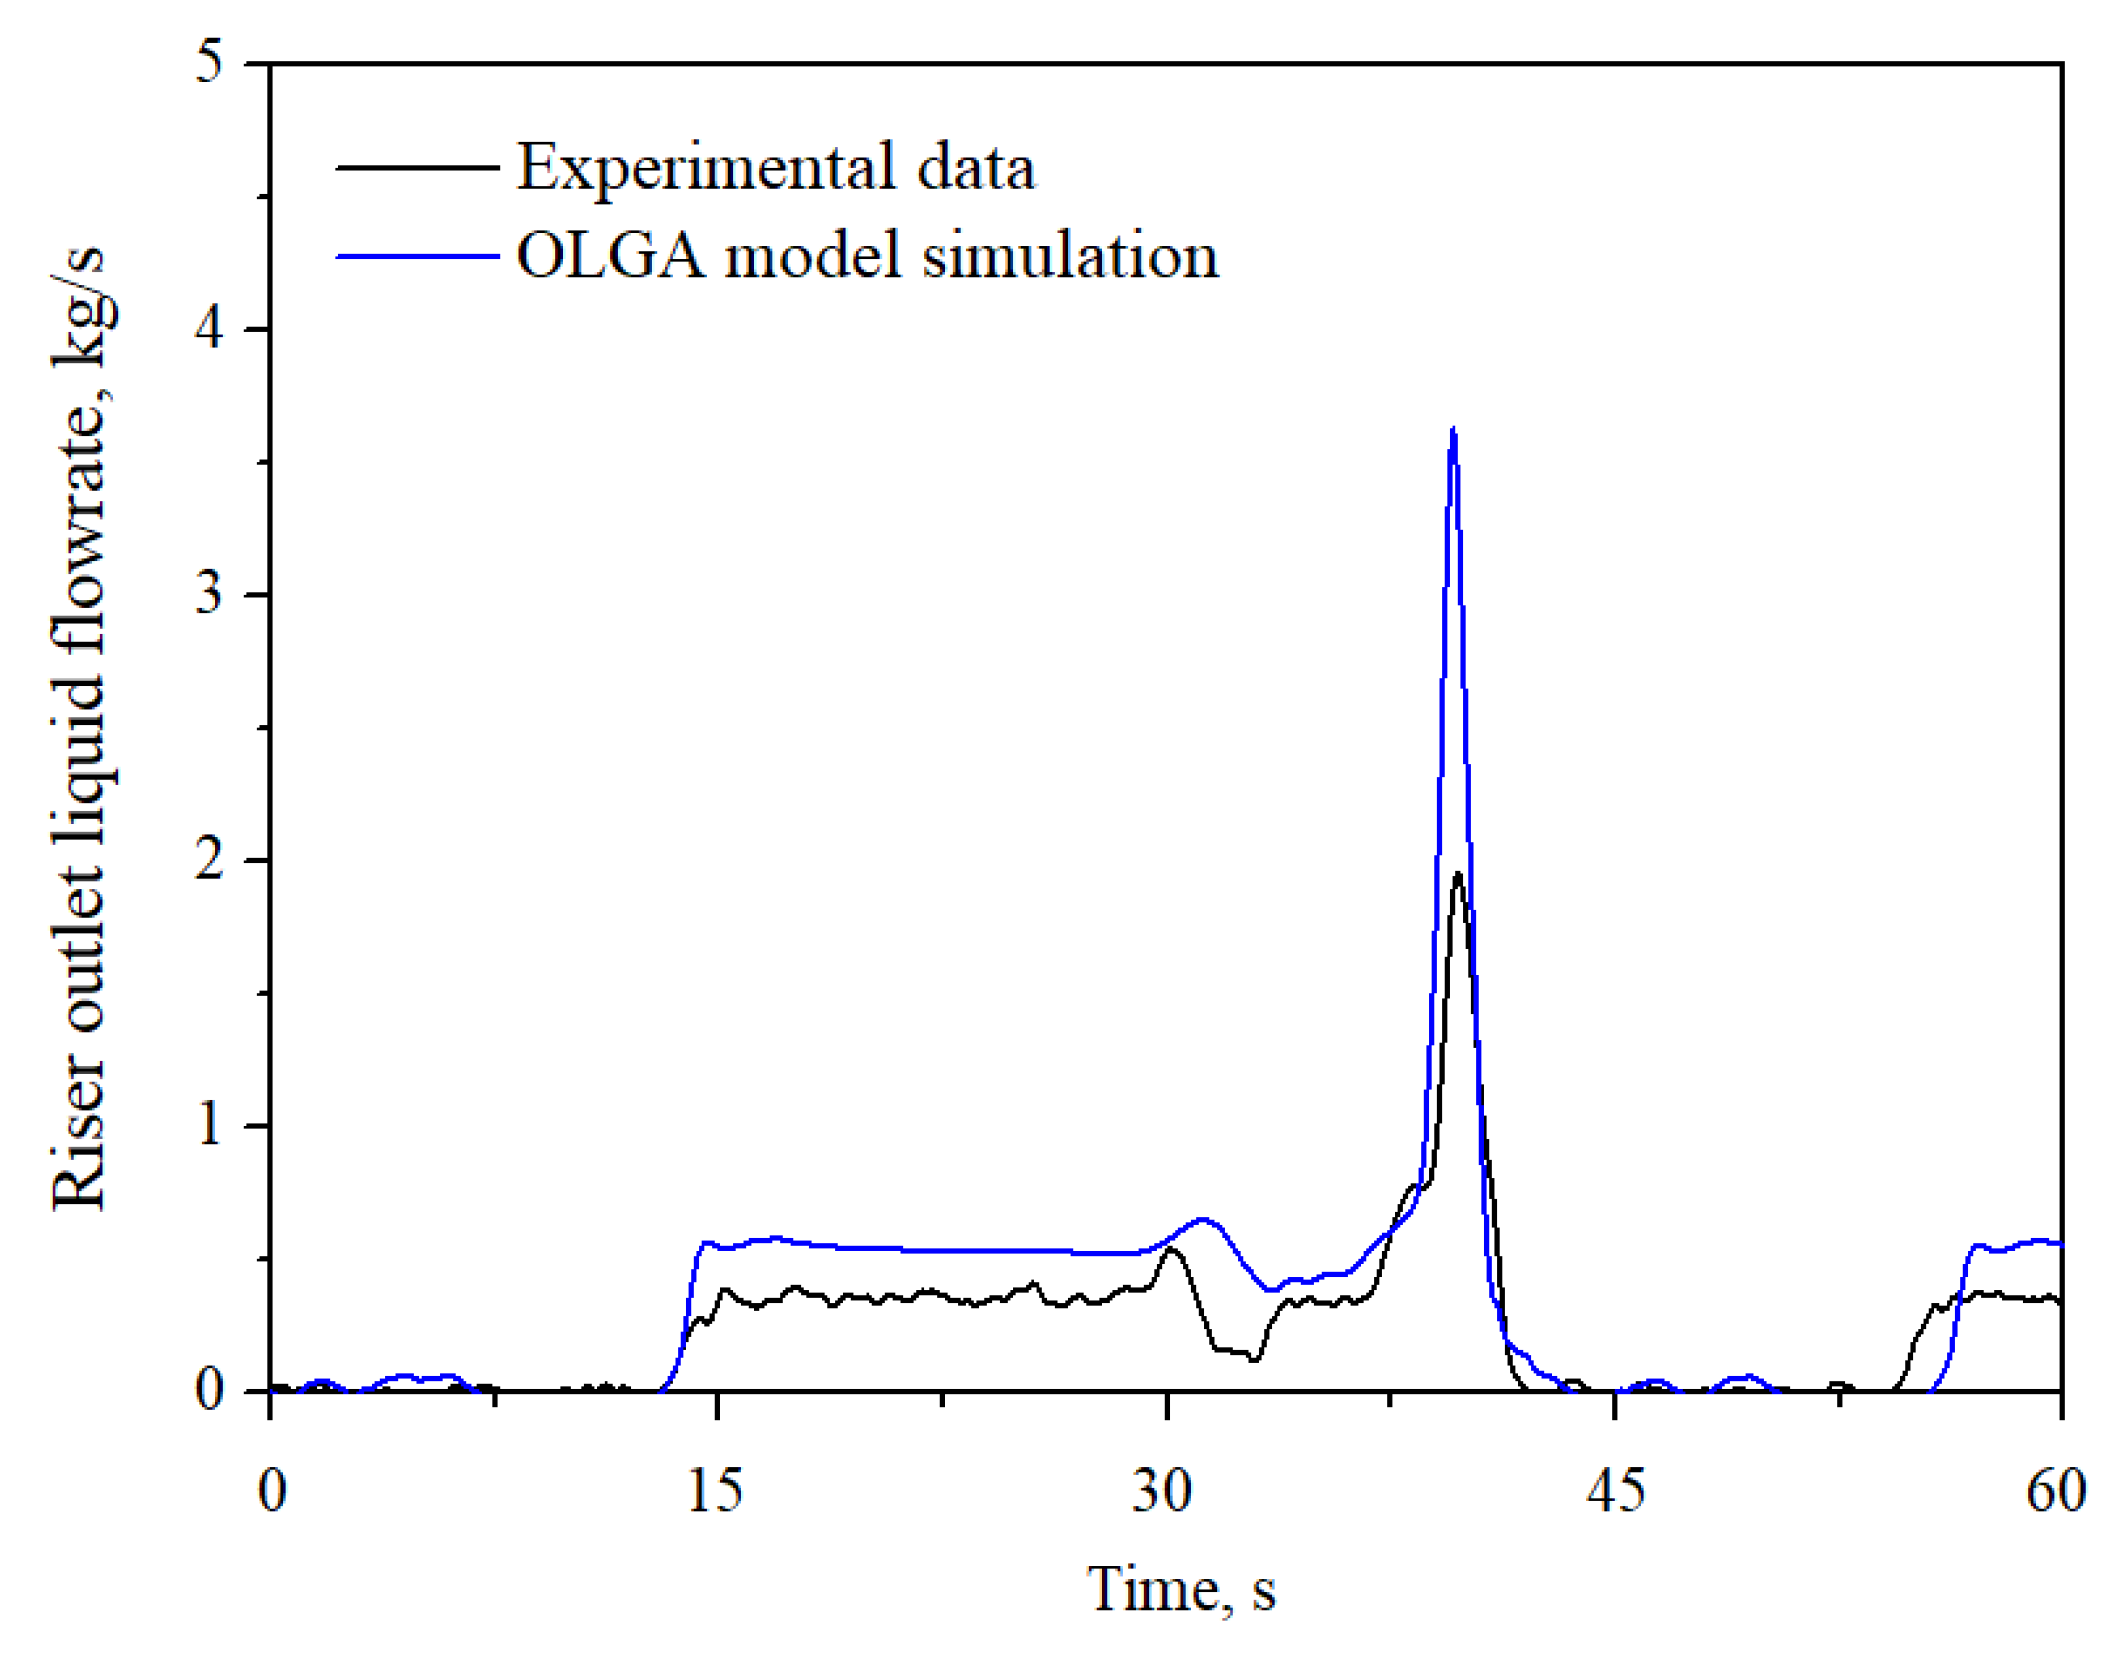
Figure 16 compares the predicted and measured traces of riser outlet liquid flowrate in the process of choking on severe slugging. The liquid production surge induced by severe slugging is well reproduced.
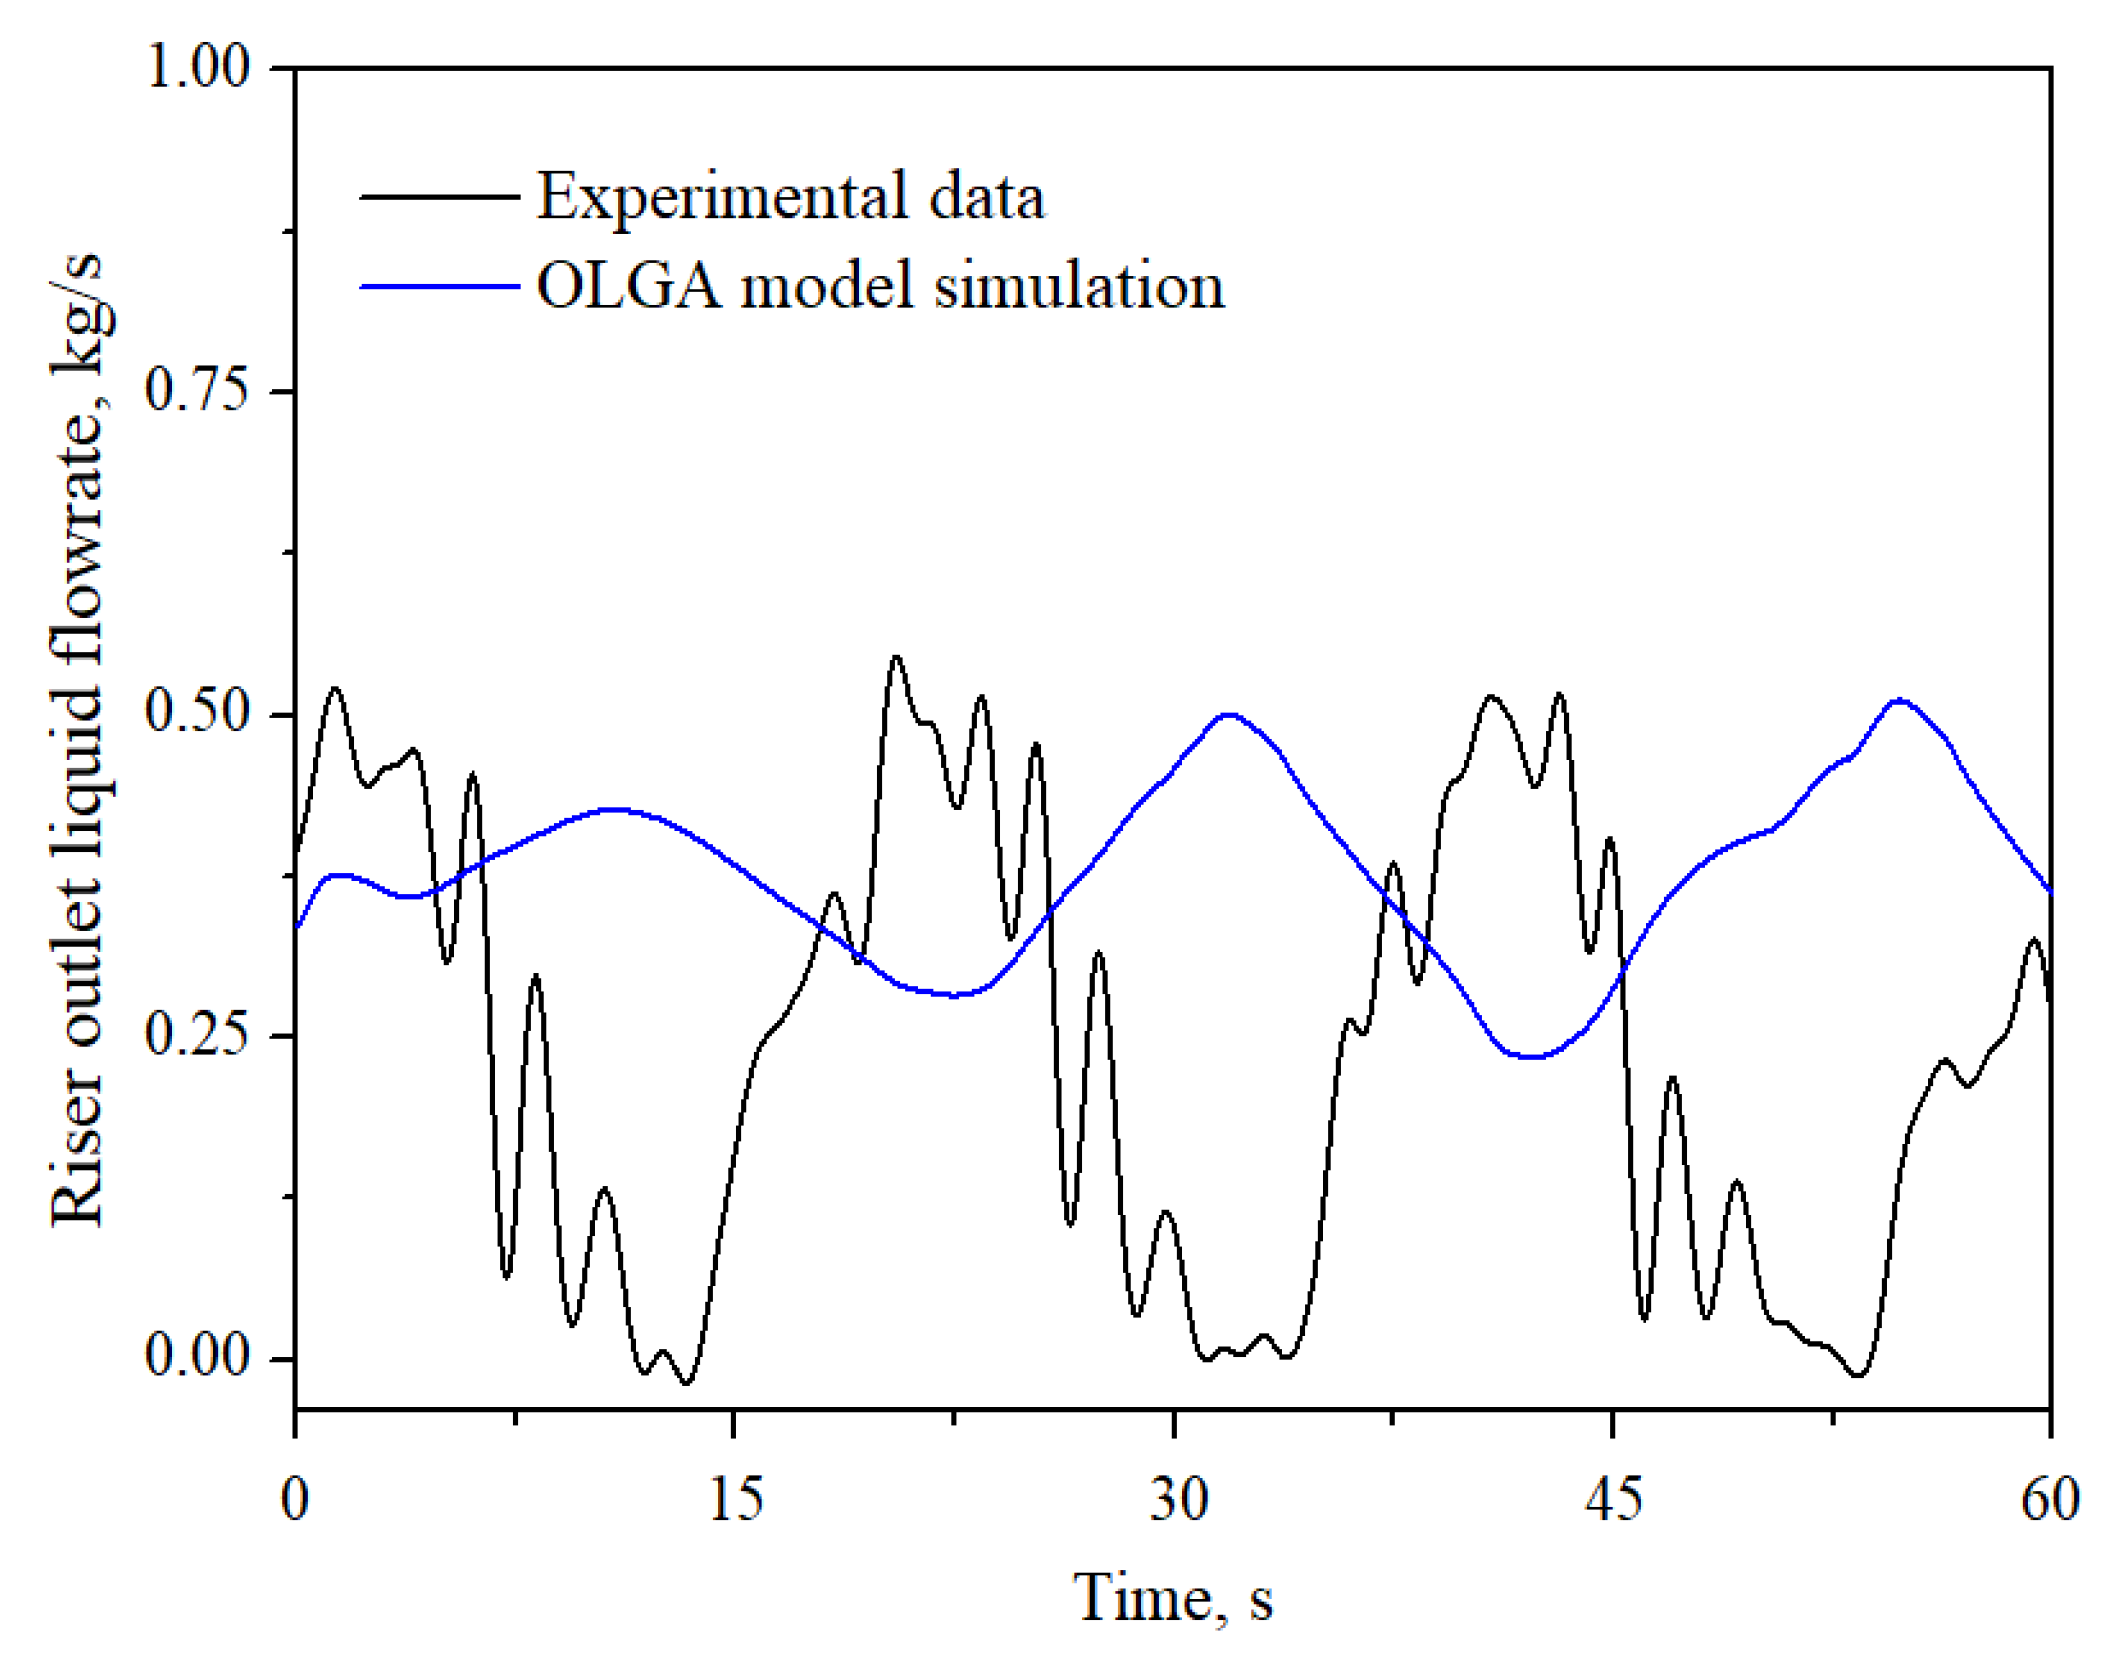
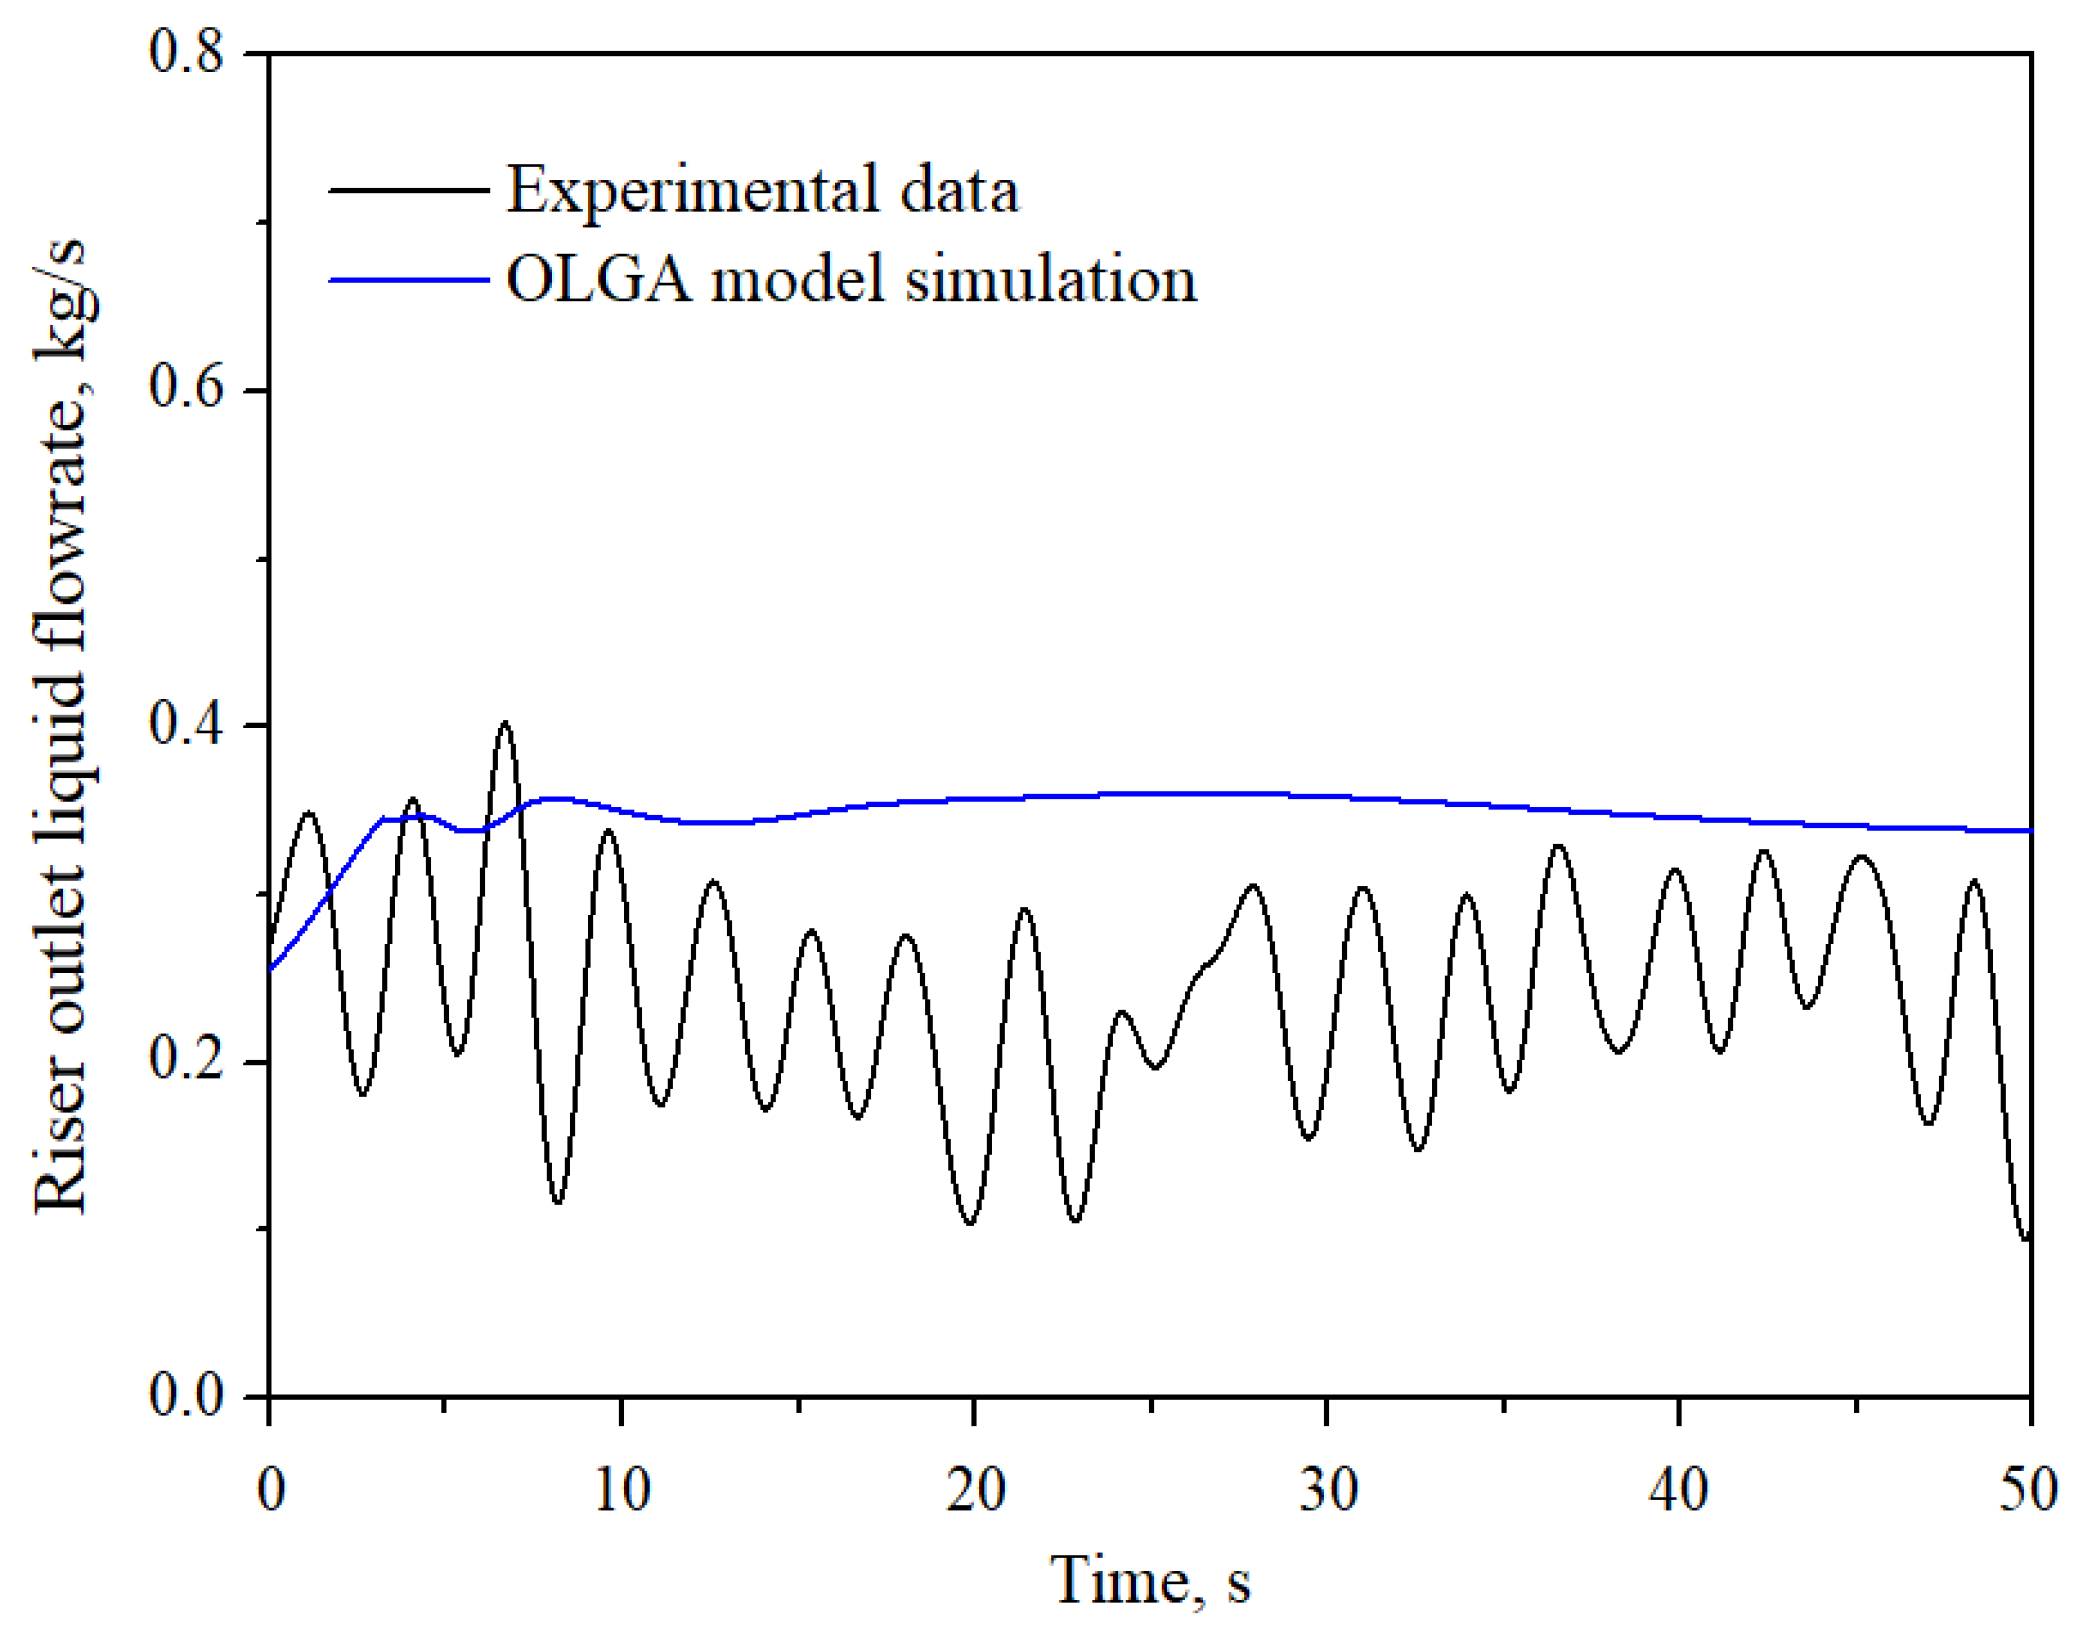
Comparisons between the computational and experimental trends of riser outlet liquid flowrates during slug flow and bubbly flow are given in Figure 17 and Figure 18, respectively. Examining the predicted liquid production trends of slug flow induced by riser outlet choking, there is a generally good agreement between the simulations and experiments.
The experimental results can be well predicted by OLGA. Note that both the constant and the peak liquid production rate are slightly overpredicted. The constant liquid delivery rate from the prediction is 0.5 kg/s compared to an experimental result of 0.4 kg/s. Moreover, the predicted peak delivery rate by OLGA model is 3.5 kg/s compared to 2 kg/s from the experiments in severe slugging. This was also found by Jansen et al. [22]. The reason can be attributed to the inaccurate estimation of the propagation rate of the gas bubbles in the vertical pipe [29].

4.2.3. Liquid Holdup

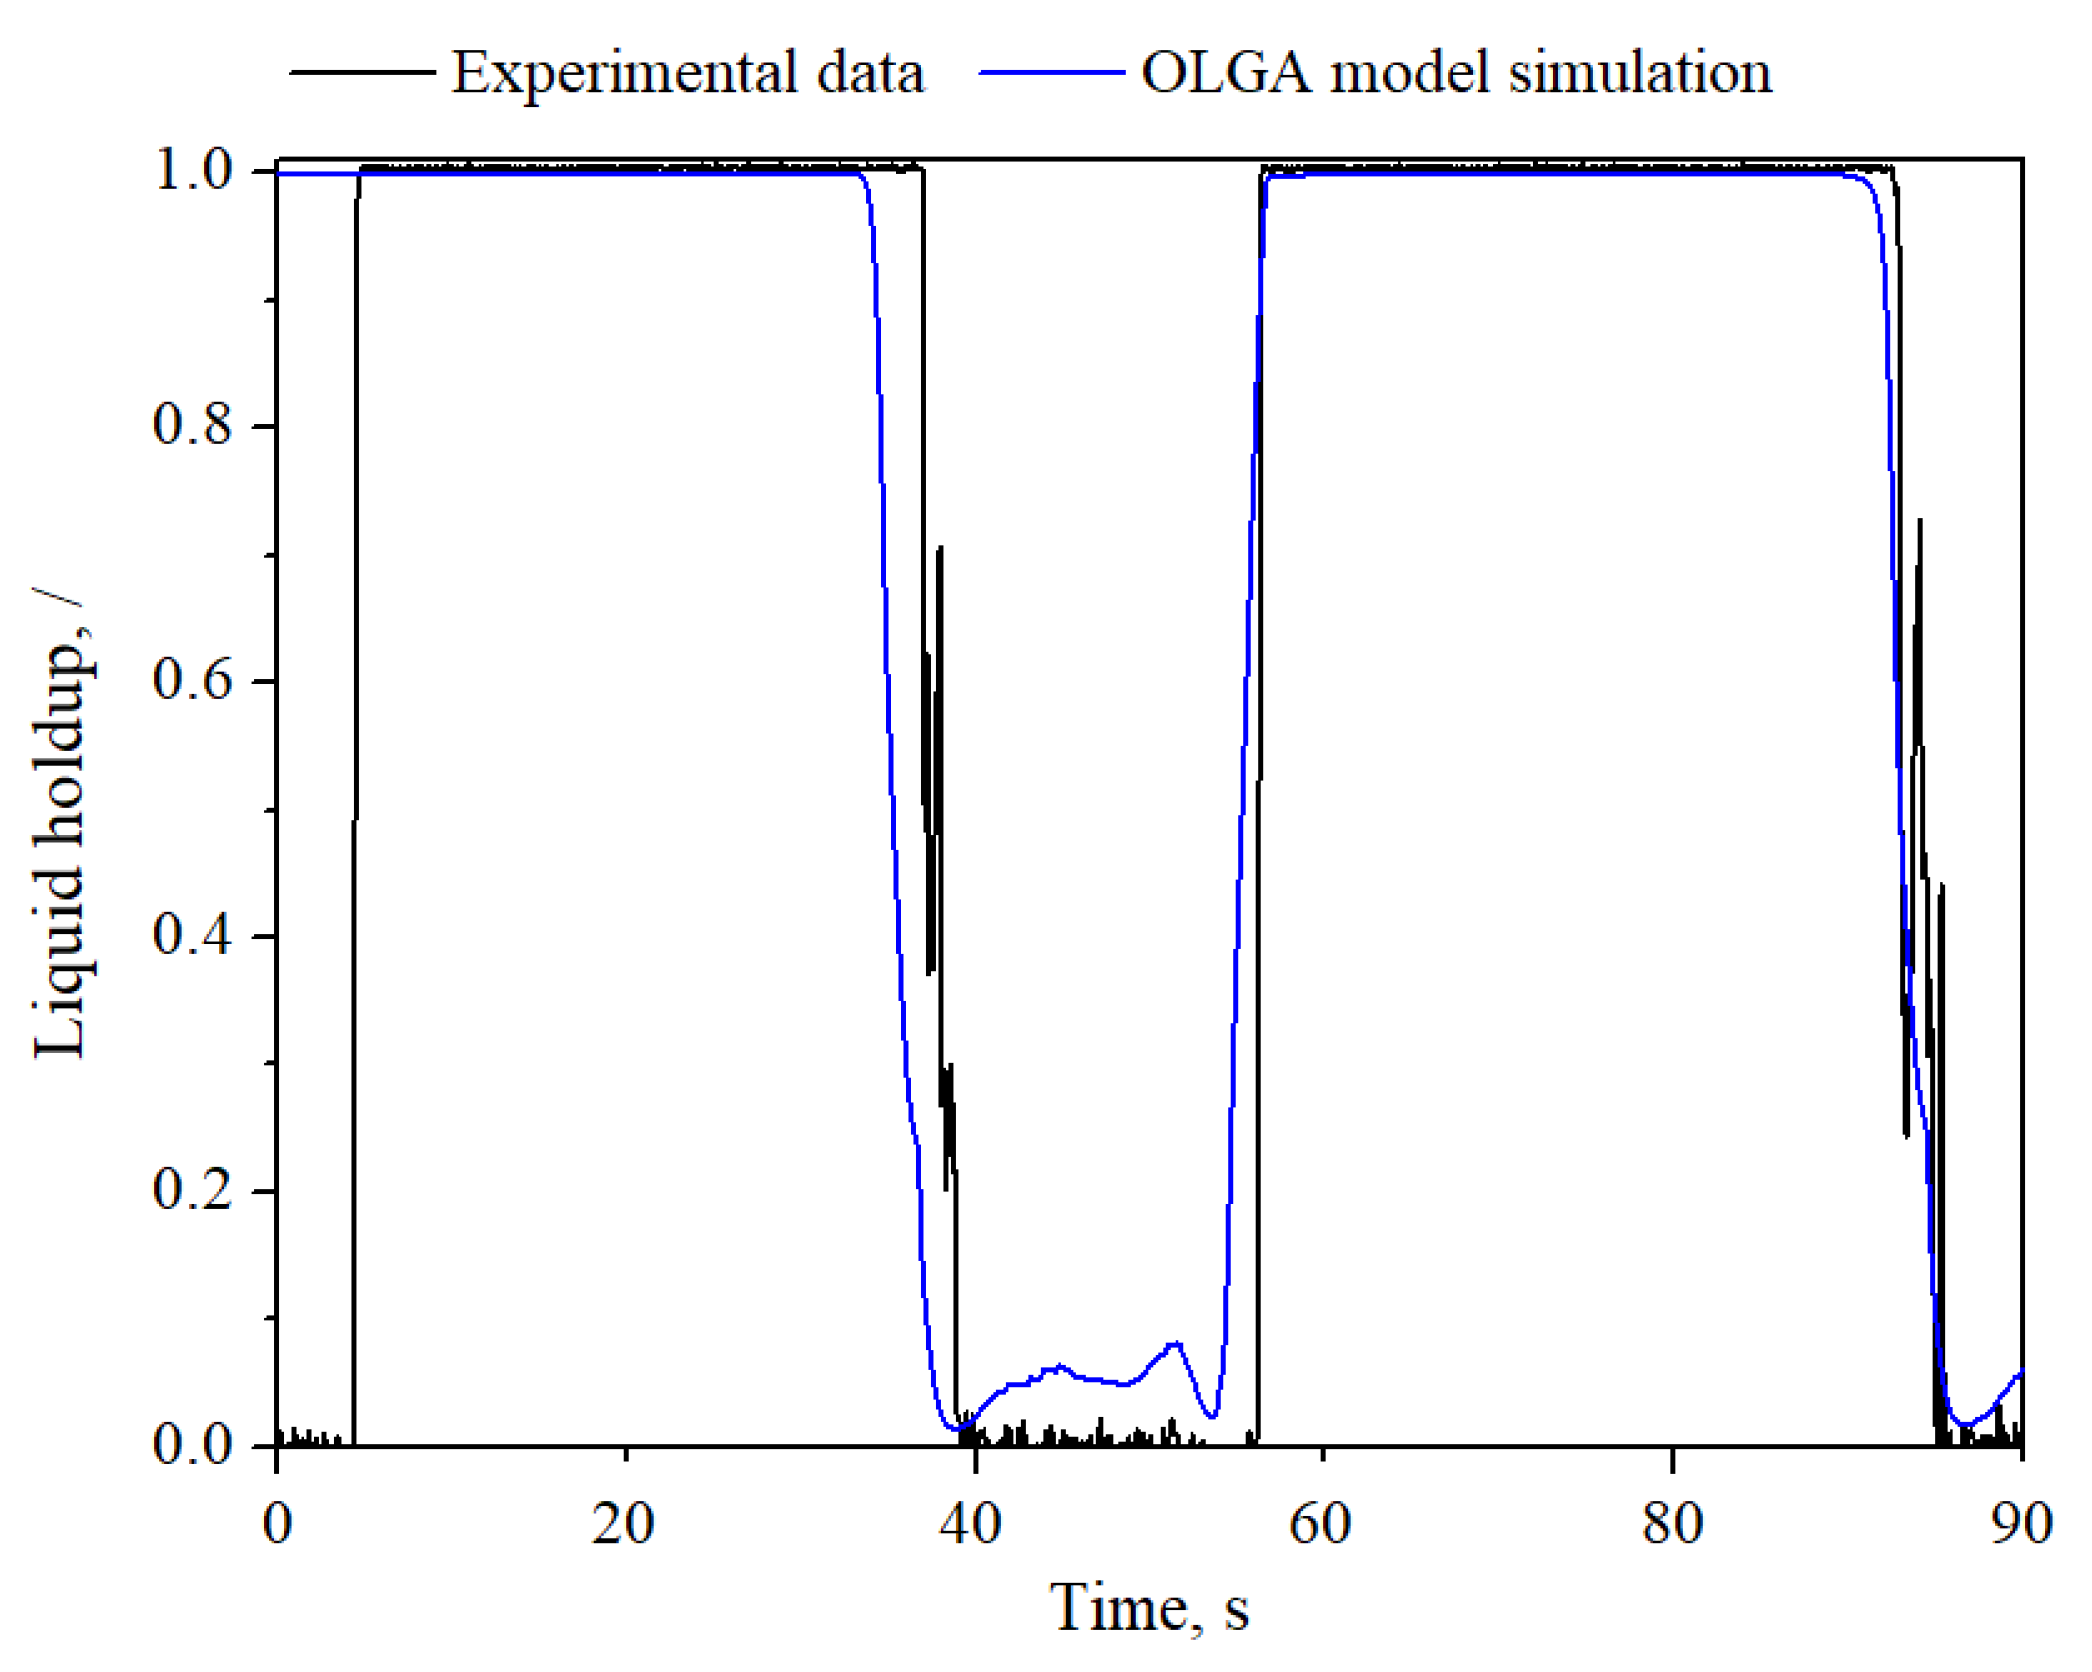
Figure 19 compares the OLGA simulations and experimental data for liquid holdup at riser top in severe slugging flow. The intermittent feature of severe slugging is also well reproduced by the numerical model.
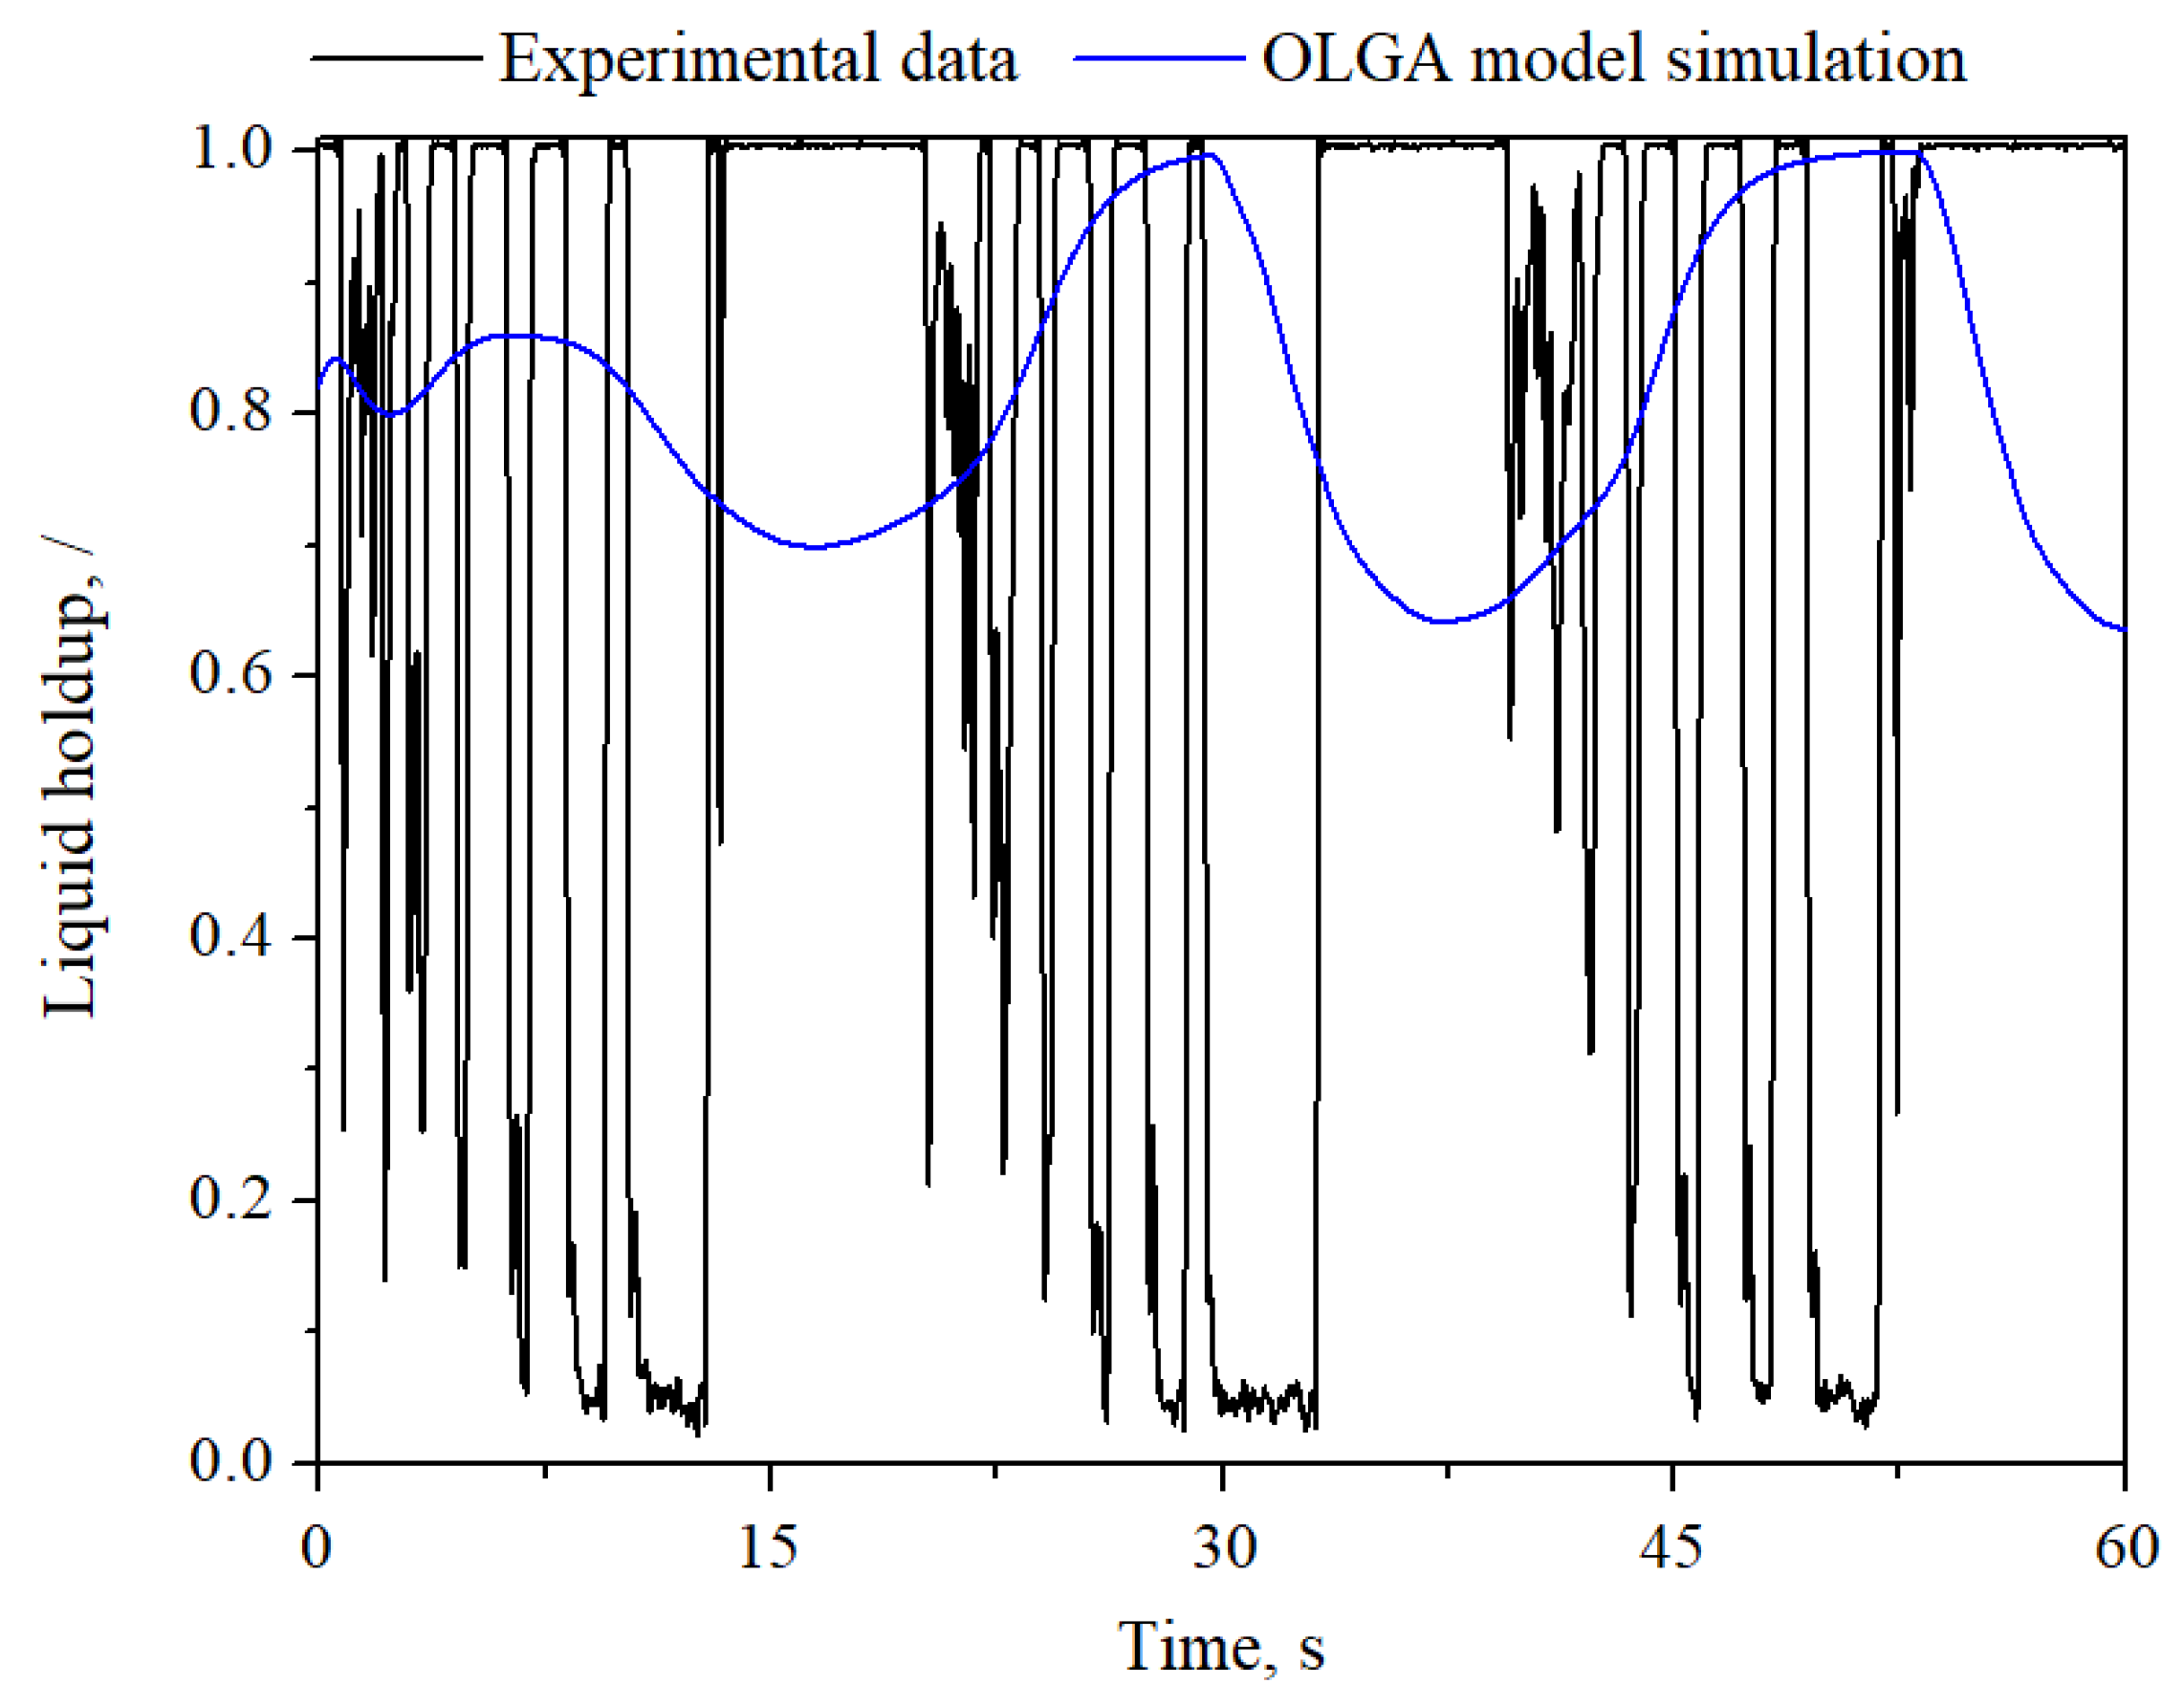
Comparisons between the simulated and measured liquid holdup during slug flow and bubbly flow are shown in Figure 20 and Figure 21, respectively. The discrepancies between the experimental and code predicted trends are apparent. This is also due to the fact the simulations were carried out without using slug tracking module. As mentioned above, the flow in the riser during choking-induced slug flow is characterized by alternative passage of large gas bubbles and liquid slugs with several kinds of dominant length. However, the simulations do not agree well with the experiments, as can be seen in Figure 20. This is again due to the incorrect estimation of liquid inventory in the code. Overall speaking, a comparison between the numerical and experimental liquid holdup during choking-induced slug and bubbly flow generally results in a good agreement.

5. Conclusions

The elimination of severe slugging by riser outlet choking was studied both experimentally and numerically. The following conclusions can be obtained based on the results presented above:
(1) As a consequence of choking at the outlet of the riser, severe slugging transforms first into slug flow and then into bubbly flow. Thus, the elimination of slugging is found to be a result of flow pattern transition induced by the valve position, varying from 1 to 0.22.
(2) Intrusion of gas into the riser base leads to blowout immediately for severe slugging in vertical pipe. The surge of liquid production of severe slugging corresponds to bubble penetration into the riser.
(3) The OLGA model is used to predict successfully the flow pattern transitions in the process of riser outlet choking. Details of the characteristics, such as cycling pressure, production rate, and liquid holdup, can be accurately predicted by this code.

Author Contributions

Conceptualization, N.L.; methodology, N.L. and X.D.; software, N.L. and X.D.; validation, D.H.; writing—original draft, N.L.; supervision, B.C.; project administration, D.H.; funding acquisition, X.D. All authors have read and agreed to the published version of the manuscript.

Funding

The financial support of the Opening Fund of State Key Laboratory of Multiphase Flow in Power Engineering (SKLMF-KF-2102) and the National Nature Science Foundation of China (No. 51806236) are gratefully acknowledged.

Data Availability Statement

Not applicable.

Acknowledgments

The authors wish to express gratitude to all participants in this work.

Conflicts of Interest

The authors declare no conflict of interest.

References

  1. Sunday, N.; Settar, A.; Chetehouna, K.; Gascoin, N. An overview of flow assurance heat management systems in subsea flowlines. Energies 2021, 14, 458. [Google Scholar] [CrossRef]
  2. Pedersen, S.; Jahanshahi, E.; Yang, Z.Y.; Skogestad, S. Comparison of model-based control solutions for severe riser-induced slugs. Energies 2017, 10, 2014. [Google Scholar] [CrossRef] [Green Version]
  3. Jung, S.; Yang, H.; Park, K.; Seo, Y.; Seong, W. Monitoring severe slugging in pipeline-riser system using accelerometers for application in early recognition. Sensors 2019, 19, 3930. [Google Scholar] [CrossRef] [PubMed] [Green Version]
  4. Taitel, Y.; Vierkandt, S.; Shoham, O.; Brill, J.P. Severe slugging in a riser system: Experiments and modeling. Int. J. Multiph. Flow 2017, 16, 57–68. [Google Scholar] [CrossRef]
  5. Pots, B.F.M.; Bromilow, I.G.; Konijn, M.J. Severe slug flow in offshore flowline/riser systems. SPE Prod. Eng. 1987, 2, 319–324. [Google Scholar] [CrossRef]
  6. Sarica, C.; Shoham, O. A simplified transient model for pipeline-riser systems. Chem. Eng. Sci. 1991, 46, 2167–2179. [Google Scholar] [CrossRef]
  7. Ali, S.F.; Yeung, H. Experimental investigation and numerical simulation of two-phase flow in a large-diameter horizontal flow line vertical riser. Pet. Sci. Technol 2010, 28, 1079–1095. [Google Scholar] [CrossRef]
  8. Luo, X.; He, L.; Ma, H. Flow pattern and pressure fluctuation of severe slugging in pipeline-riser system. Chin. J. Chem. Eng. 2011, 19, 26–32. [Google Scholar] [CrossRef]
  9. Malekzadeh, R.; Henkes, R.A.W.M.; Mudde, R.F. Severe slugging in a long pipeline-riser system: Experiments and predictions. Int. J. Multiph. Flow 2012, 46, 9–21. [Google Scholar] [CrossRef]
  10. Tin, V. Severe slugging in flexible riser. In Proceedings of the 5th International Conference on Multiphase Production, Cannes, France, 1–3 June 1991. [Google Scholar]
  11. Montgomery, J.A. Severe Slugging and Unstable Flows in an S-Shaped Riser. Ph.D. Thesis, Cranfield University, Cranfield, UK, 2002. [Google Scholar]
  12. Li, N.L.; Guo, L.J.; Li, W.S. Gas–liquid two-phase flow regimes in a pipeline–riser system with an S-shaped riser. Int. J. Multiph. Flow 2013, 55, 1–10. [Google Scholar] [CrossRef]
  13. Zhou, H.; Guo, L.; Yan, H.; Kuang, S. Investigation and prediction of severe slugging frequency in pipeline-riser systems. Chem. Eng. Sci. 2018, 184, 72–84. [Google Scholar] [CrossRef]
  14. Ren, W. Analysis of flow characteristics and influencing factors of severe slugging flow in an underwater pipe-catenary riser. Chem. Technol. Fuels Oils 2021, 57, 828–840. [Google Scholar] [CrossRef]
  15. Reda, A.M.; Forbes, G.L.; Sultan, I.A. Characterisation of slug flow conditions in pipelines for fatigue analysis. In Proceedings of the International Conference on Offshore Mechanics and Arctic Engineering, ASME 30th International Conference on Ocean, Offshore and Arctic Engineering, Rotterdam, The Netherlands, 19–24 June 2011; pp. 535–547. [Google Scholar]
  16. Sultan, I.A.; Reda, A.M.; Forbes, G.L. Evaluation of slug flow-induced flexural loading in pipelines using a surrogate model. J. Offshore Mech. Arct. Eng. Trans. ASME 2013, 135, 031703. [Google Scholar] [CrossRef]
  17. Reda, A.M.; Forbes, G.L.; McKee, K.K.; Howard, I.M. Vibration of a curved subsea pipeline due to internal slug flow. In Proceedings of the 43rd International Congress on Noise Control Engineering, Melbourne, Australia, 16–19 November 2014; pp. 1–15. [Google Scholar]
  18. Reda, A.M.; Forbes, G.L.; Sultan, I.A.; Howard, I.M. Pipeline slug flow dynamic load characterization. J. Offshore Mech. Arct. Eng. Trans. ASME 2018, 141, 011701. [Google Scholar] [CrossRef]
  19. Wang, Y.H.; Chen, N.Z. An investigation on vortex-induced vibration of a flexible riser transporting severe slugging. Ocean Eng. 2022, 246, 110565. [Google Scholar] [CrossRef]
  20. Fabre, J.; Peresson, L.; Corteville, J.; Bernicot, M.; Ozon, P. Severe slugging in pipeline/riser systems. SPE Prod. Eng. 1990, 5, 299–305. [Google Scholar] [CrossRef]
  21. Rogachev, M.K.; Van, T.N.; Aleksandrov, A.N. Technology for preventing the wax deposit formation in gas-lift wells at offshore oil and gas fields in Vietnam. Energies 2021, 14, 5016. [Google Scholar] [CrossRef]
  22. Jansen, F.E.; Shoham, O.; Taitel, Y. The elimination of severe slugging: Experiments and modeling. Int. J. Multiph. Flow 1996, 22, 1055–1072. [Google Scholar] [CrossRef]
  23. Schmidt, Z.; Doty, D.R.; Dutta-Roy, K. Severe slugging in offshore pipeline-riser pipe system. SPE J. 1985, 25, 27–38. [Google Scholar] [CrossRef]
  24. Xie, C.; Guo, L.J.; Li, W.S.; Zhou, H.L.; Zou, S.F. The influence of backpressure on severe slugging in multiphase flow pipeline-riser systems. Chem. Eng. Sci. 2017, 163, 68–82. [Google Scholar] [CrossRef]
  25. Cheng, B.; Li, Q.P.; Yu, X.C.; Yao, H.Y. Software simulation for making severe slugging control strategy in deepwater riser. In Proceedings of the 33rd ASME International Conference on Ocean, Offshore and Arctic Engineerin, San Francisco, CA, USA, 8–13 June 2014. [Google Scholar]
  26. Liu, Y.T.; Zhu, X.X.; Song, J.P.; Wu, H.Y.; Zhang, S.F.; Zhang, S.M. Research on bypass pigging in offshore riser system to mitigate severe slugging. Ocean Eng. 2022, 246, 110606. [Google Scholar] [CrossRef]
  27. Inok, J.; Lao, L.; Cao, Y.; Whidborn, J. Severe slug mitigation in an S-shape pipeline-riser system by an injectable venturi. Chem. Eng. Res. Des. 2019, 150, 299–310. [Google Scholar] [CrossRef]
  28. Yao, T.; Wu, Q.H.; Liu, Z.G.; Zou, S.F.; Xu, Q.; Guo, L.J. Experimental investigation on mitigation of severe slugging in pipeline-riser system by quasi-plane helical pipe device. Exp. Therm. Fluid Sci. 2019, 102, 189–204. [Google Scholar] [CrossRef]
  29. Mokhatab, S. Severe slugging in a catenary-shaped riser: Experimental and simulation studies. Pet. Sci. Technol. 2007, 25, 719–740. [Google Scholar] [CrossRef]
  30. Taitel, Y. Stability of severe slugging. Int. J. Multiph. Flow 1986, 12, 203–217. [Google Scholar] [CrossRef]
  31. Bendiksen, K.; Brandt, L.; Fuchs, P.; Linga, H.; Malnes, D.; Moe, R. Two-phase flow research at SINTEF and IFE: Some experimental results and a demonstration of the dynamic two-phase flow simulator OLGA. In Proceedings of the 7th International Offshore Northern Seas Conference, Stavanger, Norway, 26–29 August 1986. [Google Scholar]
  32. Farghaly, M.A. Study of severe slugging in real offshore pipeline riser-pipe system. In Proceedings of the 5th Middle East Oil Show, SPE of AIME, Manama, Bahrain, 26–30 April 1987. [Google Scholar]
  33. Yeung, H.; Tchambak, E.; Montgomery, J. Simulating the behaviour of an S-shaped riser. In Proceedings of the 11th International Conference Multiphase, San Remo, Italy, 11–13 June 2003. [Google Scholar]
  34. Park, K.H.; Kim, T.W.; Kim, Y.J.; Lee, N.; Seo, Y. Experimental investigation of model-based IMC control of severe slugging. J. Pet. Sci. Eng. 2021, 204, 108732. [Google Scholar] [CrossRef]
  35. de Azevedo, G.R.; Balino, J.L.; Andreolli, I. Stability analysis for severe slugging including self-lifting. SPE J. 2021, 26, 716–736. [Google Scholar] [CrossRef]
  36. Choi, J.; Pereyra, E.; Sarica, C.; Park, C.; Kang, J.M. An efficient drift-flux closure relationship to estimate liquid holdups of gas-liquid two-phase flow in pipes. Energies 2012, 5, 5294–5306. [Google Scholar] [CrossRef] [Green Version]
  37. Bendiksen, K.H.; Malnes, D.; Moe, R.; Nuland, S. The dynamic two-fluid model OLGA: Theory and application. SPE Prod. Eng. 1991, 58, 171–180. [Google Scholar] [CrossRef]
  38. Peng, D.Y.; Robinson, D.B. A new two-constant equation of state. Ind. Eng. Chem. Fund. 1976, 15, 58–64. [Google Scholar] [CrossRef]
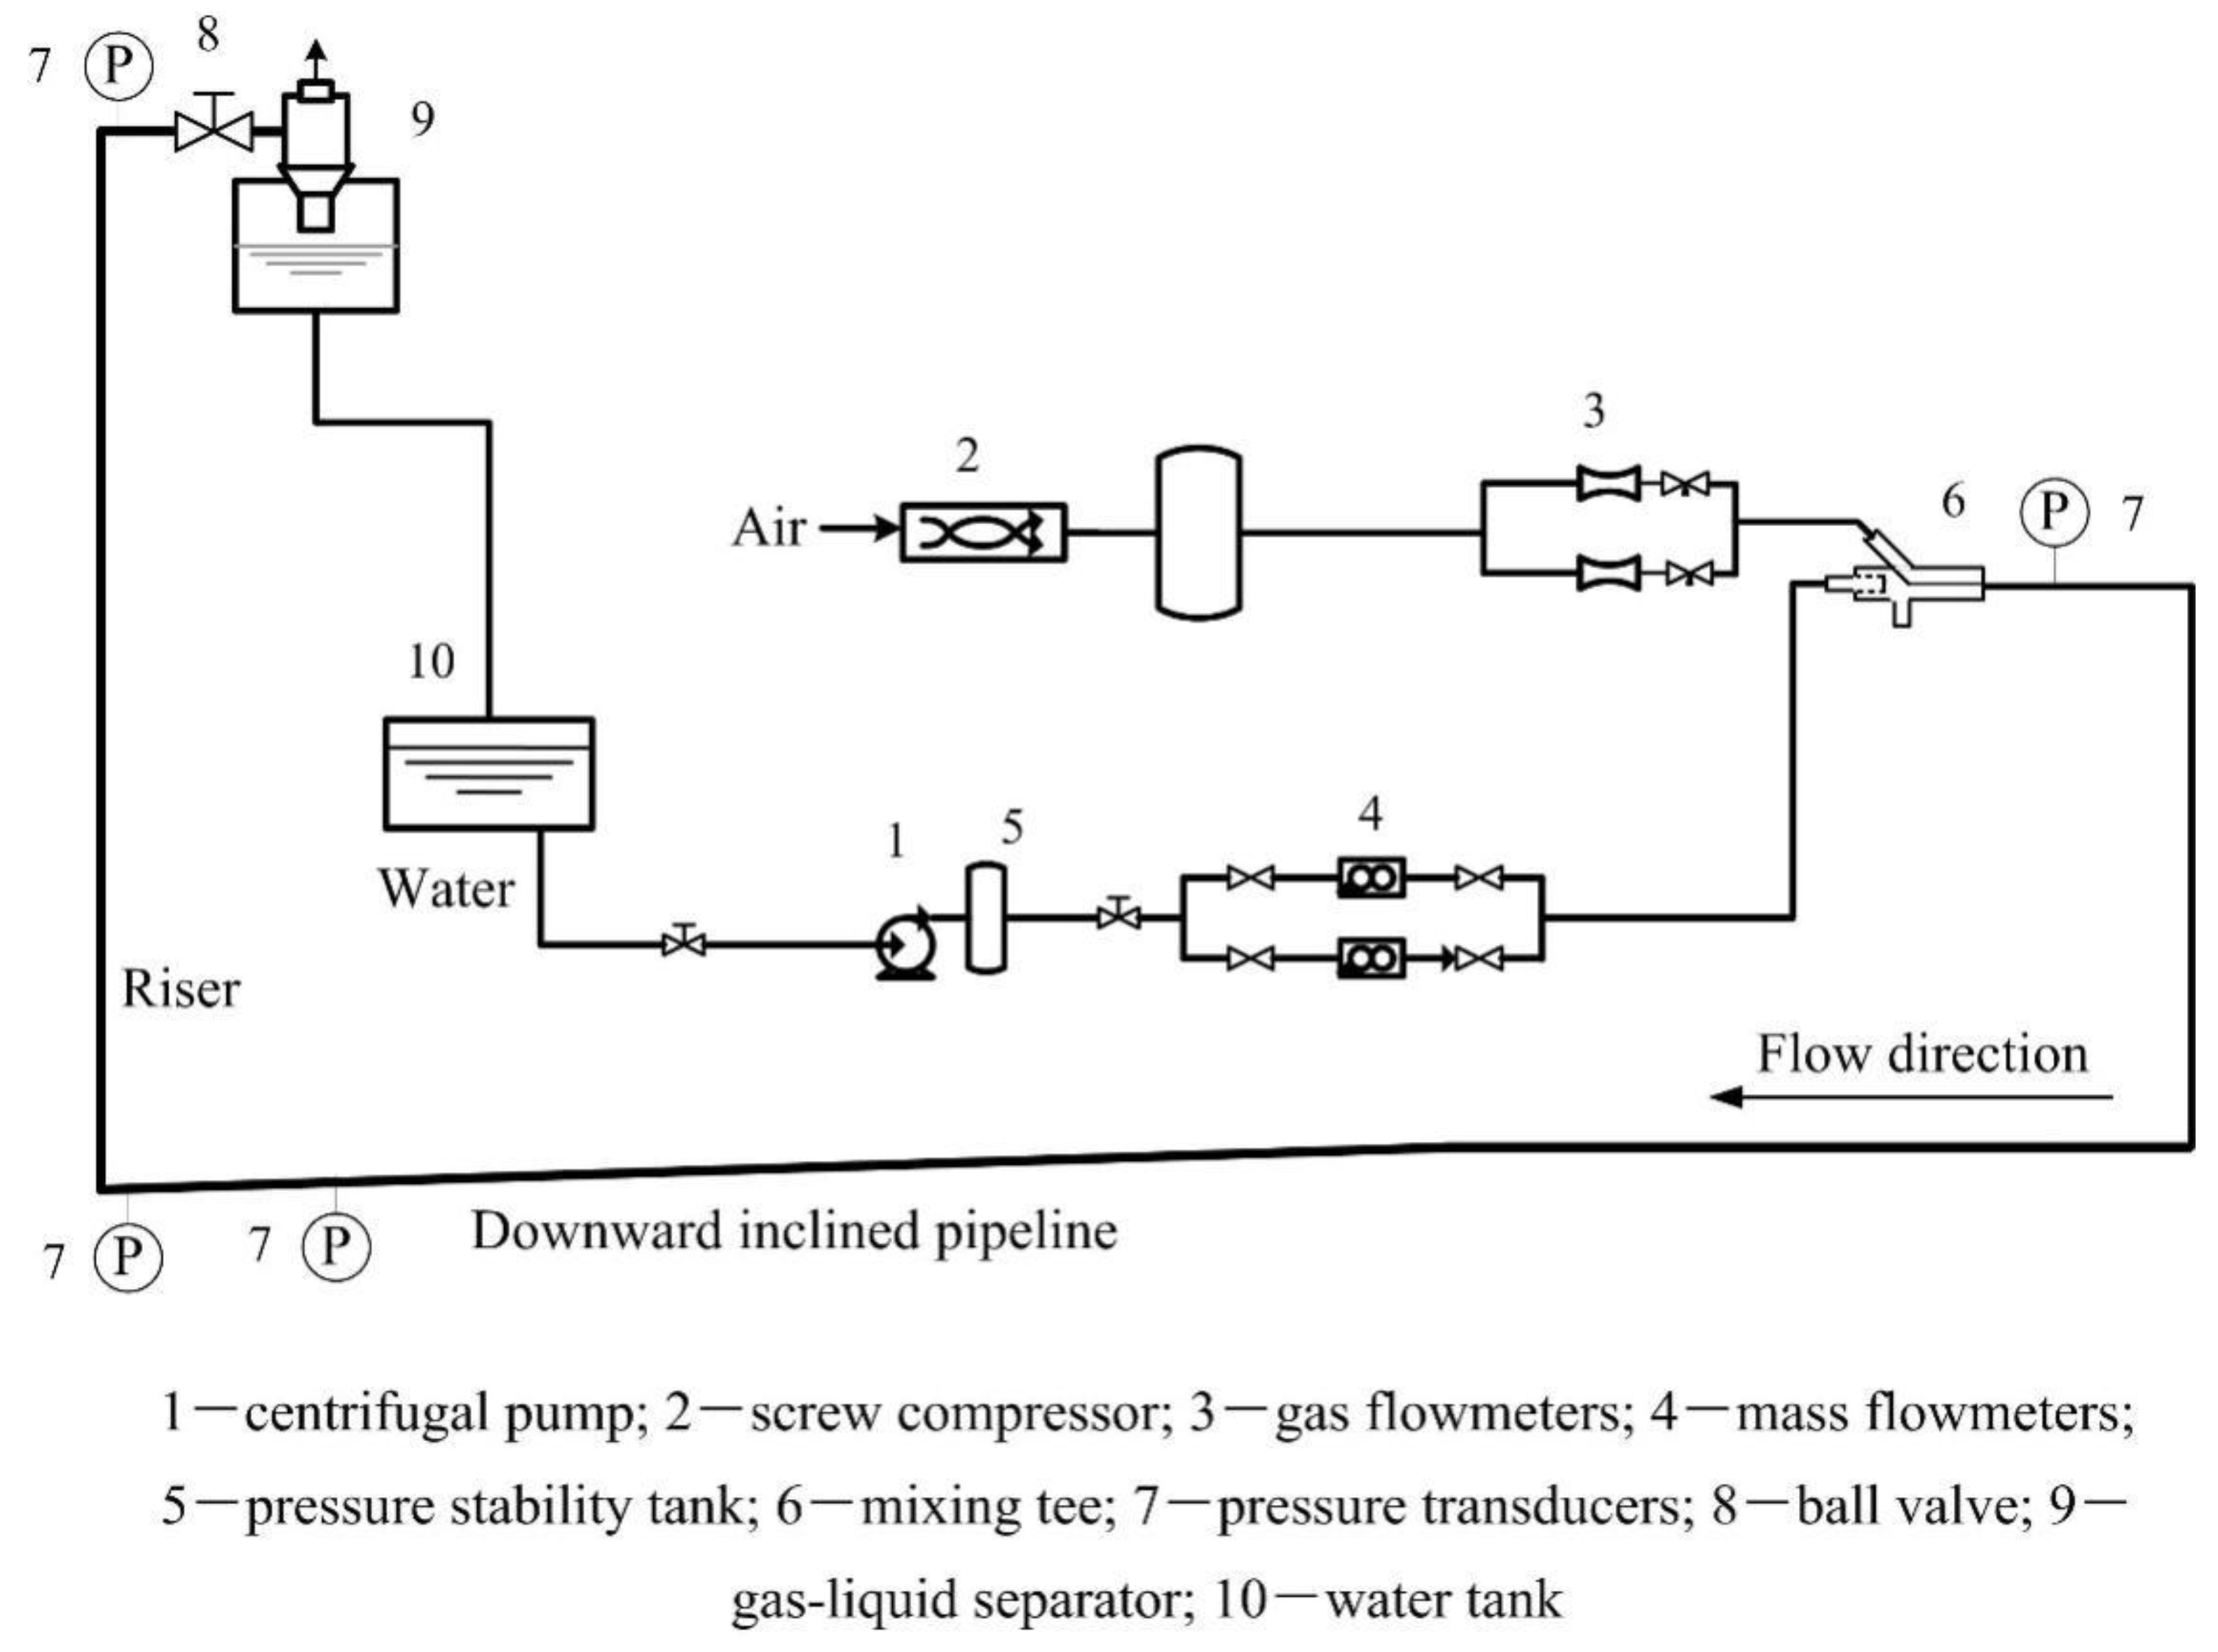
Figure 1. Schematic diagram of the air and water two-phase experimental test rig.
Energies 15 07284 g001
Figure 2. Measured pressure at riser-base during severe slugging (UGS = 0.08 m/s and ULS = 0.09 m/s).
Energies 15 07284 g002
Figure 3. Measured pressure at riser-base during choking-induced slug flow (UGS = 0.08 m/s and ULS = 0.09 m/s).
Energies 15 07284 g003
Figure 4. Measured pressure at riser-base during choking-induced bubbly flow (UGS = 0.08 m/s and ULS = 0.09 m/s).
Energies 15 07284 g004
Figure 5. Amplitude of riser-base pressure oscillation against valve opening.
Energies 15 07284 g005
Figure 6. Cycling period against valve opening.
Energies 15 07284 g006
Figure 7. Increasing amplitude of pipeline inlet pressure in the process of choking.
Energies 15 07284 g007
Figure 8. Experimental profile of slug production for severe slugging (UGS = 0.08 m/s and ULS = 0.09 m/s).
Energies 15 07284 g008
Figure 9. Experimental profile of slug production during choking-induced slug flow (UGS = 0.08 m/s and ULS = 0.09 m/s).
Energies 15 07284 g009
Figure 10. Experimental profile of liquid production during choking-induced bubbly flow (UGS = 0.08 m/s and ULS = 0.09 m/s).
Energies 15 07284 g010
Figure 11. Experimental time traces of liquid holdup at the riser top (UGS = 0.11 m/s and ULS = 0.15 m/s).
Energies 15 07284 g011
Figure 12. Measured and simulated riser-base pressure profiles of severe slugging (UGS = 0.08 m/s and ULS = 0.09 m/s).
Energies 15 07284 g012
Figure 13. Measured and simulated riser-base pressure profiles of choking-induced slug flow (UGS = 0.08 m/s and ULS = 0.09 m/s).
Energies 15 07284 g013
Figure 14. Measured and simulated riser-base pressure profiles of choking-induced bubbly flow (UGS = 0.08 m/s and ULS = 0.09 m/s).
Energies 15 07284 g014
Figure 15. Comparison of measured and simulated riser-base pressure bifurcation map.
Energies 15 07284 g015
Figure 16. Experimental and simulated liquid production trends during severe slugging (UGS = 0.08 m/s and ULS = 0.09 m/s).
Energies 15 07284 g016
Figure 17. Experimental and simulated liquid production trends during choking-induced slug flow (UGS = 0.08 m/s and ULS = 0.09 m/s).
Energies 15 07284 g017
Figure 18. Experimental and simulated liquid production trends during choking-induced bubbly flow (UGS = 0.08 m/s and ULS = 0.09 m/s).
Energies 15 07284 g018
Figure 19. Experimental and simulated profile of liquid holdup in severe slugging (UGS = 0.08 m/s and ULS = 0.09 m/s).
Energies 15 07284 g019
Figure 20. Experimental and simulated profile of liquid holdup in choking-induced slug flow (UGS = 0.08 m/s and ULS = 0.09 m/s).
Energies 15 07284 g020
Figure 21. Experimental and simulated profile of liquid holdup in choking-induced bubbly flow (UGS = 0.08 m/s and ULS = 0.09 m/s).
Energies 15 07284 g021
Table 1. Properties of the piping network.
ParameterValueUnit
Diameter50.8mm
Density7899kg·m−3
Capacity499J·(kg·K)−1
Conductivity50W·(m·K)−1
Thickness9.99mm
Roughness0.099mm
Publisher’s Note: MDPI stays neutral with regard to jurisdictional claims in published maps and institutional affiliations.