Article

A Sensor-Based System for Dust Containment in the Construction Site

1
Department of Industrial and Information Engineering and Economics, University of L’Aquila, Via G. Gronchi 18, 67100 L’Aquila, Italy
2
Department of Civil, Construction-Architectural and Environmental Engineering, University of L’Aquila, Via G. Gronchi n. 18, 67100 L’Aquila, Italy
*
Author to whom correspondence should be addressed.
Energies 2022, 15(19), 7272; https://doi.org/10.3390/en15197272
Submission received: 31 August 2022 / Revised: 24 September 2022 / Accepted: 27 September 2022 / Published: 3 October 2022

Abstract

:
The problem of the containment of fine dust (especially PM 2.5 and PM 10) emitted into the atmosphere is particularly acute, especially in industrialized countries. However, there are particular areas where it is still not adequately considered. One of these is the construction site sector. The aim of this work is to design a flexible, economical, and easy-to-use system, which allows for the detection of the emissions produced in critical circumstances such as the demolition of a building. To this end, a data logger and five customized nodes were designed through a five-step method. The data logger is able to transmit data to a PC, making them available in real time. The study was conducted on a reconstruction site in L’Aquila, Italy, a city severely affected by the earthquake in 2009, for two working days and a public holiday. Even if not presenting substantial critical issues in relation to the latter, the experimental results show that the emissions of PM 2.5 and PM 10 detected during the demolition activity far exceed, in some moments, the threshold values. In fact, peaks as high as about 123 μg/m3 for PM 2.5 and over 1000 μg/m3 for PM 10 have been detected.

1. Introduction

The level of dust present in the air is an increasingly important problem in industrialized countries due to their impact on human life and the environment [1].
From the point of view of human health, they cause problems such as asthma, respiratory issues, and even cancer. From a more strictly environmental point of view, they have a major impact on global warming, thus worsening the quality of life.
The most dangerous are the so-called “fine particles”, in particular PM 10 (formed by particles with a diameter of less than 10 μm) and PM 2.5 (formed by particles with a diameter of less than 2.5 μm).
In this sense, both Europe and the World Health Organization (WHO) have set very specific limits. The European daily limit of PM 10 is 50 μg/m3, not to be exceeded more than 35 times a year with an annual average limit of 40 μg/m3. The WHO allows only three surpluses per year of the daily threshold of 50 μg/m3, lowering the annual average to 20 μg/m3. For PM 2.5, Europe sets a limit of 25 μg/m3 and the WHO sets a limit 10 μg/m3.
The presence of PM 2.5 and PM 10 is due, on the one hand, to natural phenomena (for example, forest fires); on the other hand, it is also due to the increasingly numerous presence of vehicles, industries, etc [2]. These aspects give importance to developing flexible, economical, and easy-to-use systems to control emissions in this second case. Systems with these characteristics are quite widespread in the literature, especially from the point of view of effective structural and environmental monitoring [3,4,5,6,7,8,9,10,11,12,13,14,15,16,17,18,19,20,21,22,23].
However, there is a field that is still too much neglected, that of construction sites. In fact, by carrying out a search through the Web of Science database, by inserting the keywords “construction site” and “dust pollution” from 1973 (the year in which the first document appears) to now, only 400 articles have been published. Among these, 333 have been published since 2005. The areas of greatest interest are those of environmental science and earth and planetary sciences, with 40.2% and 13.1%, respectively. Instead, the engineering field covers only 11.9% (Figure 1). An in-depth study of the state of the field was carried out precisely within this range, noting the presence of only 58 items.
Among the most recent, relating to the last two years (2021 and 2022), some are particularly interesting for the purposes of this paper. For example, in [24], the problem of the production of fine powders on site is addressed. In particular, a methodology is defined to reduce pollution from such dusts through the combined action of in situ measurements and application of the law of dust diffusion. It is also highlighted that research on the impact of PM on workers follows three main lines, namely the monitoring of powders, the control and prevention of the production of such powders during processing, and the effects on health. Instead, paper [25] aims to highlight the potential of the use of Internet of Things sensors for monitoring as support visualization in construction. Additionally, in [26] a high importance is given to the monitoring of construction site dust to support political decision-makers in their choices. To this end, a dust detection method for a construction site is tested. This method is based on a prior knowledge min-max k-means clustering algorithm. Then, paper [27] focuses on fine dust risk mitigation measures, not only for construction site operators but also for users and residents. Therefore, experiments with water systems for dust suppression in Rostov-on-Don (Russia) were conducted. In [28], on the other hand, an earthwork construction is analyzed in detail by monitoring workers exposed to dust during the execution of this task. Subsequently, the authors quantified the health risks for workers by defining an effective evaluation system. Finally, paper [29] summarizes the results of the study of the distribution and concentration of fine dust released during construction production. Finally, the solution presented in [30] links the concept of urban design in construction sites to an innovative integrated monitoring system.
Although the study of the state of the field has revealed the presence of a limited number of studies on the topic of interest, illustrated and summarized in Table 1, the need to identify strategies capable of reducing the emissions of dangerous substances into the atmosphere, increasing the consumption of non-renewable resources, and decreasing noise pollution is increasingly pressing. This will lead to a radical change in perspective on the construction site and its design, but will also facilitate the change in trend required by the Sustainable Development Goals of the 2030 Agenda [31].
For this required change, it appears important to manage the construction site adequately, implementing the planning of the works [32], installing mobile acoustic barriers, using less-polluting vehicles, implementing cleaning, and reducing the dispersion of dust and the use of fossil resources.
Moreover, the correct design and operational planning of the construction site allows the rational management of the works and reduction of risks [33]. As part of these activities, attention to polluting emissions is a research gap that needs to be investigated. In fact, in daily practice, to avoid the lifting and dispersion of dust into the atmosphere, the following actions are implemented:
  • The continuous wetting of the work area;
  • The coverage of deposits of dusty material (both deposited and transported);
  • The use of dust shields.
Regardless, these strategies are not always effective since they do not allow for the control of the amount of dust actually produced by the processes that are taking place. Furthermore, they are “qualitative” strategies not supported by an effective numerical confirmation of the benefits achieved thanks to their implementation. Moreover, this appears even more true when it is necessary to intervene in particular urban contexts where, inevitably, there is an increase in emissions. These situations include, for example, the demolition of buildings, a particularly frequent activity in areas such as L’Aquila, Italy, hit by the earthquake of 6 April 2009. This often happens because the lack of urban planning determines the occurrence of demolitions at the same time [34]. For all these reasons, it is necessary to focus attention on dust pollution produced during construction/reconstruction activities.
To all these aims, a system capable of detecting PM 10 and PM 2.5 particles emitted during the demolition of a building in L’Aquila has been developed.
In particular, the proposed solution is related to the urgency, also on the part of the engineering sector, to develop solutions strictly dedicated to the problem related to dust emissions in critical situations for workers on construction sites. Investigating this need in depth and responding to it will also allow us to provide new insights to those studies which, as was previously mentioned, appear today almost entirely within the prerogative of sectors such as environmental sciences and earth and planetary sciences, allowing a multidisciplinary approach to the problem.
More precisely, the purpose of this paper is the development of an IoT system for the detection of dust emitted during the real demolition of buildings.
For this purpose, we first investigated the IoT systems already present in the literature to verify if there were already some used in this sense. In particular, the system in [30] uses an IoT platform with embedded internal processors capable of monitoring dust, among other parameters. Environmental data are collected by the sensors and sent to the terminal node via ZigBee for real-time viewing on the host PC. The solution presented in [35], on the other hand, describes the prototype of an IoT system, based on sensors connected via Wi-Fi to an MCU node that forwards the data to the PC. Again, in [36], a system based on LoRaWAN technology is shown, where data are sent to the cloud for further processing. Finally, in [37] a sensor-based system is presented that uses a Raspberry as a server, which then also sends the data to the web for consultation.
In essence, therefore, the project of the systems presented, including that of this work, follows a common standard scheme, which consists of having a certain number of sensors that communicate with a master, which in turn transmits the data for consultation.
However, in the works cited, the various systems are designed and optimized for purposes other than that of this paper. In fact, in the conclusions of [35,36], an emphasis is placed on the fact that the developed system is aimed at the creation of smart cities, aiming at the integration with other monitoring systems. Similar conclusions are reached for [37]. In [30], however, the developed system responds to the need to monitor a single building from the point of view of energy consumption. Basically, all of these systems have been designed to be used for a long time, to monitor extremely large spaces and to integrate with existing systems. This is in order to create a city IoT network.
The needs to which this work responds to are instead diametrically opposed, and all the references’ parameters are changed as a result.
The first parameter is the duration of the survey, since in the case in question there is no need for it to be as long as possible. Indeed, it tends to last a few days, as many as the demolition activity lasts.
Furthermore, for the purposes of this work, a system capable of covering large portions of land was not required. Instead, this work requires a system optimized to detect the data relating to small areas as precisely as possible in an area slightly larger than the building being demolished.
Finally, compatibility and subsequent integration with existing systems are beyond our scope. Rather, the system must be extremely lean, flexible, as well as easy to disassemble in order to be moved quickly to other sites of interest, regardless of location or condition. It follows that, in the case in question, geographical location becomes superfluous, while independence from the point of view of power supply becomes fundamental.
It is then quite clear that the system should be characterized by the ability to detect multiple values simultaneously in a short time in order to provide detailed information to better calibrate any interventions.
Definitively, this work presents a system specifically designed, and therefore optimized, to meet these specific needs.
As a consequence of all that has been said, in this work we have explored a particular area which is still extremely neglected, despite the need for a radical change in the perspective from which the construction site is traditionally conceived and designed, as already highlighted above (especially bearing in mind the Sustainable Development Goals of the 2030 Agenda [30]). The novelty of this work is therefore precisely this: a new scenario on which there will be much to investigate based on the achieved results has been opened, in the opinion of the authors. In fact, the results obtained here demonstrate how reckless the carelessness shown so far towards construction sites has been, in the context of which, especially during activities such as demolition, the values of PM 2.5 and PM 10 are—as will be seen below—well beyond the limit of safeguarding health and they remain so for the entire working day, making the issue even more serious.
The outline of the paper is as follows: In Section 2, the methodological approach and the components used are described, while in Section 3 and Section 4, the results and the discussion are reported, respectively. Finally, conclusions are drawn in Section 5.

2. Materials and Methods

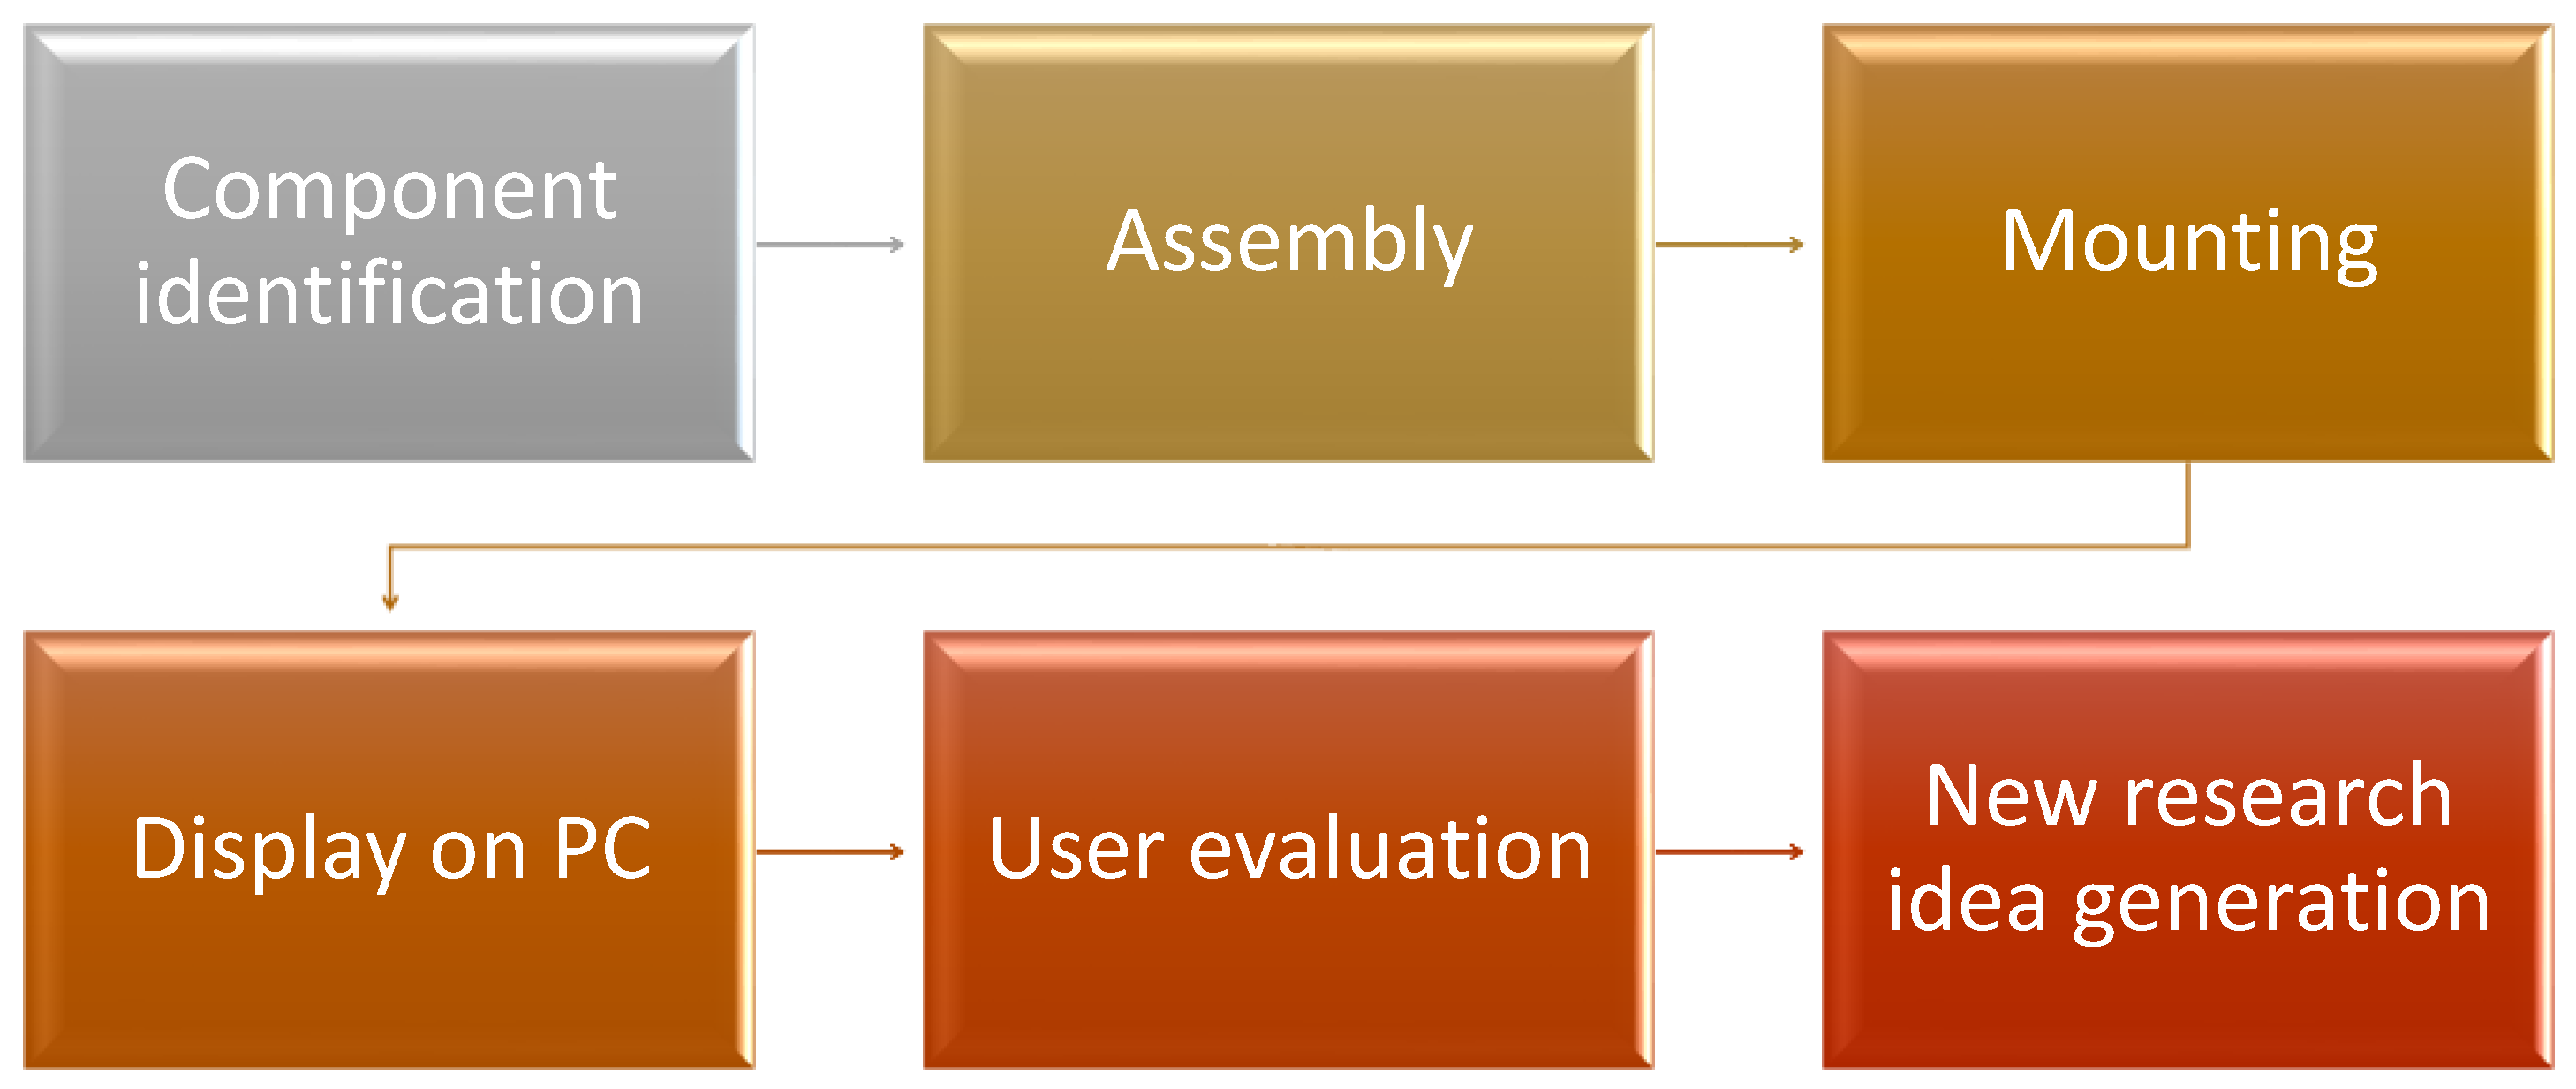
Figure 2 shows the block diagram of the research method followed in this work.
First, the most suitable components in terms of sensors and data loggers were identified. The selection criteria were based on the evaluation of the best compromise between accuracy and cost-effectiveness. Then, we moved on to the assembly phase. In particular, each sensor was positioned inside an IP box, suitably powered, and connected wirelessly to the other elements of the system. The system thus created is hereinafter referred to as the “node”. The third phase was mounting, that is, the in situ assembly of the various nodes and the system as a whole. The next phase was to view the data on the PC. After reading them, the interpretation and evaluation of the results followed (fifth phase), and from these, the future developments of the present research were hypothesized. The scheme shown in Figure 2 could, however, turn into an infinite loop. The development of new ideas, in fact, could lead to a possible re-evaluation of the sensors best suited to the new needs, to the subsequent assembly, and so on.
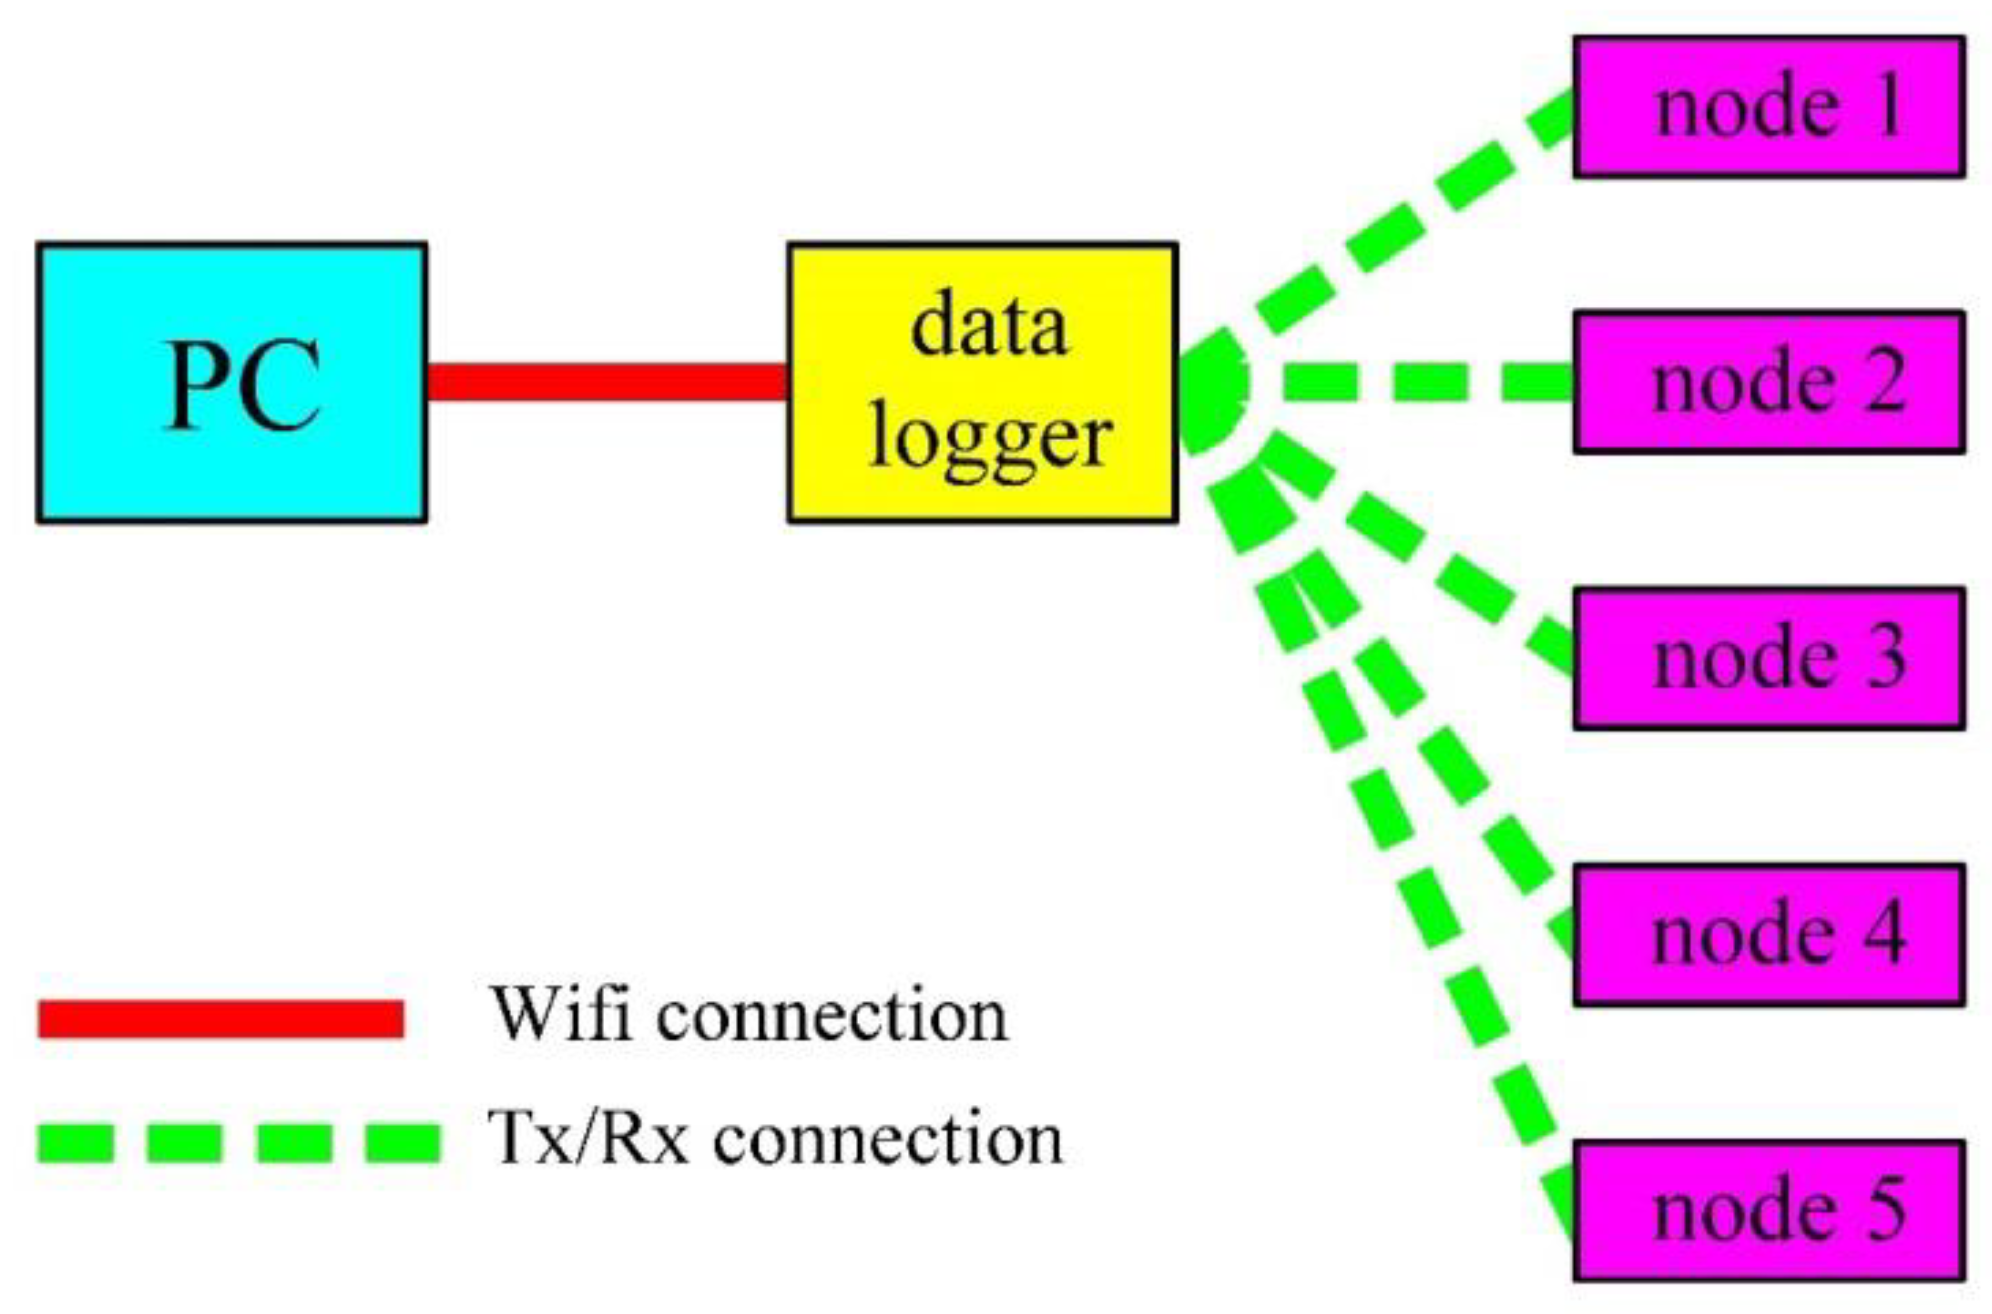
Following the previously described scheme, a preliminary study related to the detection of dust during the demolition of a building was conducted and presented in [38]. Since the results have been satisfactory, we have deepened the analysis. A more complex and performing system was therefore developed. Figure 3 shows a general block scheme of this system.
The developed system as a whole is characterized by its economy and extreme simplicity of use. Furthermore, the returned data are easily usable to anyone in possession of the appropriate credentials.
Five nodes have been developed, each positioned at different distances from the site of interest. This made it possible to have a greater number of information, and above all to study how the impact of dust changes as a function of the distance.
Furthermore, with respect to the solution proposed in [38], the memory on board of the nodes has been eliminated. In that case, in fact, the data were downloaded manually, physically taking the memory from each single node at the end of each acquisition period (typically a working day). This obviously meant that the single node had to be necessarily positioned in places that were always easily accessible. It also increased the risk of damage to the nodes themselves.
The nodes presented in this work, instead, do not store the data on board, but have the ability to continuously send them to the data logger which, in turn, transmits them to the PC. Furthermore, as we will see in more detail, the data will be available to anyone with the appropriate access credentials.
The characteristics of the whole system from the point of view of accuracy, precision, and durability are, however, related to the intrinsic characteristics of the sensors used. As described in this paper, one of the objectives of the developed system was it was to be inexpensive. This imposed us to use low-cost sensors. Among the available ones, we chose the SDS011 sensor, widely disseminated and documented in the literature [35,36,37,39,40,41,42], even with extremely recent articles which have dealt well with the issue of its performance. In particular, in [41], which constitutes a review of low-cost sensors, the SDS011 sensor is judged to be one of the best performing. More specifically, from the point of view of accuracy and precision, the solution shown in [42] emphasizes that accuracy falls within the range of 81–98%, while the accuracy is an average of 1 min data. As far as durability is concerned, in [43] it is noted that the life cycle of the sensor is 8000 h. This duration, apparently not exceptional in the case of prolonged use, does not compromise the purpose of our work. The demolition activity, in fact, has a limited duration in terms of days, after which it makes no sense to keep the system (and therefore the sensor) running.
In the following, the characteristics of each system component of the block will be detailed.

2.1. System Nodes

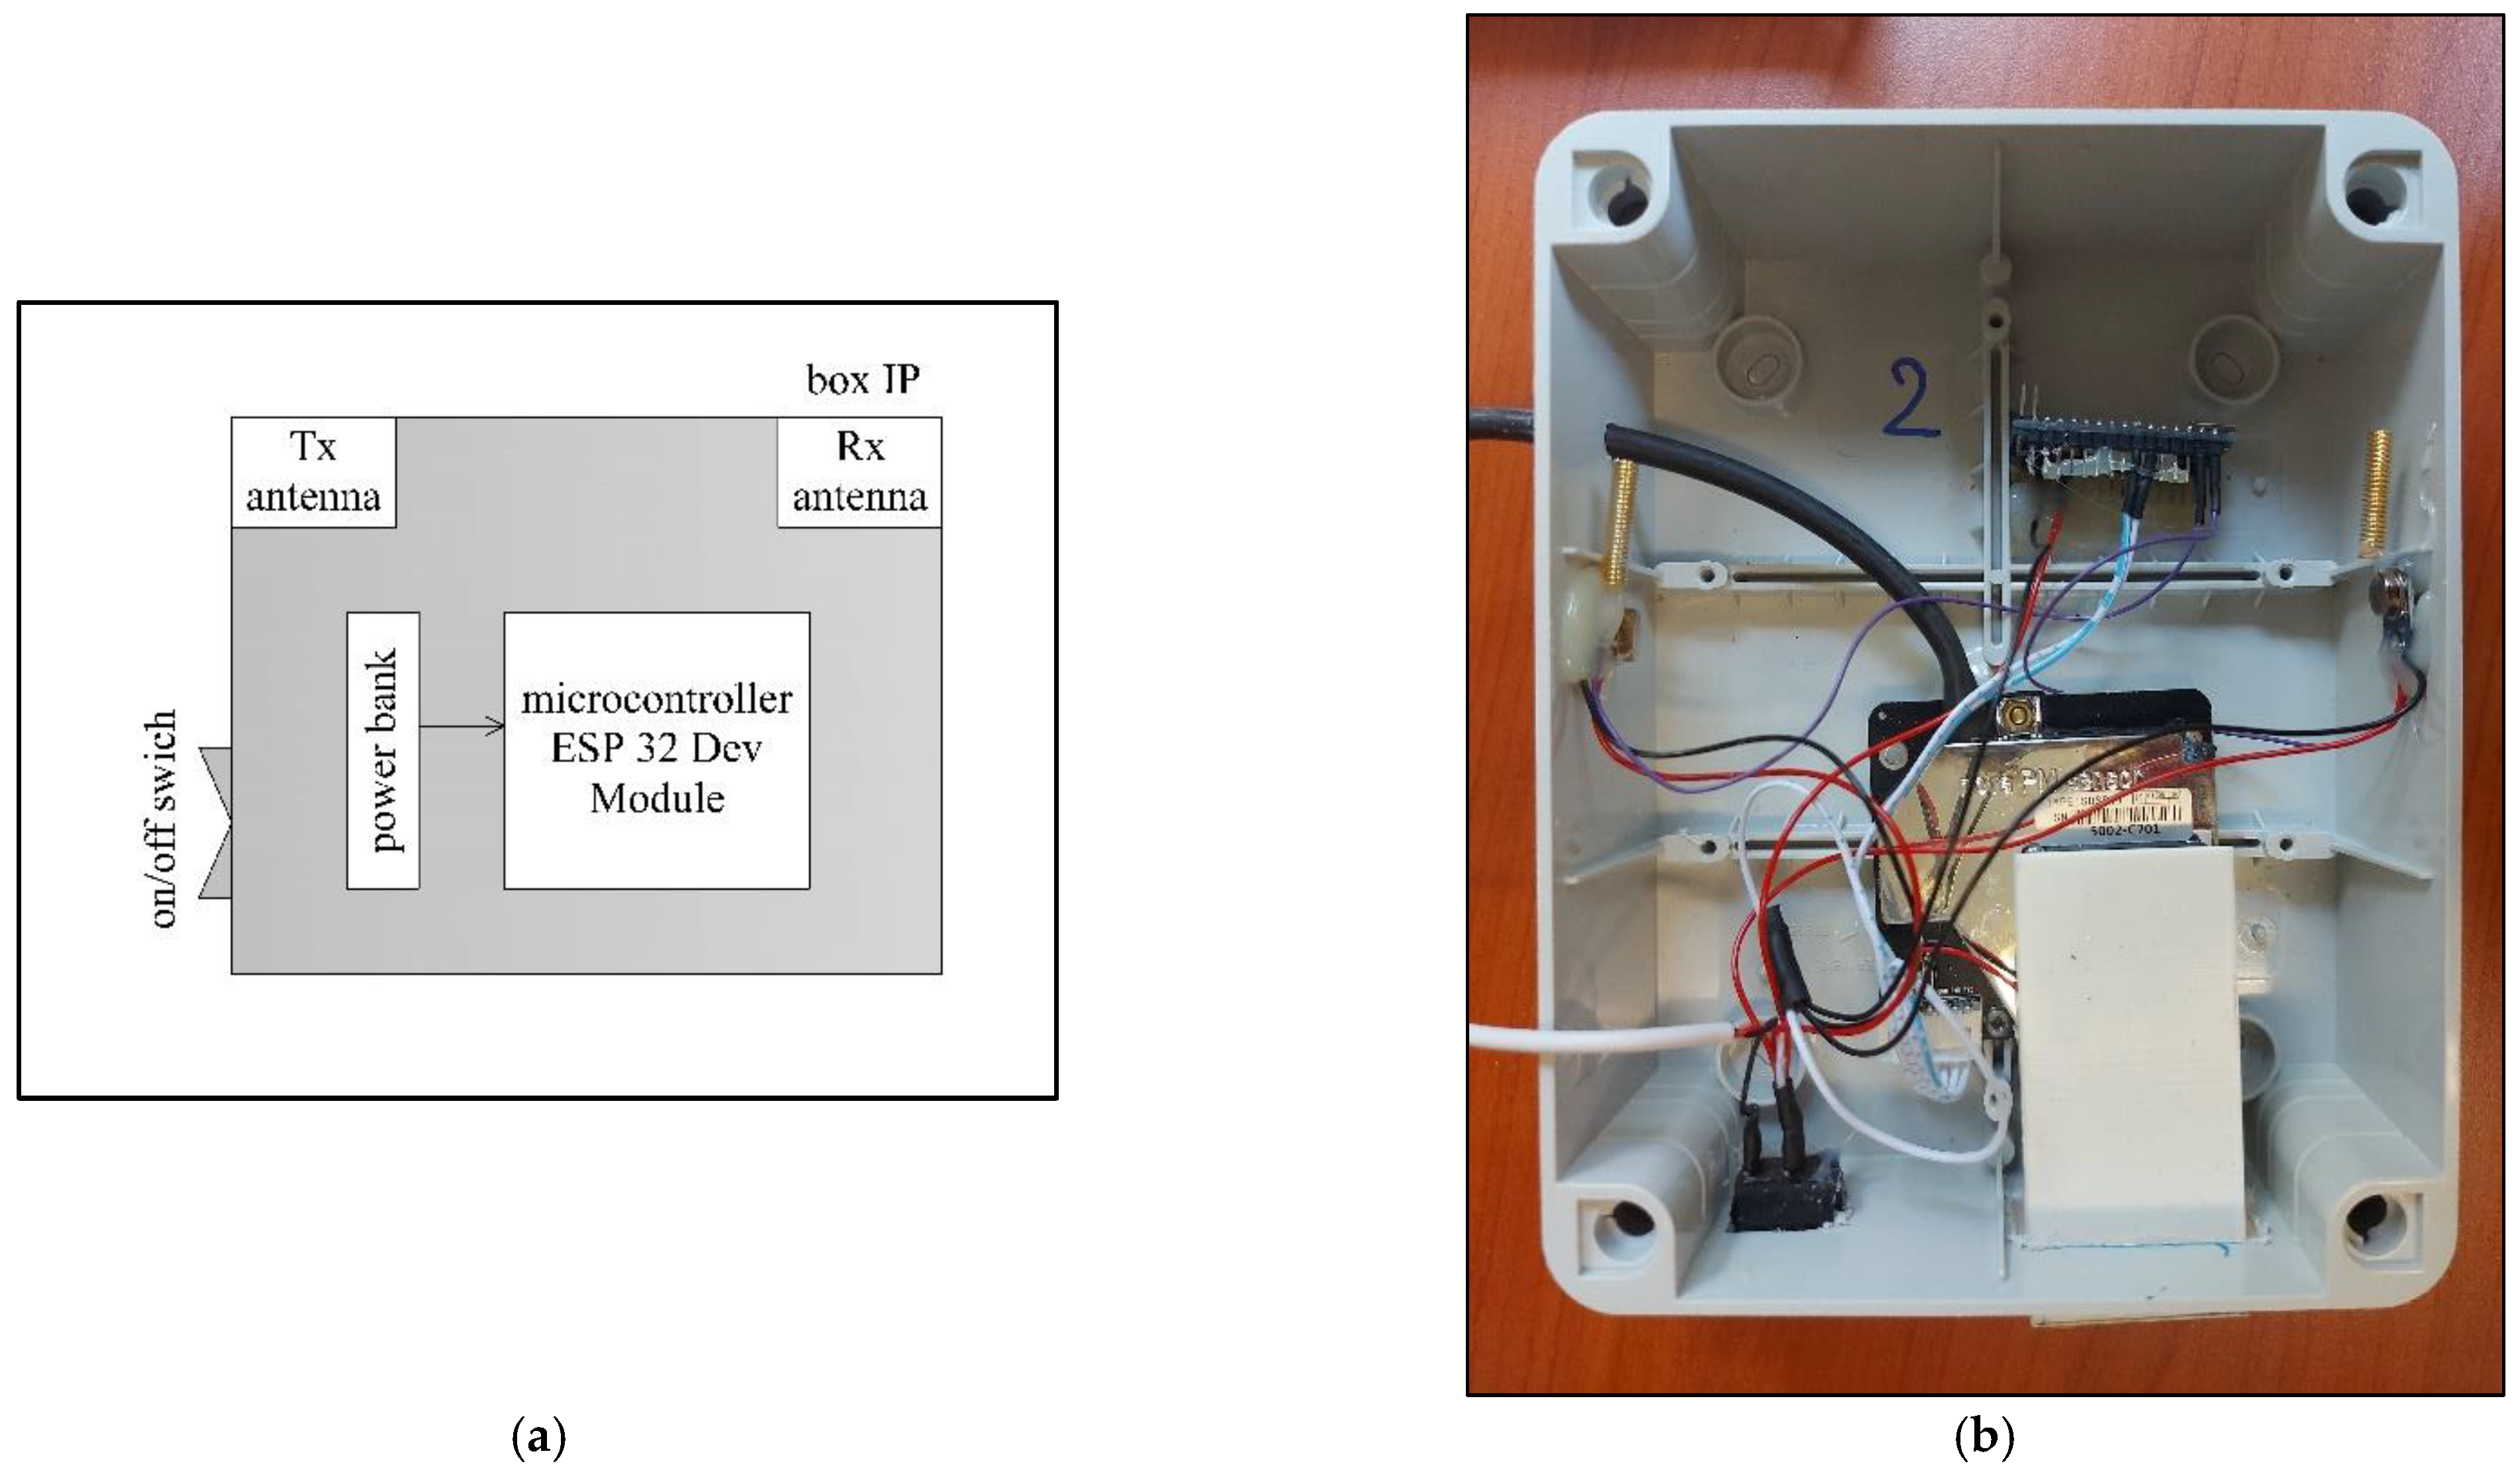
As already mentioned, the system nodes represent the elements capable of effectively detecting the dust present in the air, with particular reference, in the case in question, to PM 2.5 and PM 10. Figure 4 shows the diagram of a single node (a) and a photo reference (b).
Dust detection takes place by employing a specific air quality sensor, named SDS011 [43]. Its operation is based on the principle of laser diffusion. Basically, when the particles cross the detection area, the diffusion of light is induced. This light is then suitably transformed into electrical signals which are subsequently amplified and processed so to have the required values.
This sensor is also characterized by both high precision and reliability, thanks to the laser detection, and a fast response (lower than 10 s). Furthermore, it has a very high resolution of 0.3 μg/m3 and is easily integrated.
Figure 5 shows a picture of the sensor, while Table 2 gives the related main technical parameters.
The previously described sensor is connected to an Arduino microcontroller. The latter’s task is twofold. In fact, it translates the detected quantities of PM 10 and PM 2.5 into numerical form and subsequently sends these data to the data logger through the Tx/Rx antennas present inside the node itself.
Finally, all the elements described above are placed in an appropriate IP-grade box. The operation of the node can be regulated from the outside through an on/off switch, and the power supply is ensured by a 10,000 mAh power bank, also mounted inside the IP box.
From a practical point of view, then, when the node is switched on, the dust is conveyed towards the fan integrated in the sensor. Subsequently, thanks to the microcontroller, the quantities of PM 2.5 and PM 10 are transformed into a numerical form and sent to the data logger. The dust is finally expelled through the hose.

2.2. Data Logger

Figure 6 shows the diagram of the data logger (a) and a reference photo (b).
The data logger’s task is, as already mentioned, to receive data from the microcontroller of each single node through the Tx/Rx antennas. In addition to this, the data logger takes care of making these data available to users by sending them to the PC using this time a Wi-Fi connection.
In this case, data loggers and antennas are mounted inside an IP box. The power supply is also ensured by a power bank. However, during the laboratory tests it emerged that the data logger had a much higher consumption than the single nodes. For this reason, in this case we have chosen to power it with a 20,000 mAh power bank to guarantee its operation for about three days.

2.3. Data Consultation Platform

The Ubidots platform was used to consult the data. It is characterized by a high easiness of use; it is open-source (at least in the basic version, more than sufficient for this work); and it allows the real-time viewing of the data received in the form of graphs. It also allows the download of the corresponding .csv file. To be able to use this platform, you must simply create your account and set your username and password. Obviously, the data can be consulted on any PC (or even by phone) and by anyone in possession of the set credentials.
Figure 7 shows a screen of the platform home page.

2.4. The Case Study—Experimental Set Up

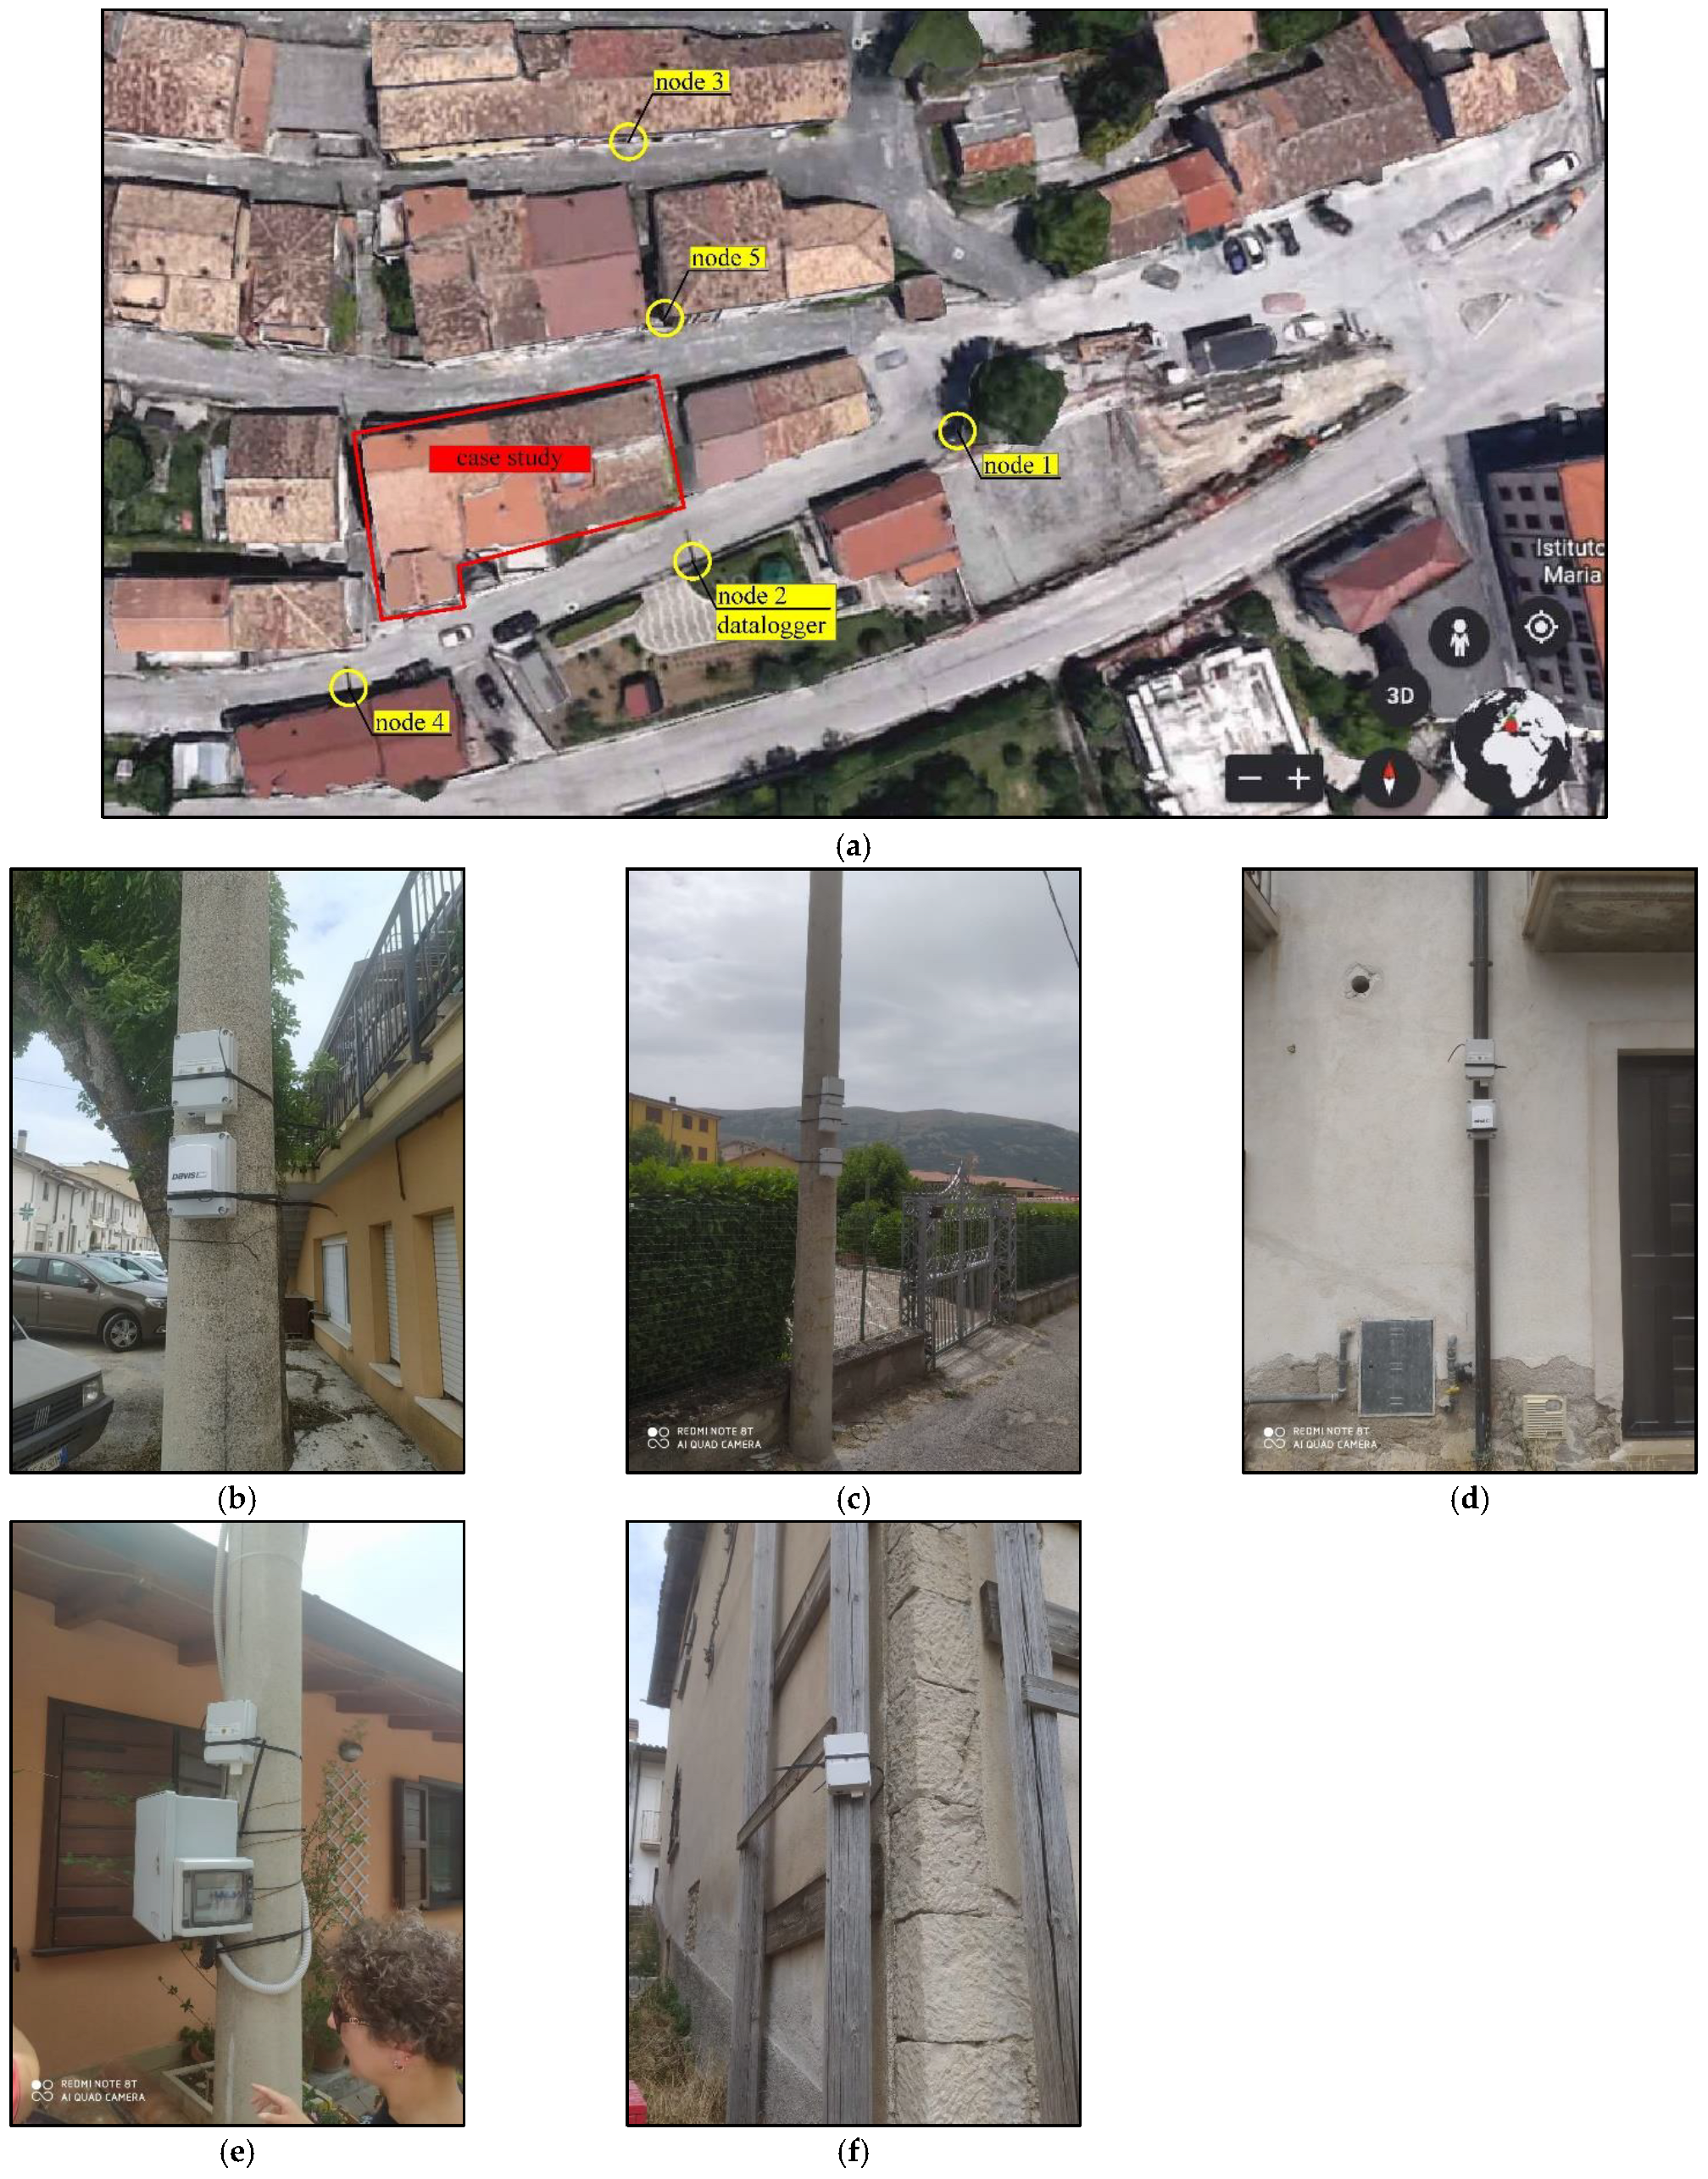
In the case study described here, five nodes were used. They were placed near a building located in a hamlet of L’Aquila which was really demolished following the serious damage suffered in the earthquake of 6 April 2009 in L’Aquila. This building is located in the historic center of Roio, near L’Aquila, between via San Leonardo and via Madonna di Roio, in an area that is not densely populated and characterized by being in the vicinity of construction sites used in the reconstruction of buildings damaged by the earthquake. Immediately around the construction site, there is an absence of sensitive receptors. The working phase of interest for this study is the one that has the greatest impact in terms of fine dust pollution, namely the phase of demolition of the aggregate. For this reason, dust monitoring will be carried out for the entire duration of the process.
The building object of interest consists of an aggregation of several buildings spread over two levels, with as many real estate units. From a construction point of view, it is made up of load-bearing walls made of disordered stone masonry and the roof is wooden with tiles at the top. The criticism found to be taken into consideration with regard to the production of powders are the limited external spaces with the possible creation of the tunnel effect and consequent stagnation of the powders and inadequate dispersion. Figure 8 shows both the plan of the area of interest with the location of the system elements (nodes and data logger), and the photos of each of them after installation.
Keeping in mind the limitations related to technology widely discussed in the paper, the exact location of the nodes is the result of a careful evaluation aimed at reconciling different needs. On the one hand, there is a clear need intrinsic to the present work to understand how the measurements change as the distance and wind vary (which has also led us to the new ideas for future developments reported in the conclusions). On the other hand, we have also considered the practical need to have easily accessible physical supports, which for the most part do not fall into private areas and do not hinder the daily activities of the area’s inhabitants.
The type of demolition that the building company undertook was the traditional uncontrolled type with a hydraulic grapple, followed by a recovery and reuse of the area. Figure 9 shows some stages of the demolition.
The positive aspect linked to this practice is the speed in carrying out the work. On the other hand, there is a high risk for the operators, both for the noise produced and for the vibrations and dust generated. This last risk is generally mitigated by using a manual lance to move along the demolition front.

3. Results

The demolition activity was monitored on two consecutive days, in particular 23 and 24 June 2022. The system was then left active until the power banks were unloaded in order to have a direct comparison between the measurements made during the demolition and activities suspended for the weekend.
In the rest of this section, the analysis of about 3000 values (300 of PM2.5 and 300 of PM10 for each of the five nodes) considered the most significant is presented.
The measured values are graphically represented in Figure 10, Figure 11 and Figure 12. In the same graphs, the threshold lines set by Europe (in green) and the WHO (in red) are reproduced to facilitate an immediate comparison of the situation.

3.1. Results of 23 June 2022

Figure 10 shows the data related to the day of 23 June 2022. In particular, the survey starts at 11:29 (immediately after the installation of the system) and continues uninterrupted until about 17:00, i.e., until the end of working hours. Figure 13 shows the results relating to PM2.5 (a) and PM10 (b).
As can be seen, the trends of the graphs are absolutely superimposable. In effect, this means that the demolition activity involves an increase in both types of particulate matter.
Furthermore, the maximum peak of the survey is obtained from node 5. This is not accidental since the demolition activities started right from the part of the building immediately next to it.
Figure 10. (a,b) Comparison between data recorded during active demolition work and after demolition work s stopped.
Energies 15 07272 g010

3.2. Results of 24 June 2022

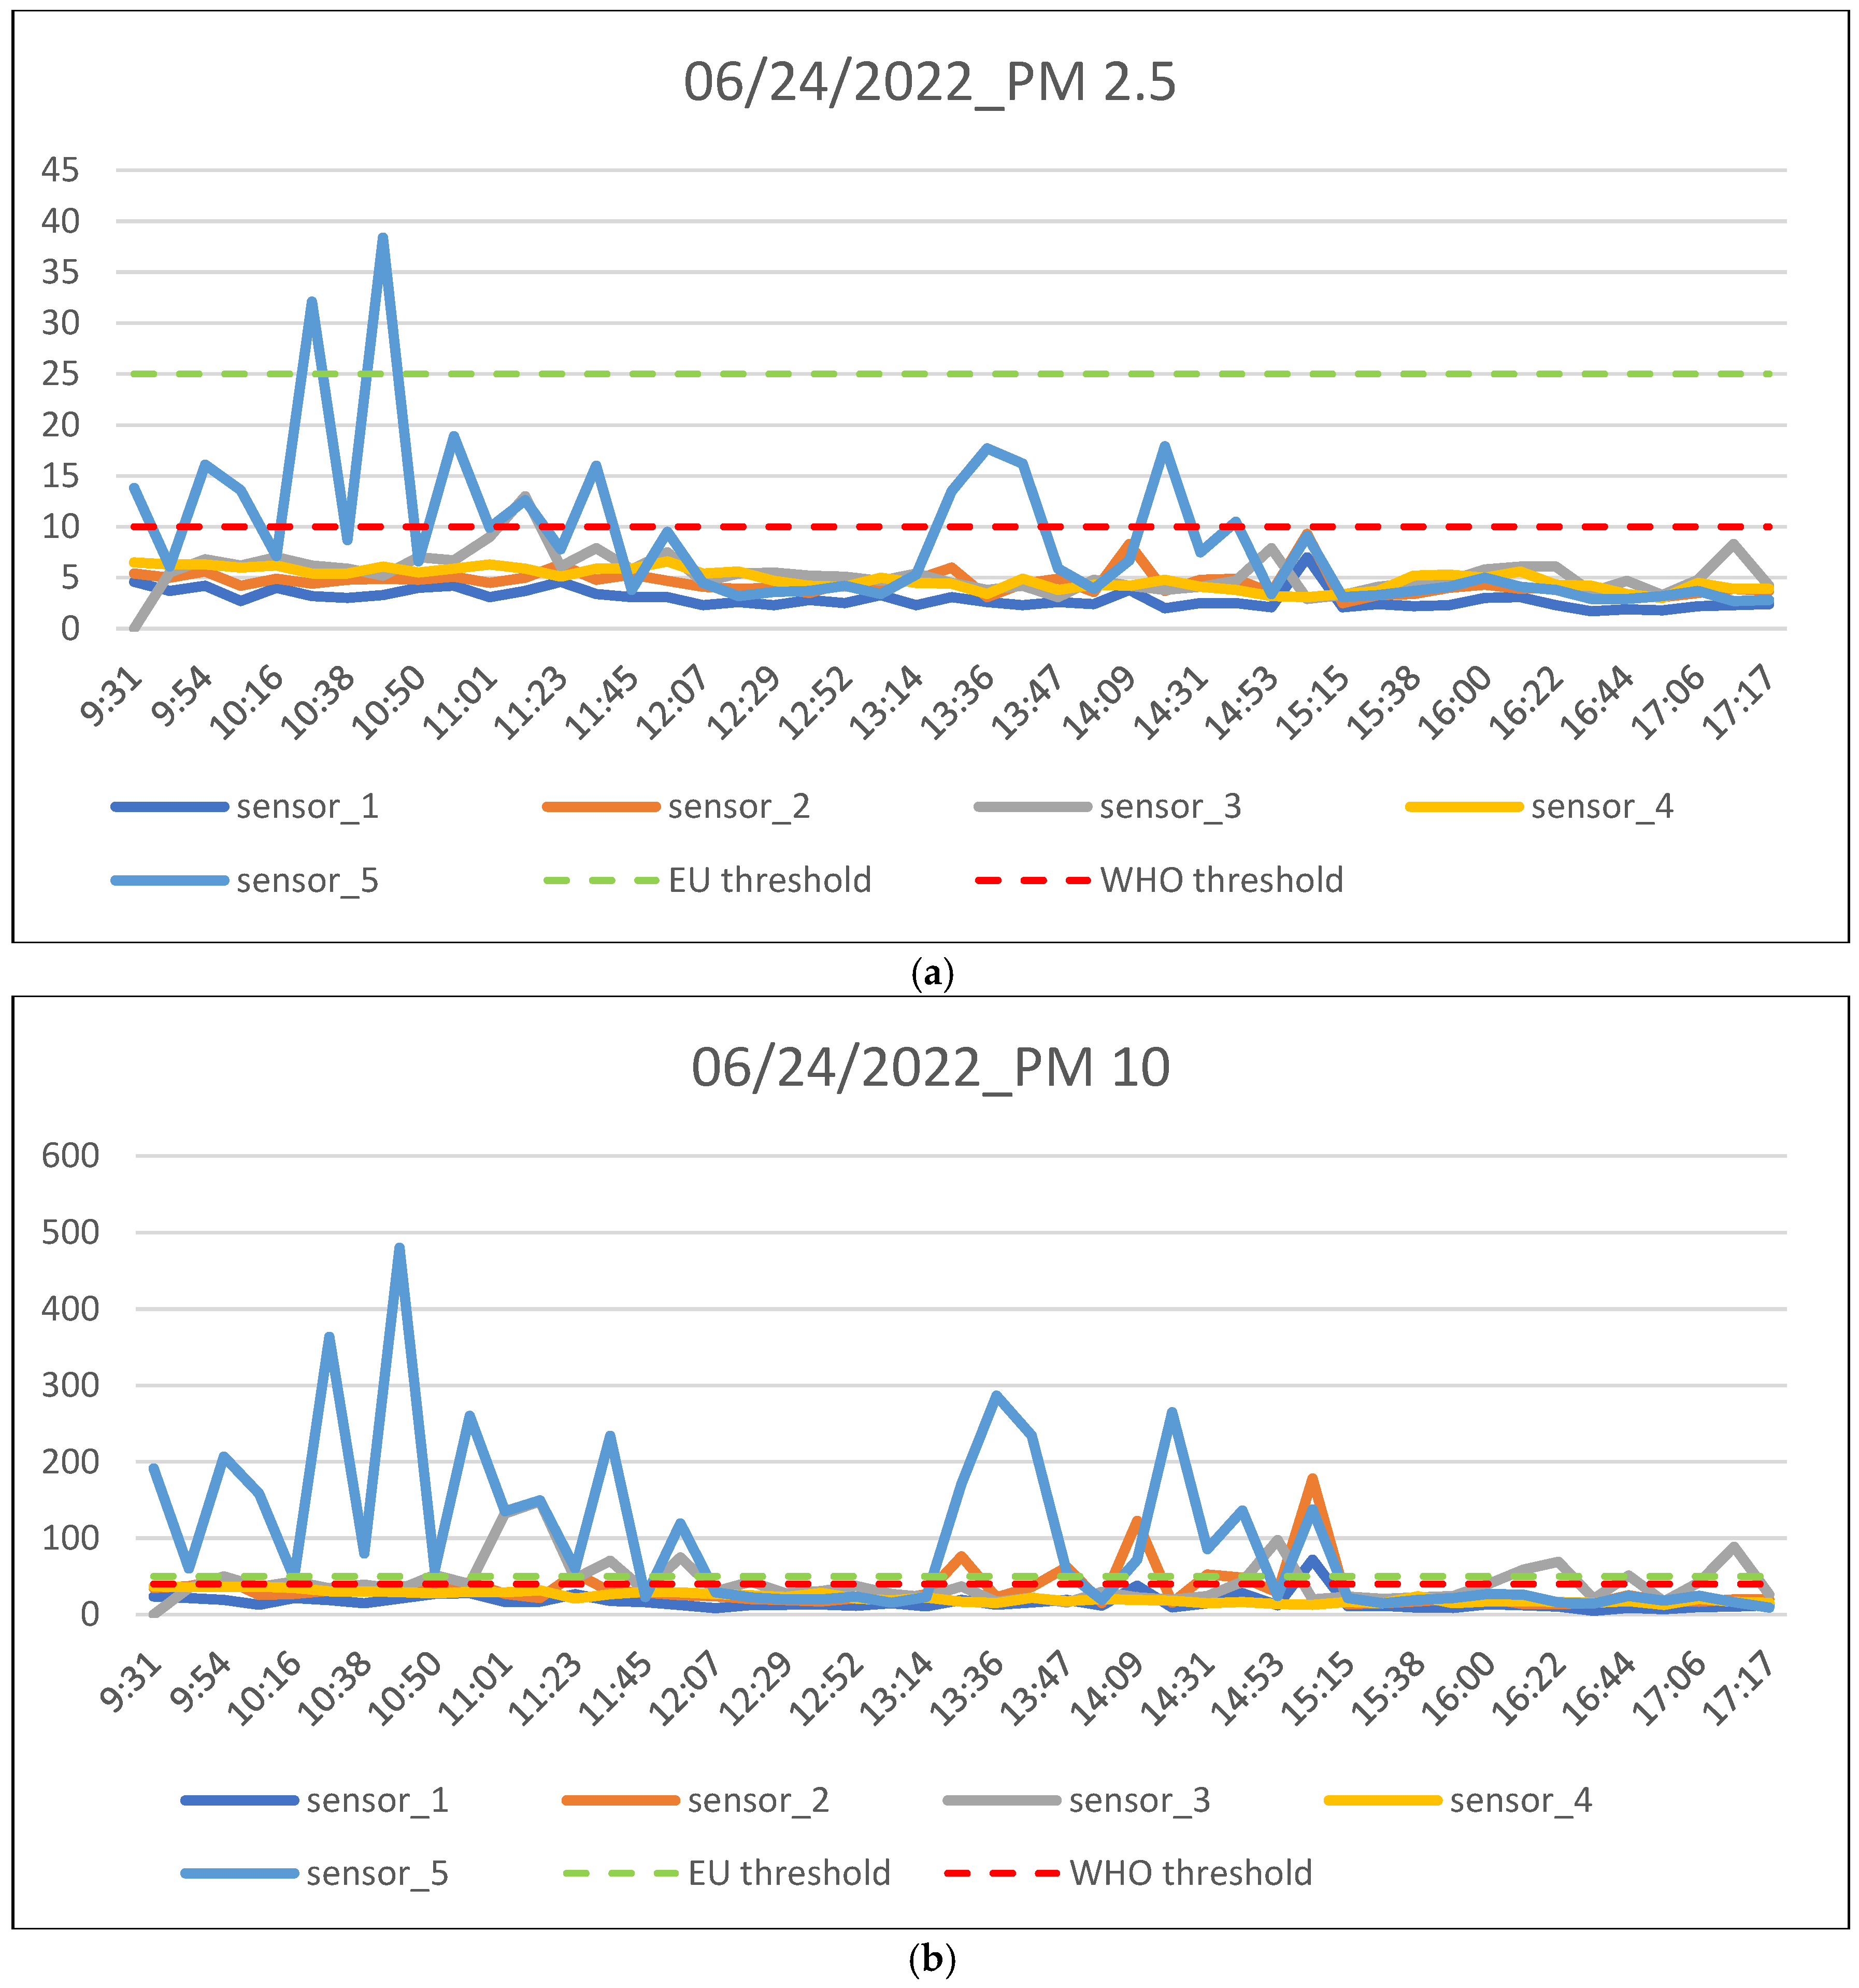
Figure 11 below shows the data relating to 24 June 2022. In this case, the survey started at 9:30 a.m. and ended at approximately 5:20 p.m.
As before, Figure 12 shows the results for PM 2.5 (a) and PM 10 (b).
Figure 11. Result of the measurements of PM 2.5 (a) and PM 10 (b) on 24 June 2022.
Energies 15 07272 g011
In this case, all the nodes returned values that, in some moments, exceeded the thresholds set by the relevant regulations.
The exception is node 4, which does not seem to detect amounts of PM beyond the threshold. Most likely, this could be due to the action of the wind. The implications of the wind in the detection of dust could constitute a future further development of the present work.

3.3. Results of the Surveys with Standstill Activities
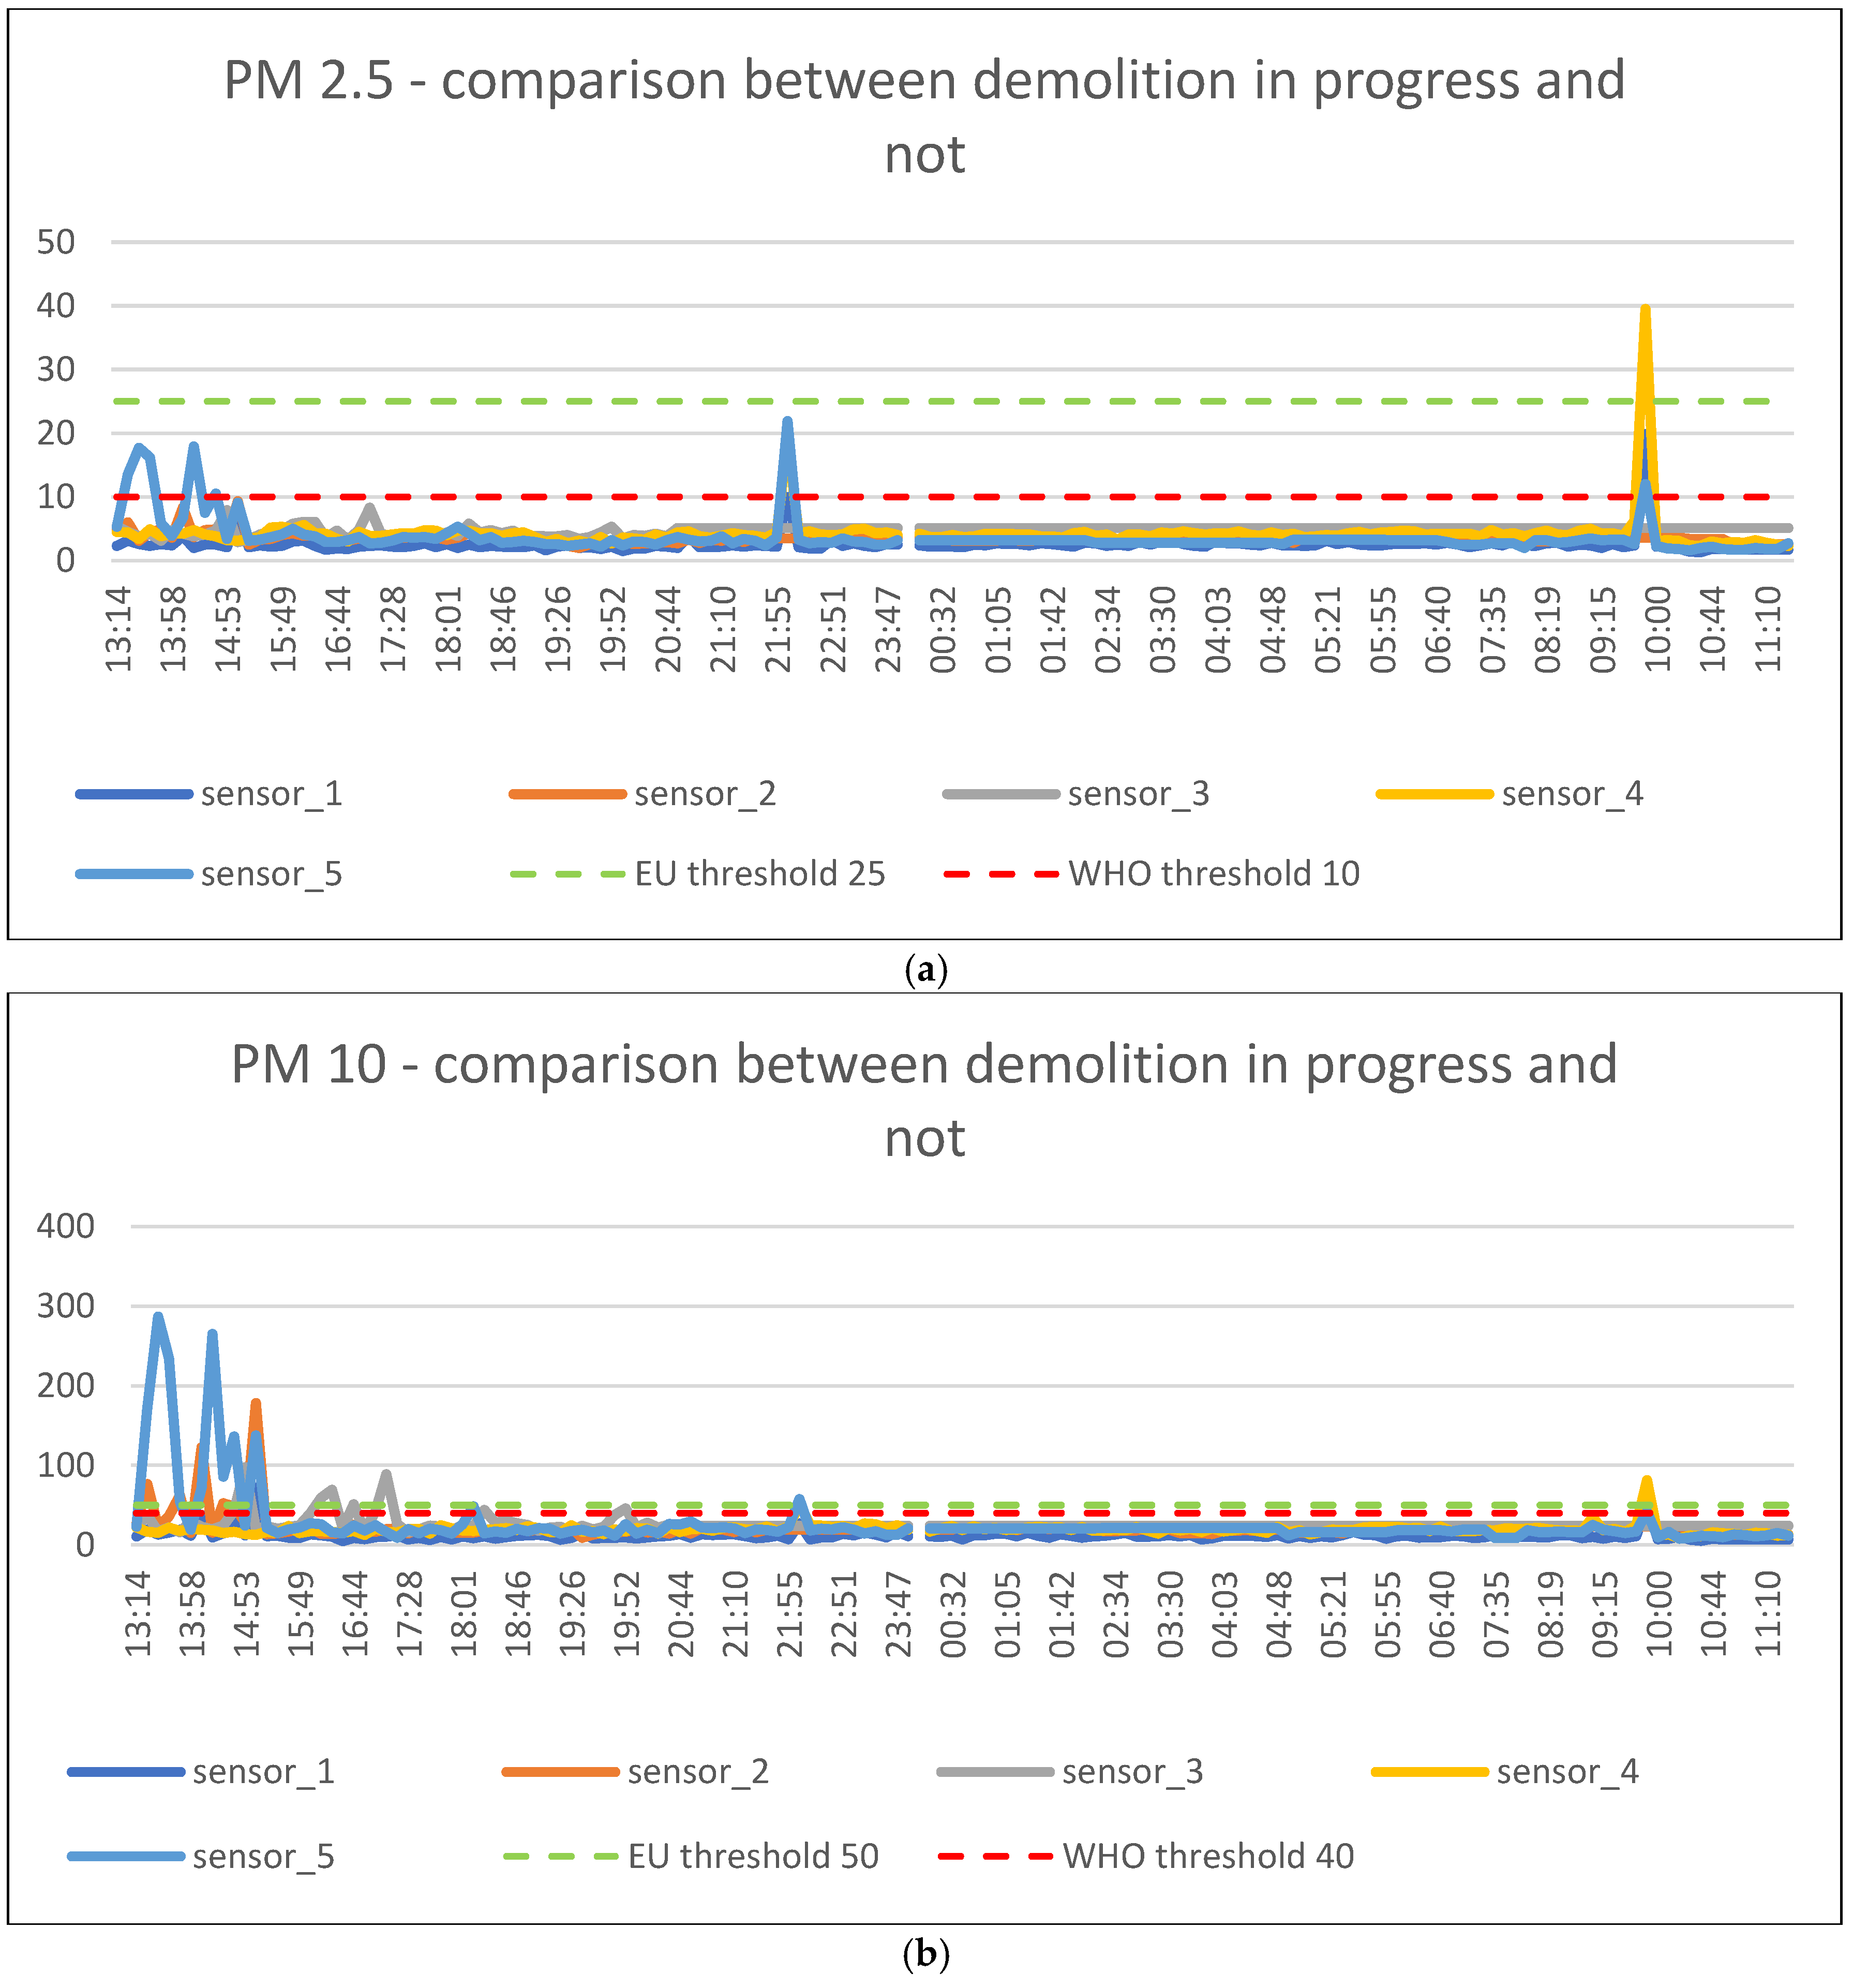
Finally, Figure 12 shows the dust levels detected outside working hours.
Specifically, the values obtained on 24 June, starting at around 1:00 pm and subsequently, those obtained on 25 June (Saturday), a non-working day, are represented. On this day, the survey continued until 11:10 am, the time when the system stopped working due to the power bank being unloaded.
Figure 12. Result of the measurements of PM 2.5 (a) and PM 10 (b) at a standstill.
Energies 15 07272 g012
As can be seen, on the 24th there are still isolated peaks of fine dust. This is probably due to the fact that the powders need a certain amount of time to settle definitively.
In fact, on the 25th, the situation appears considerably calmer, and the level of dust in the air remains well below the permitted limits. The only noteworthy moment, albeit characterized by values well below those detected during the demolition, is detected by node 4 around 10:00. However, remembering that we are on a public road, it cannot be excluded that a vehicle passed at that moment.

3.4. Final Comparisons

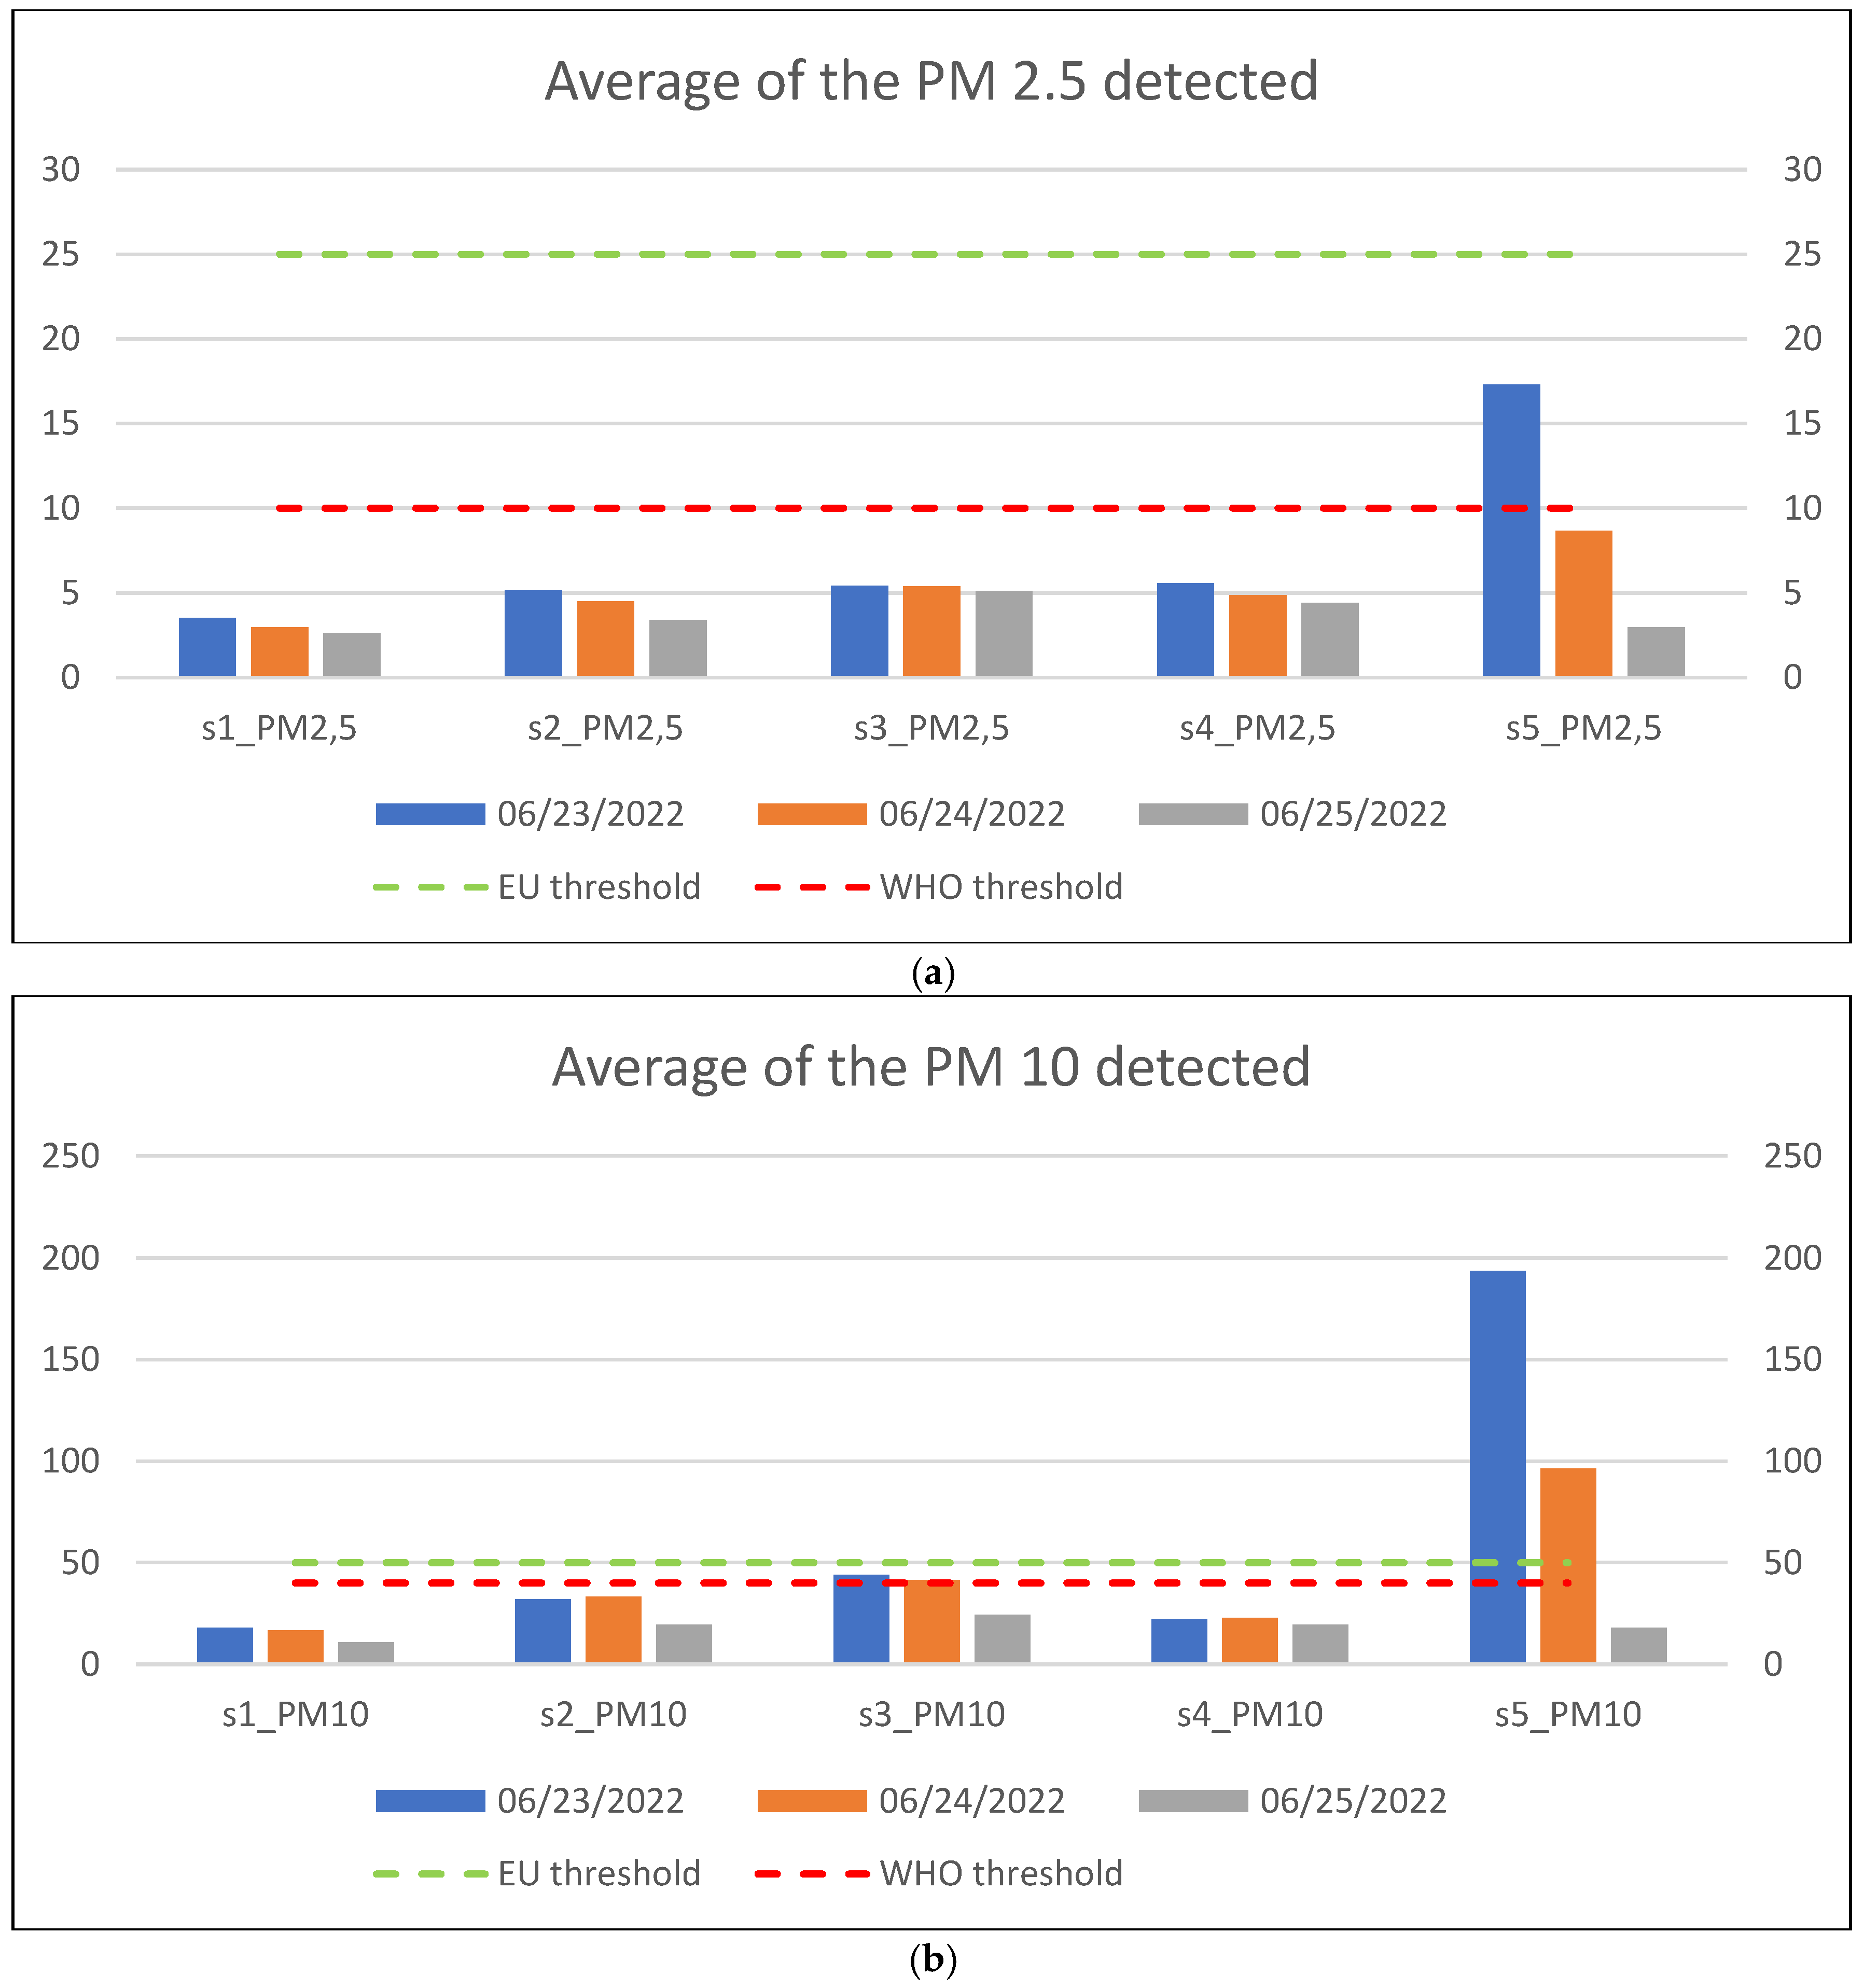
Finally, in Table 3 and Table 4, and in Figure 13, the average of the values measured over the three days is shown.
In particular, those above the threshold are highlighted by a red square in each table.
Figure 13. Average of the detected value of PM 2.5 (a) and PM 10 (b) at a standstill.
Energies 15 07272 g013
The reported values give further confirmation of the fact that node 5, the node closest to the site of interest, is the one that detects the highest values.

4. Discussion

This work describes a system capable of detecting PM 2.5 and PM 10 particles emitted during the demolition of a building. This system makes it possible to evaluate the real level of dispersed dust, keeping the possibility of exceeding of the thresholds set by both Europe and the WHO under control.
The system is based on the use of five nodes, each equipped with an Arduino microcontroller and an SDS011 sensor, characterized by great sensitivity for the detection of dust. The nodes communicate with the data logger, then with another microcontroller in charge of sending the data to the PC, the ESP 32 Dev Module. Thanks to the system under examination, the problem of data storage is overcome. In fact, there is no longer the need to store the data directly onboard; instead, the same data are sent and stored directly in a special database. This eliminates the need to have a memory card for each node and, above all, the need to intervene directly on the node with the risk of damaging it. Furthermore, this allows you to position each single node, even in places that are not easily accessible on a continuous basis.
The system is also capable of handling a large amount of data. In the proposed system, 10 values (one of PM 2.5 and one of PM 10 for each of the five sensors) were acquired at approximately 4 min intervals for nearly three consecutive days. However, it should be specified that the system would also be able to withstand a further increase in the data itself, due, for example, to an increase in the total number of nodes or to an increase in the parameters detected for each node (for example, by inserting an anemometer that allows the detection of wind direction). In fact, the proposed system stopped working not because it was saturated, but simply because the power bank was unloaded. This means that, using other solutions, such as better-performing power banks or, if the conditions apply, alternative energies, the life of the system is theoretically infinite.
Furthermore, the high precision of the data collected makes the system particularly sensitive and precise. Parallel to the study presented here, in fact, an experiment was conducted using commercial sensors commonly purchased on the internet, and positioned near some of those presented here. The result of the surveys in this case was extremely disappointing and not very significant. While the system proposed here has returned significant values in relation to the various moments of the activity, the values detected by the commercial sensors were significantly flattened, denoting a much lower sensitivity than the proposed nodes.
The proposed system is also extremely versatile and can be used whenever it is necessary to detect possible dangerous situations related to the emission of fine dust into the atmosphere. In this case, it was used to monitor the demolition of a building damaged by the L’Aquila earthquake, but it could easily be used in any other situation where such monitoring is necessary.
It must be said that, at present, an intrinsic limit of the proposed system is given by the distance at which the nodes must be placed (about 25 m and in visibility) with respect to the data logger. However, for the needs dictated by the case in question, this was not a problem but certainly among the future developments of the system, we can also include overcoming this difficulty.
Furthermore, considering that the results are made available in real time, they will allow workers in the trade to make appropriate assessments in order to protect both the people who live or in any case may be in the vicinity of the site for various reasons and workers as much as possible through appropriate prevention and protection measures. In fact, the ability to monitor the emission production in real time allows the site safety coordinator and also the employer to take timely decisions to safeguard the wellbeing of workers. For example, as soon as any critical conditions arise, it will be possible to promptly switch on an additional lance or a new sprayer or even to temporarily suspend work. Moreover, given the windy conditions of the site, a different work schedule can be defined to better distribute the demolition phases in order to reduce emissions. Ultimately, the focus on the particular issue of dust produced by urban demolition and reconstruction sites can be particularly important to promote awareness among all actors in the construction industry and to spread a culture of prevention and safety.
Ultimately, given the interesting reflections that this work has aroused, the future developments of this research may also be significant and continue to involve various engineering sectors in a transversal manner.

5. Conclusions

In the present work, an electronic system for the sensing of fine dust has been presented. In particular, the system detects the quantities of PM 2.5 and PM 10 emitted during the demolition of a building located in L’Aquila that was severely damaged following the 2009 earthquake. The system is based on a data logger that receives data from five nodes equipped with dust sensors. These data are transferred in real time to the PC and, at the same time, stored for future consultations. The experimental results confirmed how critical the demolition of a building is from the point of view of the emission of fine particles.
The strengths of the system presented essentially reside in the cost-effectiveness, simplicity of use, the ability to manage a large amount of data, the high accuracy of the surveys, and versatility.
There are certainly some weaknesses: first of all, the need for nodes and data loggers to be placed in perfect visibility and at a distance of no more than 25 m.
The future developments of this work will concern the monitoring of further construction sites, even more complex ones, in order to further expand the proposed system (both from the point of view of the number of nodes and from that of the number of parameters detected by each of them) to overcome the problems that have emerged and, ultimately, to confirm and enrich the good results obtained so far.

Author Contributions

Paper conceptualization and administration, R.P. and M.R.; writing—original draft preparation and final version, R.P. and M.R.; supervision R.P., M.R. and G.F.; software, A.P. and S.R. All authors have read and agreed to the published version of the manuscript.

Funding

The research presented in the paper was partially funded by the University of L’Aquila as part of the project “Definition of best practices and risk mitigation strategies due to the production of pollutants on construction sites”, Scientific director M.R. (Rector Degree Rep. n. 786 del 13 July 2021).

Acknowledgments

The authors thank Federica Cucchiella and Vincenzo Stornelli for the support given. They also thank Antonello Cucchiella and Adan Costruzioni S.r.l. for making the construction site under study available and Maria Ida Mancini for the support.

Conflicts of Interest

The authors declare no conflict of interest.

References

  1. Eun-Min, C.; Hyung Jin, J.; Dan Ki, Y.; Si Hyun, P.; Hyung Jin, H.; Kil Yong, C.; Heun Woo, C.; Hyo Chang, C.; Cheol Min, L. Reliability of Low-Cost, Sensor-Based Fine Dust Measurement Devices for Monitoring Atmospheric Particulate Matter Concentrations. Int. J. Environ. Res. Public Health 2019, 16, 1430. [Google Scholar] [CrossRef] [Green Version]
  2. Xiaoling, Z.; Liyin, S.; Lei, Z. Life cycle assessment of the air emissions during building construction process: A case study in Hong Kong. Renew. Sustain. Energy Rev. 2015, 17, 160–169. [Google Scholar] [CrossRef]
  3. Ko, J.; Ni, Y. Technology developments in structural health monitoring of large-scale bridges. Eng. Struct. 2005, 27, 1715–1725. [Google Scholar] [CrossRef]
  4. Cigada, A.; Moschioni, G.; Vanali, M.; Caprioli, A. The measurement network of the San Siro Meazza stadium in Milan: Origin and implementation of a new data acquisition strategy for structural health monitoring. Exp. Tech. 2010, 34, 70–81. [Google Scholar] [CrossRef]
  5. Ni, Y.; Xia, Y.; Liao, W.; Ko, J. Technology innovation in developing the structural health monitoring system for Guangzhou New TV Tower. Struct. Control Health Monit. 2009, 16, 73–98. [Google Scholar] [CrossRef]
  6. Velmurugan, R.; Balaganesan, G. Modal analysis of pre and post impacted nano composite laminates. Lat. Am. J. Solids Struct. 2011, 8, 9–26. [Google Scholar] [CrossRef] [Green Version]
  7. Muttillo, M.; Di Battista, L.; de Rubeis, T.; Nardi, I. Structural health continuous monitoring of buildings—A modal parameters identification system. In Proceedings of the 4th International Conference on Smart and Sustainable Technologies (SpliTech), Bol (Island of Brac) and Split, Croatia, 18–21 June 2019. [Google Scholar] [CrossRef]
  8. Lifshitz, J.; Rotem, A. Determination of Reinforcement Unbonding of Composites by a Vibration Technique. J. Compos. Mater. 1969, 3, 412–423. [Google Scholar] [CrossRef]
  9. Kim, J.; Ryu, Y.; Cho, H.; Stubbs, N. Damage identification in beam-type structures: Frequency-based method vs mode-shape-based method. Eng. Struct. 2003, 25, 57–67. [Google Scholar] [CrossRef]
  10. Gomes, G.; Ancelotti, A.; da Cunha, S. Residual stress prediction in porous cfrp using artificial neural networks. Compos. Mech. Comput. Appl. Int. J. 2018, 9, 27–40. [Google Scholar] [CrossRef]
  11. Cawley, P.; Adams, R. The location of defects in structures from measurements of natural frequencies. J. Strain Anal. Eng. Des. 1979, 14, 49–57. [Google Scholar] [CrossRef]
  12. Aloisio, A.; Di Battista, L.; Alaggio, R.; Antonacci, E.; Fragiacomo, M. Assessment of structural interventions using Bayesian updating and subspace-based fault detection methods: The case study of S. Maria di Collemaggio basilica, L’Aquila, Italy. Struct. Infrastruct. Eng. 2020, 17, 141–155. [Google Scholar] [CrossRef]
  13. Aloisio, A.; Di Battista, L.; Alaggio, R.; Fragiacomo, M. Sensitivity analysis of subspace-based damage indicators under changes in ambient excitation covariance, severity and location of damage. Eng. Struct. 2020, 208, 110235. [Google Scholar] [CrossRef]
  14. Khan, I.; Choi, S.; Kwon, Y. Earthquake Detection in a Static and Dynamic Environment Using Supervised Machine Learning and a Novel Feature Extraction Method. Sensors 2020, 20, 800. [Google Scholar] [CrossRef] [PubMed] [Green Version]
  15. Quqa, S.; Landi, L.; Diotallevi, P. Real time damage detection through single low-cost smart sensor. In Proceedings of the 7th International Conference on Computational Methods in Structural Dynamics and Earthquake Engineering (COMPDYN), Crete, Greece, 24–26 June 2019. [Google Scholar] [CrossRef] [Green Version]
  16. Valenti, S.; Conti, M.; Pierleoni, P.; Zappelli, L.; Belli, A.; Gara, F.; Carbonari, S.; Regni, M. A low cost wireless sensor node for building monitoring. In Proceedings of the IEEE Workshop on Environmental, Energy, and Structural Monitoring Systems (EESMS), Salerno, Italy, 21–22 June 2018. [Google Scholar] [CrossRef]
  17. Liu, L.; Zhang, Y. Design of greenhouse environment monitoring system based on Wireless Sensor Network. In Proceedings of the 3rd International Conference on Control, Automation and Robotics (ICCAR), Nagoya, Japan, 22–24 April 2017. [Google Scholar] [CrossRef]
  18. Barile, G.; Leoni, A.; Pantoli, L.; Stornelli, V. Real-Time Autonomous System for Structural and Environmental Monitoring of Dynamic Events. Electronics 2018, 7, 420. [Google Scholar] [CrossRef] [Green Version]
  19. Pantoli, L.; Muttillo, M.; Ferri, G.; Stornelli, V.; Alaggio, R.; Vettori, D.; Chinzari, L.; Chinzari, F. Electronic system for structural and environmental building monitoring. In Lecture Notes in Electrical Engineering; Springer: Cham, Switzerland, 2019; Volume 539, pp. 481–488. [Google Scholar] [CrossRef]
  20. Ghosh, A.; Raha, A.; Mukherjee, A. Energy-Encient IoT-Health Monitoring System using Approximate Computing. Internet Things 2020, 9, 100166. [Google Scholar] [CrossRef]
  21. Luan, H.; Leng, J. Design of energy monitoring system based on IOT. In Proceedings of the 28th Chinese Control and Decision Conference (CCDC), Yinchuan, China, 28–30 May 2016. [Google Scholar] [CrossRef]
  22. De Rubeis, T.; Muttillo, M.; Nardi, I.; Pantoli, L.; Stornelli, V.; Ambrosini, D. Integrated Measuring and Control System for Thermal Analysis of Buildings Components in Hot Box Experiments. Energies 2019, 12, 2053. [Google Scholar] [CrossRef] [Green Version]
  23. Paolucci, R.; Muttillo, M.; Di Luzio, M.; Alaggio, R.; Ferri, G. Electronic Sensory System for Structural Health Monitoring Applications. In Proceedings of the 5th International Conference on Smart and Sustainable Technologies (SpliTech), Virtual, 23–26 September 2020. [Google Scholar] [CrossRef]
  24. Tao, G.; Feng, J.; Feng, H.; Feng, H.; Zhang, K. Reducing Construction Dust Pollution by Planning Construction Site Layout. Buildings 2022, 12, 531. [Google Scholar] [CrossRef]
  25. Rönnberg, N.; Ringdahl, R.; Fredriksson, A. Measurement and sonification of construction site noise and particle pollution data. Smart Sustain. Built Environ. 2020. [Google Scholar] [CrossRef]
  26. Jiang, Q.; Zhang, K. Research on construction site dust detection based on prior knowledge MinMax k-Means. In Proceedings of the 2nd IEEE International Conference on Artificial Intelligence and Industrial Design (AIID), Virtual, 28–30 May 2021. [Google Scholar] [CrossRef]
  27. Manzhilevskaya, S.; Petrenko, L.; Azarov, V. Monitoring Methods for Fine Dust Pollution During Construction Operations. In Proceedings of the International Scientific Conference Energy Management of Municipal Facilities and Sustainable Energy Technologies (EMMFT), Voronezh, Russia, 10–13 December 2019. [Google Scholar] [CrossRef]
  28. Luo, Q.; Huang, L.; Xue, X.; Chen, Z.; Zhou, F.; Wei, L.; Hua, J. Occupational health risk assessment based on dust exposure during earthwork construction. J. Build. Eng. 2021, 44, 103186. [Google Scholar] [CrossRef]
  29. Manzhilevskaya, S.; Petrenko, L.; Azarov, V. Vertical Distribution of Fine Dust During Construction Operations. In Proceedings of the International Scientific Conference Energy Management of Municipal Facilities and Sustainable Energy Technologies (EMMFT), Voronezh, Russia, 10–13 December 2019. [Google Scholar] [CrossRef]
  30. Zhang, D.; Ji, H.; Li, Z.; Ge, H. Design of Building Environment Detection System for Architectures Based on Internet of Things. Comput. Intell. Neurosci. 2022, 2022, 5438305. [Google Scholar] [CrossRef]
  31. United Nation, Department of Economic and Social Affairs Sustainable Development. Available online: https://sdgs.un.org/goals (accessed on 30 August 2022).
  32. Rotilio, M. Strategies for overcoming critical post-disaster reconstruction: A case study. In Proceedings of the 4th International Conference on Preservation, Maintenance and Rehabilitation of Historical Buildings and Structures (REHAB), Barcelos, Portugal, 17–19 July 2019; pp. 539–551, ISBN 978-989-8734-41-9. [Google Scholar]
  33. Rotilio, M.; Laurini, E.; Lucarelli, M.; De Berardinis, P. The maximization of the 4th dimension of the building site. Int. Arch. Photogramm. Remote Sens. Spat. Inf. Sci. 2019, XLII-4/W17, 15–20. [Google Scholar] [CrossRef] [Green Version]
  34. Alicandro, M.; Rotilio, M. UAV photogrammetry for resilience management in reconstruction plan of urban historical centres after seismic events. A case study. Int. Arch. Photogramm. Remote Sens. Spat. Inf. Sci. 2019, XLII-2/W11, 55–61. [Google Scholar] [CrossRef] [Green Version]
  35. Tagle, M.; Rojas, F.; Vásquez, Y.; Hallgren, F.; Lindén, J.; Kolev, D.; Watne, Å.K.; Oyola, P. Field performance of a low-cost sensor in the monitoring of particulate matter in Santiago, Chile. Environ. Monit. Assess. 2020, 192, 171. [Google Scholar] [CrossRef] [PubMed] [Green Version]
  36. Candia, A.; Represa, S.N.; Giuliani, D.; Luengo, M.A.; Porta, A.A.; Marrone, L.A. Solutions for SmartCities: Proposal of a monitoring system of air quality based on a LoRaWAN network with low-cost sensors. In Proceedings of the Congreso Argentino de Ciencias de la Informática y Desarrollos de Investigación (CACIDI), Buenos Aires, Argentina, 28–30 November 2018. [Google Scholar] [CrossRef]
  37. Kurnia, D.; Hadisantoso, F.S.; Suprianto, A.A.; Nugroho, E.A.; Janizal, J. Real-Time Air Quality Index Monitoring Experiments Using SDS011 Sensors and Raspberry Pi. In Proceedings of the 5th Annual Applied Science and Engineering Conference (AASEC), Virtual, 21–22 April 2020. [Google Scholar] [CrossRef]
  38. Paolucci, R.; Rotilio, M.; De Berardinis, P.; Ferri, G.; Cucchiella, F.; Stornelli, V. Electronic System for Monitoring of Dust on Construction Sites for the Health of Workers. In Proceedings of the 15th International Conference on Advanced Technologies, Systems and Services in Telecommunications (TELSIKS), Nis, Serbia, 20–22 October 2021. [Google Scholar] [CrossRef]
  39. Budde, M.; Schwarz, A.D.; Müller, T.; Laquai, B.; Streibl, N.; Schindler, G.; Köpke, M.; Riedel, T.; Dittler, A.; Beigl, M. Potential and Limitations of the Low-Cost SDS011 Particle Sensor for Monitoring Urban Air Quality. In Proceedings of the 3rd International Conference on Atmospheric Dust, Bari, Italy, 29–31 May 2018. [Google Scholar] [CrossRef]
  40. Budde, M.; Muller, T.; Laquai, B.; Streibl, N. Suitability of the Low-Cost SDS011 Particle Sensor for Urban PM-Monitoring. In Proceedings of the 3rd International Conference on Atmospheric Dust, Bari, Italy, 29–31 May 2018. [Google Scholar]
  41. Alfano, B.; Barretta, L.; Del Giudice, A.; De Vito, S.; Di Francia, G.; Esposito, E.; Formisano, F.; Massera, E.; Miglietta, M.L.; Polichetti, T. A Review of Low-Cost Particulate Matter Sensors from the Developers’ Perspectives. Sensors 2020, 20, 6819. [Google Scholar] [CrossRef] [PubMed]
  42. Chen, M.; Yuan, W.; Cao, C.; Buehler, C.; Gentner, D.R.; Lee, X. Development and Performance Evaluation of a Low-Cost Portable PM2.5 Monitor for Mobile Deployment. Sensors 2022, 22, 2767. [Google Scholar] [CrossRef]
  43. SDS011 Sensor Data Sheet. Available online: http://inovafitness.com/en/a/chanpinzhongxin/95.html (accessed on 22 March 2021).
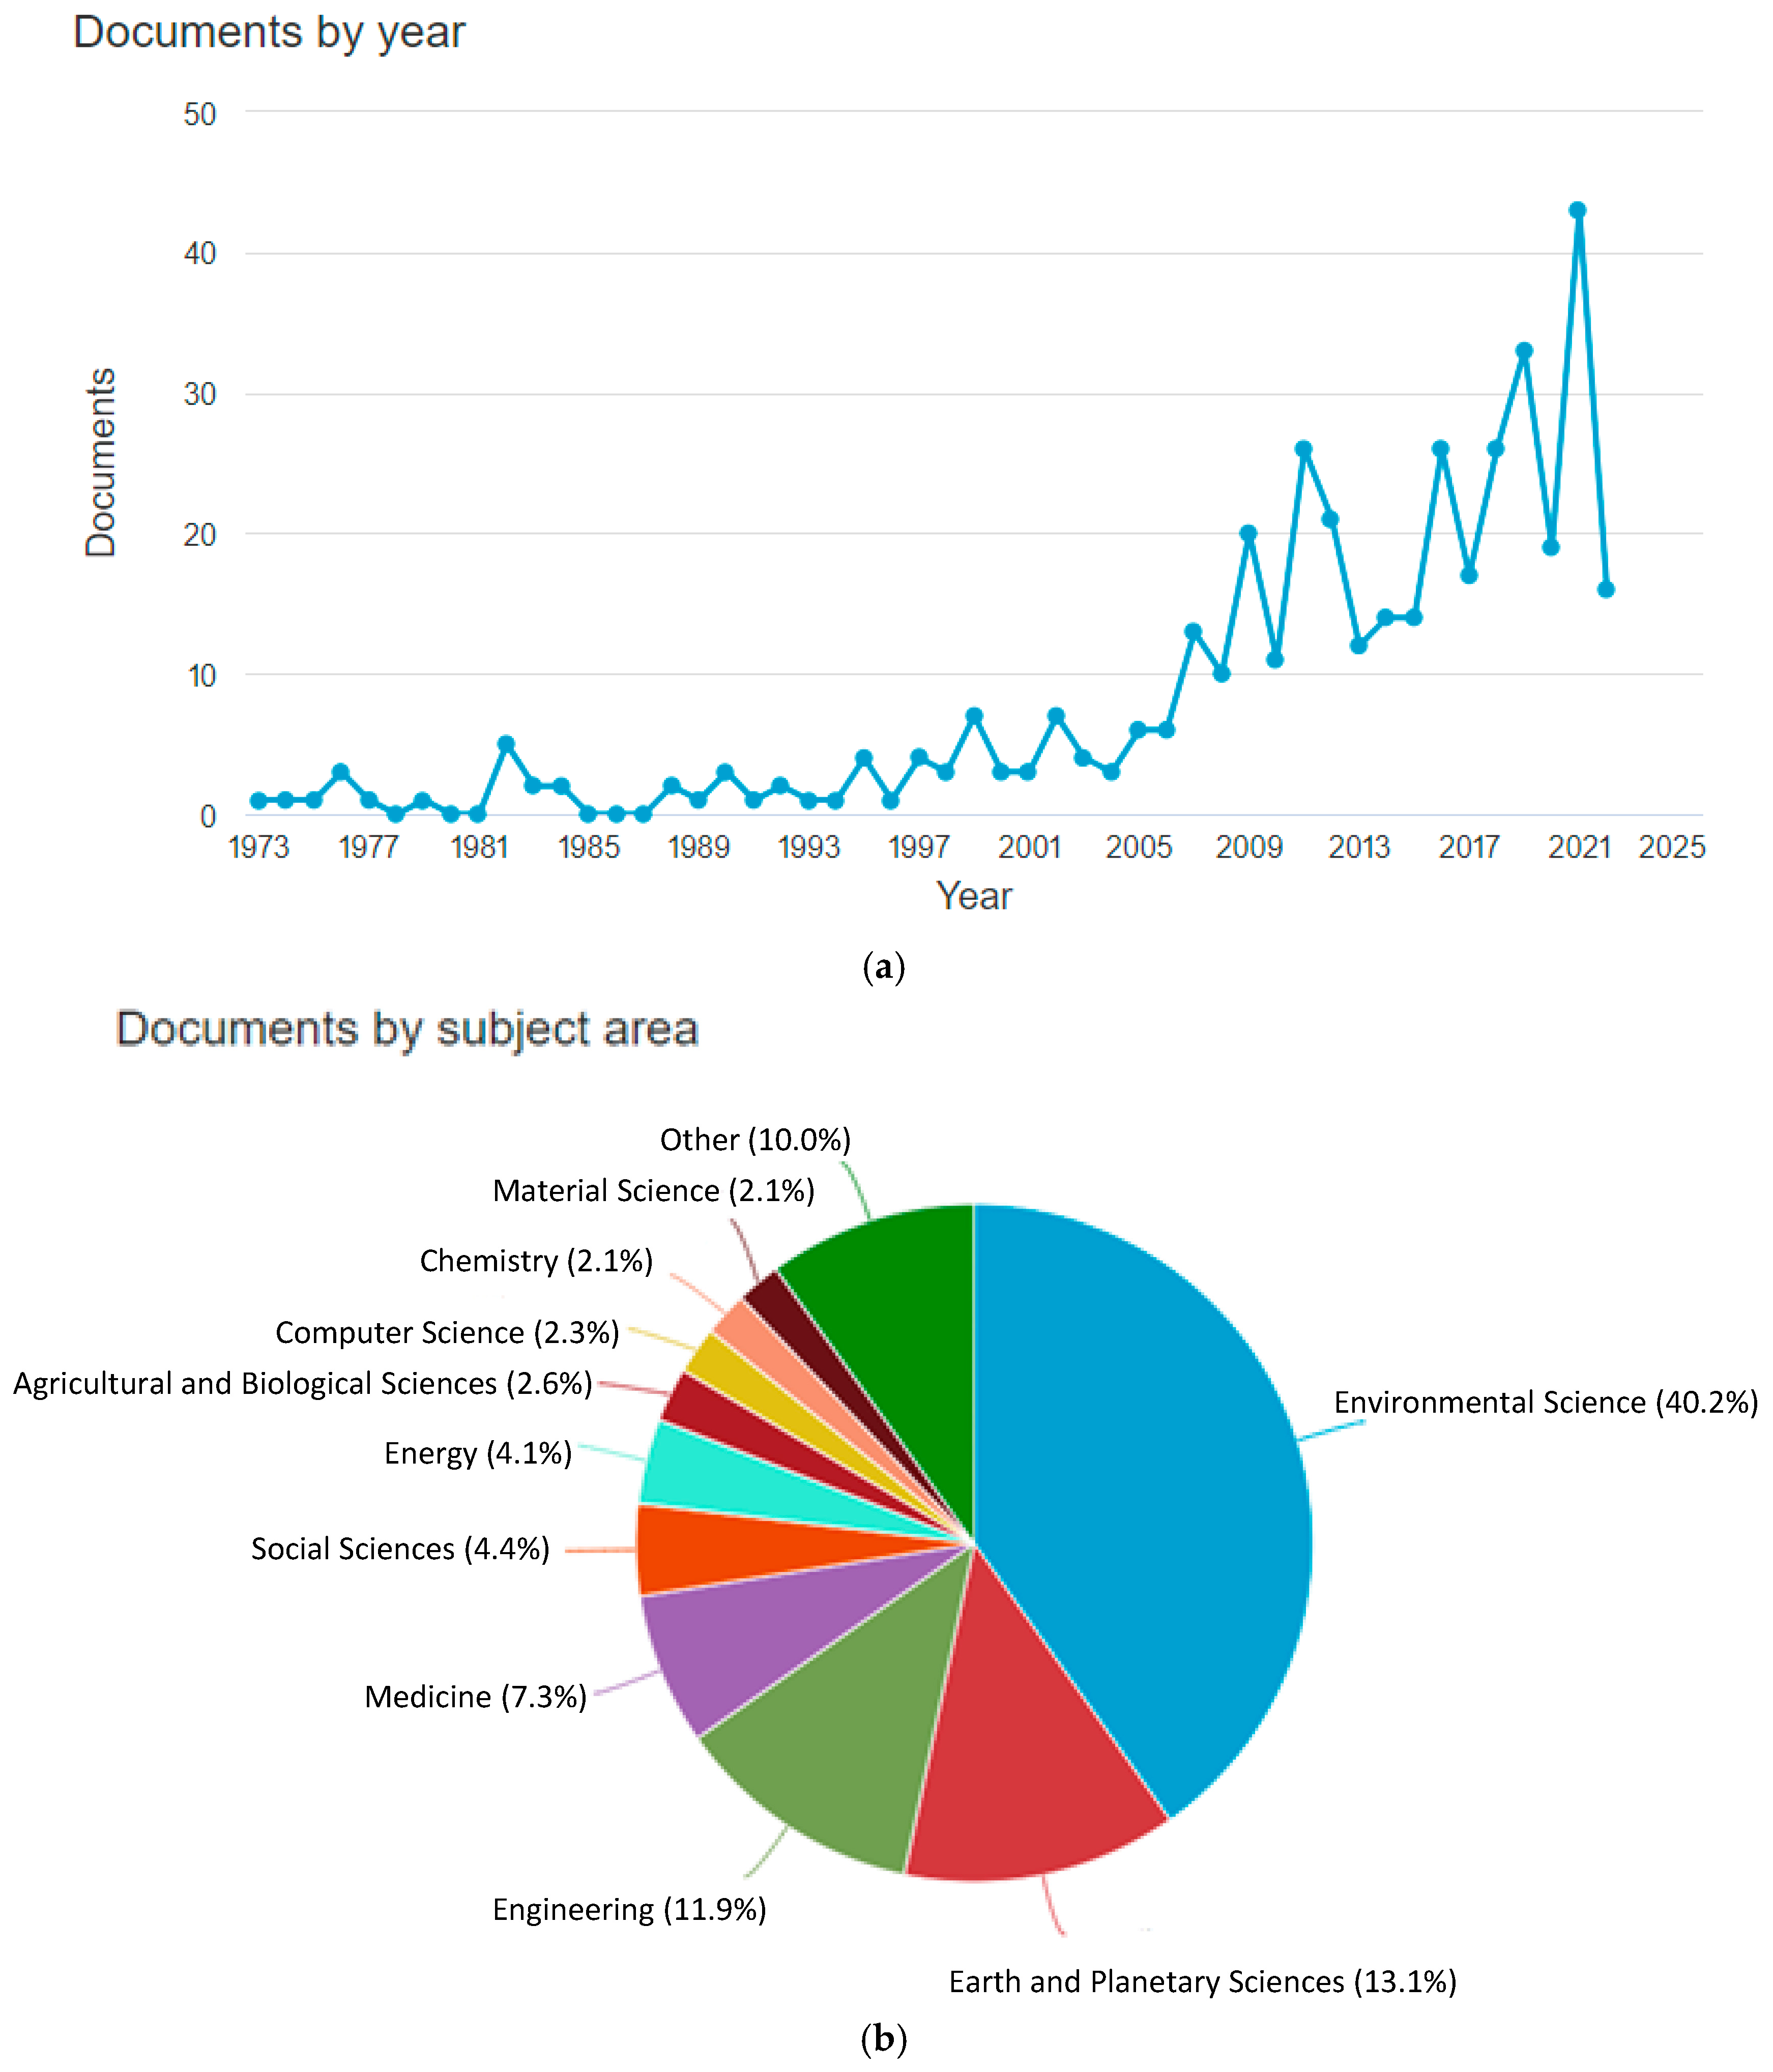
Figure 1. Analysis of the publications in the Web of Science database according to the keywords “construction site” and “dust pollution”: (a) the trend of publications over the years, (b) documents by disciplinary area (Scopus database).
Energies 15 07272 g001
Figure 2. Research method block diagram.
Energies 15 07272 g002
Figure 3. System general block scheme.
Energies 15 07272 g003
Figure 4. (a) Scheme of a single node, (b) photo of a single node.
Energies 15 07272 g004
Figure 5. SDS011 sensor.
Energies 15 07272 g005
Figure 6. (a) Data logger scheme, (b) data logger photo.
Energies 15 07272 g006
Figure 7. Ubidots home page.
Energies 15 07272 g007
Figure 8. (a) Plan of the area; (b) node installation 1; (c) node 2 and data logger installation; (d) node installation 3; (e) node installation 4; (f) node installation 5.
Energies 15 07272 g008
Figure 9. Three different stages of demolition.
Energies 15 07272 g009
Table 1. Main recent references. In the table, the aim of the research and the results are reported.
Reference, YearAim of the ResearchResults
[24], 2022- To propose a new method of reducing construction dust pollution through a reasonable site layout plan- Average dust concentration exposed to workers and total transportation cost were significantly reduced by 60.62% and 44.3%, respectively, thanks to the new method
[25], 2022- To explore how sonification can support visualization in construction planning to decrease construction transport disturbances- The low-cost sensors used could capture “good enough” data;
- The use of sonification for representing these data is interesting and a possible useful tool in urban and construction transport planning
[26], 2021- To propose a construction site dust detection method based on prior knowledge min-max k-means clustering algorithm - Timely detect construction site dust could improve the ability of government supervision departments to monitor construction dust pollution
[27], 2021- To discusse a method for suppressing dust emission on a construction site- The amount of fine dust PM 2.5–PM 10 pollution reduced under the influence of a water fog gun with a magnetic nozzle equipment;
- The concentration of particles in the air reduced by almost 2 times, depending on the height of the equipment’s impact
[28], 2021- To establish a health risk evaluation system based on the measured data and difference in the working contents of the works in the earthwork construction phase;
- To base the health risk evaluation system on both measurements of dust exposure and the quantification of health risks
- The protective mask and spray dust control system reduced the health risk by 67.54% and 38.56%, respectively;
- The health risks for the use of both measures could be reduced by 76.89%;
- Effective dust control measures were proposed according to the results of this study, which provides references for workers to strengthen dust-proof works
[29], 2021 - To summarize the results of the study of fine dust distribution and concentration released during construction production- The functional analysis of the amount of fine dust PM 2.5 and PM 10 released during the local construction;
- Data knowledge allows us to determine the most dangerous construction works that affect the total environmental pollution in the working and sanitary protection areas
[30], 2022- To develop a new integrated system for monitoring the environment. The system uses a wireless sensor network environment monitoring system IoT platform with embedded internal processors- Real-time supervision through a mobile terminal and computer terminal management platform;
- Subsequent online guidance and regulation
Table 2. Main parameters of the SDS011 sensor.
Measurement ParametersPM 2.5,PM 10
Range0.0–999.9 μg/m3
Rated voltage5V
Rated current70 mA ± 10 mA
Sleep current<4 mA
Temperature rangeStorage environment: −20~+60 °C
Work environment: −10~+50 °C
Humidity rangeStorage environment: Max 90%
Work environment: Max 70%
Air pressure86 KPa~110 KPa
Corresponding time1 s
Serial data output frequency1 Hz
Minimum resolution of particle0.3 μm
Relative errorMaximum of ±15% and ±10 μg/m3
Table 3. Detected average of the PM 2.5.
DATAs1_PM2.5
(μg/m3)
s2_PM2.5
(μg/m3)
s3_PM2.5
(μg/m3)
s4_PM2.5
(μg/m3)
s5_PM2.5
(μg/m3)
23 June 20223,512195135.134146345.3999999335.57317076717.29268293
24 June 20222.948936144.506383025.3872340084.8553191658.648936211
25 June 20222.6153.402499985.0999999054.3987499682.951249999
Table 4. Detected average of the PM 10.
DATAs1_PM 10
(μg/m3)
s2_PM 10
(μg/m3)
s3_PM 10
(μg/m3)
s4_PM 10
(μg/m3)
s5_PM 10
(μg/m3)
23 June 202217.809756131.99512243.997562221.91219502193.551216
24 June 202216.602127733.37446841.3085106822.7297871896.28297777
25 June 202210.748749919.417499924.2000007619.4424999417.88250021
Publisher’s Note: MDPI stays neutral with regard to jurisdictional claims in published maps and institutional affiliations.