Abstract
The incessant power outages that characterize the Nigerian power network (NGP), as in all developing countries, are not limited to the shortage of fuel for power generation. However, differential power shortages between the generated power and the load demand are alarming. In this study, we propose a new voltage stability pointer (NVSP) based on a reduced one-line power network to act as a classifier. The NVSP was trained with a support vector machine (SVM) using a medium Gaussian kernel classification toolbox (mGkCT) in the MATLAB environment. This classification is based on the power network susceptibility to voltage instability. NGP 28-bus 330 kV data were extracted and modeled in the MATLAB environment and tested with the NVSP-mGkCT classifier. The NVSP-mGkCT was able to classify the lines viz. stable and unstable lines for the base and contingency cases. Similarly, the linear load dynamics and non-linear load dynamics were evaluated on the basis of critical buses using the NVSP. The aim of this work was to help the Transmission Company of Nigeria (TCN) and the National Control Centre (NCC) to be pre-emptive with respect to possible voltage collapse due to voltage instability. The simulation results show that NVSP was able to flag vulnerable lines in the NGP.
1. Introduction
Power system planning in most developing countries is associated with several challenges due to the non-linear relationship between the increasing population and power generation, low reliability on capital investment, dispersed utilities, etc. [1]. Gross deficiency in power generation has driven many developing countries to forced load shedding to ensure that the meager generated power reaches the considerable population. In such a context, power system operators are concerned about active power control, which is invariably associated with the frequency stability [2], and rarely consider reactive power control, which is associated with voltage stability [3]. Furthermore, the rotor, frequency and voltage stability control are essential components of a reliable power system [4].
The Nigerian power network (NGP) comprised approximately twenty-six power plants with a combined optimal power generation of slightly more than seven thousand megawatts (7000 MW) [5], which are provided hydro and thermal power plants [6]. This generated power serves a population of more than two hundred million (200,000,000) people [7]. The NGP is faced several crises, including insufficient generation of electric power to match the demand [8,9], overstretched transmission lines and support, [10] and the inability to withstand transient conditions [11]. The average number of the recorded power outages, both partial and total, in the NGP every year is alarming [12], and there seems to be no end in sight with respect to addressing this increasing figure. The high rate of blackouts in Nigeria has driven many small-scale businesses out of operation [13], and the few remaining companies operate at a high cost of production due to the increase in prices of alternative sources of fuel, for example, diesel, gas, etc. Hence, there is a need to develop a tool to identify the weak buses and lines that are vulnerable to voltage collapse, which could lead to a national blackout.
The framework of this research is to (1) develop a new voltage stability pointer (NVSP) for evaluation of voltage stability, (2) train the NVSP with the support vector machine using a medium Gaussian kernel classification toolbox in a MATLAB environment and (3) adapt it to the Nigerian power network to classify it into two classes, i.e., stable and unstable. The lines and buses under the unstable classification will be flagged as vulnerable.
2. Related Work
The effort of the Nigerian government to increase the power generation capacity of the country has not yielded satisfactory results despite the considerable capital investment in the power sector over the years. According to the World Bank Energy Progress Report, only 55.4 percent of the Nigerian population had access to electricity in the year 2020 [7]. The geographical structure of the transmission lines in Nigeria is shown in Figure 1.

Figure 1.
Geographical structure of the NGP transmission lines [6].
The load demand is predicted to reach 50,000 MW by the year 2035 [6]. However, there little effort has been made to date to scale up the generation capacity to meet this future demand. The recorded cases of power outages in the NGP between January and June 2022 are estimated to be five [14]. This number is high compared to other developed nations [7]. The variation in load demand is among the factors that affect the power network stability [15]. Ramirez-Gonzalez M. et al. [16] studied contingencies in a power network and their effects on security. A convolutional neural network was used to allocate power injection stations in the power network, with the result proving the effectiveness of the proposed method.
Similarly, Abdulkareem A. et al. [10] suggested that the NGP topology be changed from a radial to ring structure to minimize losses and voltage instability. The TCN annual technical report also set a goal to achieve this transition before the year 2030 [6]. However, such a transition will be time-consuming and cost-intensive, and a solution is urgently required before it can be implemented. In addition, Obi P. I. et al. [17] presented a technique to improve the NGP with static Var compensators to fulfill the voltage quality requirements. However, this technique is regarded as a short-term solution to the lingering problem faced by the Nigerian power grid. Moreover, Adebayo et al. [18] proposed two methods to identify vulnerable buses in a power network. The first method was achieved through the maximum loading limit technique, and the other was based on the configuration of the power network. The NGP 24-bus and IEEE 30-bus systems were used to evaluate the proposed method. The critical buses were strengthened with FACTS components. Simulation results showed that optimal placement of a compensating device could improve the voltage profile. In [19], a stability concept for power systems based on the frequency control of synchronous machines was presented. The system was tested with various loading patterns, and the results were compared with conventional synchro-converter models.
In a research paper presented by Kasis A. et al. [20], a technique was evaluated to solve the problem associated with fluctuations of renewable energy sources and the effects on power stability. Multiple possibilities for frequency dynamics were modeled, considering the variability of the inherent power supply. The results showed the immunity of the power stability to a high-frequency cycle. A surge in renewable power penetration in power distribution networks might result in overvoltage at network buses in the absence of an effective control mechanism. Heidari Yazdi et al. [21] proposed a method to regulate voltage magnitude based on the load demand. Power demand usually varies; therefore, means to compensate for the peak consumption period is necessary. An overvoltage resulting from excessive reactive power injection was considered and addressed for a stable power system.
In an effort to solve problems associated with power network configuration, Narimani et al. [22] proposed a novel method of analyzing several contingency problems associated with the architecture of the network. This was achieved through a graph theory approach that identifies different power components responsible for contingency, especially between two successive contingencies. The results showed that the proposed method could rapidly identify multiple contingencies. In the same vein, Randey A et al. [23] proposed a network reconfiguration technique for NGP to secure the network from a possible grid collapse and thereby improve the voltage profile. Contingency analysis resulted suggested that the redistribution of notable generators to defined voltage set-points would reduce power outages.
In a paper presented by Nkan et al. [24], several compensative devices were investigated with the aim of combining two similar controllers. The method was tested on NGP in the power system analysis toolbox (PSAT) in MATLAB. Analysis results showed that the combination of similar compensating devices could reduce power losses to a considerable extent. Some NGP buses are currently operating below their standard rated voltage [25] as a result of overload and congestion, with no adequate plan for contingency. Moreover, Liu S. et al. [26] presented a study on the dynamism of a stability point in a power network through the injection of noise and time delay. The aim of this method is to improve the integrity of the power network in a smart grid. The authors assessed the effect of noise on power system stability.
The power stability problem has recently received attention from many researchers, and efforts are being made to address the problems associated with power stability. Alnasseir et al. [27] addressed the power stability problem by introducing a static synchronous compensator (STATCOM) and a thyristor-controlled series capacitor (TCSC). The two compensators were assessed independently, and their results were compared. The results showed that the TCSC is relatively effective in securing power stability. Similarly, Calma E. and Pacis M. [28] studied voltage stability indices for different states of operation in a power system. The proposed approach involved an artificial neural network, and the Newton–Raphson power flow was employed in the MATLAB environment. The results demonstrated the feasibility of the proposed approach, especially compared with other machine learning techniques in terms of assessing the voltage stability of a power network. In addition, Collados-Rodriguez et al. [29] analyzed the effect of power electronics components on power system stability. Several cases of stability were evaluated to assess the minimum power generation expected to ensure power network security with the installation of compensative components. The stability indices considered for the evaluation were frequency and voltage, which were sufficient to identify the vulnerable lines in the network [2,3].
The effect of harmonics on power stability cannot be overemphasized [30]. Abirami and Ravi [31] recommended a technique to reduce harmonic distortion, especially with the advent of electric car charging stations in the distribution network. They suggested that a shunt capacitive filter be connected in parallel with dynamic loads in a radial distribution network. Simulation results revealed that adequate control of harmonic could enhance the power quality delivery to end consumers. Similarly, Zaheb H. et al. [32] investigated the effect of inductive load dynamics on various voltage stability indices. The researchers emphasized the suitability of these indices for online application. The obtained results were used to classify the indices in terms of their ability to assess, formulate and analyze the voltage stability.
The NVSP proposed in this study was developed to (a) verify the voltage stability status of the Nigerian power network, (b) assess the vulnerability of each transmission line to voltage instability, (c) flag unstable lines and buses and (d) suggest a reactive power injection station. With this approach, it is expected that the outcome of this research will help to tame the frequent power outages in the NGP, and thus, improves the economic viability of the country.
3. Proposed Methodology
The proposed method is based on successive dependence of three approaches viz. power flow solution, development of a new voltage stability pointer for voltage stability evaluation from the power flow data and training of the NVSP through a support vector machine.
3.1. Power Flow Solution
In this research, the Newton–Raphson method was adopted, owing to its fast convergence time. Saadat [33] considered an n-bus network (Figure 2) for as a power flow solution.
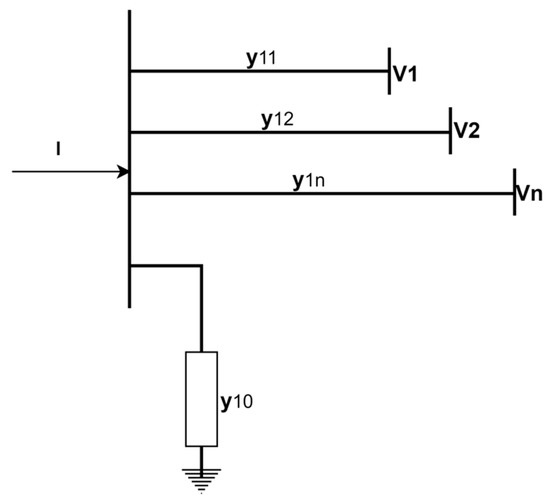
Figure 2.
n-bus power network [33].
The polar-form representation of the equation is:
The power at bus 1 is expressed as:
Substituting Equation (2) into Equation (3) yields:
Separating the real from the imaginary part yields:
Expanding Equations (5) and (6) using Taylor’s series yields:
Equation (7) can be expressed in short form as:
The diagonal and off-diagonal components of J1, J2, J3 and J4 are estimated to obtain the differential residual power and bus voltages:
3.2. Derivation of the Proposed New Voltage Stability Pointer
The proposed NVSP is derived from a reduced one-line diagram as shown in Figure 3.

Figure 3.
A reduced one-line diagram.
The line current (I) from the generator bus is expressed as:
The current at the load bus can also be calculated as:
Assuming the line loss due to the load current is neglected, then Equation (13) will equate to Equation (14):
Dividing Equation (16) by yields:
Equation (17) can be rewritten as:
From Equation (18):
If is discriminated to zero, the real roots of can be expressed as ; then:
If Equation (20) is rearranged into real and imaginary parts, then the real part is , and if the voltage angle () is very small, then it is reduced to .
Likewise, the imaginary part is ; if the voltage angle () is assumed to be negligible, then it is reduced to.
Therefore, the new voltage stability pointer (NVSP) is:
where V1 is the voltage at the sending end bus, Q2 is the reactive power at the load bus and Z is the line impedance. The index Equation (21) depends on the extracted data from the power flow solution of Equations (8), (10) and (12). The NGP 28-bus line diagram is shown in Figure 4.
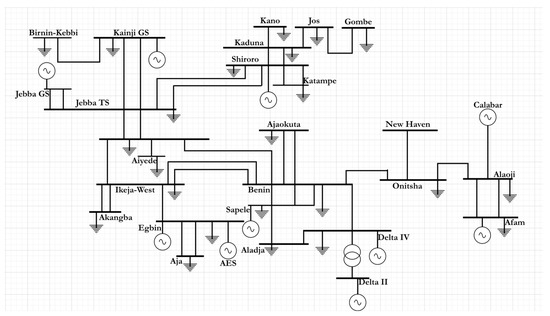
Figure 4.
Single-line diagram of the 28-bus, 330 kV NGP.
3.3. Classification through Support Vector Machine Algorithm
The support vector machine (SVM) algorithm has been widely used to classify data of different sets that are separable into classes [34]. Squires [35] defined the Gaussian elimination with a function with parametric extension:
where a and b are real constants, and c is a non-zero variable. However, the Gaussian function is usually expressed as:
where .
Assuming [36] that the training data for , the classifier is:
and
where is the input vector, is the vector weight and is the bias. The NVSP was trained by the support vector machine algorithm in MATLAB using the medium Gaussian kernel classification tool according to the function in Equation (26):
where is the NVSP-mGkCT trained index value between the two buses.
4. Results and Discussion
4.1. Assessment of the NGP 28-Bus, 330 kV Base Case
The simulation results obtained from the voltage stability assessment of the NGP using the NVSP are presented in Table 1, and the training results from the support vector machine in the MATLAB environment are shown in Figure 5. The NGP 28-bus voltage magnitude in the base case is depicted in Figure 6.

Table 1.
Voltage stability assessment of 28-bus 330 kV NGP transmission line using NVSP in the base case.
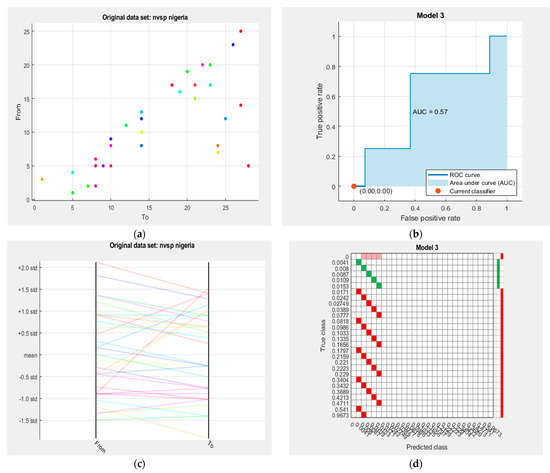
Figure 5.
Training results of NVSP using support vector machine in the MATLAB environment. (a) Scatter plot of the NGP. (b) Receiver operating characteristic (ROC) curve. (c) Parallel coordinate plot. (d) Confusion matrix.
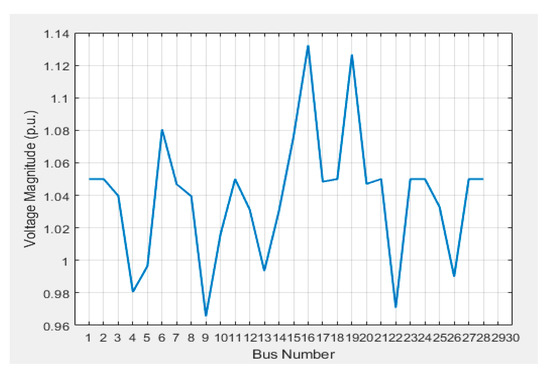
Figure 6.
The NGP 28-bus voltage per unit in the base case.
4.2. Analysis of the 28-Bus, NGP 330 kV Base Case
The overall percentage accuracy of the predicted class of NVSP, 28-bus NGP 330 kV line to the true class is 72.48, with a training time of about 2.02 s. The area under the curve from the receiver operating characteristic (ROC) is 0.57. All lines and buses are stable in the base case, except the Ikeja-west bus and the Ikeja-west–Benin line. The NVSP index value is 0.9673, and the voltage magnitude is 0.997 (p.u), indicating the vulnerability of the line to voltage instability. In the base case, the Ikeja-west load bus has 474. 5 MVar, as shown in Table A1, as a result of heavy industrial presence in the region. The NVSP index values for all other lines are far less than unity, indicating their immunity to voltage instability in the base case, as shown in Figure 7.
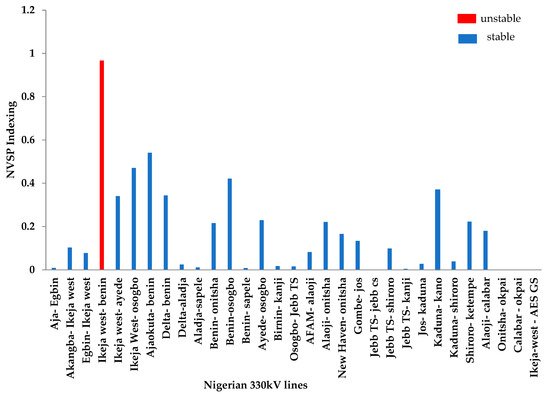
Figure 7.
Classification of the NGP transmission lines using NVSP in the base case.
The placement of the static synchronous compensator (STATCOM) at the Ikeja-west bus provides stability at the bus, as the NVSP index value from the Ikeja-west–Benin line changes from 0.9673 to 0.7621. The voltage magnitude of the Ikeja-west bus also changes from 0.997 (p.u) to 1.023 (p.u). This effect yielded a positive result with respect to the overall performance of the NGP, as none of the lines are near the unity NVSP index value, and the voltage profile is also improved, as shown in Figure 8.
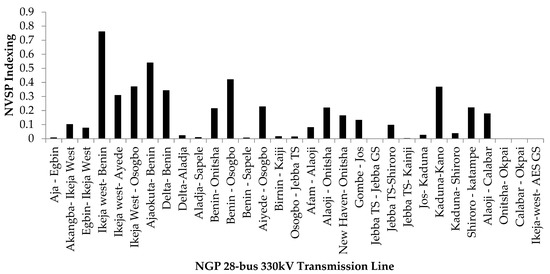
Figure 8.
The NGP 28-bus 330 kV transmission lines after STATCOM compensation in the base case.
4.3. Contingency Assessment of the NGP 28-Bus Using NVSP
The contingency analysis is among the performance indices used to evaluate the power network stability, especially with respect to its loading capacity limit [15]. Contingency analysis can assist the system operator in identifying the most critical and vulnerable lines and buses to voltage instability. The contingency analysis of the NGP, 28-bus using NVSP is presented in Table 2. The NVSP index and the power flow convergence methods were used to evaluate the loadability of all the NGP P-Q buses. The power flow solution is programmed to return non-convergence after 100 iterations without convergence.

Table 2.
Realization of the NGP critical lines and the maximum reactive power loading points.
The maximum reactive power at all the P-Q buses of the NGP 28-bus is presented in Table 3. The results show the peak loading limit of all the load buses, and a step above this threshold results in voltage instability. The contingency ranking was obtained based on the increment of reactive power at the load buses. The maximum reactive power that drives the NVSP index value to unity or the power flow solution to non-convergence is regarded as maximum loadability. In other words, the safe operating limit of reactive power at the load buses was attained by considering the power flow convergence and the NVSP indexing value. The NVSP of every line should be maintained well below unity in order to ensure voltage stability.

Table 3.
Contingency analysis of the NGP buses and lines.
The results presented in Table 3 show that the most critical bus and line under contingency rankings are Gombe and Gombe-Jos, with a maximum operating limit of 100.9 MVar and an NVSP index value of 0.1358, respectively. The Jos, Kano, Birni-Kebbi and Benin buses, which are ranked second, third, fourth and fifth, with maximum reactive power limits of 142.7 MVar, 210.9 MVar, 285.9 MVar and 295.5 MVar, respectively, are also vulnerable to perturbation or transient conditions. The voltage magnitude and maximum reactive power limit of the NGP P-Q bus are presented in Figure 9 and Figure 10, respectively.
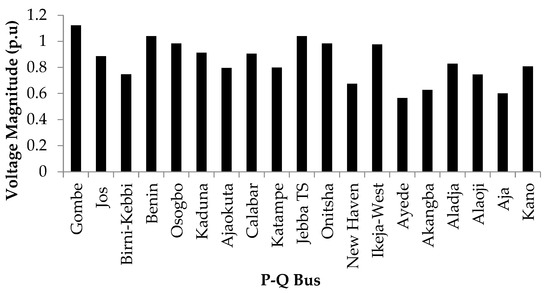
Figure 9.
Voltage magnitude of the NGP P-Q bus under contingency conditions.
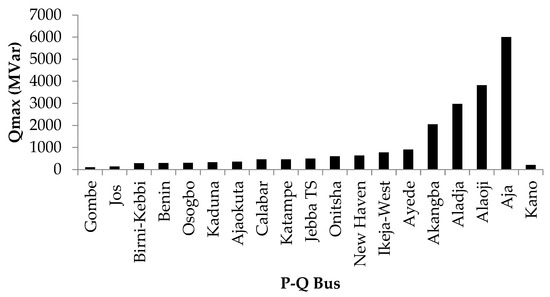
Figure 10.
Maximum loading limit of the NGP P-Q bus.
The results presented in Table 3 show that the order of stable buses of the NGP under contingency conditions is: Aja, Alaoji, Aladja, Akangba, Ayede, Ikeja-west and New Haven. Conversely, the order of unstable P-Q buses under contingency conditions is: Gombe, Jos, Kano, Birni-Kebbi, Osogbo, Kaduna, Calabar, Katampe, Jebba TS and Onitsha. Based on the results presented in Figure 9 and Figure 10 and a stamp to ensure a safe margin of operation at the vulnerable buses in the NGP, we recommended that the loads at the critical P-Q buses be optimally shed, especially during peak load hours. However, this approach is regarded as a short-term solution to power system stability [37].
4.4. Assessment of Dynamic Load on 28-Bus NGP Critical Lines and Vulnerable Buses
The effect of the dynamic load on the vulnerable P-Q buses in the NGP 28-bus system were considered for this analysis, including the first, second and third rankings in Table 3, i.e., Gombe, Jos and Kano, respectively. In addition, we evaluated both linear load dynamics and non-linear load dynamics to assess the power stability of the NGP.
4.4.1. Linear Load Dynamics
The linear increment in both P and Q at Gombe, Jos and Kano buses of the 28-bus NGP are presented in Table 4, Table 5 and Table 6, respectively. The results presented in Table 4 show that the lowest power consumption at Gombe bus is 60.0 MW and 70.0 MVar. The power flow solution using the Newton–Raphson method did not converge at this loading point after 100 iterations, implying that any further drop in the load-active power and reactive power would lead to voltage instability. However, maximum dynamic loads of 145.0 MW and 150.0 MVar were recorded at Gombe bus, as shown in Table 4.

Table 4.
Linear load dynamics at Gombe bus in the 28-bus NGP.

Table 5.
Linear load dynamics at Jos bus in the 28-bus NGP.

Table 6.
Linear load dynamics at Kano bus in the 28-bus NGP.
According to the results presented in Table 5, the Jos bus is relatively stable, even at the lowest load consumption. However, a shunt reactor should be installed at the Jos bus to prevent cases of overvoltage, especially during the lowest power consumption period. In the same vein, the maximum active power and reactive power at the Jos bus are 140 MW and 125 MVar, respectively.
As shown in Table 6, the lowest stable power consumptions at Kano bus are 50.6 MW and 40.9 MVar for active power and reactive power, respectively. The maximum linear load dynamics before instability are 350 MW and 250 MVar for active and reactive power, respectively.
4.4.2. Non-Linear Dynamic Load
An evident load disagreement pattern often occurs when a surge in reactive power load occurs as a result of a massive drop in active power load and vice-versa. The results obtained from the non-linear load dynamic on the critical P-Q buses of the 28-bus NGP are presented in Table 7, Table 8 and Table 9. The Gombe bus was subjected to various incoherent loading patterns of active and reactive power, and the stability of the NGP was evaluated accordingly. The results presented in Table 7 depict voltage instability at Gombe bus during an uneven loading pattern of 40.0 MW and 200 MVar.

Table 7.
Non-linear load dynamics at Gombe bus in the 28-bus NGP.

Table 8.
Non-linear load dynamics at Jos bus in the 28-bus NGP.

Table 9.
The non-linear load dynamics at Kano bus in the 28-bus NGP.
After several load permutations at the Jos bus, it was deduced that the nonlinear load pattern combinations that may lead to voltage instability at the Jos bus are 10.0 MW-250.7 MVar and 350.0 MW-20 MVar for the P-Q, as presented in Table 8.
Similarly, Kano bus appeared to be stable under a nonlinear load combination of 450 MW and 30.0 MVar. However, as voltage instability set in, a step in an almost inverse progression of P and Q occurred. As shown in Table 9, load combinations of 650 MW-20.0 MVar and 10.0 MW-300.0 MVar for the P-Q are the unstable load set points for the Kano bus.
4.5. Comparison of Past Research Work
Many researchers have assessed the NGP in the last couple of years and suggested ways to improve the stability of the network. However, there is a need to improve on this existing knowledge, which was the motivation for the present study. Oluseyi et al. [11] suggested that Ikeja-west be supported by increasing the injection capacity of the Egbin power plant. However, the issue was addressed through the NVSP by placing the STATCOM device close to the Ikeja-west bus, as shown in Figure 8; this approach was also corroborated by Obi et al. [17]. The NGP contingency ranking results obtained in [18] for the first to fourth rankings were consistent with the NVSP analysis; however, the contingency ranking by the NVSP were more accurate, with a relatively faster computing time. In addition, this research assessed the load dynamics of the NGP. The authors of [10,23,38] recommended that the Gombe bus and Kano bus be changed from radial to ring structures. However, such a transition would be cost-intensive and time-consuming. Similarly, renewable energy incorporation at the weak buses was suggested to improve the stability of power network [39,40,41]. However, there are some notable problems associated with the injection of renewable energy sources into a power network, such as intermittency, fluctuations, etc. [20].
5. Conclusions
In this paper, we presented a novel voltage stability index, the NVSP, for the classification of the 28-bus NGP, 330 kV transmission lines and buses. The classification was based on the vulnerability of each line to voltage collapse for the base and contingency cases. The results presented in Table 1 show that the Ikeja-west–Benin line was the only unstable line in the base case, with an NVSP index value of 0.9672 and a voltage magnitude of 0.997 (p.u). However, the problem was remedied by the installation of a STATCOM at the Ikeja-west bus, which improved the voltage stability of the line to an NVSP index value of 0.7621, as presented in Figure 8, with the voltage magnitude enhanced to 1.023 (p.u). A contingency analysis was carried out to evaluate the loadability of the P-Q buses of the 28-bus, 330 kV NGP. The Gombe, Jos and Kano P-Q buses were ranked as the most critical buses, with a maximum reactive power limit of 100.9 MVar, 142.9 MVar and 210.9 MVar, respectively. The most stable P-Q buses are Aja, Alaoji, Aladja and Akangba, with a maximum reactive power limit of 6005.58 MVar, 3820.2 MVar, 2972.4 MVar and 2,0508 MVar, respectively. Furthermore, the results obtained in this research show that (1) the installation of injection substations close to the flagged points will reduce the number possible blackouts, especially at Gombe, Jos and Kano buses; (2) increasing the power generation capacity from the Shiroro plant will also help to prevent the P-Q buses at these critical buses from operating close to their maximum capacity limit; and (3) the load at the P-Q buses for the critical buses—Gombe, Jos and Kano—could be optimally shed, especially during peak load hours, to maintain the stability of the NGP.
Author Contributions
Formal analysis, N.I.N.; Software, T.U.B., S.L.G. and N.I.N.; Validation, S.L.G.; Writing—original draft, T.U.B. and F.K.A.; Writing—review & editing, S.L.G. All authors have read and agreed to the published version of the manuscript.
Funding
This research received no external funding.
Data Availability Statement
All data used in this research have been adequately declared.
Conflicts of Interest
The authors declare no conflict of interest.
Appendix A
The NGP 28-bus, 330-kV bus and line data are presented in Table A1 and Table A2, respectively, as declared in [42]. The Table A3 presents the results of the 28-bus NGP transmission line flow and losses using Newton-Raphson power flow solution technique in 2018a MATLAB environment.

Table A1.
Bus data of the 330-kV, 28-bus Nigerian power network [42].
Table A1.
Bus data of the 330-kV, 28-bus Nigerian power network [42].
| Bus No. | Bus Name | Bus Code | Voltage Mag. PU | Angle Degree | Load | Generation | ||
|---|---|---|---|---|---|---|---|---|
| MW | MVAr | MW | MVAr | |||||
| 1 | Egbin | 1 | 1.05 | 0 | 68.9 | 51.7 | 251.538 | 641.299 |
| 2 | Delta | 2 | 1.05 | 15.424 | 0 | 0 | 670 | 82.628 |
| 3 | Aja | 0 | 1.04 | −0.57 | 274.4 | 205.8 | 0 | 0 |
| 4 | Akangba | 0 | 0.94 | 0.482 | 344.7 | 258.5 | 0 | 0 |
| 5 | Ikeja-west | 0 | 0.986 | 1.408 | 633.2 | 474.9 | 0 | 0 |
| 6 | Ajaokuta | 0 | 1.026 | 8.739 | 13.8 | 10.3 | 0 | 0 |
| 7 | Aladja | 0 | 1.046 | 14.04 | 96.5 | 72.4 | 0 | 0 |
| 8 | Benin | 0 | 1.011 | 9.306 | 383.4 | 287.5 | 0 | 0 |
| 9 | Ayede | 0 | 0.932 | 2.335 | 275.8 | 206.8 | 0 | 0 |
| 10 | Osogbo | 0 | 0.966 | 8.642 | 201.2 | 150.9 | 0 | 0 |
| 11 | Afam | 2 | 1.05 | 13.273 | 52.5 | 39.4 | 431 | 0 |
| 12 | Alaoji | 0 | 1.007 | 12.057 | 427 | 320.2 | 0 | 0 |
| 13 | New Haven | 0 | 0.905 | 3.322 | 177.9 | 133.4 | 0 | 0 |
| 14 | Onitsha | 0 | 0.949 | 6.268 | 184.6 | 138.4 | 0 | 0 |
| 15 | Birnin-Kebbi | 0 | 1.01 | 26.299 | 114.5 | 85.9 | 0 | 0 |
| 16 | Gombe | 0 | 0.844 | 4.905 | 130.6 | 97.9 | 0 | 0 |
| 17 | Jebba | 0 | 1.046 | 25.523 | 11 | 8.2 | 0 | 0 |
| 18 | Jebba GS | 2 | 1.05 | 26.022 | 0 | 0 | 495 | 159.231 |
| 19 | Jos | 0 | 0.93 | 12.901 | 70.3 | 52.7 | 0 | 0 |
| 20 | Kaduna | 0 | 0.951 | 8.791 | 193 | 144.7 | 0 | 0 |
| 21 | Kainji | 2 | 1.05 | 31.819 | 7.5 | 5.2 | 624.7 | −65.319 |
| 22 | Kano | 0 | 0.818 | −1.562 | 220.6 | 142.9 | 0 | 0 |
| 23 | Shiroro | 2 | 1.05 | 13.47 | 70.3 | 36.1 | 388.9 | 508.034 |
| 24 | Sapele | 2 | 1.05 | 12.015 | 20.6 | 15.4 | 190.3 | 283.405 |
| 25 | Calabar | 0 | 0.951 | 21.703 | 110 | 89 | 0 | 0 |
| 26 | Katampe | 0 | 1 | 9.242 | 290.1 | 145 | 0 | 0 |
| 27 | Okapi | 2 | 1.05 | 46.869 | 0 | 0 | 750 | 193.093 |
| 28 | AES-GS | 2 | 1.05 | 5.871 | 0 | 0 | 750 | 488.128 |

Table A2.
Line data of the 330-kV, 28-bus NGP [42].
Table A2.
Line data of the 330-kV, 28-bus NGP [42].
| Line No | From Bus | Bus Name | To Bus | Bus Name | R (pu) | X (pu) | Susceptance B (pu) |
|---|---|---|---|---|---|---|---|
| 1 | 3 | Aja | 1 | Egbin | 0.00066 | 0.00446 | 0.06627 |
| 2 | 4 | Akangba | 5 | Ikeja-west | 0.0007 | 0.00518 | 0.06494 |
| 3 | 1 | Egbin | 5 | Ikeja-west | 0.00254 | 0.01728 | 0.25680 |
| 4 | 5 | Ikeja-west | 8 | Benin | 0.01100 | 0.08280 | 0.40572 |
| 5 | 5 | Ikeja-west | 9 | Ayede | 0.00540 | 0.04050 | 0.00000 |
| 6 | 5 | Ikeja-west | 10 | Osogbo | 0.01033 | 0.07682 | 0.96261 |
| 7 | 6 | Ajaokuta | 8 | Benin | 0.00799 | 0.05434 | 0.80769 |
| 8 | 2 | Delta | 8 | Benin | 0.00438 | 0.03261 | 0.40572 |
| 9 | 2 | Delta | 7 | Aladja | 0.00123 | 0.00914 | 0.1146 |
| 10 | 7 | Aladja | 24 | Sapele | 0.00258 | 0.01920 | 0.24065 |
| 11 | 8 | Benin | 14 | Onitsha | 0.00561 | 0.04176 | 0.52332 |
| 12 | 8 | Benin | 10 | Osogbo | 0.01029 | 0.07651 | 0.95879 |
| 13 | 8 | Benin | 24 | Sapele | 0.00205 | 0.01393 | 0.2071 |
| 14 | 9 | Ayede | 10 | Osogbo | 0.00471 | 0.03506 | 0.43928 |
| 15 | 15 | Birnin | 21 | Kanji | 0.01271 | 0.09450 | 1.18416 |
| 16 | 10 | Osogbo | 17 | Jebb TS | 0.00643 | 0.04786 | 0.59972 |
| 17 | 11 | AFAM | 12 | Alaoji | 0.00102 | 0.00697 | 0.10355 |
| 18 | 12 | Alaoji | 14 | Onitsha | 0.00566 | 0.04207 | 0.52714 |
| 19 | 13 | New Haven | 14 | Onitsha | 0.00393 | 0.02926 | 0.36671 |
| 20 | 16 | Gombe | 19 | Jos | 0.01082 | 0.08048 | 1.00844 |
| 21 | 17 | Jebb TS | 18 | Jebb CS | 0.00033 | 0.00223 | 0.03314 |
| 22 | 17 | Jebb TS | 23 | Shiroro | 0.01000 | 0.07438 | 0.93205 |
| 23 | 17 | Jebb TS | 21 | Kanji | 0.00332 | 0.02469 | 0.30941 |
| 24 | 19 | Jos | 20 | Kaduna | 0.00803 | 0.05975 | 0.74869 |
| 25 | 20 | Kaduna | 22 | Kano | 0.00943 | 0.07011 | 0.87857 |
| 26 | 20 | Kaduna | 23 | Shiroro | 0.00393 | 0.02926 | 0.36671 |
| 27 | 23 | Shiroro | 26 | Katempe | 0.00614 | 0.04180 | 0.6213 |
| 28 | 12 | Alaoji | 25 | Calabar | 0.0071 | 0.0532 | 0.38 |
| 29 | 14 | Onitsha | 27 | Okpai | 0.00213 | 0.01449 | 0.21538 |
| 30 | 25 | Calabar | 27 | Okpai | 0.0079 | 0.0591 | 0.39000 |
| 31 | 5 | Ikeja-west | 28 | AES GS | 0.00160 | 0.01180 | 0.09320 |

Table A3.
The 28-bus NGP transmission line flow and losses determined by the Newton–Raphson method in the MATLAB environment.
Table A3.
The 28-bus NGP transmission line flow and losses determined by the Newton–Raphson method in the MATLAB environment.
| Line | Power at Bus and Line Flow | Line Loss | ||||
|---|---|---|---|---|---|---|
| From | To | MW | MVar | MVA | MW | MVar |
| 3 | 1 | −274.40 | −298.70 | 405.60 | ||
| 1 | 3 | 275.41 | 305.54 | 411.35 | 1.01 | 6.85 |
| 4 | 5 | −344.70 | −352.55 | 493.06 | ||
| 5 | 4 | 346.56 | 366.29 | 504.25 | 1.86 | 13.74 |
| 1 | 5 | −113.49 | 450.74 | 464.81 | ||
| 5 | 1 | 118.47 | −416.88 | 433.39 | 4.98 | 33.86 |
| 5 | 8 | −303.38 | 23.23 | 304.27 | ||
| 8 | 5 | 314.00 | 56.74 | 319.09 | 10.62 | 79.98 |
| 5 | 9 | 38.70 | 161.33 | 165.91 | ||
| 9 | 5 | −37.15 | −149.70 | 154.24 | 1.55 | 11.63 |
| 5 | 10 | −96.20 | 24.86 | 99.36 | ||
| 10 | 5 | 97.26 | −16.95 | 98.73 | 1.06 | 7.91 |
| 6 | 8 | −13.80 | 81.69 | 82.84 | ||
| 8 | 6 | 14.28 | −78.41 | 79.70 | 0.48 | 3.27 |
| 2 | 8 | 346.98 | 45.52 | 367.81 | ||
| 8 | 2 | −359.61 | −5.50 | 359.65 | 5.37 | 40.01 |
| 2 | 7 | 305.02 | −0.25 | 305.02 | ||
| 7 | 2 | −303.98 | 7.97 | 304.8 | 1.04 | 7.71 |
| 7 | 24 | 207.48 | −41.44 | 211.58 | ||
| 24 | 7 | −206.43 | 49.28 | 212.23 | 1.05 | 7.84 |
| 8 | 14 | −214.11 | 36.33 | 217.17 | ||
| 14 | 8 | 216.62 | −17.64 | 217.34 | 2.51 | 18.68 |
| 8 | 10 | 235.22 | 60.61 | 242.90 | ||
| 10 | 8 | −229.46 | −17.78 | 230.15 | 5.76 | 42.82 |
| 8 | 24 | −373.19 | −108.52 | 388.65 | ||
| 24 | 8 | 376.13 | 128.48 | 397.47 | 2.94 | 19.96 |
| 9 | 10 | −238.65 | −120.71 | 267.44 | ||
| 10 | 9 | 242.72 | 150.98 | 285.84 | 4.07 | 30.27 |
| 15 | 21 | −114.50 | 51.20 | 125.43 | ||
| 21 | 15 | 116.23 | −38.36 | 122.39 | 1.73 | 12.84 |
| 10 | 17 | −311.72 | −87.00 | 323.63 | ||
| 17 | 10 | 318.84 | 139.97 | 348.20 | 7.12 | 52.92 |
| 11 | 12 | 378.50 | 237.22 | 446.69 | ||
| 12 | 11 | −376.65 | −224.60 | 438.54 | 1.85 | 12.61 |
| 12 | 14 | −21.86 | 11.22 | 24.57 | ||
| 14 | 12 | 21.89 | −10.98 | 24.49 | 0.03 | 0.24 |
| 13 | 14 | −177.90 | −97.42 | 202.83 | ||
| 14 | 13 | 179.55 | 109.69 | 210.40 | 1.65 | 12.27 |
| 16 | 19 | −130.60 | 31.39 | 134.32 | ||
| 19 | 16 | 132.12 | −20.07 | 133.64 | 1.52 | 11.33 |
| 17 | 18 | −494.24 | −81.23 | 500.88 | ||
| 18 | 17 | 495.00 | 86.34 | 502.47 | 0.76 | 5.11 |
| 17 | 23 | 657.81 | 57.55 | 660.32 | ||
| 23 | 17 | −618.00 | 238.49 | 662.43 | 39.80 | 296.04 |
| 17 | 21 | −493.40 | 80.85 | 499.98 | ||
| 21 | 17 | 500.97 | −24.51 | 501.57 | 7.58 | 56.34 |
| 19 | 20 | −202.42 | 190.37 | 277.88 | ||
| 20 | 19 | 207.31 | −154.02 | 258.26 | 4.89 | 36.35 |
| 20 | 22 | 225.83 | 98.96 | 246.56 | ||
| 20 | 23 | −6.26.14 | 128.94 | 639.28 | ||
| 23 | 20 | 640.79 | −19.86 | 641.10 | 14.65 | 109.08 |
| 23 | 26 | 295.82 | 123.03 | 320.38 | ||
| 26 | 23 | −290.10 | −84.12 | 302.05 | 5.72 | 38.92 |
| 12 | 25 | −28.49 | 0.58 | 28.50 | ||
| 25 | 12 | 28.54 | −0.18 | 28.54 | 0.05 | 0.41 |
| 14 | 27 | −602.66 | −47.11 | 604.50 | ||
| 27 | 14 | 610.03 | 97.27 | 617.74 | 7.34 | 50.15 |
| 25 | 27 | −138.54 | −6.72 | 138.71 | ||
| 27 | 25 | 139.97 | 17.38 | 141.04 | 1.43 | 10.66 |
| 5 | 28 | −737.35 | −462.82 | 870.57 | ||
| 28 | 5 | 750 | 556.13 | 933.69 | 12.65 | 93.31 |
| TOTAL LOSS | 158.32 | 1162.06 | ||||
References
- Al-Shaalan, A.M. Essential aspects of power system planning in developing countries. J. King Saud Univ.-Eng. Sci. 2011, 23, 27–32. [Google Scholar] [CrossRef]
- Saccomanno, F. Frequency and active power control. In Electric Power Systems: Analysis and Control; IEEE: Piscataway, NJ, USA, 2003; Chapter 3; pp. 173–288. [Google Scholar] [CrossRef]
- Eremia, M.; Shahidehpour, M. Voltage and reactive power control. In Handbook of Electrical Power System Dynamics: Modeling, Stability and Control; IEEE: Piscataway, NJ, USA, 2013; pp. 340–450. [Google Scholar] [CrossRef]
- Hatziargyriou, N.; Rahmann, C.; Canizares, C.; Hisken, I.; Pourbeik, P.; Cutsem, T. Definition and Classification of Power System Stability—Revisited & Extended. IEEE Trans. Power Syst. 2021, 36, 3271–3281. [Google Scholar] [CrossRef]
- National Electricity Regulation Commission. Peak Daily Electricity Generation. Available online: http://nerc.gov.ng/index.php/library/industry-statistics/generation/379-peak#graph (accessed on 15 July 2022).
- Transmission Company of Nigeria. Annual Technical Report; Transmission Company of Nigeria: Abuja, Nigeria, December 2017. [Google Scholar]
- The World Bank. Global Electrification Database, SDG 7: The Energy Report. (Access to electricity (% of population)—Nigeria). Available online: https://data.worldbank.org/indicator/EG.ELC.ACCS.Zs?locations=NG (accessed on 27 August 2022).
- Akwukwaegbu, I.O.; Izuegbunam, F.I.; Ndinechi, M.C. Voltage stability analysis of 86-bus 330 kV Nigeria power grid based on reserved energy potential via continuation power flow technique. Int. J. Res. Technol. IJERT 2021, 10. [Google Scholar] [CrossRef]
- Adebanji, B.; Ojo, A.; Fasina, T.; Adeleye, S.; Abere, J. Integration of renewable energy with smart grid application into the Nigeria’s power network: Issues, challenges and Opportunities. Eur. J. Eng. Technol. Res. 2022, 7, 18–24. [Google Scholar] [CrossRef]
- Abdulkareem, A.; Somefun, T.E.; Awosope, C.O.A.; Olabenjo, O. Power system analysis and integration of the proposed Nigerian 750-kV power line to the grid reliability. SN Appl. Sci. 2021, 3, 846. [Google Scholar] [CrossRef]
- Oluseyi, P.O.; Adelaja, T.S.; Akinbulire, T.O. Analysis of the transient stability limit of Nigeria’s 330 kV transmission sub-network. Niger. J. Technol. NIJOTECH 2017, 36, 213–226. [Google Scholar] [CrossRef]
- Ayamolowo, O.; Elutunji, B.; Salau, A.; Dada, J. Nigeria Electricity Power Supply System: The Past, Present and the Future. In Proceedings of the IEEE PES/IAS PowerAfrica Project, Abuja, Nigeria, 20–23 August 2019. [Google Scholar] [CrossRef]
- Akuru, U.B.; Okoro, O.I. Economic implication of constant power outages on SMEs in Nigeria. J. Energy S. Afr. 2022, 25, 61–66. [Google Scholar] [CrossRef]
- Blackout as National Grid Suffers Collapse—Fifth Time in 2022. The Cable Newspaper. Available online: https://www.thecable.ng/blackout-as-national-grid-suffers-collapse-second-in-less-than-three-months/amp (accessed on 15 June 2022).
- Pani, S.R.; Samal, R.K. Vulnerability Assessment of Power System Under N-1 Contingency Conditions. In Proceedings of the 2022 Second International Conference on Power, Control and Computing Technologies (ICPC2T), Raipur, India, 1–3 March 2022; pp. 1–4. [Google Scholar] [CrossRef]
- Ramirez-Gonzalez, M.; Sevilla, S.F.R.; Korba, P. Convolutional neural network based approach for static security assessment of power systems. In Proceedings of the 2021 World Automation Congress (WAC), Taipei, Taiwan, 1–5 August 2021; pp. 106–110. [Google Scholar] [CrossRef]
- Obi, P.I.; Ulas, J.A.; Offor, K.J.; Chidolue, G.C. Improving electric power quality in Nigerian existing 330kV 28 bus electric power systems using static var compensator system. Int. J. Eng. Res. Technol. 2013, 2, 1–7. [Google Scholar]
- Adebayo, I.; Jimoh, A.; Yusuff, A. Techniques for the Identification of Critical Nodes Leading to Voltage Collapse in a Power System. Int. J. Emerg. Electr. Power Syst. 2018, 19, 20170129. [Google Scholar] [CrossRef]
- Reissner, F.; Yin, H.; Weiss, G. A Stability Result for Network Reduced Power Systems Using Virtual Friction and Inertia. IEEE Trans. Smart Grid 2022, 13, 1668–1678. [Google Scholar] [CrossRef]
- Kasis, A.; Timotheou, S.; Polycarpou, M. Stability of power networks with time-varying inertia. In Proceedings of the 2021 60th IEEE Conference on Decision and Control (CDC), Austin, TX, USA, 14–17 December 2021; pp. 2788–2793. [Google Scholar] [CrossRef]
- Heidari Yazdi, S.S.; Rahimi, T.; Khadem Haghighian, S.; Bagheri, M.; Gharehpetian, G.B. Over-Voltage Regulation of Distribution Networks by Coordinated Operation of PV Inverters and Demand Side Management Program. Front. Energy Res. 2022, 10, 738. [Google Scholar] [CrossRef]
- Narimani, M.R.; Huang, H.; Ummunakwe, A.; Mao, Z.; Sahu, A.; Zonouz, S.; Davis, K. Generalized contingency analysis based on graph theory and line outage distribution factor. IEEE Syst. J. 2022, 16, 626–636. [Google Scholar] [CrossRef]
- Randey, A.; Agarwal, A.; Jereminov, M.; Nwachuku, T.; Rawn, B.; Pileggi, L. Improving voltage profile of the Nigerian Power Grid. IEEE PowerAfrica 2019. arXiv 2019, arXiv:1905.13090. [Google Scholar]
- Nkan, I.E.; Okpo, E.E.; Okoro, O.I. Multi-type FACTS controllers for power system compensation: A case study of the Nigerian 48-Bus, 330kV System. Niger. J. Technol. Dev. 2021, 18, 63–69. [Google Scholar] [CrossRef]
- Airoboman, E.; James, P.; Araga, I.A.; Wamdeo, C.L.; Okakwu, I.K. Contingency Analysis on the Nigerian Power Systems Network. In Proceedings of the 2019 IEEE PES/IAS PowerAfrica, Abuja, Nigeria, 20–23 August 2019; pp. 70–75. [Google Scholar] [CrossRef]
- Liu, S.; Zhao, D.; Fan, W.; Li, T.; Cui, D. The Stability Analysis of a Class of Electric Power Network Model. In Proceedings of the 2021 China International Conference on Electricity Distribution (CICED), Shanghai, China, 7–9 April 2021; pp. 589–593. [Google Scholar] [CrossRef]
- Alnasseir, J.; Alcharea, R.; Almaghout, F. Improving the Stability of Smart Grids by Using Flexible AlternatingCurrent Transmission Systems (FACTS). In Proceedings of the 2021 12th International Renewable Engineering Conference (IREC), Amman, Jordan, 14–15 April 2021; pp. 1–3. [Google Scholar] [CrossRef]
- Calma, E.R.B.; Pacis, M.C. Artificial Neural Network-based Voltage Stability Analysis of Power Transmission Networks with Distributed Generation using Phasor Measurement Unit Synthetic Data. In Proceedings of the 2021 IEEE 12th Control and System Graduate Research Colloquium (ICSGRC), Shah Alam, Malaysia, 7 August 2021; pp. 1–6. [Google Scholar] [CrossRef]
- Collados-Rodriguez, C.; Cheah-Mane, M.; Prieto-Araujo, E.; Gomis-Bellmunt, O. Stability and operation limits of power systems with high penetration of power electronics. Int. J. Electr. Power Energy Syst. 2022, 138, 107728. [Google Scholar] [CrossRef]
- Gbadamosi, S.L.; Nwulu, N.I.; Siano, P. Harmonics constrained Approach to Composite Power System Expansion Planning with Large-Scale Renewable Energy Sources. Energies 2020, 15, 4070. [Google Scholar] [CrossRef]
- Abirami, P.; Ravi, C.N. Enhancing grid stability by maintaining power quality in distribution network using FOPID and ANN controlled shunt active filter. Environ. Dev. Sustain. 2022, 24, 7551–7578. [Google Scholar] [CrossRef]
- Zaheb, H.; Danish, M.S.S.; Senjyu, T.; Ahmadi, M.; Nazari, A.M.; Wali, M.; Khosravy, M.; Mandal, P. A contemporary novel classification of voltage stability indices. Appl. Sci. 2020, 10, 1639. [Google Scholar] [CrossRef]
- Saadat, H. Power System Analysis, 4th ed.; McGraw-Hill Series in Electrical and Computer Engineering; McGraw-Hill: New York, NY, USA, 1999; pp. 232–238. [Google Scholar]
- Savas, C.; Dovis, F. The impact of different kernel functions on the performance of scintillation detection based on support vector machines. Sensors 2019, 19, 5219. [Google Scholar] [CrossRef]
- Squires, G.L. Practical Physics, 4th ed.; Cambridge University Press: Cambridge, UK, 2001; ISBN 978-0-521-77940-1. [Google Scholar] [CrossRef]
- Zisserman, A. Lecture 2: The SVM Classifier. C19 Machine Learning, 2015. 2021. Available online: http://www.robots.ox.ac.uk/~az/lectures/ml (accessed on 24 August 2022).
- Amusan, T.O.; Nwulu, N.I.; Gbadamosi, S.L. Identification of Weak Buses for Optimal Load Sheddingusing Differential Evolution. Sustainability 2022, 14, 3146. [Google Scholar] [CrossRef]
- Abdulkareem, A.; Adesanya, A.; Agbetuyi, A.F.; Alayande, A.S. Novel approach to determine unbalanced current circuit on Nigerian 330kV transmission grid for reliability and security enhancement. Heliyon 2021, 7, e07563. [Google Scholar] [CrossRef] [PubMed]
- Gbadamosi, S.L.; Nwulu, N.I. A multi-period composite generation and transmission expansion planning model incorporating renewable energy sources and demand response. Sustain. Energy Technol. Assess. 2020, 26, 100726. [Google Scholar] [CrossRef]
- Gbadamosi, S.L.; Nwulu, N.I. A comparative analysis of generation and transmission expansion planning models for power loss minimization. Sustain. Energy Grids Netw. 2022, 26, 100456. [Google Scholar] [CrossRef]
- Gbadamosi, S.L.; Nwulu, N.I. Reliability assessment of composite generation and transmission expansion planning incorporating renewable energy sources. J. Renew. Sustain. Energy 2020, 12, 026301. [Google Scholar] [CrossRef]
- Samuel, I.A. A New Voltage Stability Index for Predicting Voltage Collapse in Electrical Power System Networks. Ph.D. Thesis, Covenant University, Ota, Ogun State, Nigeria, January 2017. [Google Scholar]
Publisher’s Note: MDPI stays neutral with regard to jurisdictional claims in published maps and institutional affiliations. |
© 2022 by the authors. Licensee MDPI, Basel, Switzerland. This article is an open access article distributed under the terms and conditions of the Creative Commons Attribution (CC BY) license (https://creativecommons.org/licenses/by/4.0/).