Article

Energy and Exergy Analysis of Vapor Compression Refrigeration System with Low-GWP Refrigerants

1
Department of Mechanical Engineering, University of Engineering and Technology Lahore, Lahore 54000, Pakistan
2
Mechanical Engineering Department, Abu Dhabi University, Abu Dhabi P.O. Box 59911, United Arab Emirates
3
Department of Agricultural Engineering, Bahauddin Zakariya University, Multan 60800, Pakistan
4
Centre for Process Systems Engineering, Department of Chemical Engineering, University College London, Torrington Place, London WC1E 7JE, UK
5
Faculty of Science and Technology, Jan Dlugosz University in Czestochowa, 13/15 Armii Krajowej Av., 42-200 Czestochowa, Poland
*
Authors to whom correspondence should be addressed.
Energies 2022, 15(19), 7246; https://doi.org/10.3390/en15197246
Submission received: 8 July 2022 / Revised: 25 September 2022 / Accepted: 28 September 2022 / Published: 2 October 2022
(This article belongs to the Special Issue New Insights into Heat Recovery and Air Conditioning)

Abstract

:
In this paper, a first- and second-law analysis of vapor compression refrigeration is presented to estimate and propose the replacement of R134 with working fluids having less global warming potential (GWP) and less exergy destruction and irreversibilities. Six different refrigerants were studied, namely, R717, R1234yf, R290, R134a, R600a, and R152a. A thermodynamic model was designed on Engineering Equation Solver (EES) software, and performance parameters were calculated. The model was deployed on all six refrigerants, while the used output parameters of performance were cooling capacity, coefficient of performance, discharge temperature, total exergy destruction, relative exergy destruction rates of different components, second-law efficiency, and efficiency defect of each component. The performance parameters were estimated at different speeds of the compressor (1000, 2000, and 3000 rpm) and fixed condenser and evaporator temperatures of 50 °C and 5 °C, respectively. The isentropic efficiency of the compressor was the same as the volumetric efficiency, and it was taken as 75%, 65%, and 55% at the compressor speeds of 1000 rpm, 2000 rpm, and 3000 rpm, respectively. A comparison of the performance parameters was presented by importing the results in MATLAB. It was found that the compressor had the highest exergy destruction compared to the other components. It was found that R152 was the refrigerant with zero ozone depletion potential (ODP) and a GWP value of 140 with less exergy destruction and irreversibilities. Moreover, it was easy to use R152a with good thermodynamic characteristics. It is estimated that R152a is a suitable replacement for R134a, as it can be used with few modifications.

1. Introduction

Refrigerant R-12 was the first refrigerant used in 1930. It was used for about half a century in automotive air-conditioning systems in vehicles due to its characteristics, including safety and durability. In 1970, scientists [1,2,3] presented that chlorofluorocarbons (CFCs) were depleting the ozone layer due to high ODP. At that time, R-134 was found to be a suitable refrigerant with zero ODP. Later in 1990, R-134 was found to be environmentally unfriendly due to a GWP higher than 150 [4]. The Montreal protocol [5,6] forced automobile-manufacturing companies to find an alternative refrigerant for R-134a with a GWP less than or equal to 150. Later, a number of refrigerants, such as R1234yf, R1234ze, and R152a, were found as replacements for R-134a. These refrigerants were found to be efficient with small modifications in absorption air-conditioning systems (AACSs) [7,8].
Sumeru et al. [9,10] studied the performance parameters of refrigerants R134a and R152a in automotive air-conditioning systems. The analysis was performed at compressor speeds of 1000 RPM, 2000 RPM, and 3000 RPM and condenser temperatures of 40 °C, 45 °C, and 50 °C. J Brown et al. [11] estimated the performance of the refrigerant R134 and CO2 in vapor compression for AACSs using semitheoretical models. The CO2 system was linked to the heat exchanger. The coefficient of performance (COP) of R134a was found to be higher than CO2, and the COP disparity increased directly with the rise in ambient temperature and compressor speed. Joudi et al. [12] presented the performance of an AACS and developed a computational model. They used refrigerants R-12, R134a, R-600a, and a combination of propane and isobutene. The analysis was performed to find an alternative refrigerant for R-12, and the model was studied on the basis of condenser and evaporator temperatures. Lee et al. [13] performed both numerical and experimental analyses of an AACS under various operating conditions. They used a laminated-type evaporator, a thermal expansion valve, a plate-type compressor, and a parallel flow condenser in the apparatus. A computer program was constructed to predict the performance of the evaporator on the basis of the overall heat transfer coefficient. Yataganbaba et al. [14] performed a numerical analysis of a vapor compression cycle. They analyzed the performance parameters in a computer code in Engineering Equation Solver. The study was based on refrigerants R1234yf and R1234ze as suitable replacements for R134a.
Belman Flores et al. [15] presented an energy and exergy analysis of refrigerant 1234yf as an alternative refrigerant for R134a. They studied the various parameters of exergy, including the exergy destruction, exergy efficiency, exergy rate of the product, efficiency defect, and exergy destruction ratio. They investigated these parameters concerning condenser and evaporator temperatures. Soudabah Golzari et al. [16] presented a second-law analysis for automotive air-conditioning systems. They estimated the performance parameters, including coefficient of performance, exergy efficiency, exergy destruction, and entropy generation. The thermodynamic properties were accessed with REFPROP 8.0 software, and a simulation was performed with MATLAB software. Jemma et al. [17] performed a numerical investigation of refrigerant R1234ze as a replacement for R134a. The performance was analyzed in Engineering Equation Solver, and the parameters studied including exergy destruction, energy efficiencies, and exergy losses in different components of the cycle. They concluded that the compressor had the highest energy destruction among the other components. Kaynakli et al. [18] conducted an experimental analysis of automotive air-conditioning systems. They studied the performance of an AACS on the basis of ambient temperature, condensing and evaporating temperatures, and revolutions of the compressor. They observed that the cooling capacity increased with the rise in compressor speed. Alkan et al. [19] estimated the performance of an AACS by both fixing the speed of the compressor and varying the speed. The system’s performance was analyzed in both cases by varying air stream temperatures in the compressor and evaporator and air stream velocity. It was found that the cooling capacity of the refrigerants was increased with the increase in condenser air speed in variable speed operation [20].
Hosoz et al. [21] used a support vector regression approach to analyze the performance parameters of R1234yf in automotive air-conditioning systems. They presented an experimental analysis and used a microchannel condenser, an evaporator of the laminated type, a swash-type compressor, and an air filter. The thermophysical characteristics of R1234yf were taken from REFPROP 9.1 software, and the experiment was performed at 1000 RPM, 1500 RPM, 2000 RPM, and 2500 RPM. Mclinden et al. [22] studied refrigerants based on different properties, such as stability, GWP, flammability, toxicity, and critical temperature. They initially considered 56,000 candidates and then shortlisted 1200 refrigerants. They studied these refrigerants and minimized the candidates on the basis of performance. Many articles have been published on exergy analyses and first-law analyses of cooling systems. Most of these papers have studied evaporator and condenser temperature bases. However, some articles have discussed the wind speed and mass flow rates of refrigerants for cooling performance.
Joaquin Navaroo and Franisco carried out research on a vapor compression system to identify a replacement for refrigerant R134a, and they came to the conclusion that R1234yf was a good replacement for R134a [23]. Overall, the average volumetric efficiency of R152a was 26%, 14% higher than those of R1234yf and R134a due to a higher specific gas constant and lower suction pressure [24]. R134a, one of the most commonly used refrigerants, especially for air-conditioning (AC) systems, will be banned in automotive air conditioners after 2022 due to a high global warming potential (GWP). R152a and R1234yf are considered two potential low-GWP drop-in alternatives to R134a due to similar thermodynamic properties. In this paper, the performances of R152a, R1234yf, and R134a, along with three other low-GWP refrigerants, are studied to identify the most suitable replacement for R134a. The investigation is carried out on six different low-GWP refrigerants in order to identify the most suitable replacement. The novelty of this study is that it proves R152a as an excellent replacement for R134a instead of R1234yf. In addition, Meng et al., carried out research by mixing R134a with R1234yf to investigate the performance. By comparing and contrasting the results, the current study shows that R152a has high performance characteristics, even from the mixture of refrigerants R134a and R1234yf.
The main aspect of our study is to examine the exergy and first-law parameters on the basis of compressor speed. This paper analyzes six different refrigerants, where the condenser and evaporator temperatures remain constant, as mentioned in Table 1. Each refrigerant is environmentally friendly, having low GWP and ODP values. The refrigerants are studied on the basis of suitable thermodynamic properties. In addition, the refrigerants should have less exergy destruction and irreversibilities, as well as more second-law efficiency and COP.
This paper presents different sections, where the introduction section demonstrates a general literature review of the topic and compares and contrasts different scholars’ research. The methodology section demonstrates the method by which the current study is conducted. It also demonstrates the mathematical modeling and modeling procedure. The results and discussion sections discuss the output results and their importance in the field of refrigeration and air conditioning. The conclusion section gives the overall crux of this paper and the novel finding that R152a is an excellent replacement for the R134a refrigerant.

2. Methodology

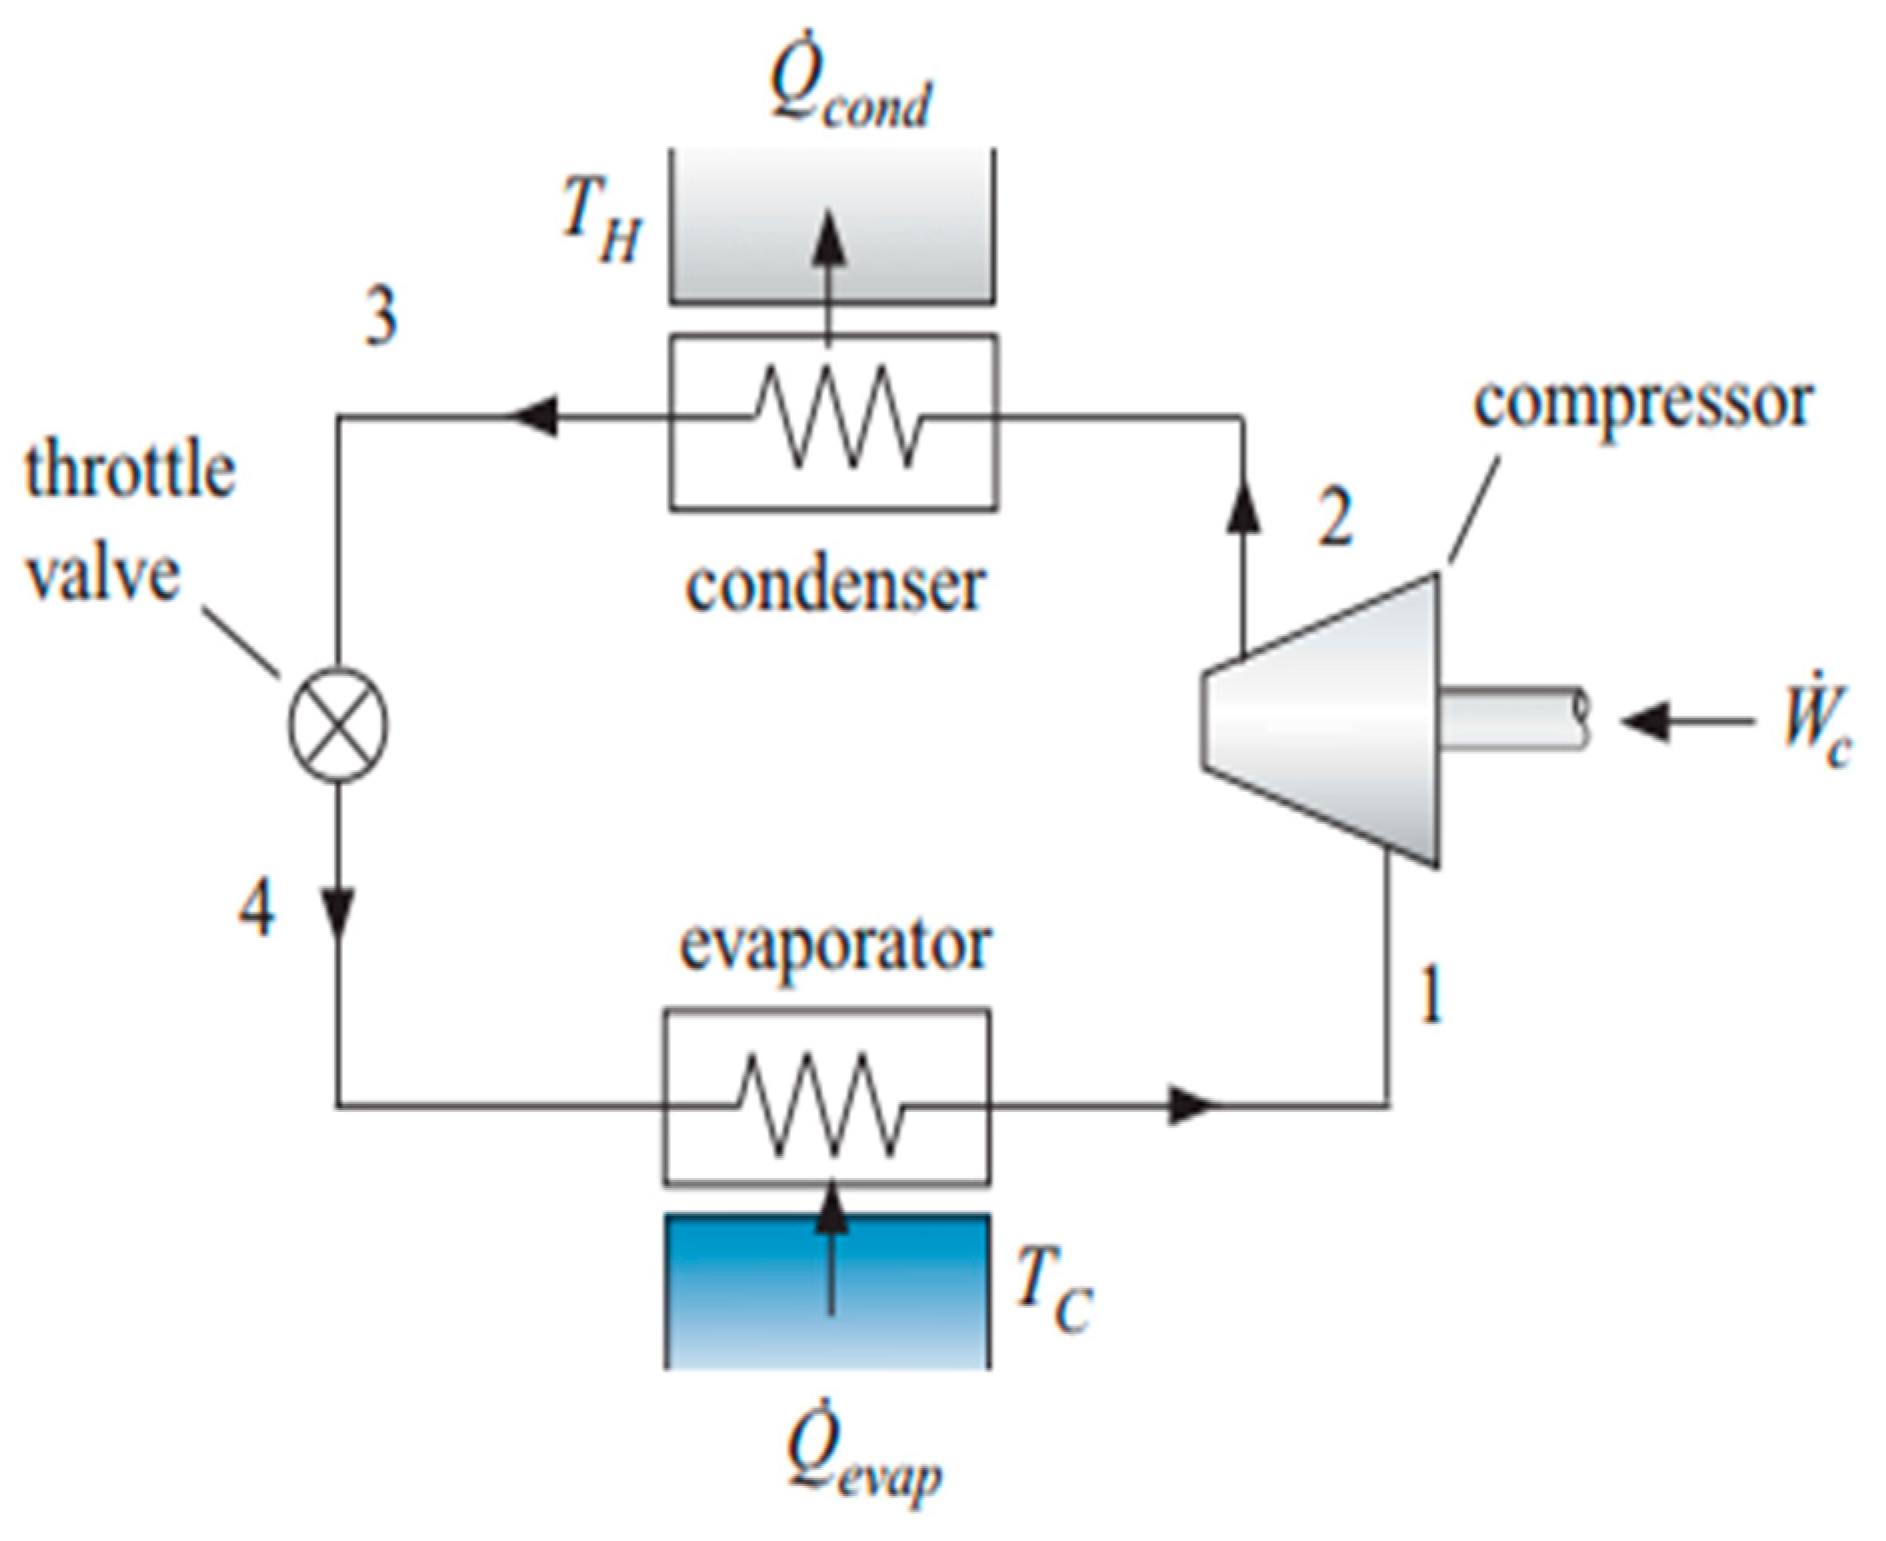
2.1. EES Modeling of Automotive Air-Conditioning System

Vapor compression refrigeration is the thermodynamic cycle for automotive air-conditioning systems. The schematic diagram of a vapor compression refrigerant cycle (VCRC) is given below in Figure 1. A VCRC consists of four components: a compressor, a condenser, an expansion valve, and an evaporator [25,26]. The refrigerant flows through these parts, respectively, and produces cooling in the definite space in which it is needed. While passing through these components, some sequential changes are also observed in the cycle. In the compressor, the flowing refrigerant is compressed from a low evaporator pressure to a high pressure before entering the condenser.
The power from a vehicle is given to the compressor to work on the refrigerant. Both temperature and pressure are increased before it enters the condenser. The compressed refrigerant flows through the condenser, where it is condensed. The refrigerant at the discharge of the compressor is saturated vapors. When it enters the condenser, it changes into saturated liquid after condensation and gives its heat to the condensing medium, and phase change is observed. At the outlet of the condenser, it is a saturated liquid, and after this, it passes through an expansion or throttling valve. It is an isenthalpic process, and the refrigerant changes into wet liquid and vapors after expansion takes place. After that, it passes through the evaporator, takes heat from the space, and changes into saturated vapors at the end of the evaporator. In this process, it takes the heat from the space, and the space becomes colder, producing cooling. After this, it again enters the compressor, and the cycle is repeated [27,28,29]. The compressor speed and the temperatures of the evaporator and condenser are mentioned in Table 2.

2.2. Modeling Procedure

The working principle depends on the vapor compression refrigeration cycle. The compressor of an AACS is attached to the car engine. The compressor rotates with the rotation of the engine. As the speed of the engine increases, the input power of the compressor increases, and as a result, the cooling capacity of the compressor increases. In this process, the speed of the compressor increases from low to high. The RPM selected were 1000, 2000, and 3000 RPM, and the given RPM values showed the engine speeds during idle, city, and high-speed operations, respectively. Seven performance parameters were discussed as output parameters, including cooling capacity, COP, discharge temperature, exergy destruction rate of each component, exergy destruction of the system, second-law efficiency of each component, relative exergy destruction, and efficiency defects of all the components. Some assumptions were made to model the thermodynamic cycle.
  • The process took place under steady-state conditions.
  • The effects of potential and kinetic energy were very small and were neglected.
  • Superheat in an evaporator was the same as subcooling in the condenser.
  • Subcooling in the condenser and superheating in the evaporator increased with the increase in revolutions of the compressor. Both superheat and subcooling values in the evaporator and condenser were 1 K, 2 K, and 3 K for 1000 RPM, 2000 RPM, and 3000 RPM, respectively.
  • The volumetric and isentropic efficiencies of the compressor were the same. The isentropic efficiency of the compressor was 75%, 65%, and 55% at 1000 RPM, 2000 RPM, and 3000 RPM, respectively [10]. These compressor speeds presented idle (or low speed), city, and high-speed operations. The volumetric and isentropic efficiencies of the compressor reduced with the increase in compressor revolutions. This was due to irreversibility and entropy generation with the rise in compressor speed.
  • The displacement of the compressor was 120 × 106 m3.rev1, and its value was constant.
  • The refrigerant entering the evaporator was a mixture of vapor and liquid, and the expansion in the throttle valve took place at constant enthalpy.
  • The pressure drops in all the components were very small and were neglected.

2.3. Mathematical Model

There are seven parameters from which we can estimate the performance of an automotive air-conditioning system, including COP, cooling capacity, discharge temperature, exergy destruction rates of all the components, relative exergy destruction of all the components, second-law efficiency of each component, and efficiency defect of each component [30,31].
The amount of cooling produced in the evaporator is called cooling capacity [32,33] and is given by Equation (1):
Q e v a p = m ( h 7 h 6 )
where Qevap is the cooling capacity of the refrigerant.
The ratio of the cooling capacity of the evaporator to the input power of the compressor is known as the coefficient of performance (COP) (Equation (2)):
C O P = Q e v a p P c o m p = h 7 h 6 h 2 h 1
where Qevap is the cooling capacity, Pcomp is the input power of the compressor, and COP is the coefficient of performance.
The exergy destruction in the compressor, condenser, expansion valve, and evaporator and the total exergy destruction are expressed by Equations (3)–(7), respectively.
X d e s t , c o m p = T o · m ( s 2 s 1 )
X d e s t , c o n d = T o [ m ( s 5 s 2 ) + Q c o n d ( T a v g , c o n d )
X d e s t , e x p v a l v e = T o · m ( s 6 s 5 )
X d e s t , e v a p = T o [ m ( s 1 s 6 ) + Q e v a p ( T a v g , e v a p )
X d e s t , t o t a l = X d e s t , c o m p + X d e s t , c o n d + X d e s t , e x p v a l v e + X d e s t , e v a p
where T a v g , c o n d is the average air temperature in the condenser, and T a v g , e v a p is the average air temperature in the evaporator [34,35,36,37].
The second-law efficiency of the compressor, condenser, expansion valve, and evaporator and the overall efficiency of the system can be described by Equations (8)–(12), respectively:
η c o m p = 1 X d e s t , c o m p P i n p u t
η c o n d = 1 X d e s t , c o n d X d i f f , c o n d
η e x p v a l v e = 1 X d e s t , e x p v a l v e X D i f f , E x p v a l v e
η e v a p = 1 X d e s t , E v a p X D i f f , E v a p
η s y s = 1 X d e s t t o t a l P i n p u t
where Pinput is the input power of the compressor, XDiff,cond is the difference in energy between the inlet and outlet of the condenser, XDiff,Expvalve is the difference in exergy at the inlet and outlet of the expansion valve [38], and XDiff,Evap is the gain in energy in the evaporator. Similarly, the relative exergy destruction in the compressor, condenser, expansion valve, and evaporator and the overall efficiency of the system can be described by Equations (13)–(16), respectively:
X d e s t , r e l a t i v e , c o m p = X d e s t , c o m p X d e s t , t o t a l
X d e s t , r e l a t i v e , c o n d = X d e s t , c o n d X d e s t , t o t a l
X d e s t , r e l a t i v e , e x p v a l v e = X d e s t , e x p v a l v e X d e s t , t o t a l
X d e s t , r e l a t i v e , e v a p = X d e s t , e v a p E d e s t , t o t a l
The efficiency defects of the compressor, condenser, expansion valve, and evaporator are depicted by Equations (17)–(20), respectively:
δ c o m p = X d e s t , c o m p P i n p u t
δ c o n d = X d e s t , c o n d P i n p u t
δ e x p v a l v e = X d e s t , e x p v a l v e P i n p u t
δ e v a p = X d e s t , e v a p P i n p u t
The EES code developed by using the above mathematical modelling equations is given in Appendix A.

3. Results and Discussion

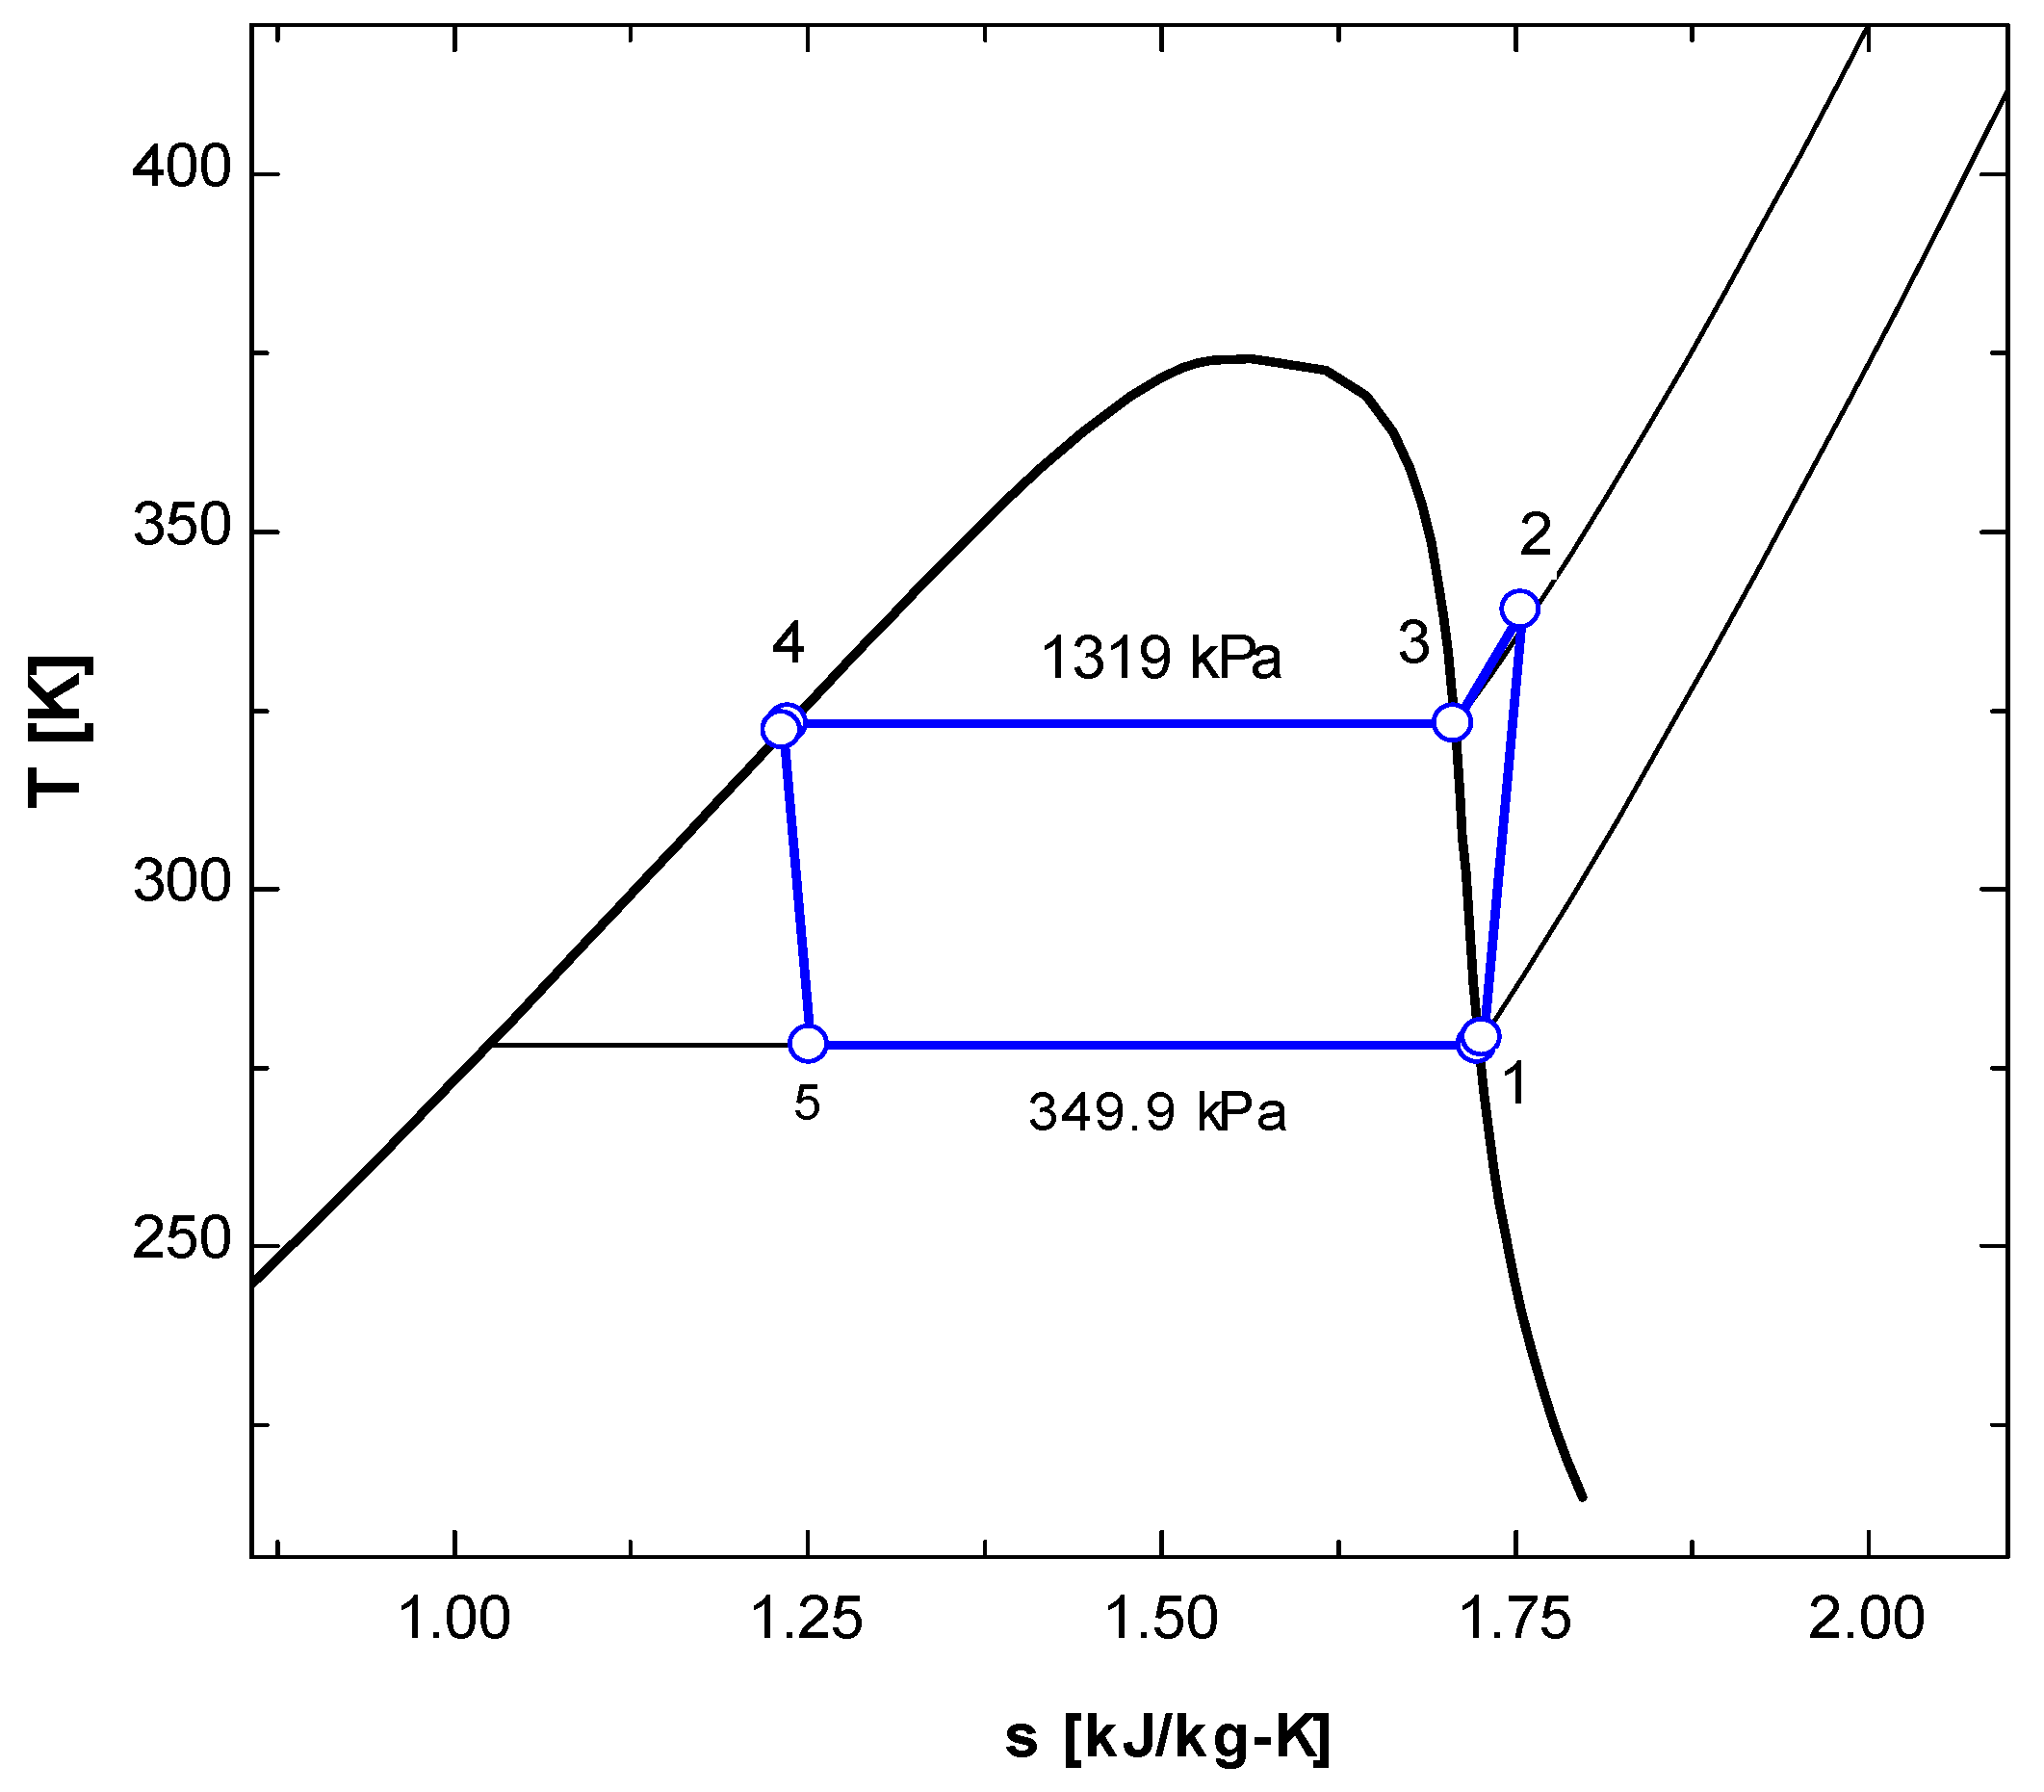
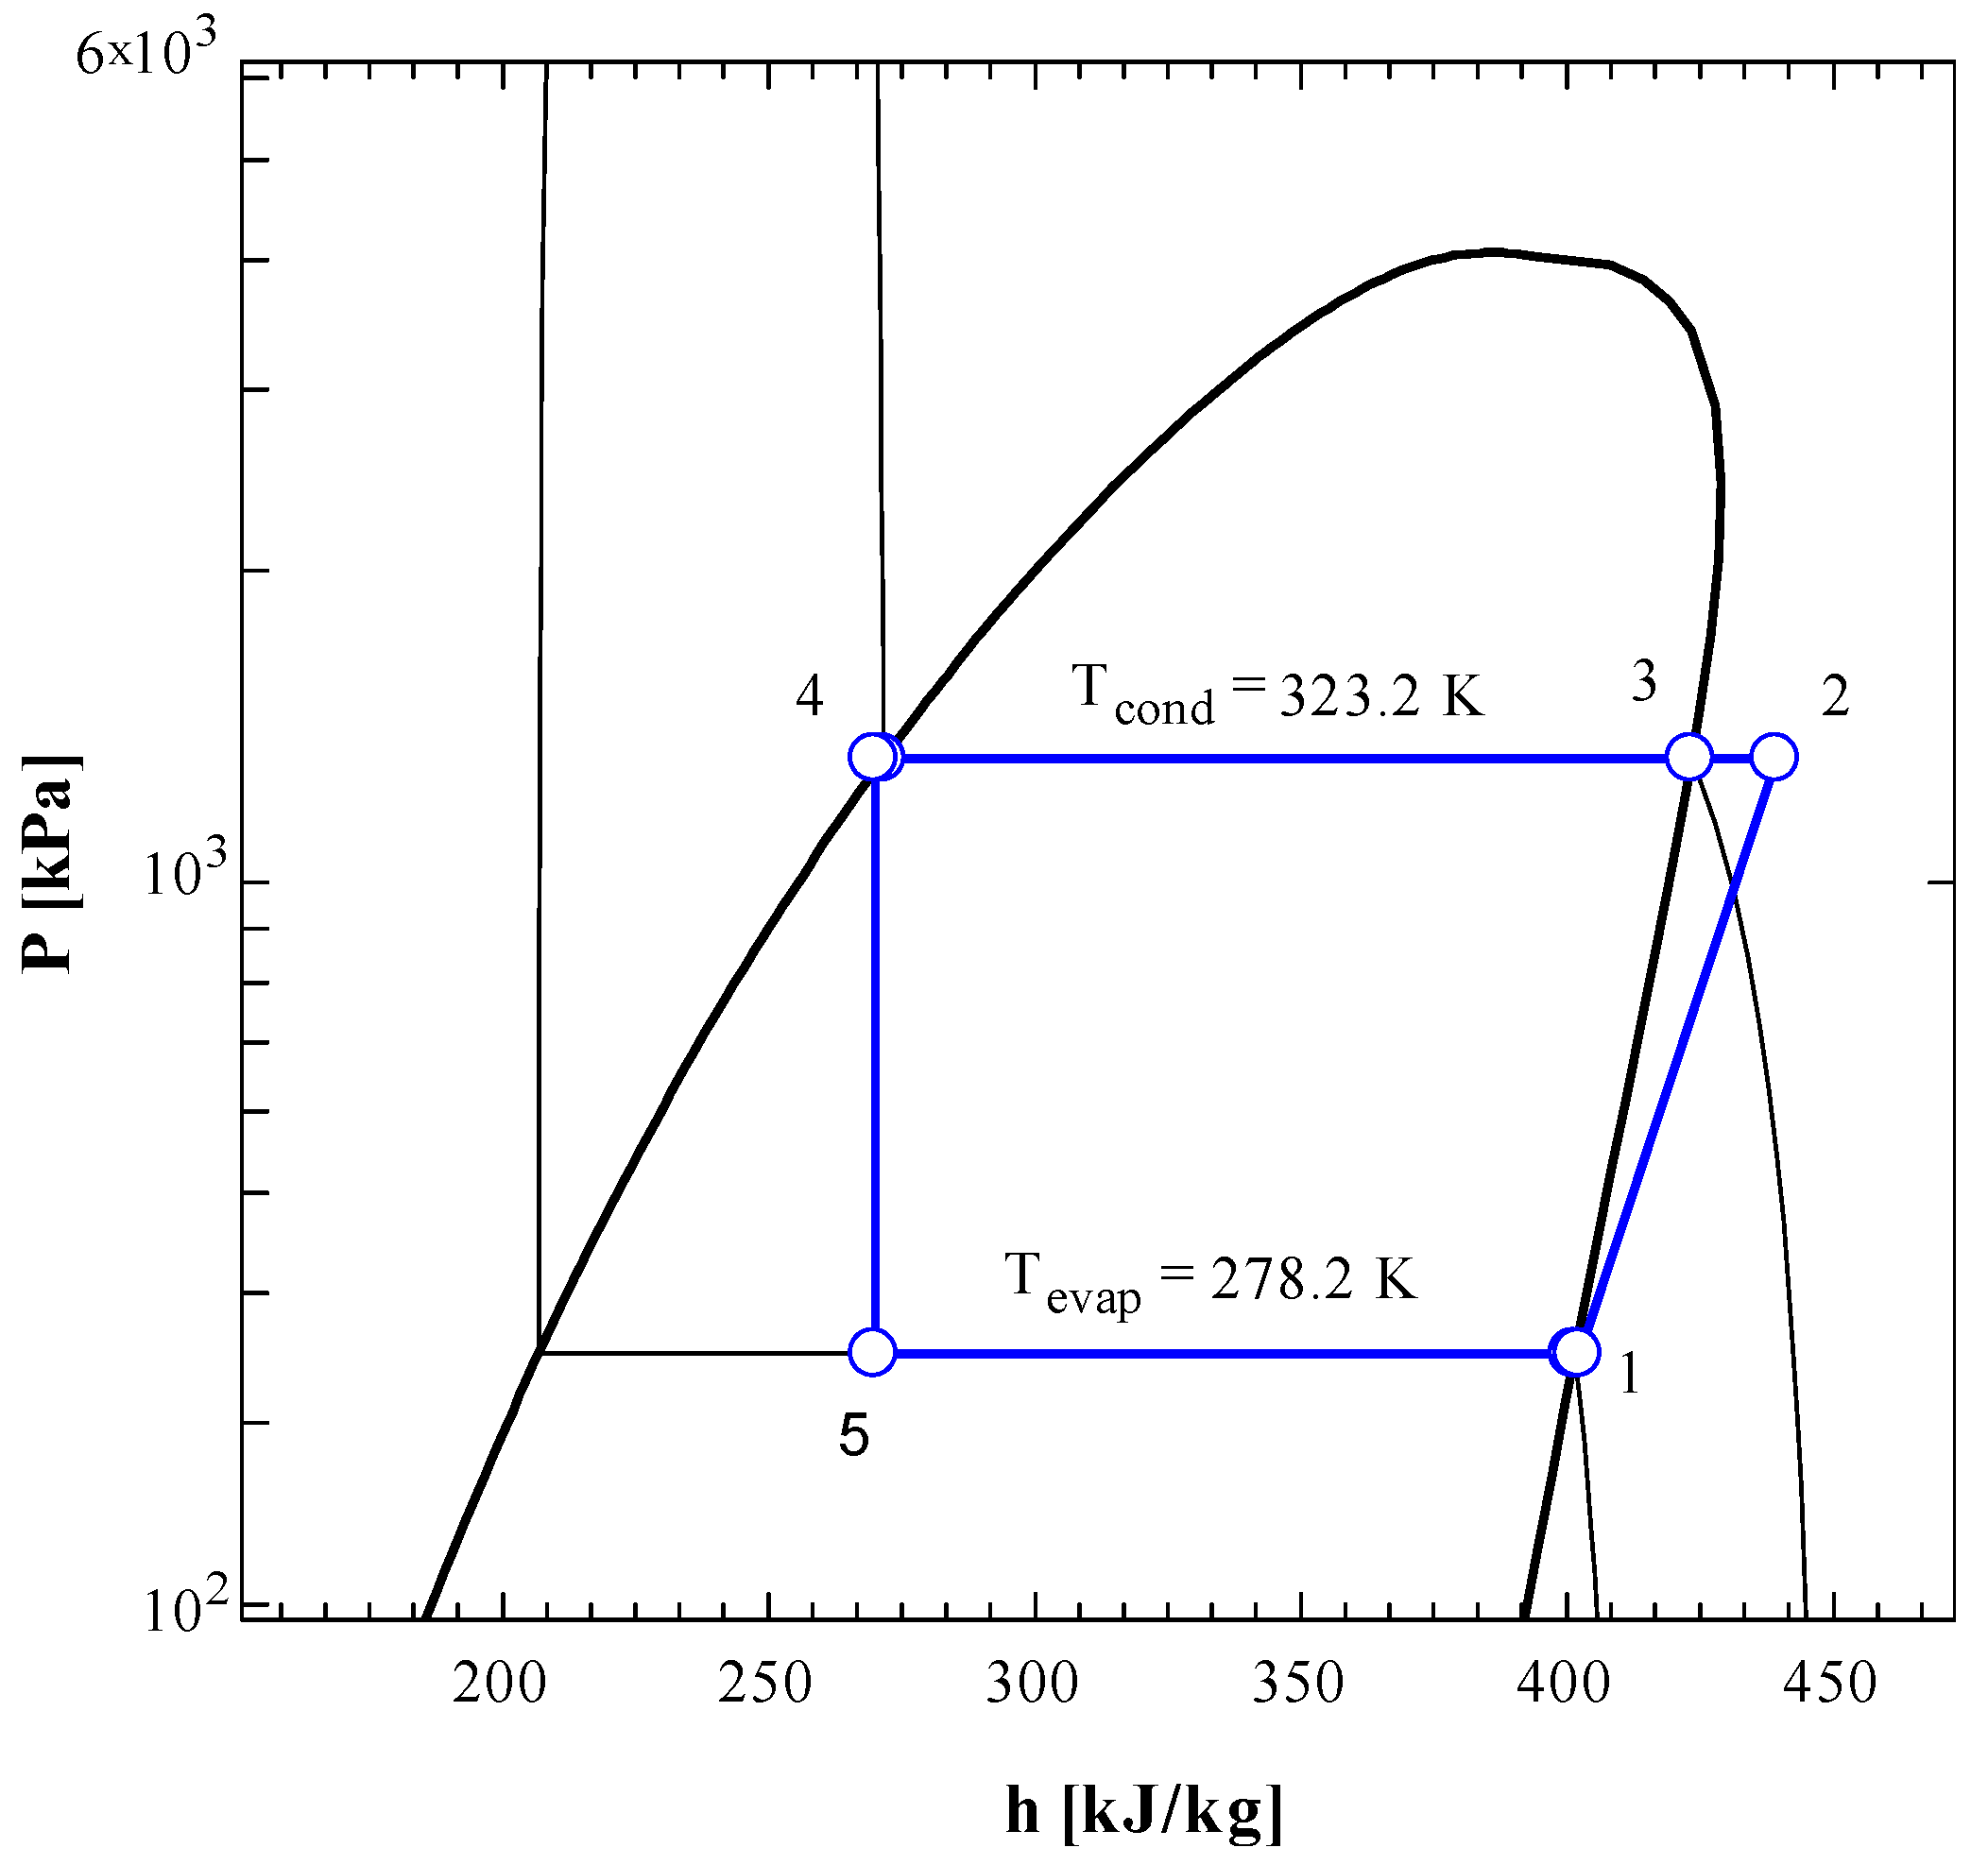
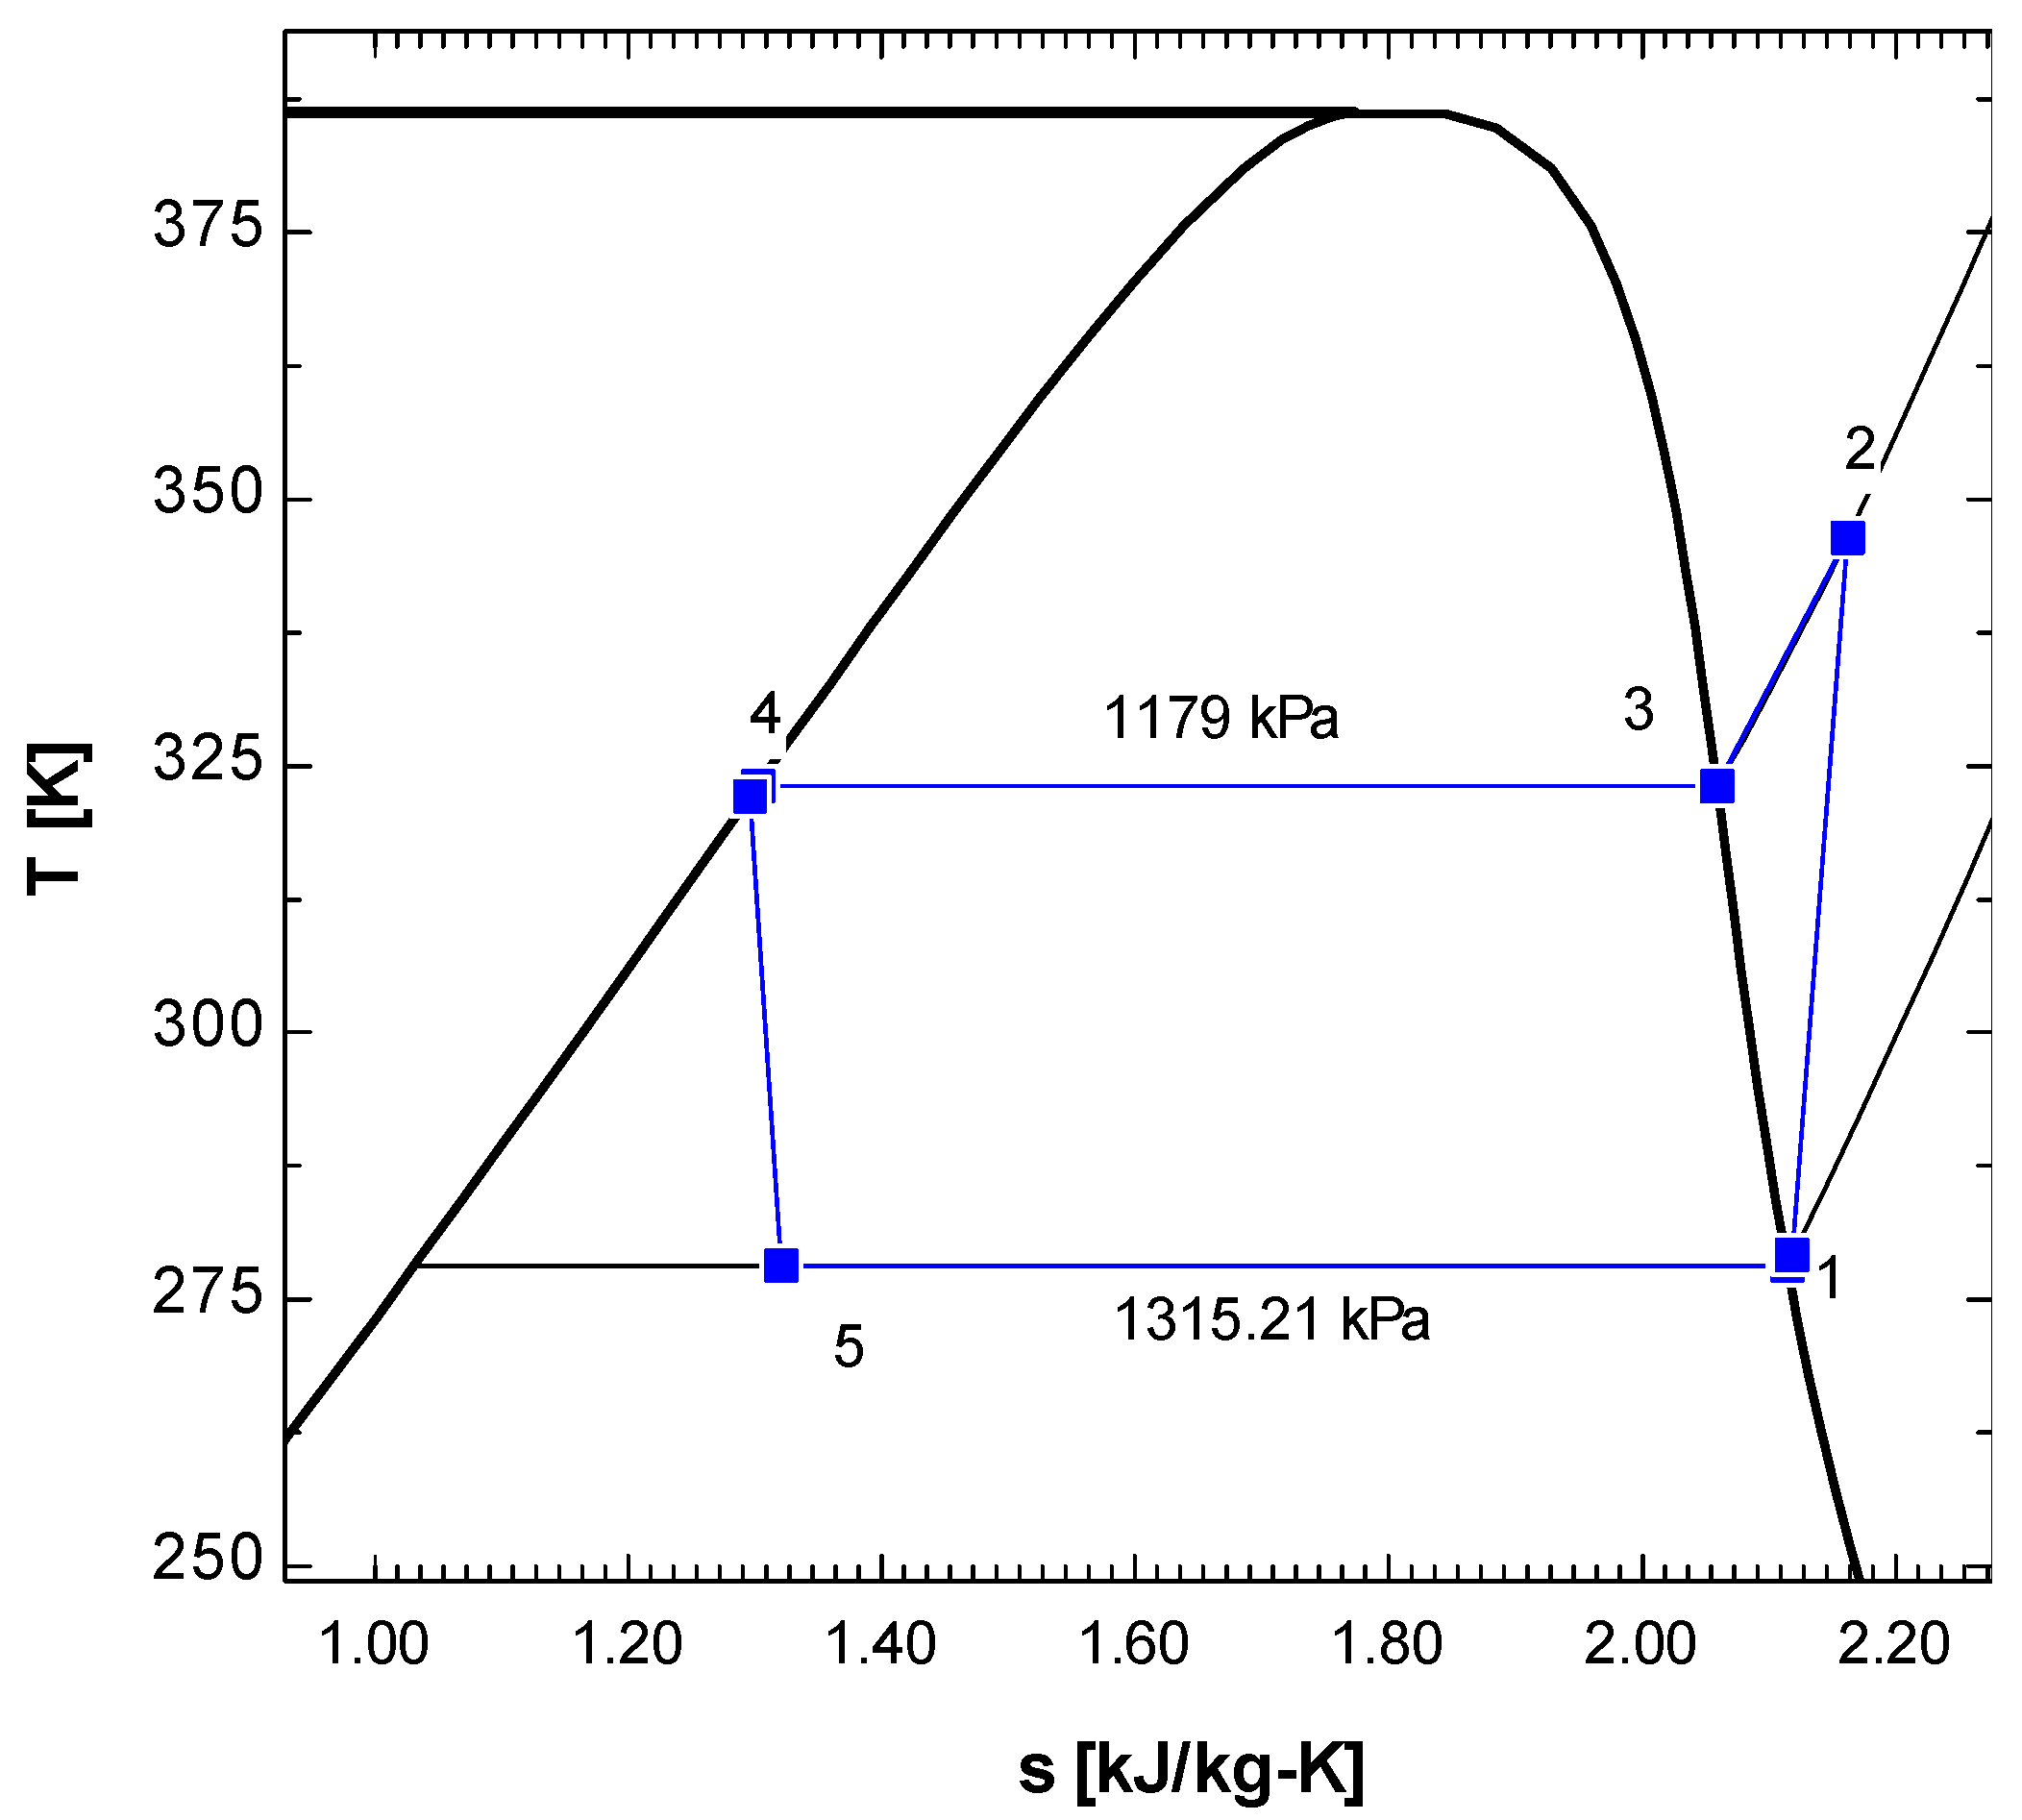
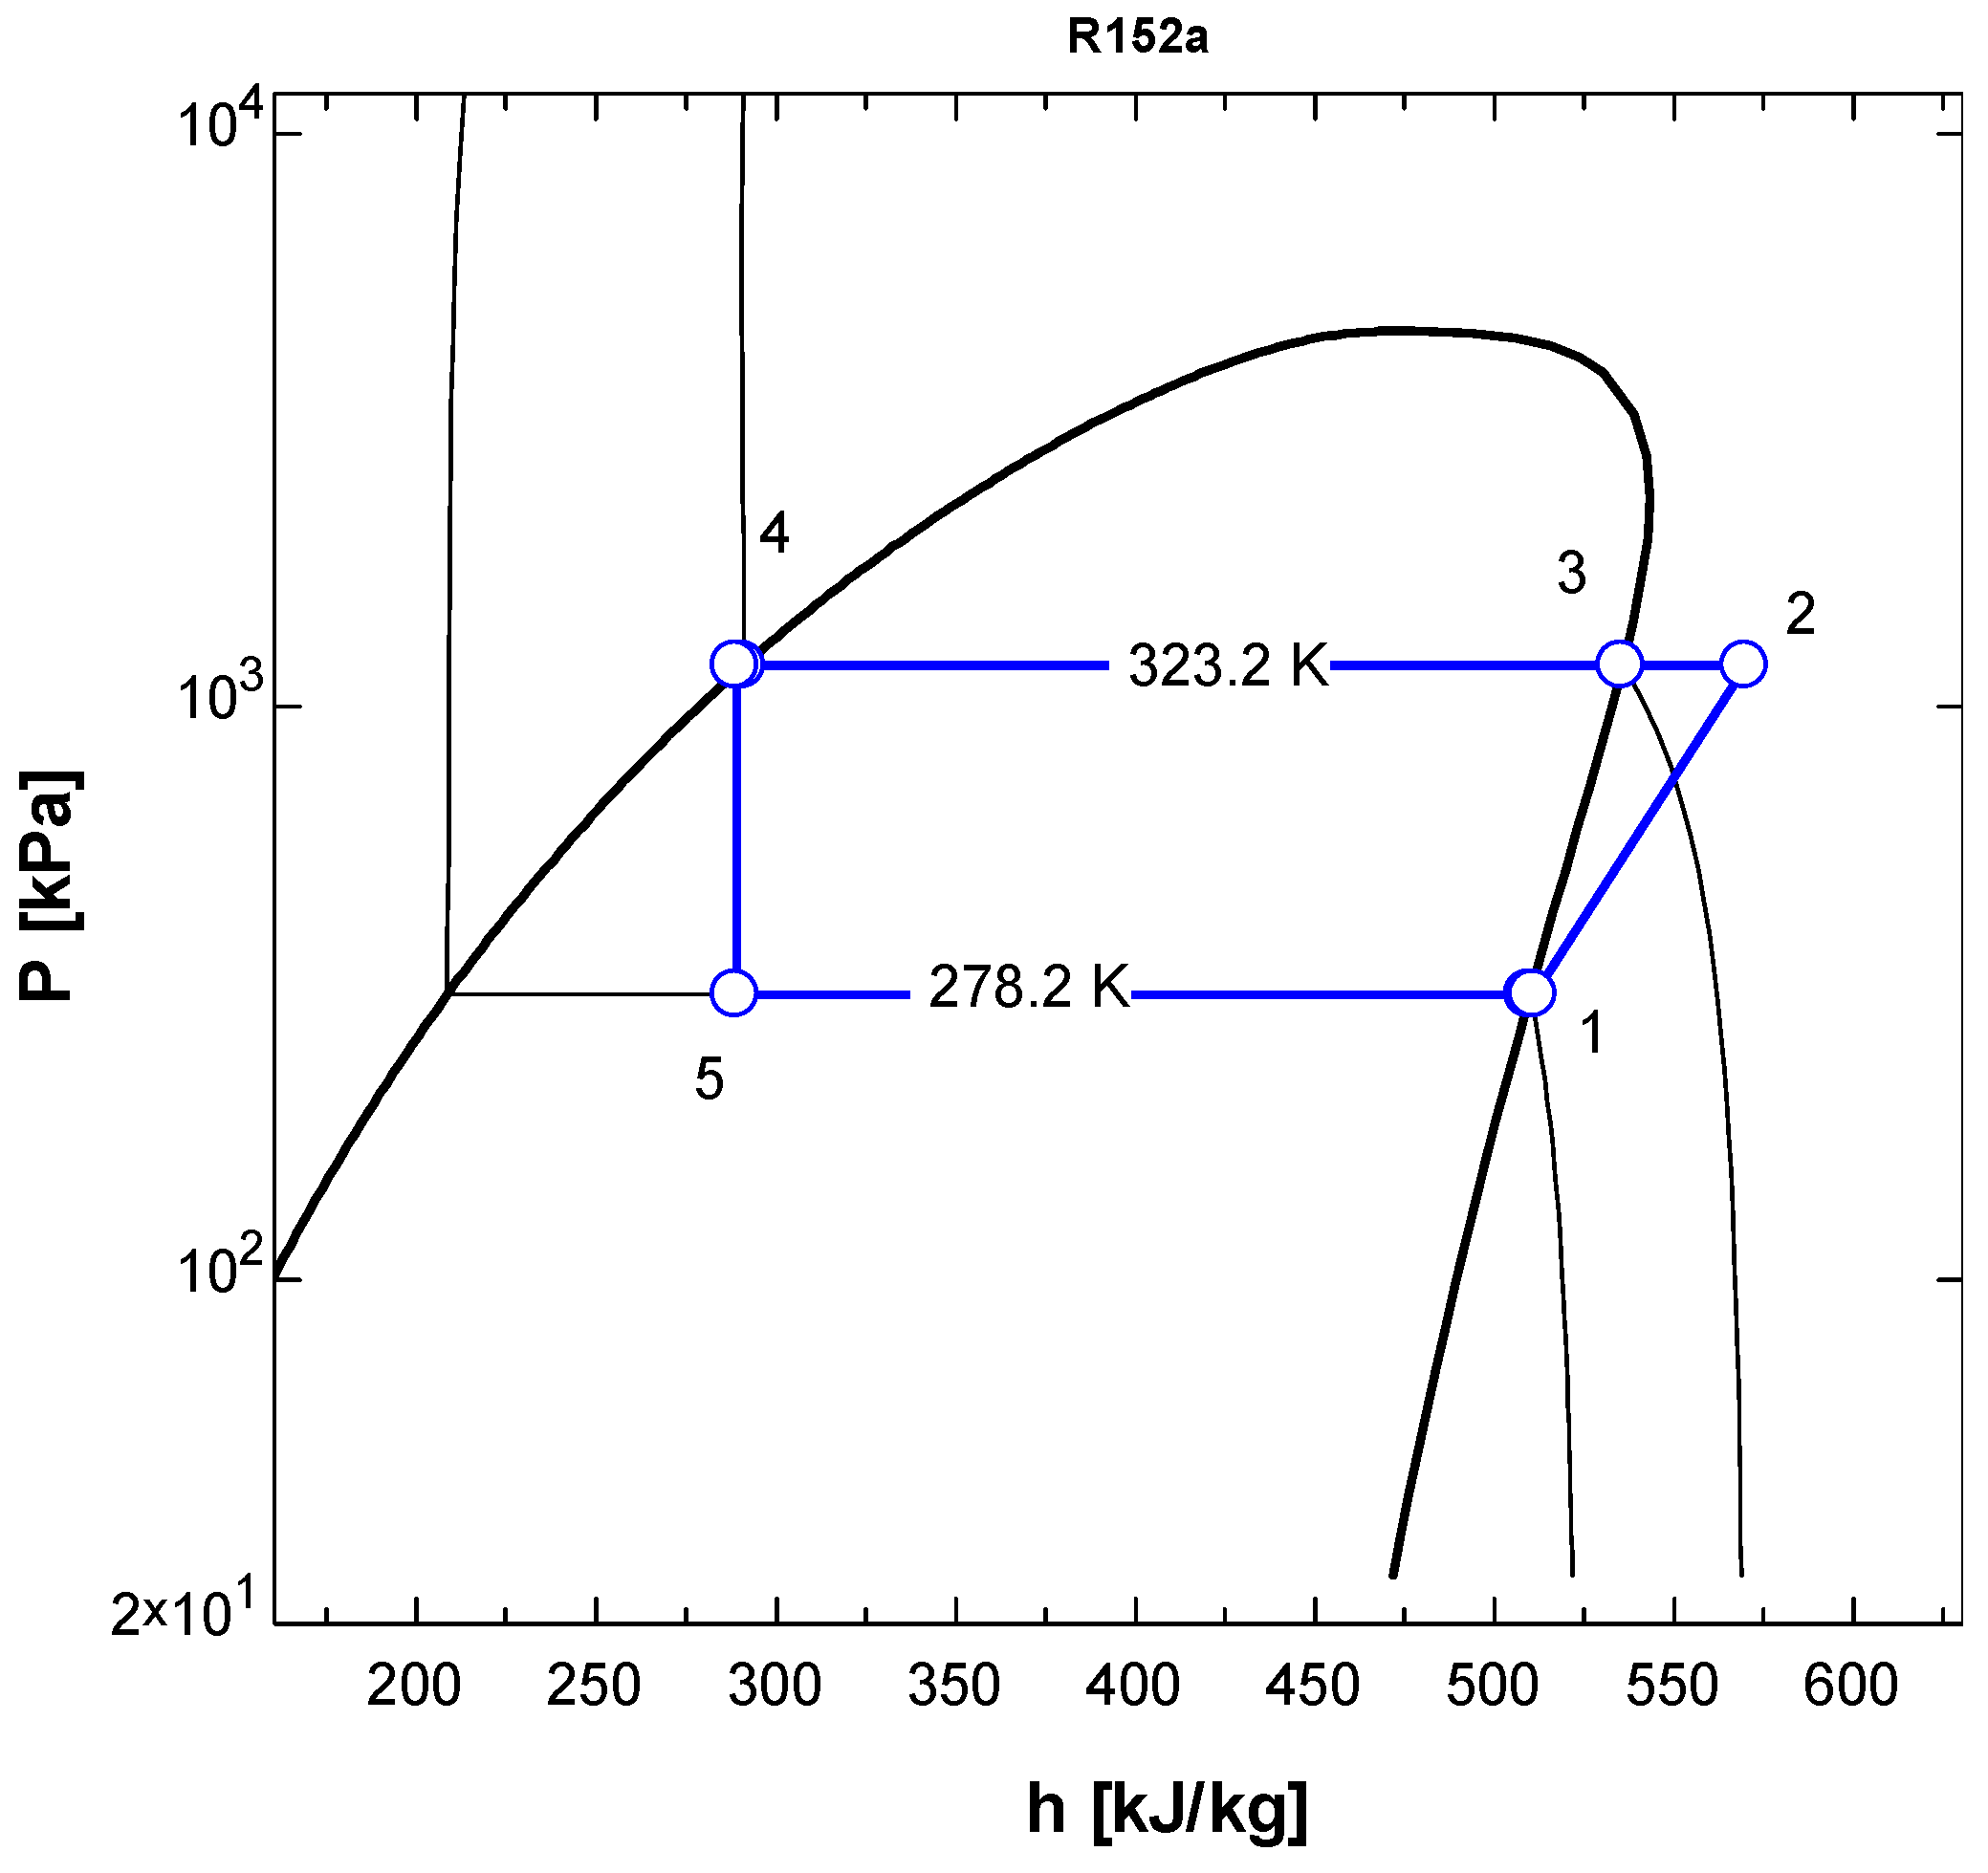
3.1. Comparison of Vapor Compression Refrigeration System (VCRS) with Different Refrigerants Using T-s and P-h Diagrams

The refrigerants used here were R134a, R152a, R1234yf, R290, R717, and R600a. The simulation was performed on EES software for all the refrigerants at different speeds of the compressor. The analysis was performed at fixed evaporator and condenser temperatures.
Here, we discuss the T-s and P-h diagrams of R134a and R152a in Figure 2, Figure 3, Figure 4 and Figure 5. Both refrigerants were studied at 1000 RPM. Both refrigerants were single-phase refrigerants because they evaporated and condensed at a constant value of temperature.
In the T-s diagram of R134a (Figure 2), the pressure at the condenser temperature was 1319 kPa, while the pressure was 349.9 kPa at the evaporator temperature. In the T-s diagram of R152a (Figure 4), the pressure at the condenser temperature was 1179 kPa, while at the evaporator temperature, the pressure was 1315.21 kPa. In both Figure 2 and Figure 4, it may be observed that the compression (1-2) is not isentropic as the line is not vertically straight but inclined to right indicating increase in entropy. When the superheated vapour comes out of the compressor at state 2, its temperature is higher than condensation temperature (temperature at state 3). In the condenser, initially temperature drops but once the phase change (condensation) starts, the temperature remains constant (process 3-4).
The P-h diagrams (Figure 3 and Figure 5) show the values of pressures and enthalpies at different stages of the cycle. The figures clearly show that the expansion process (state 4 to state 5) is isenthalpic process where the enthalpy remains constant (vertical line) while the entropy increases. The horizontal lines clearly explain that that condensation and evaporation processes are essentially isobaric processes.

3.2. Validation of EES Model

A comparison was made between the presented results and the already-published work of Kasni Sumeru et al. [9]. They presented a numerical analysis to estimate the performances of refrigerants R134a and R152a in automotive air-conditioning systems. They used CoolPack software to estimate the thermophysical properties of refrigerants and used these properties in calculations.
In Figure 6, Figure 7 and Figure 8, three parameters, i.e., COP, Discharge temperature, Cooling capacity, and, are compared with the published results. The input parameters of the presented model are the same compared with the ones reported in the literature. Figure 6 compares the COP of the present results with the numerical work of Sumeru et al. [9]. The comparison shows that there is close agreement between both results for R134a and 152a. For R134a, the maximum error in COP was 2.96%, which took place at 3000 rpm, while the maximum error in COP for R152a was 5.56% at 1000 rpm.
Figure 7 shows the comparison of discharge temperature vs. compressor speed. In Figure 7, the discharge temperature for refrigerant R134 showed a maximum error of 2.57%, which took place at 3000 rpm, while the maximum error for R152a was 4.10% at 3000 rpm. In Figure 8, the cooling capacity showed a maximum error for refrigerant R134a at 2.73% that took place at 2000 rpm, while for refrigerant R152a, the maximum error was 6.4%, which took place at 1000 rpm. The error may be due to the thermo-physical properties of CoolPack and EES software or due to the computational accuracy of these two software programs. It was estimated that there is close agreement between the present and already-published results. Hence, the current EES model was validated, and we could use it for further analysis of different refrigerants.

3.3. Performance Parameters

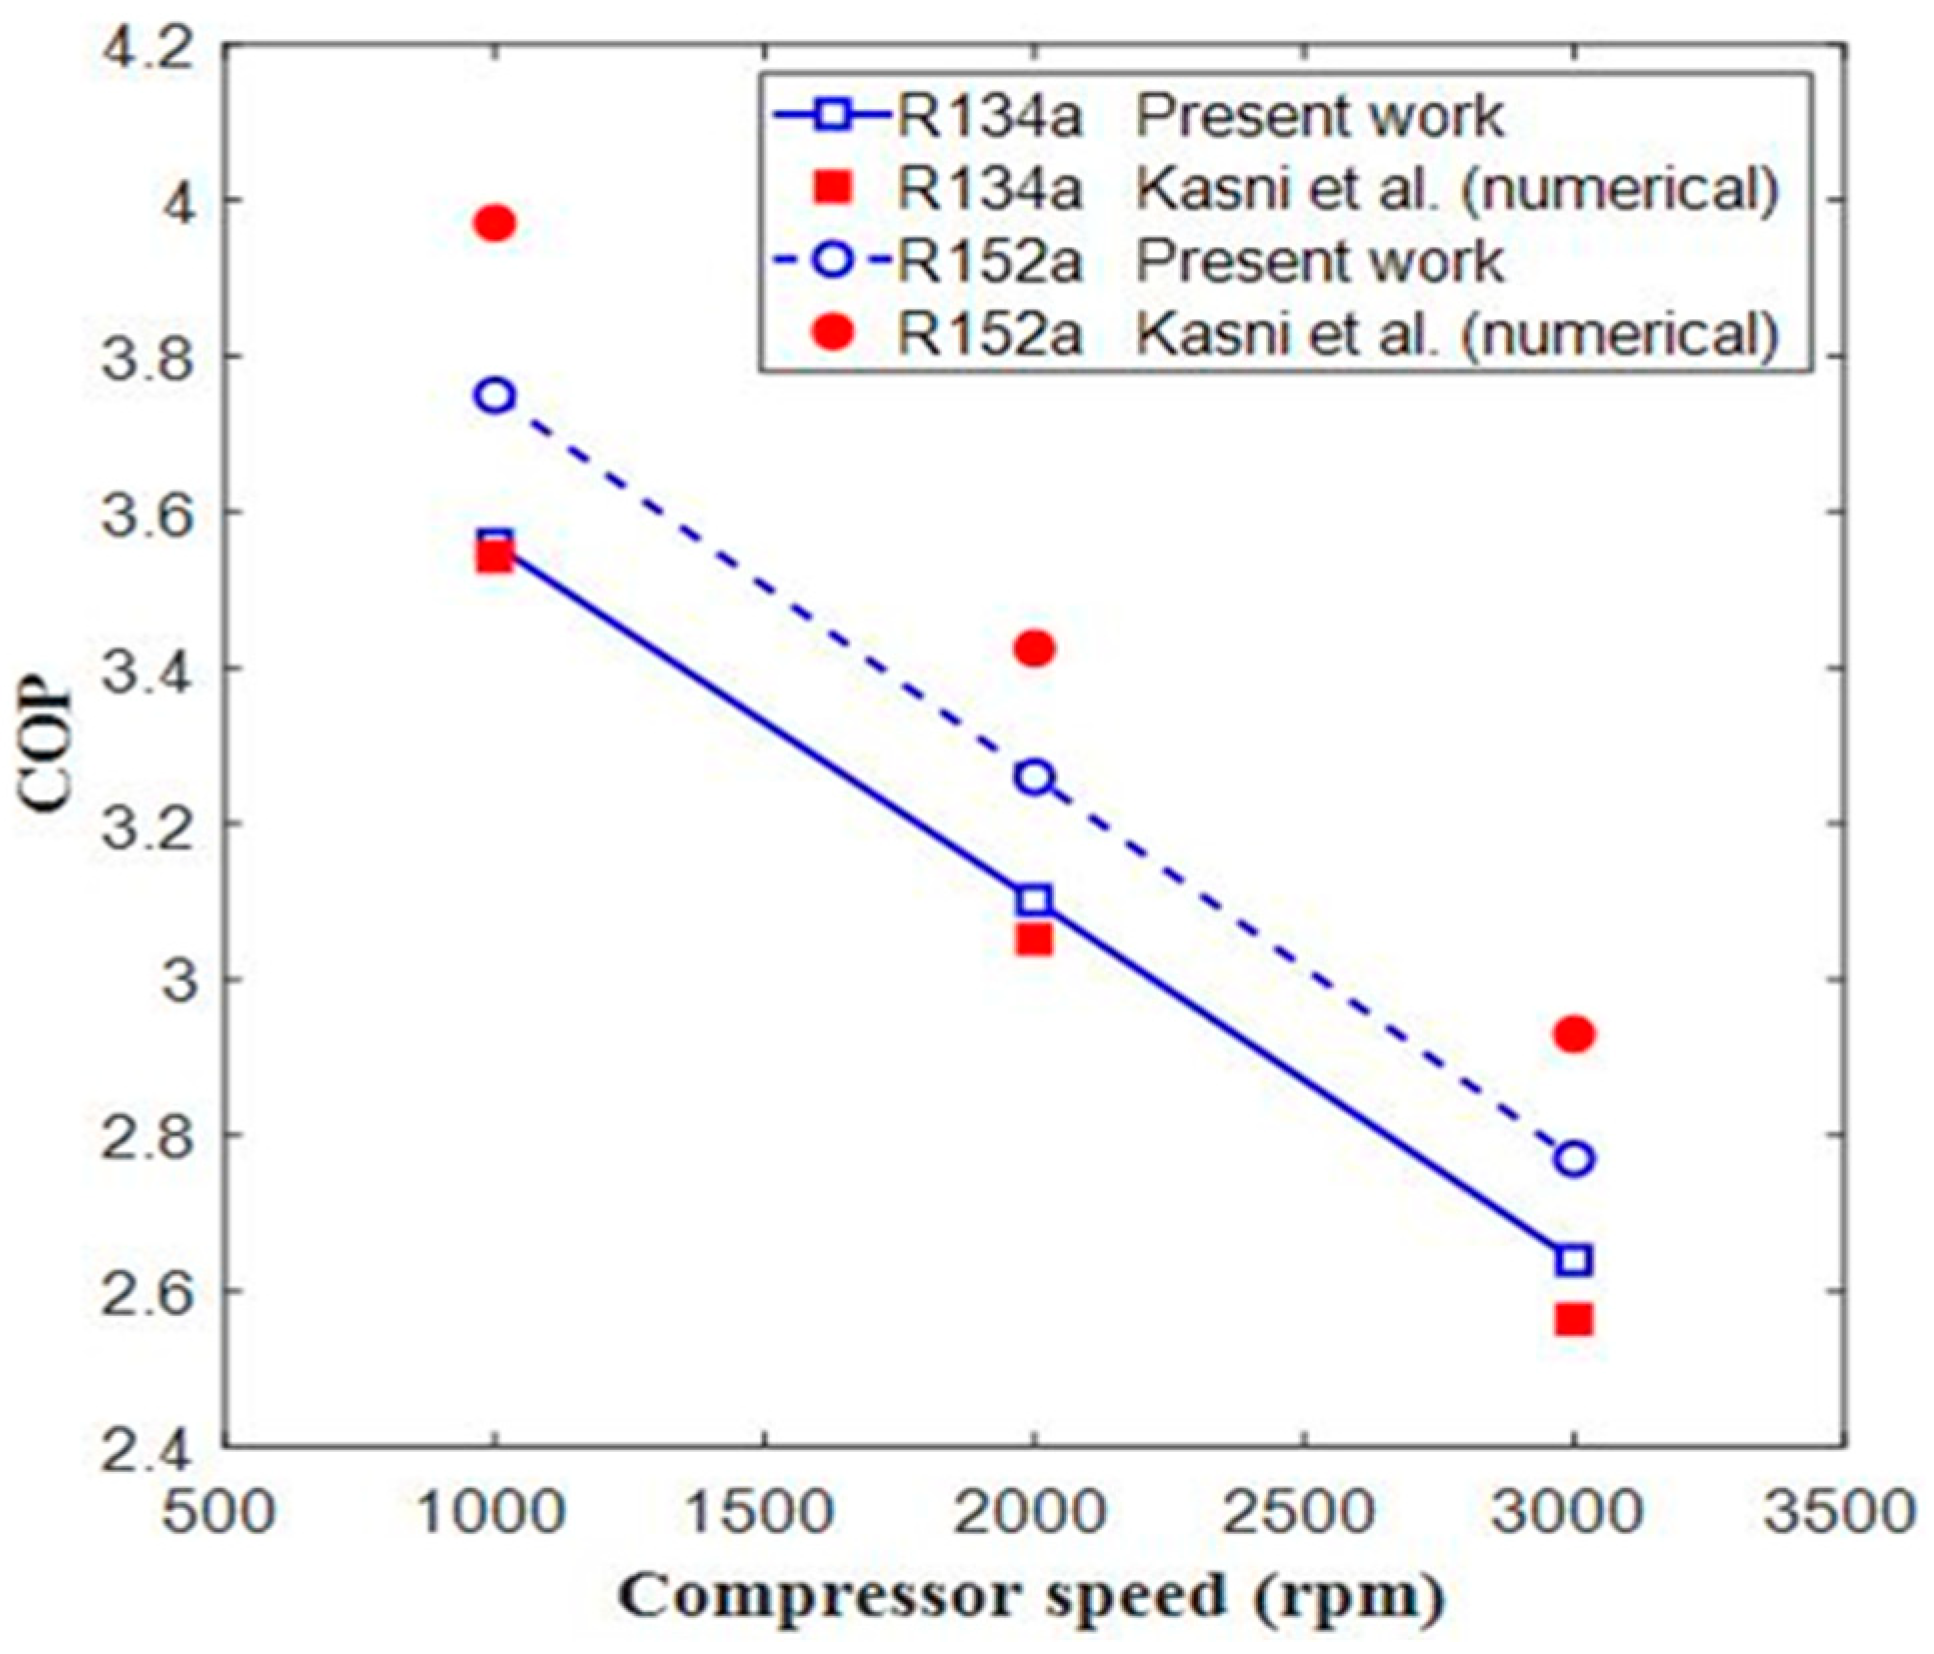
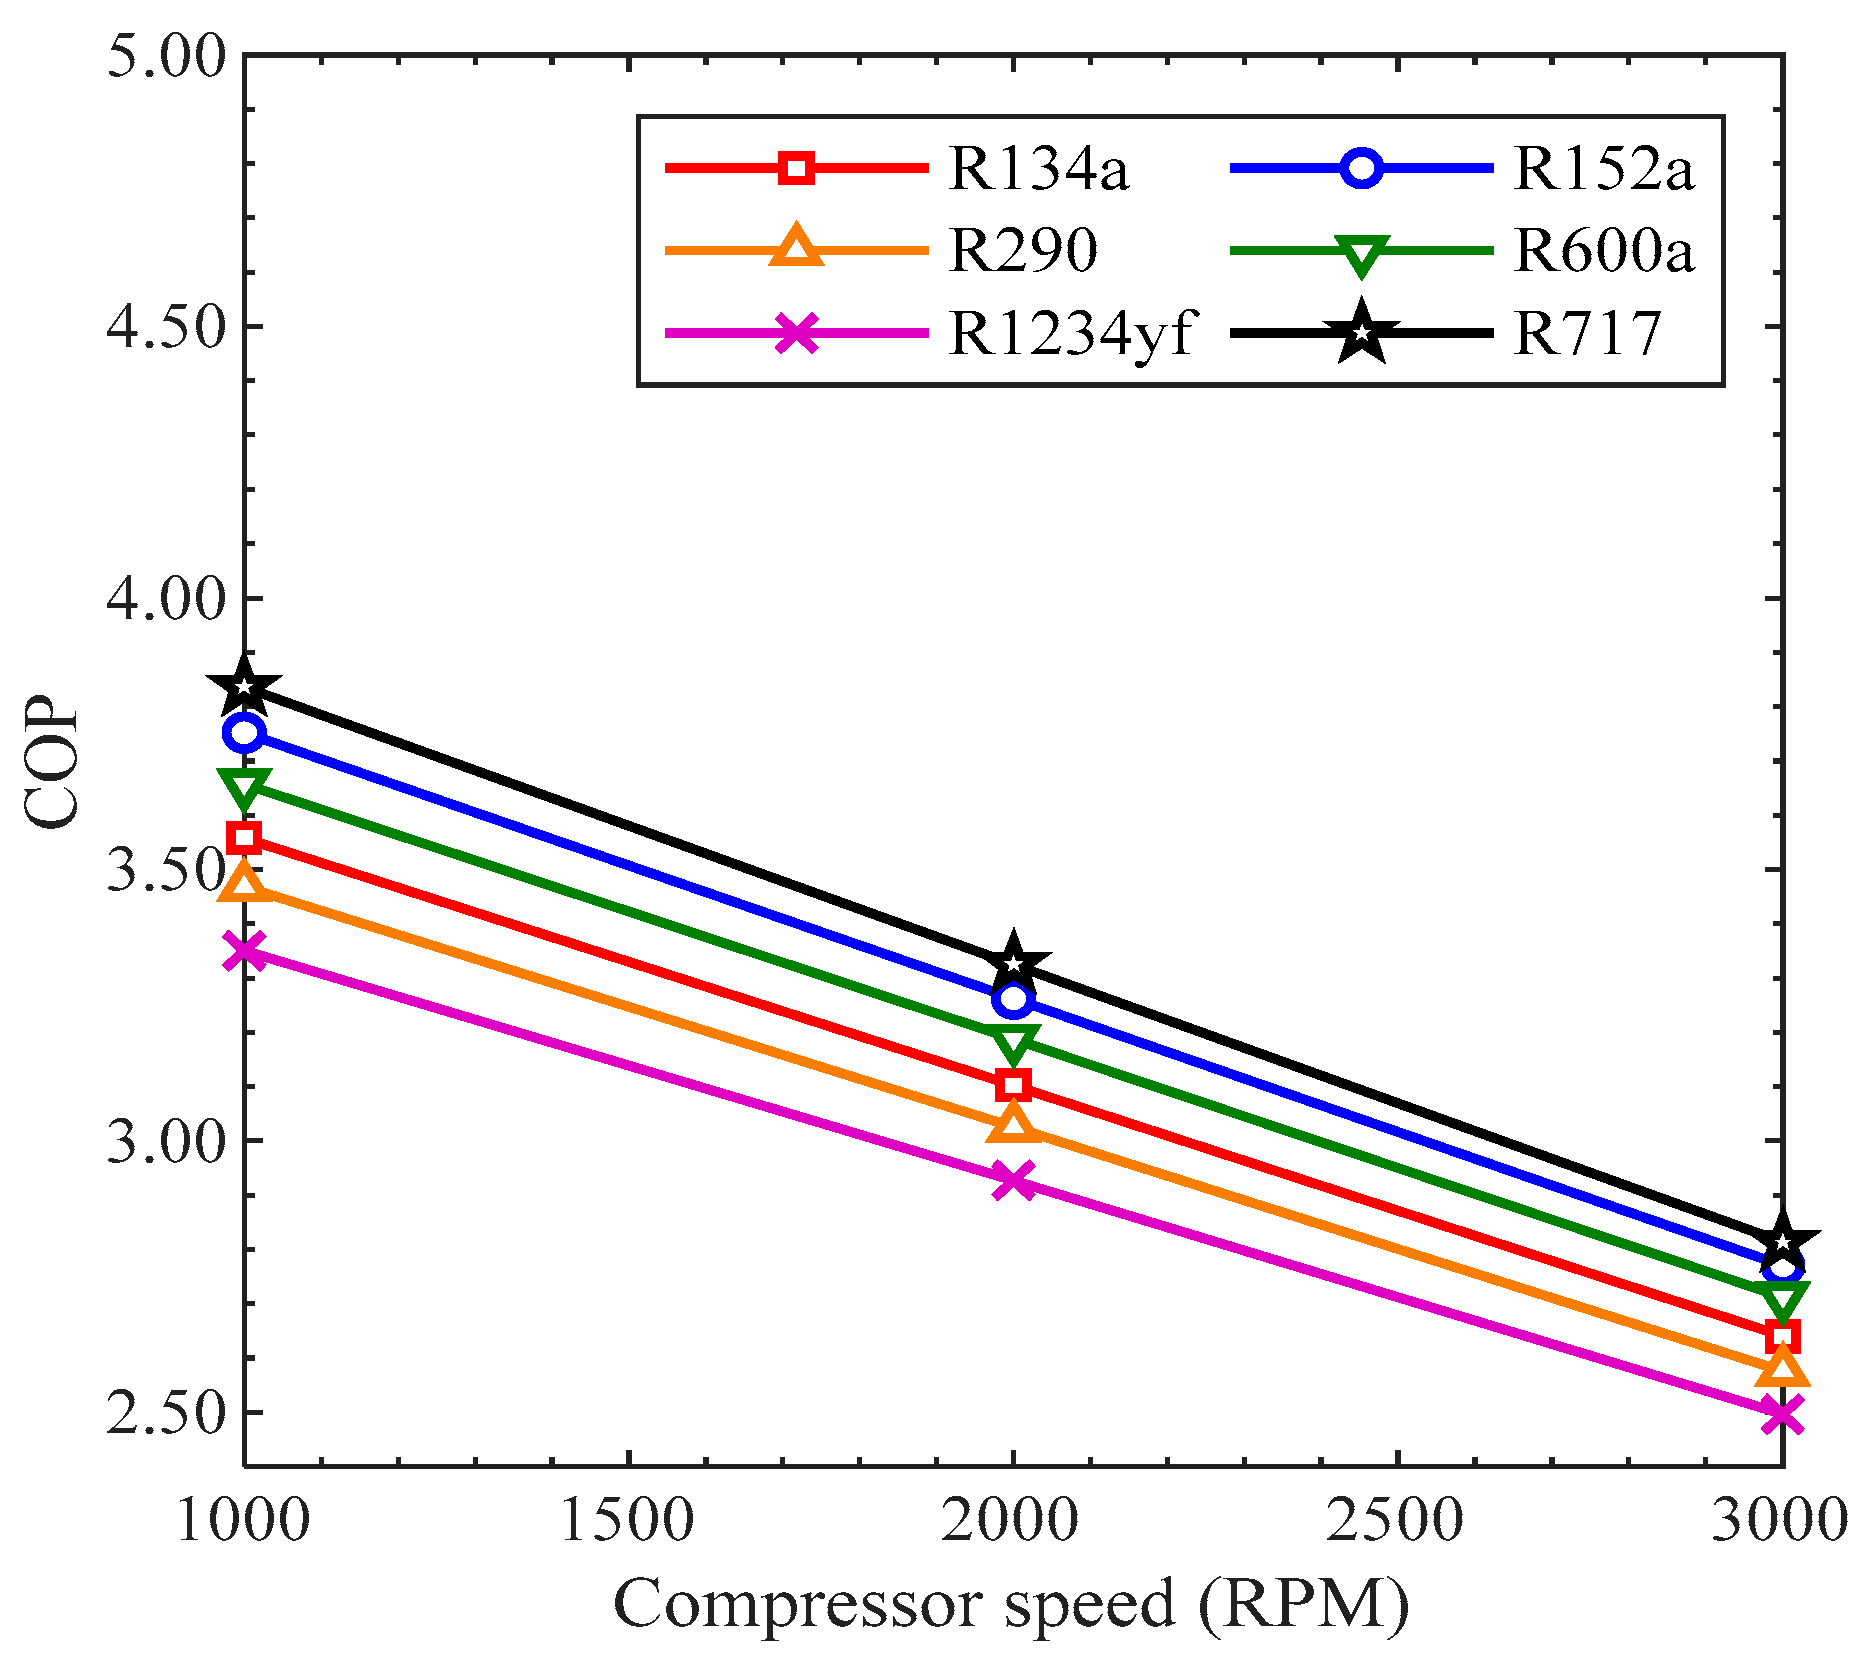
3.3.1. Coefficient of Performance

The ratio of the refrigeration effect to the input power of the compressor is called the coefficient of performance. In Figure 9, the COP presents the performance in the AACS. The quantity of cooling produced in the evaporator is the refrigeration effect, or cooling capacity. In Figure 9, the COP is studied based on compressor speed (RPM). In all the refrigerants, the COP decreased with the increase in compressor speed from 1000 RPM to 3000 RPM. When the compressor speed rises, both of cooling capacity in the evaporator and the input power of the compressor increase. However, the amount of input power of the compressor rises more than the cooling capacity, resulting in a decrease in the coefficient of performance. The COP values of all the refrigerants depreciated in the same trend with the rise in compressor speed. The COP values of R290 and R1234yf were smaller than that of R134a, while the COP values of R600a, R152a, and R717 were greater than that of R134a at all the compressor speeds. Among all the refrigerants, the COP of R1234yf was the smallest, while the COP of R717 was the highest.

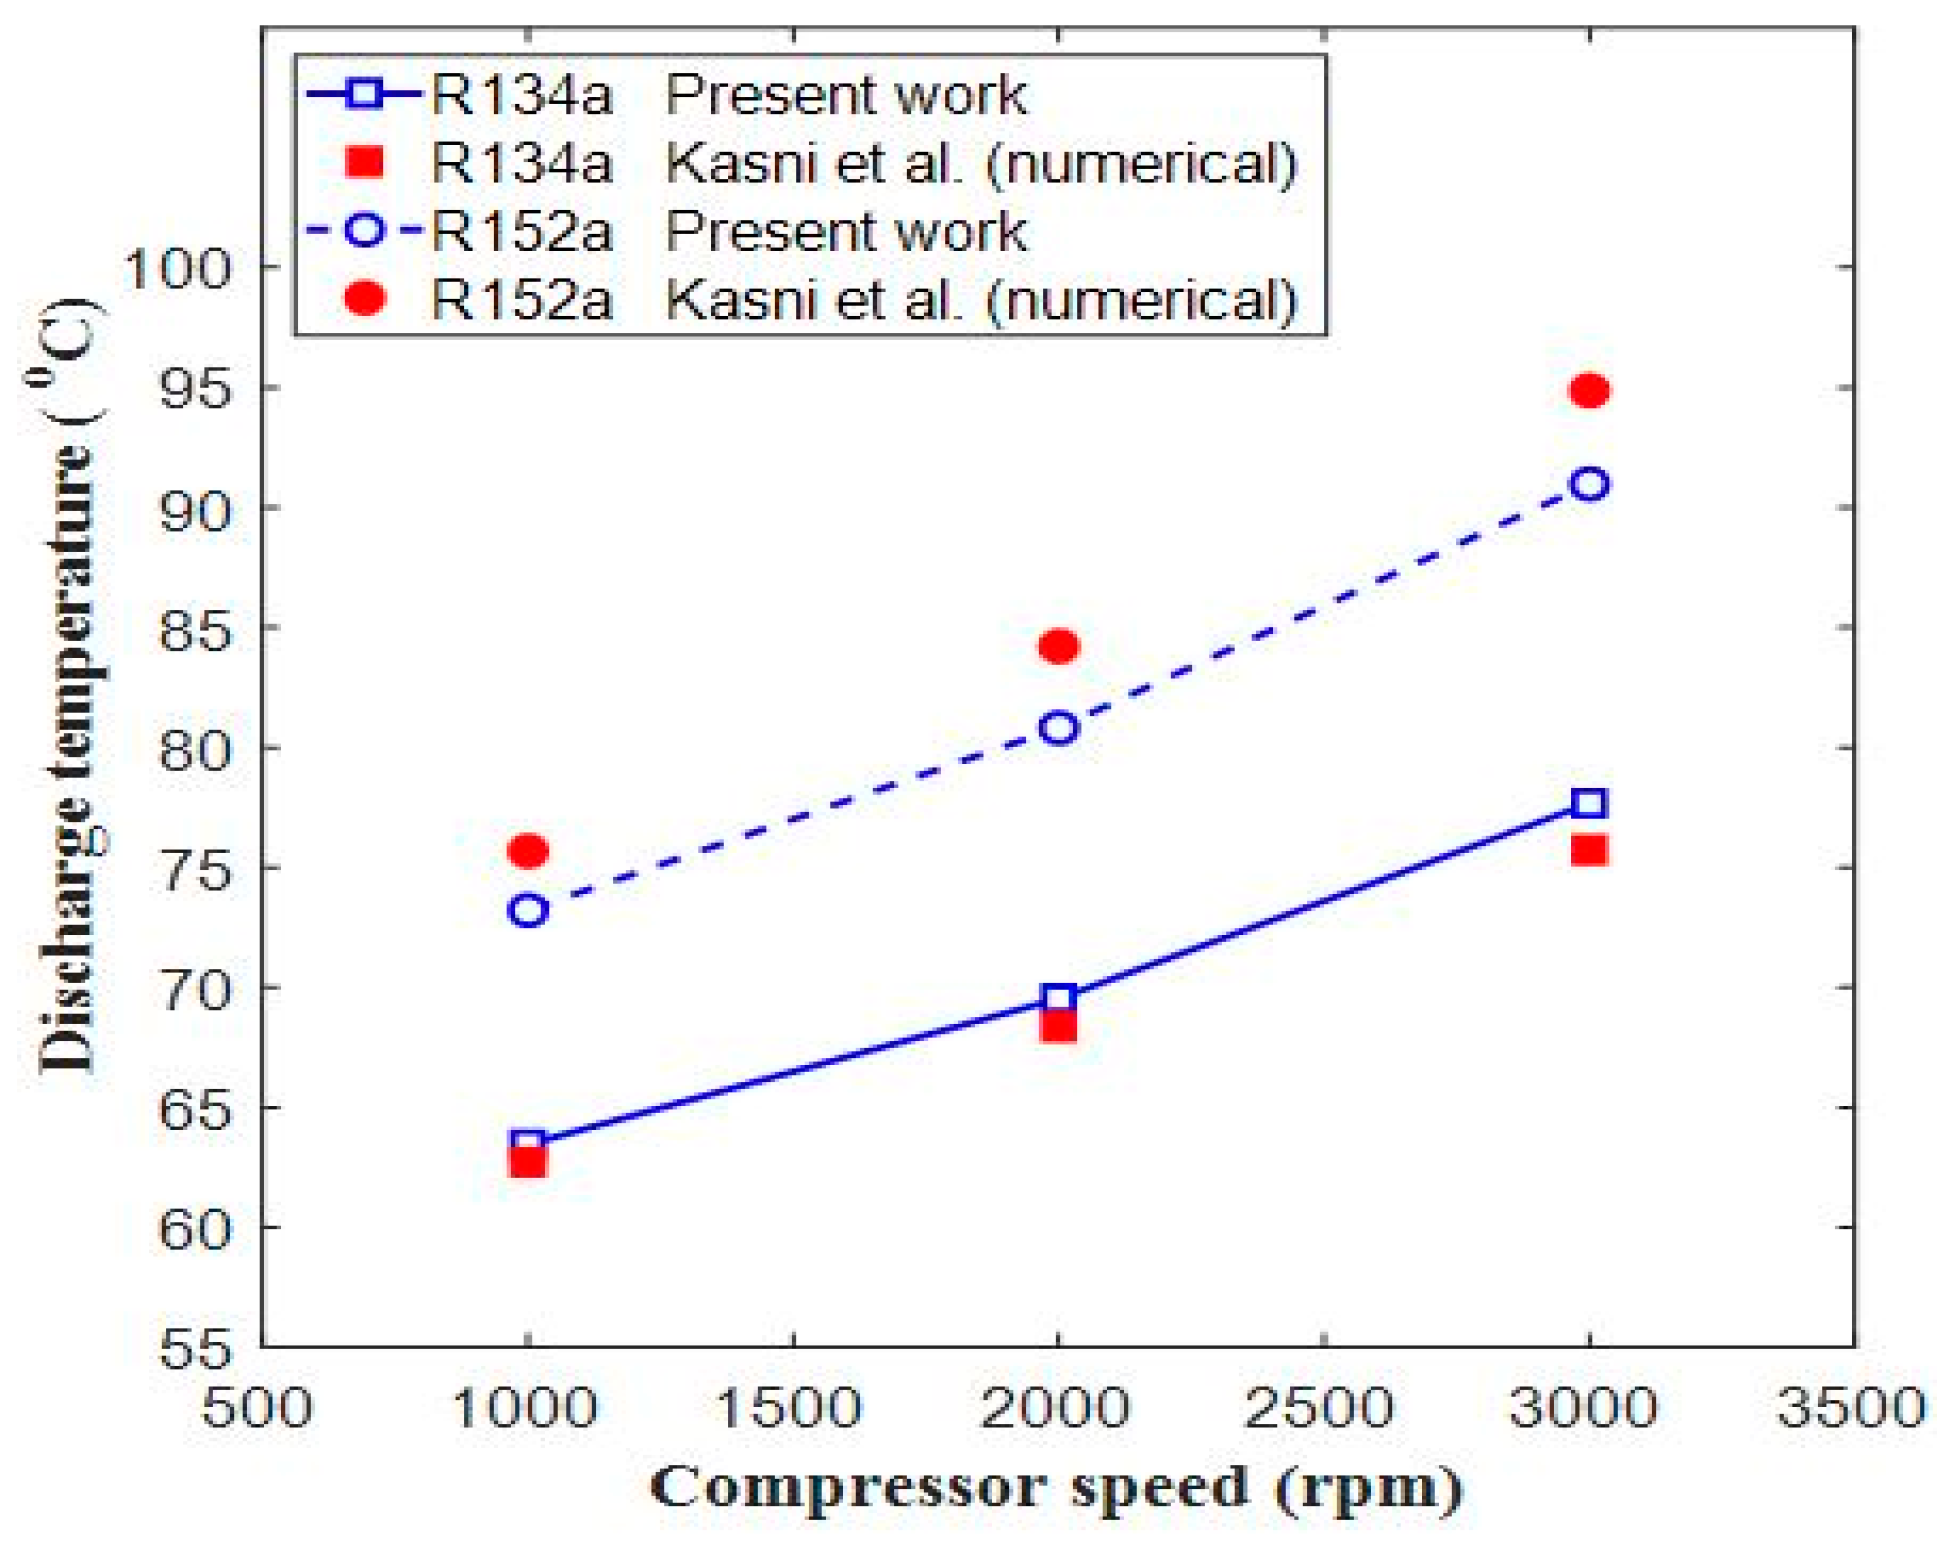
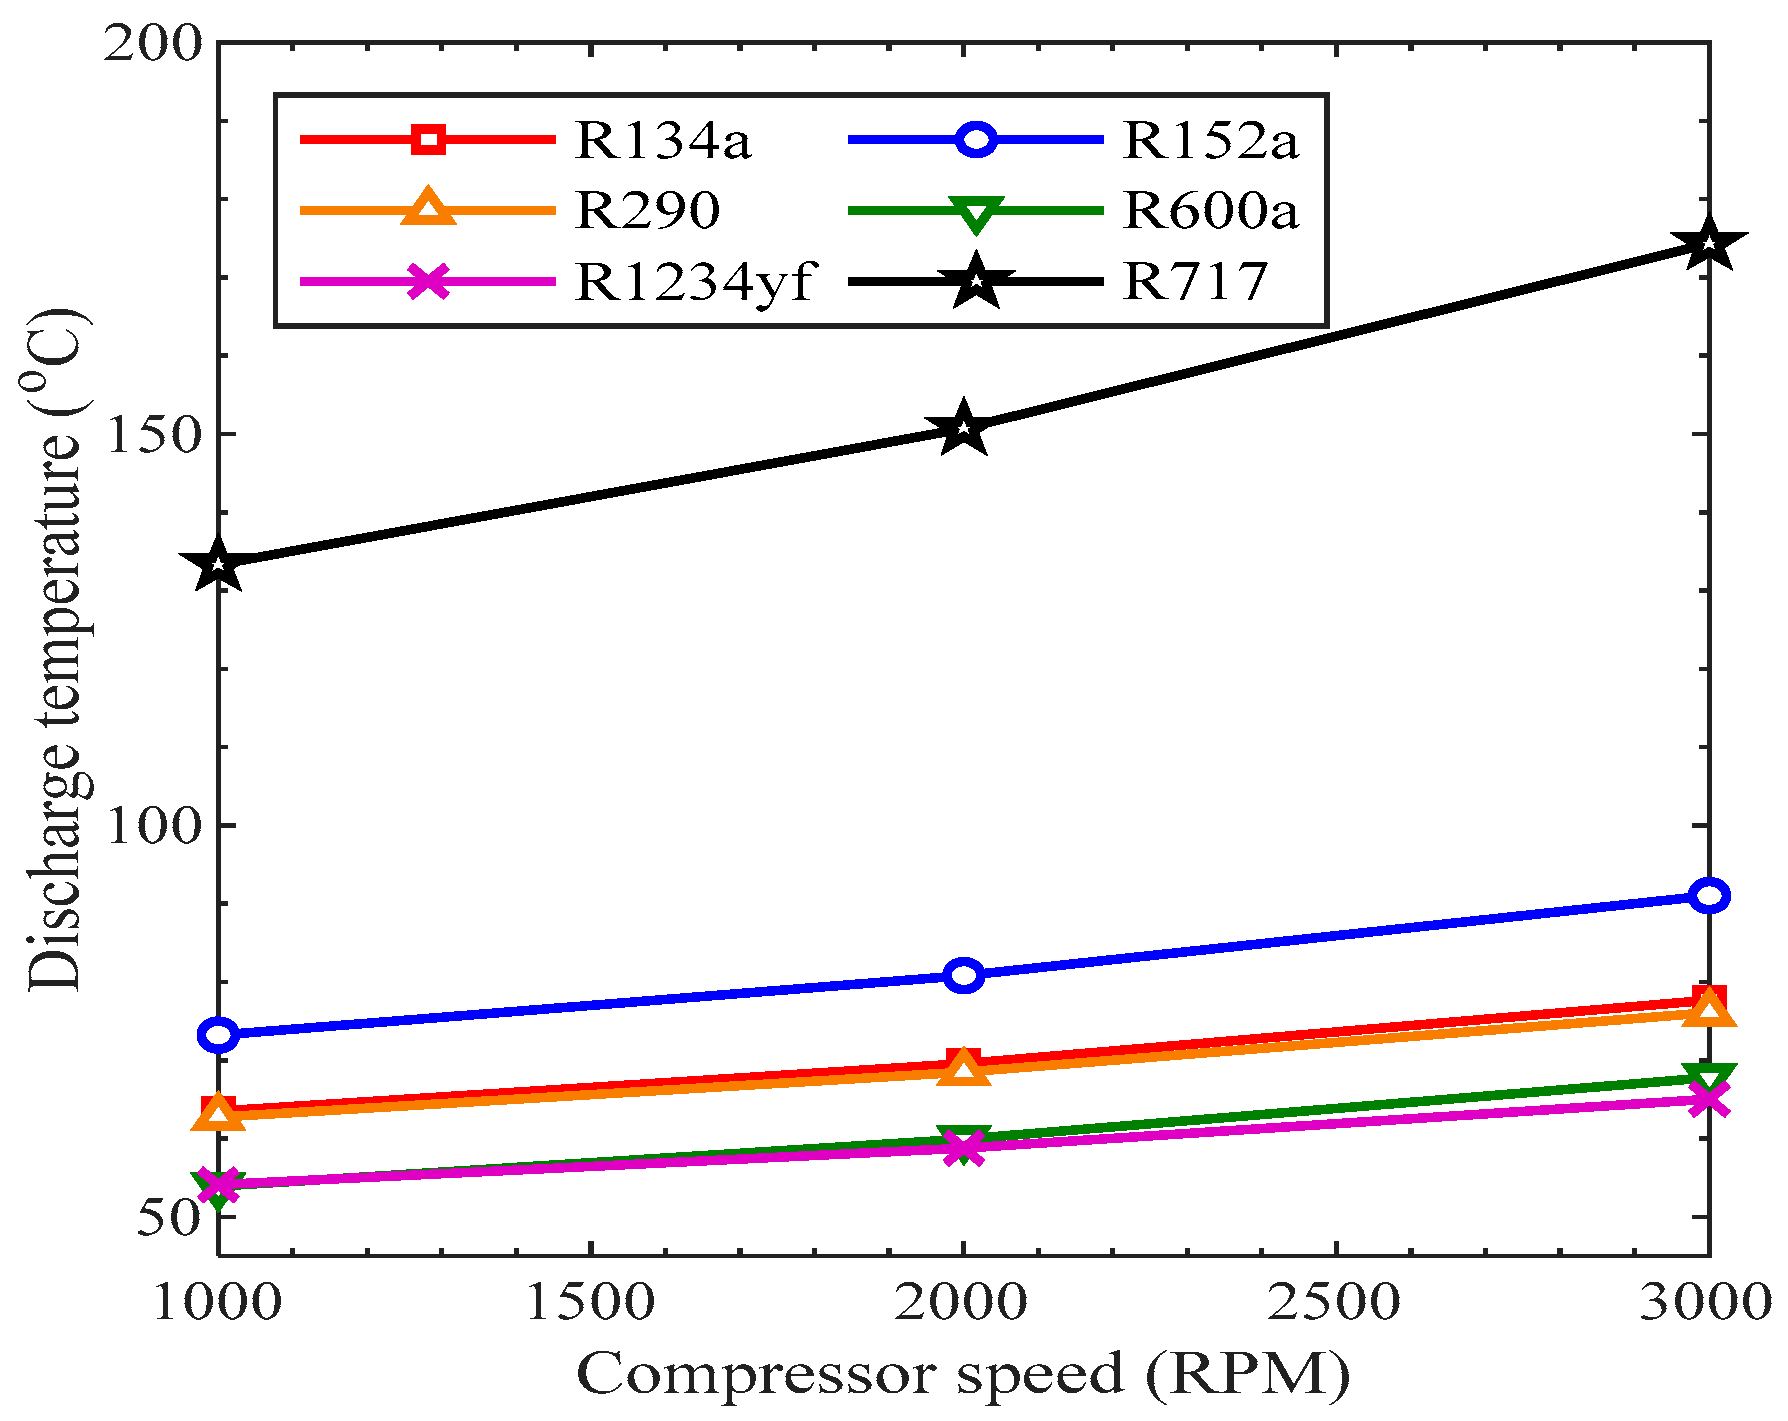
3.3.2. Discharge Temperature

The temperature of the refrigerant at the outlet of the compressor is known as the discharge temperature. The performance of a working refrigerant may be predicted by this parameter, but the performance of an AACS is not directly relevant to this parameter. Figure 10 shows the variation of discharge temperature with the compressor speed for various working fluids. As shown, for all the considered refrigerants, the rise in compressor speed led to an increase in discharge temperature.
The refrigerant R717 showed the highest value of discharge temperature, while R1234yf showed the smallest discharge temperature value from 1000 rpm to 3000 rpm. The discharge temperatures of R134a and R290 had almost similar values at each speed of the compressor. The discharge temperatures of R717a and R152a were higher than that of R134a, while it was smaller than R134a for all the other refrigerants. A high discharge temperature is undesirable because it creates trouble by overheating the compressor, which can produce wear in the cylinder of the compressor and piston rings. It may also deteriorate the lubricant, which may decrease the reliability of the compressor.

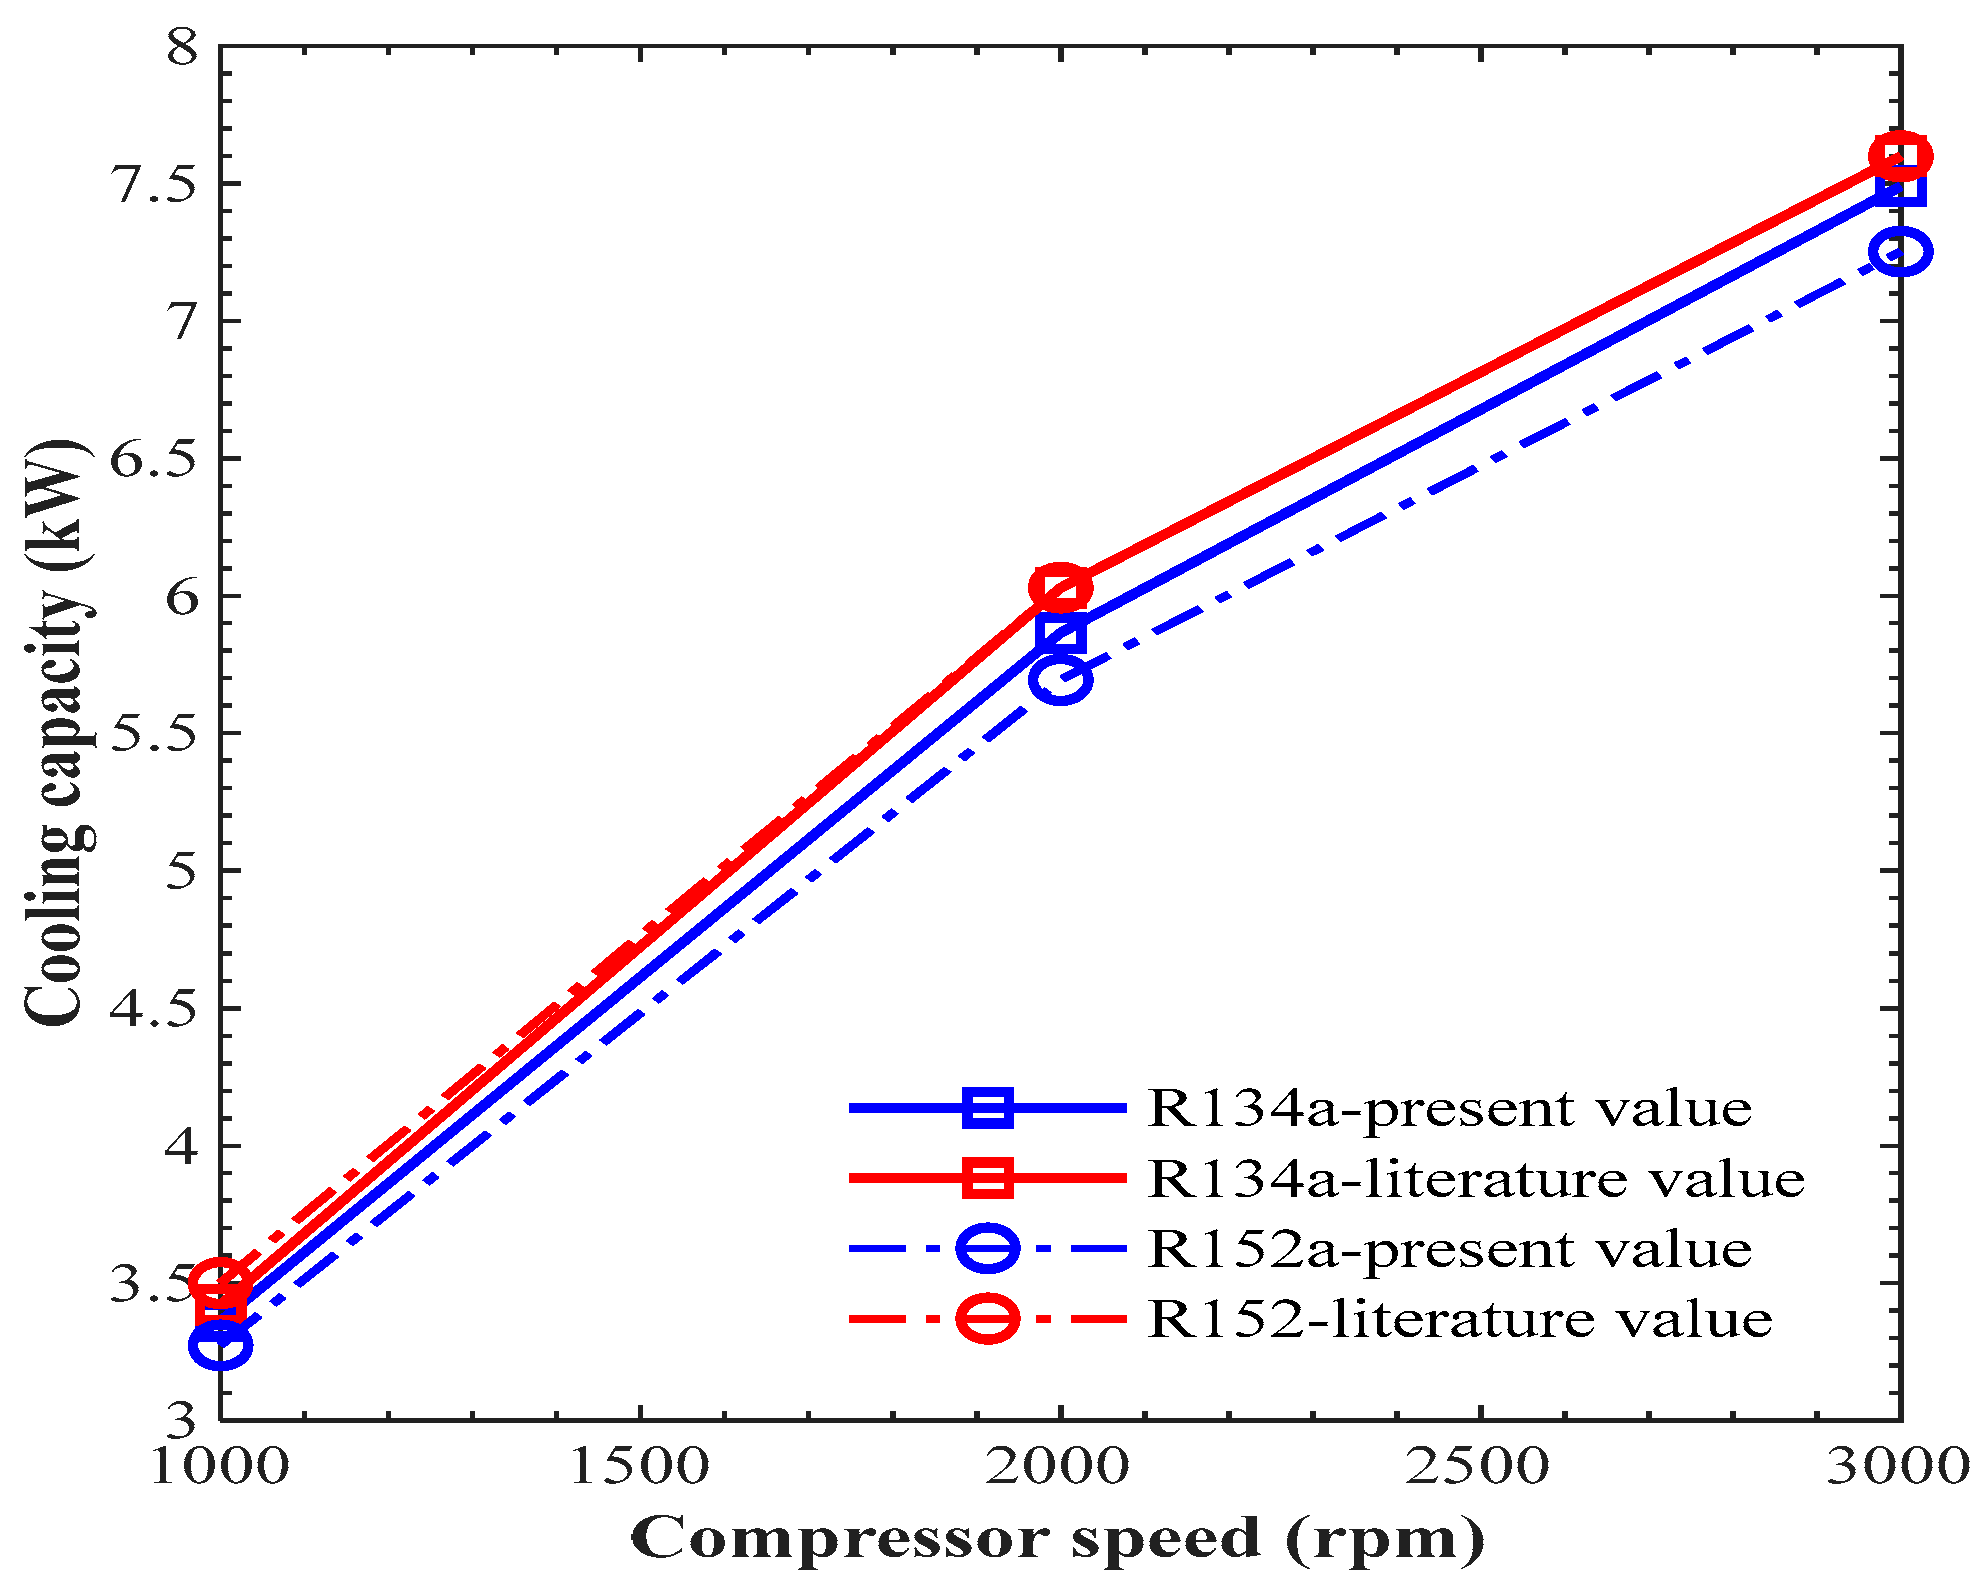
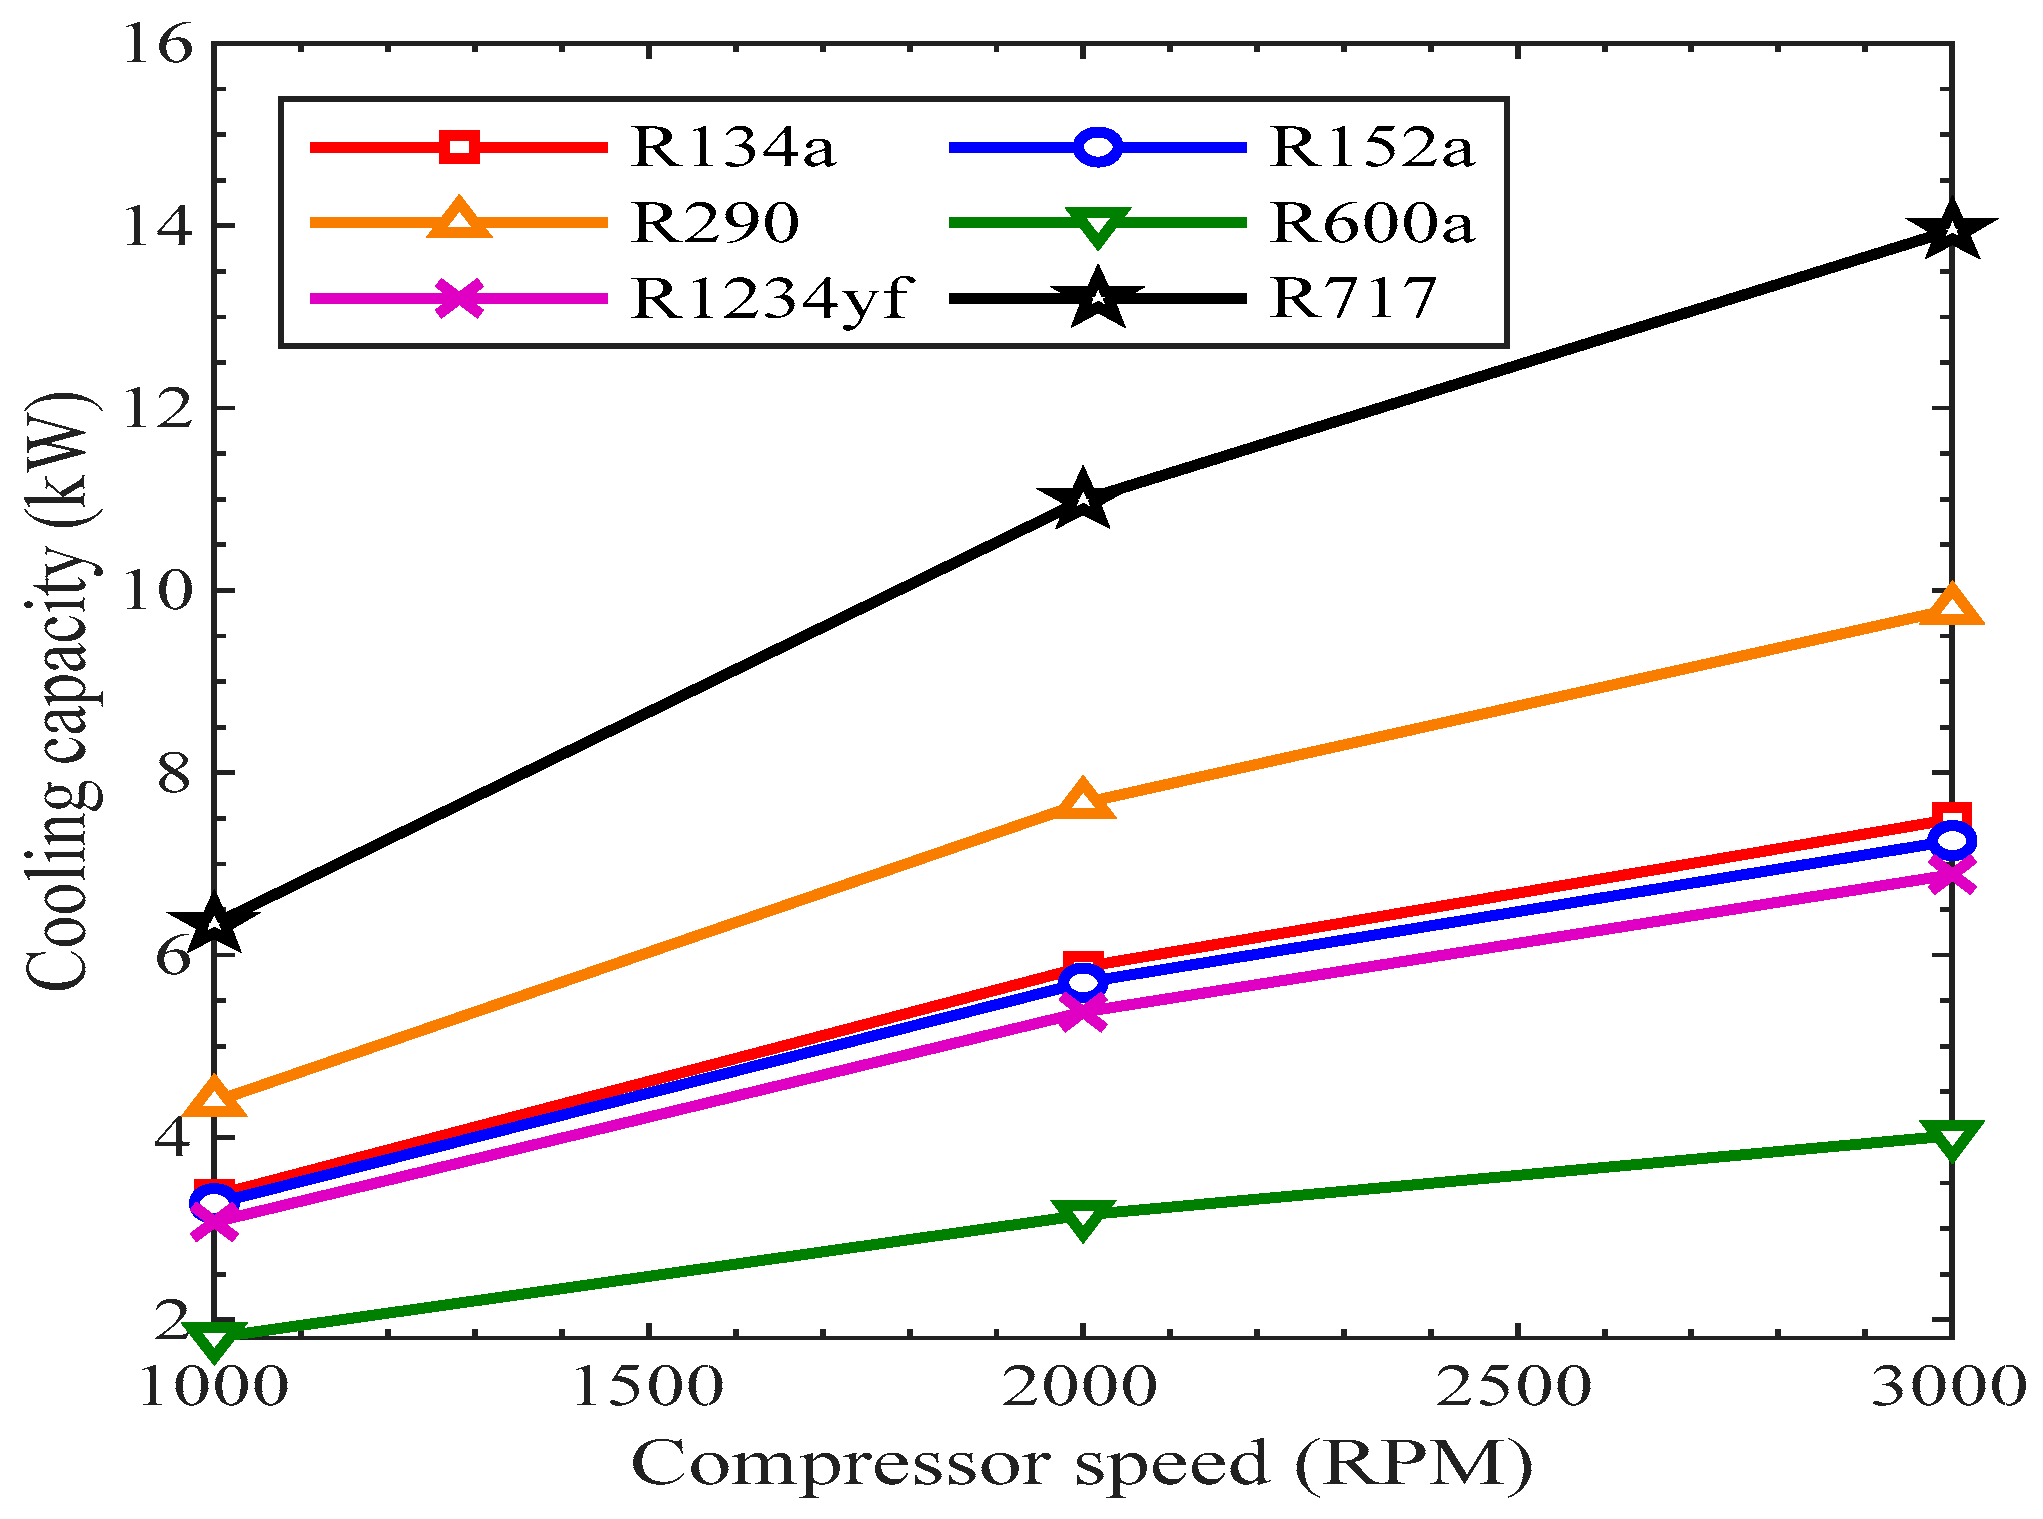
3.3.3. Cooling Capacity

The amount of cooling generated in the evaporator is called the cooling capacity. In Figure 11, the variation of cooling capacity with the compressor speed is shown. The cooling capacity of each refrigerant is represented by lines of different colors. In all of the trend lines, the refrigerants’ cooling capacities increased with the rise in the speed of the compressor from 1000 to 3000 RPM. The mass flow rate of the refrigerants increased with the increase in compressor speed, which presents the reason for an increase in the cooling effect in the evaporator. This is why the cooling capacity of the evaporator rose with the rise in compressor speed for all the refrigerants. All the refrigerants showed a similar increasing trend with the rise in compressor speed. The refrigeration effects of R134, R152a, and R1234yf were closely related to each other at different speeds of the compressor. The cooling capacity of R600a was the smallest, while R717 was the highest among all the refrigerants.

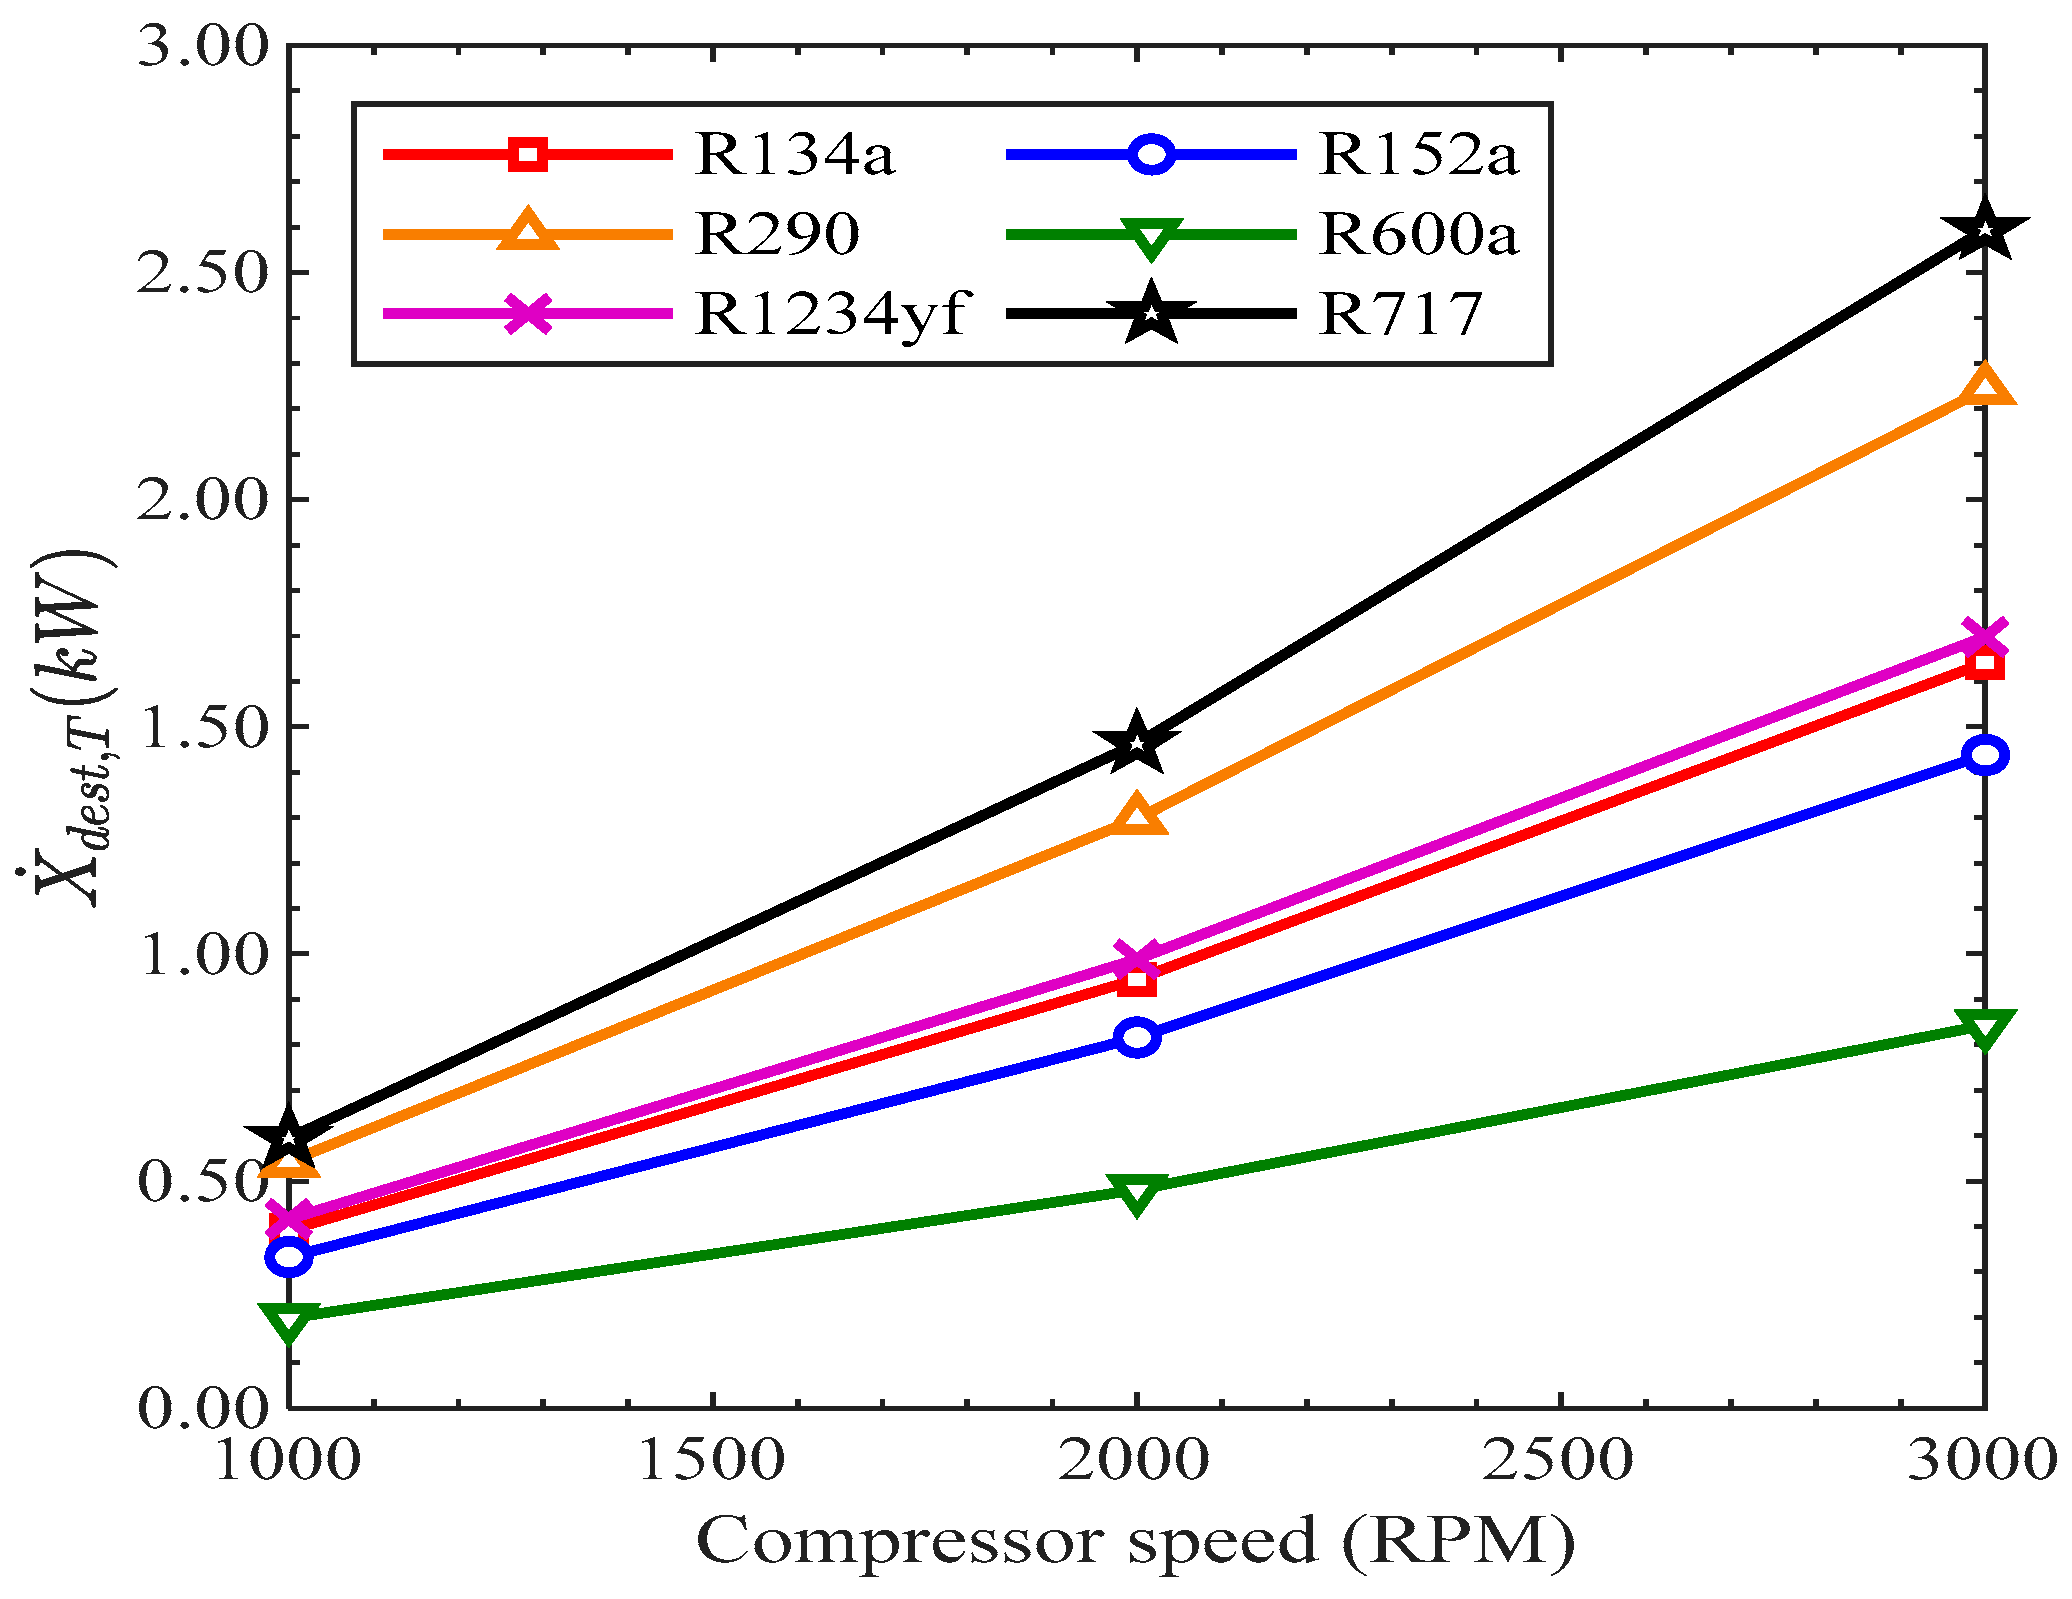
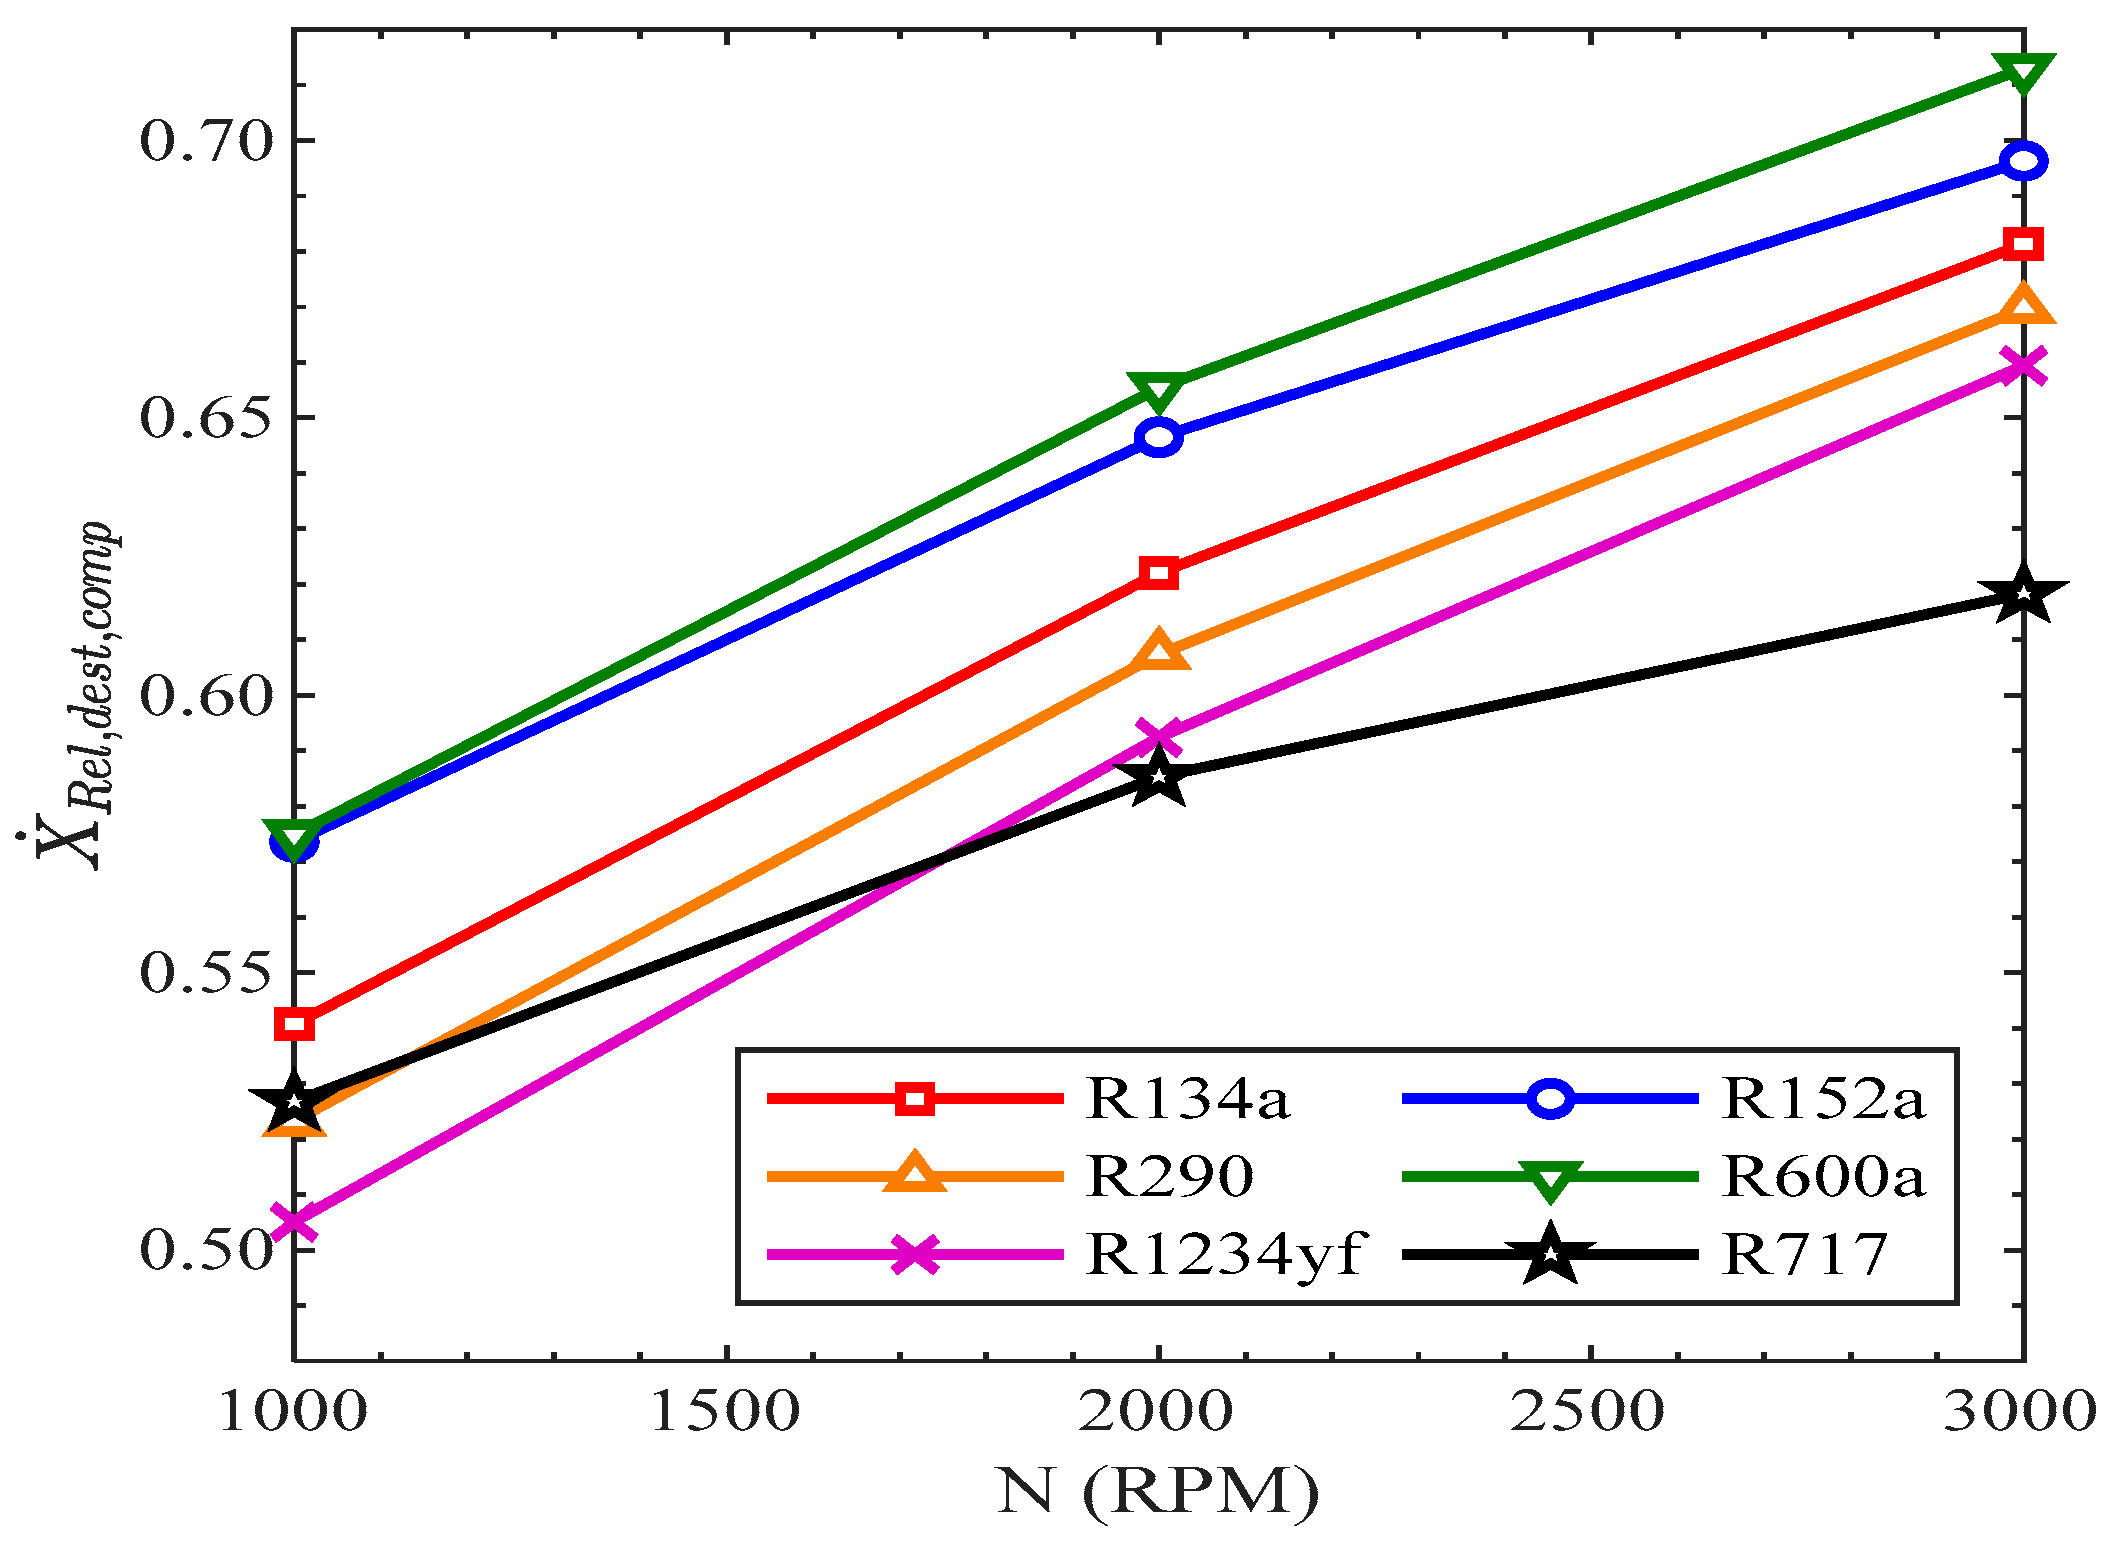
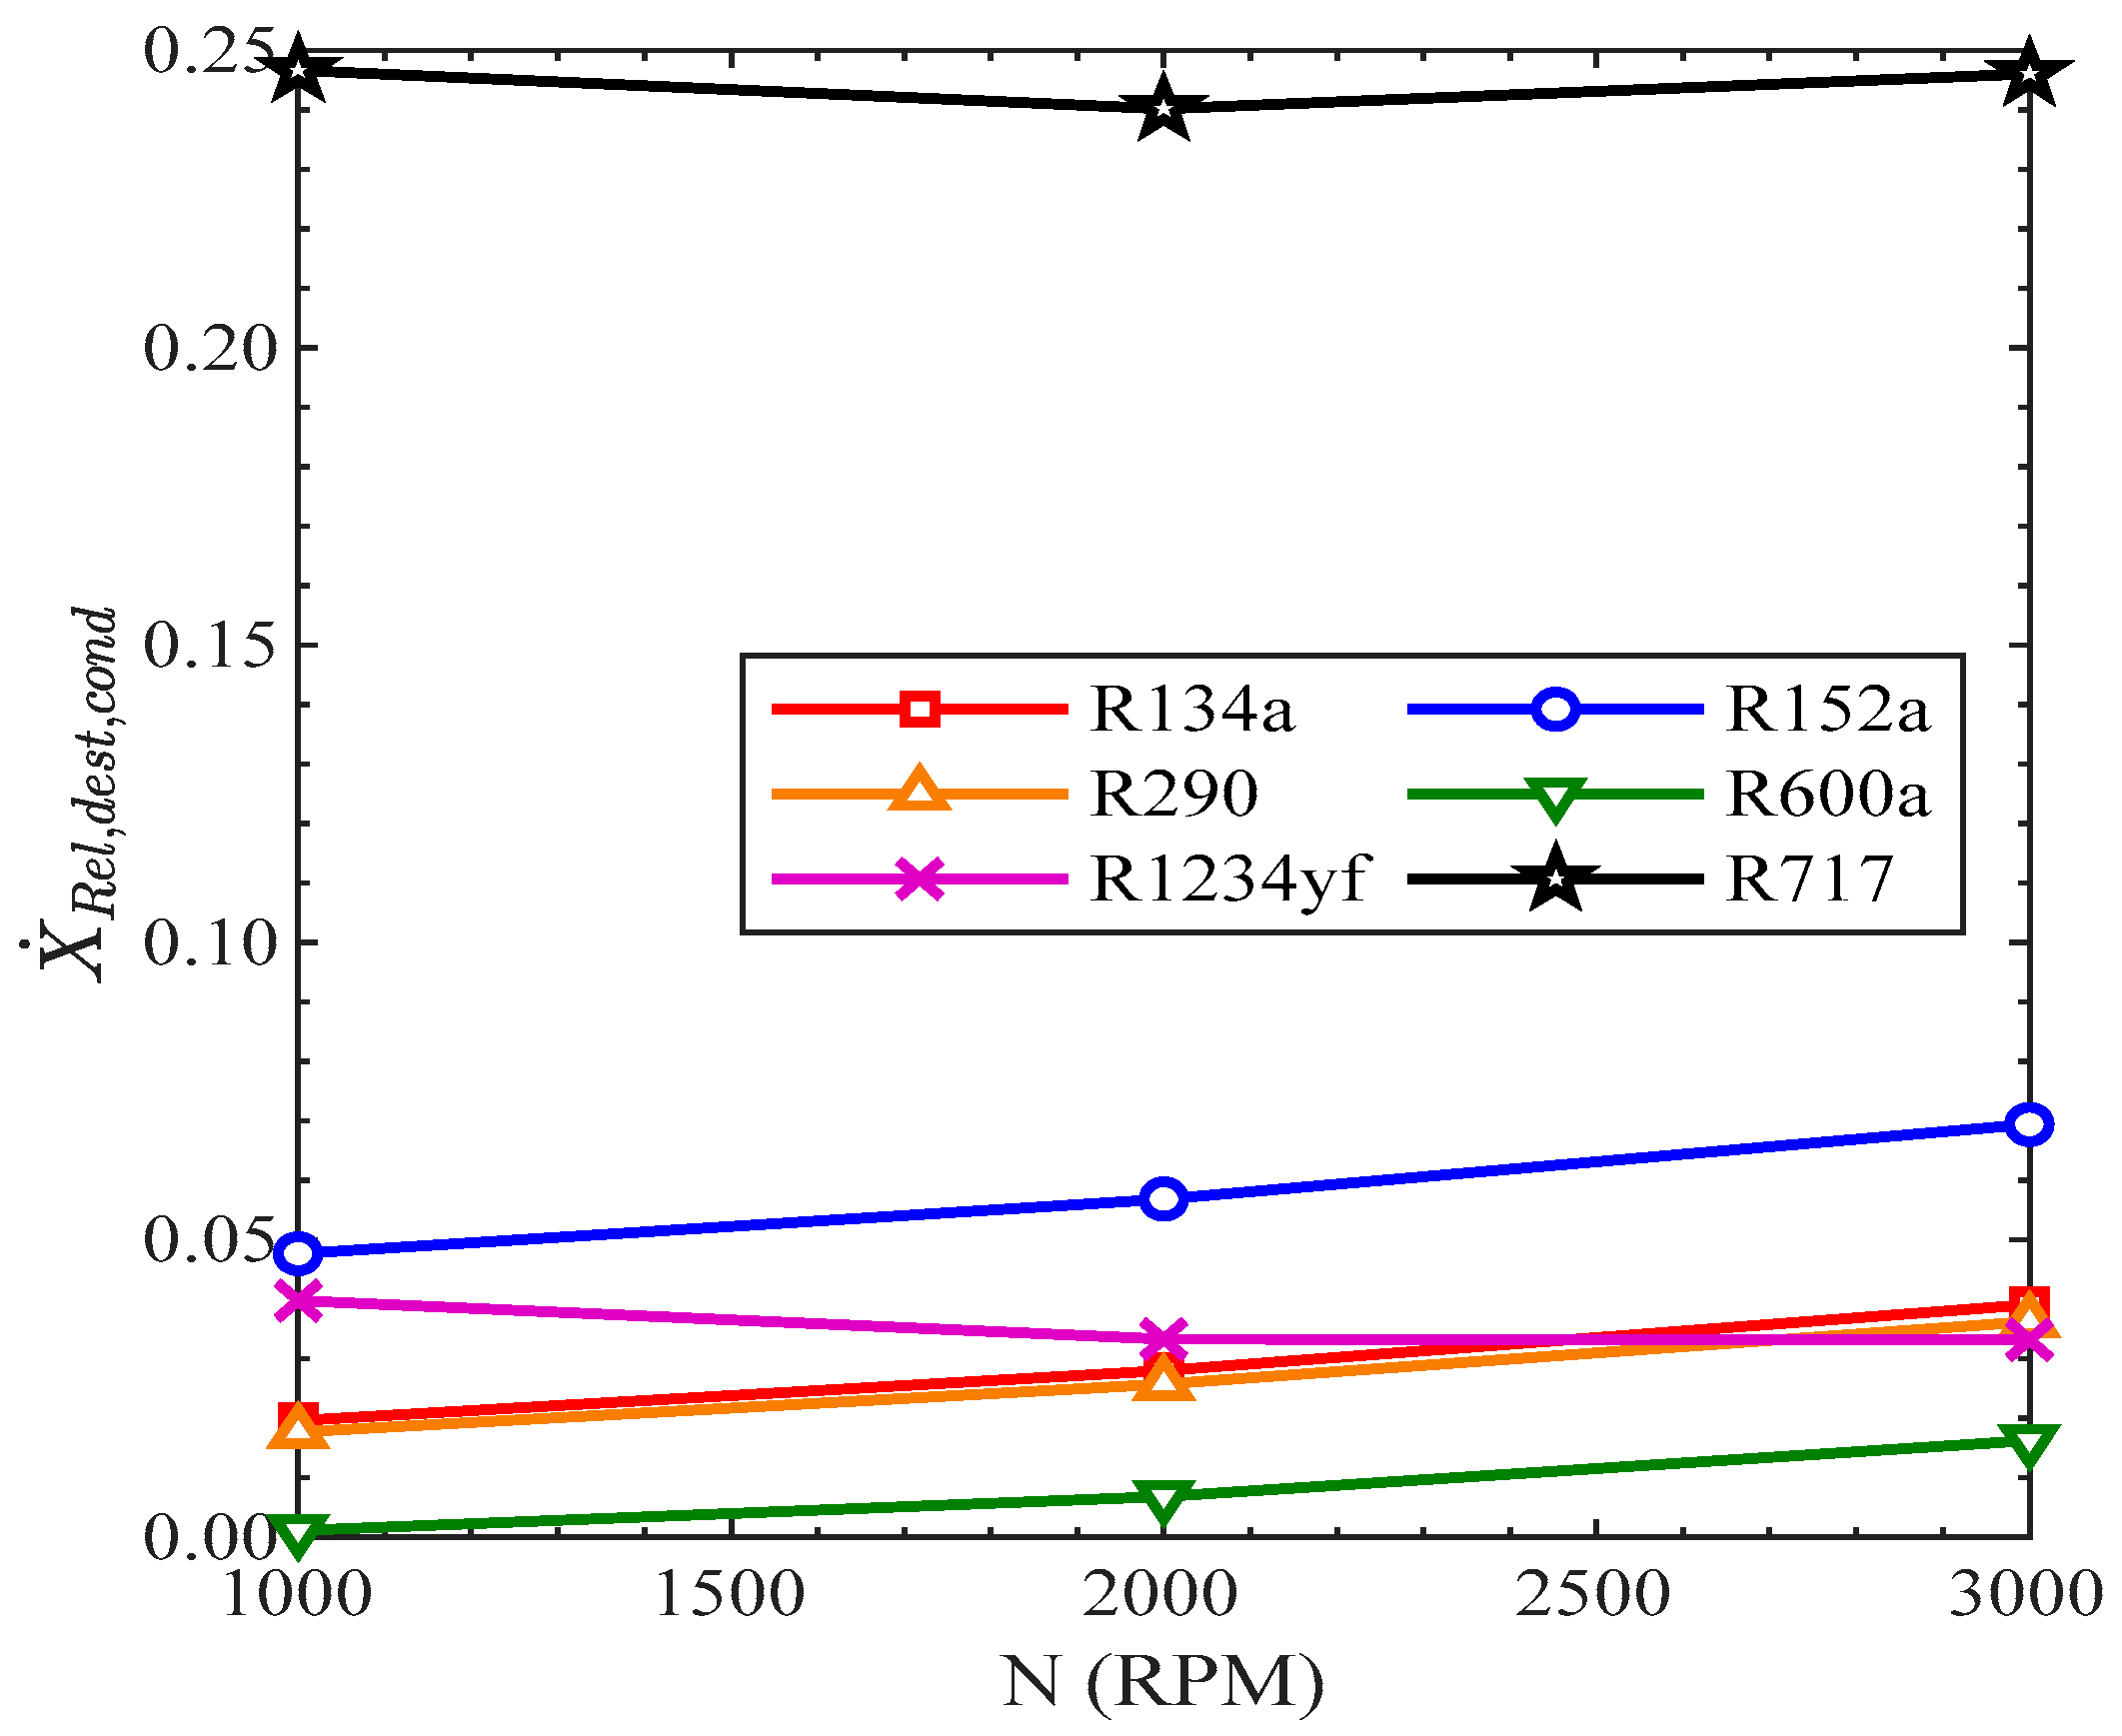
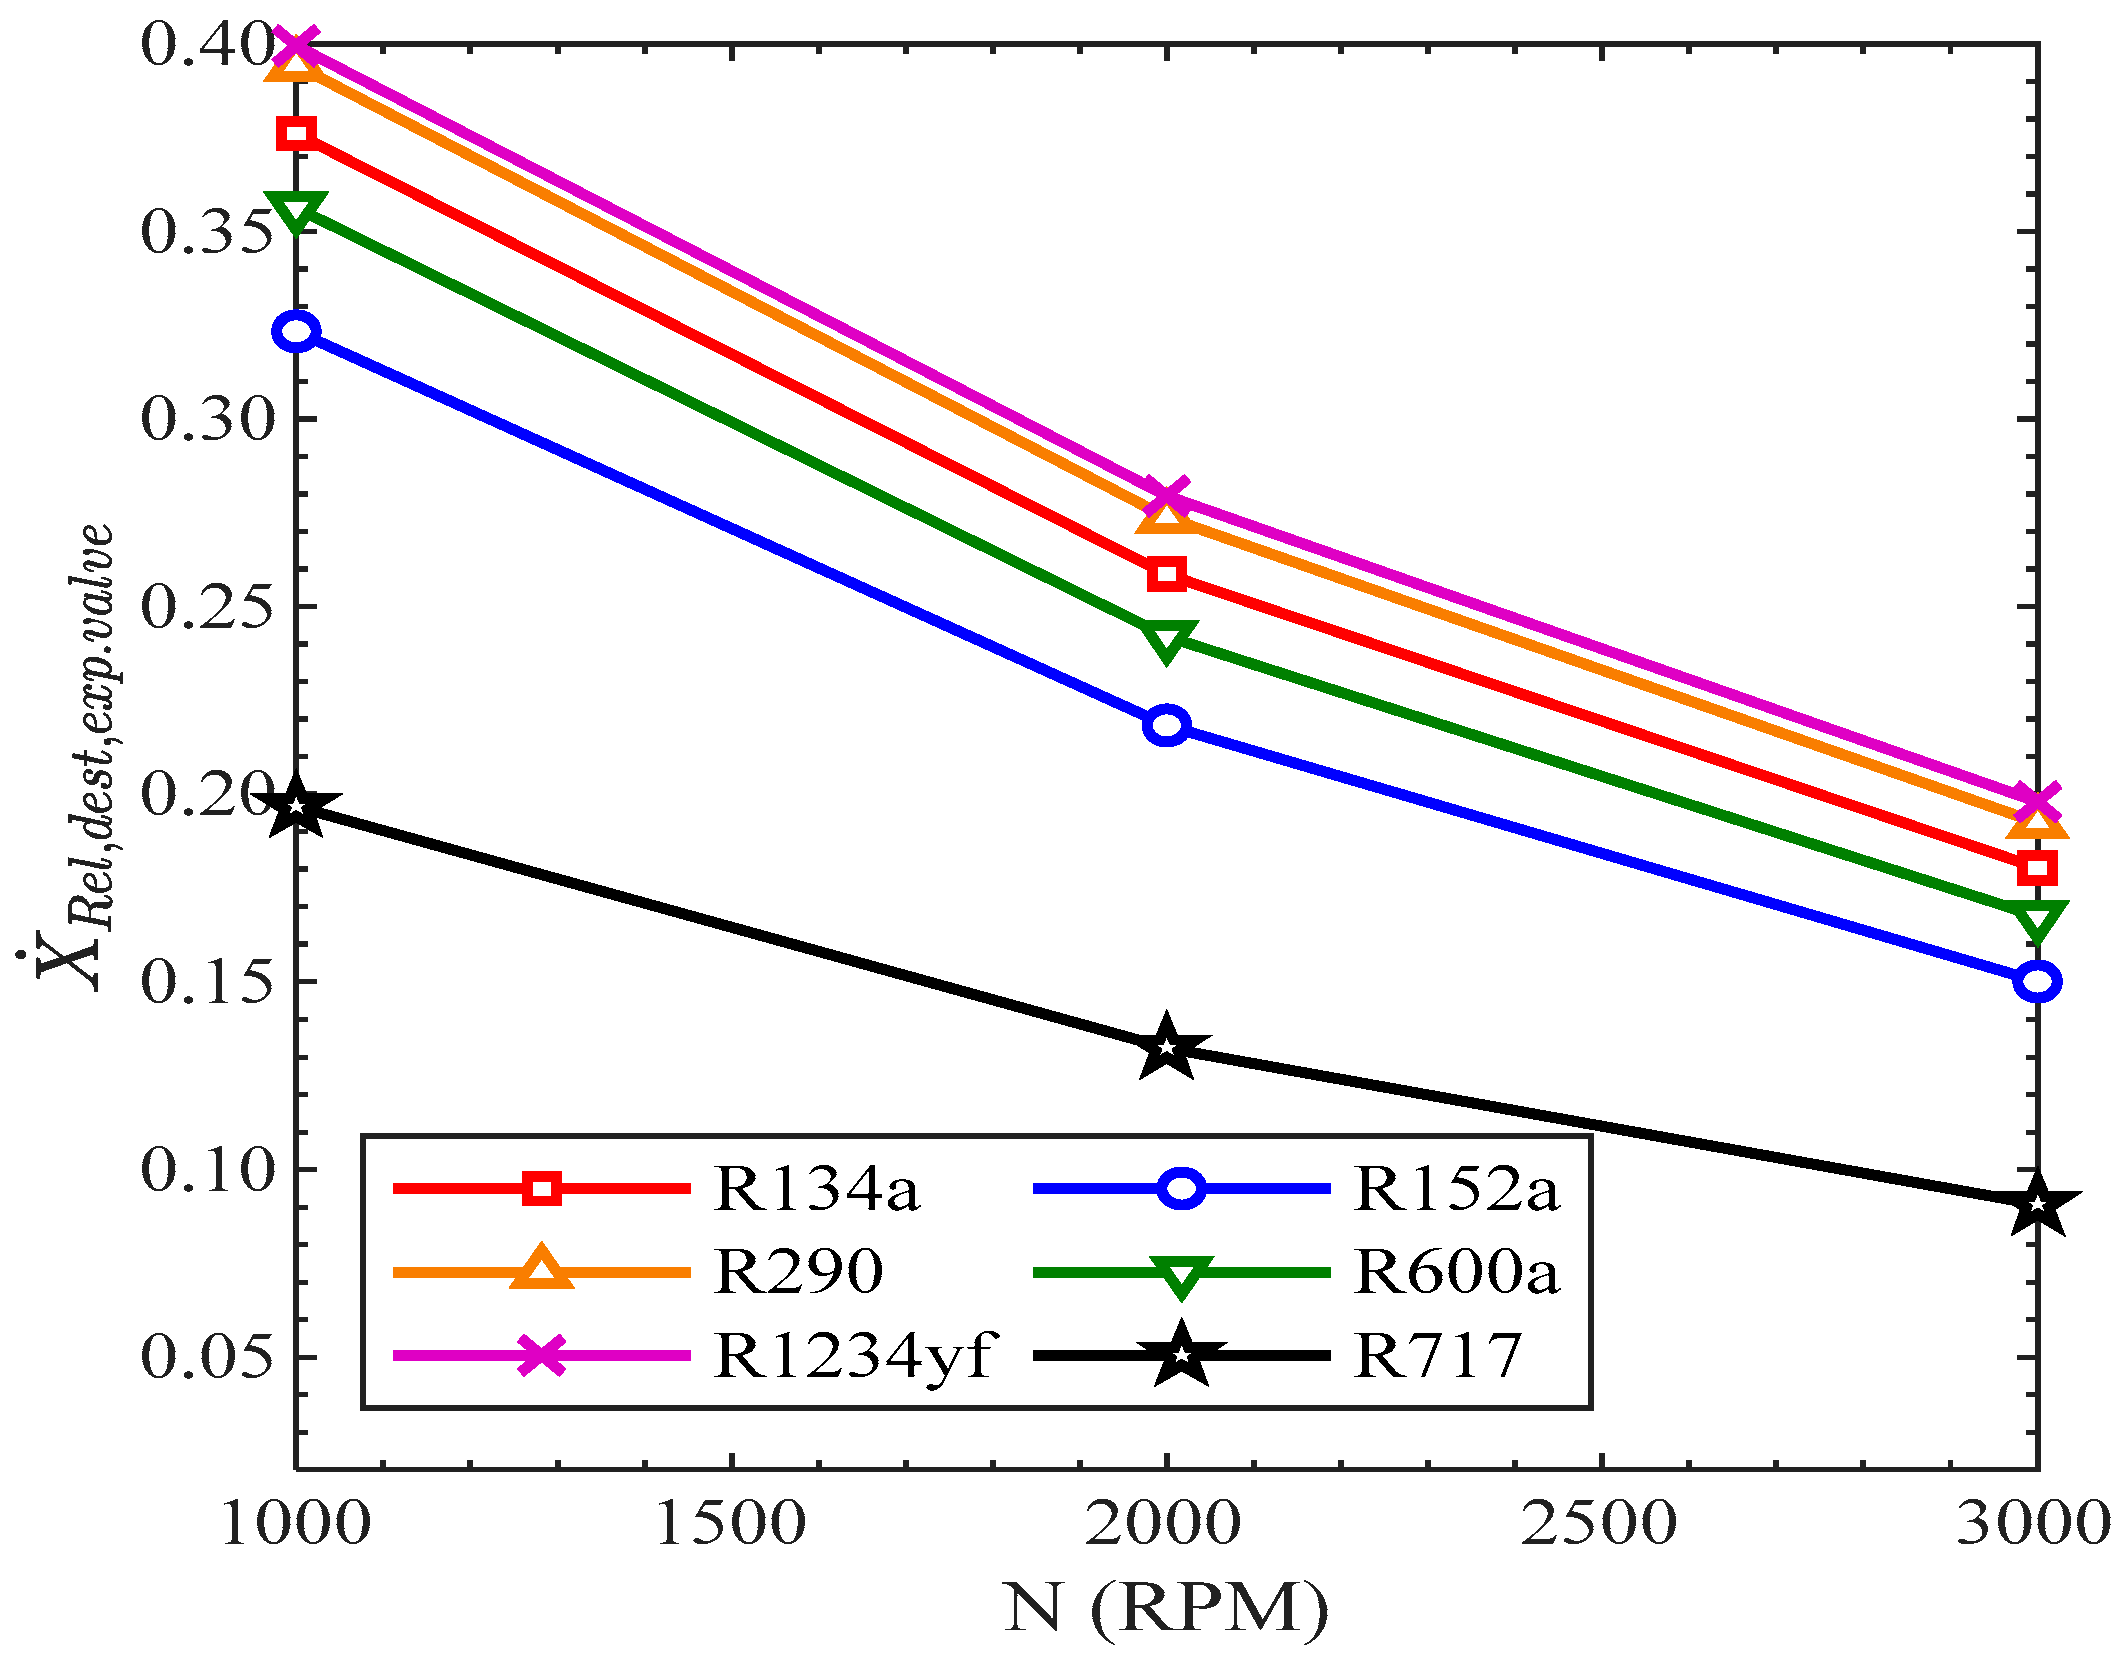
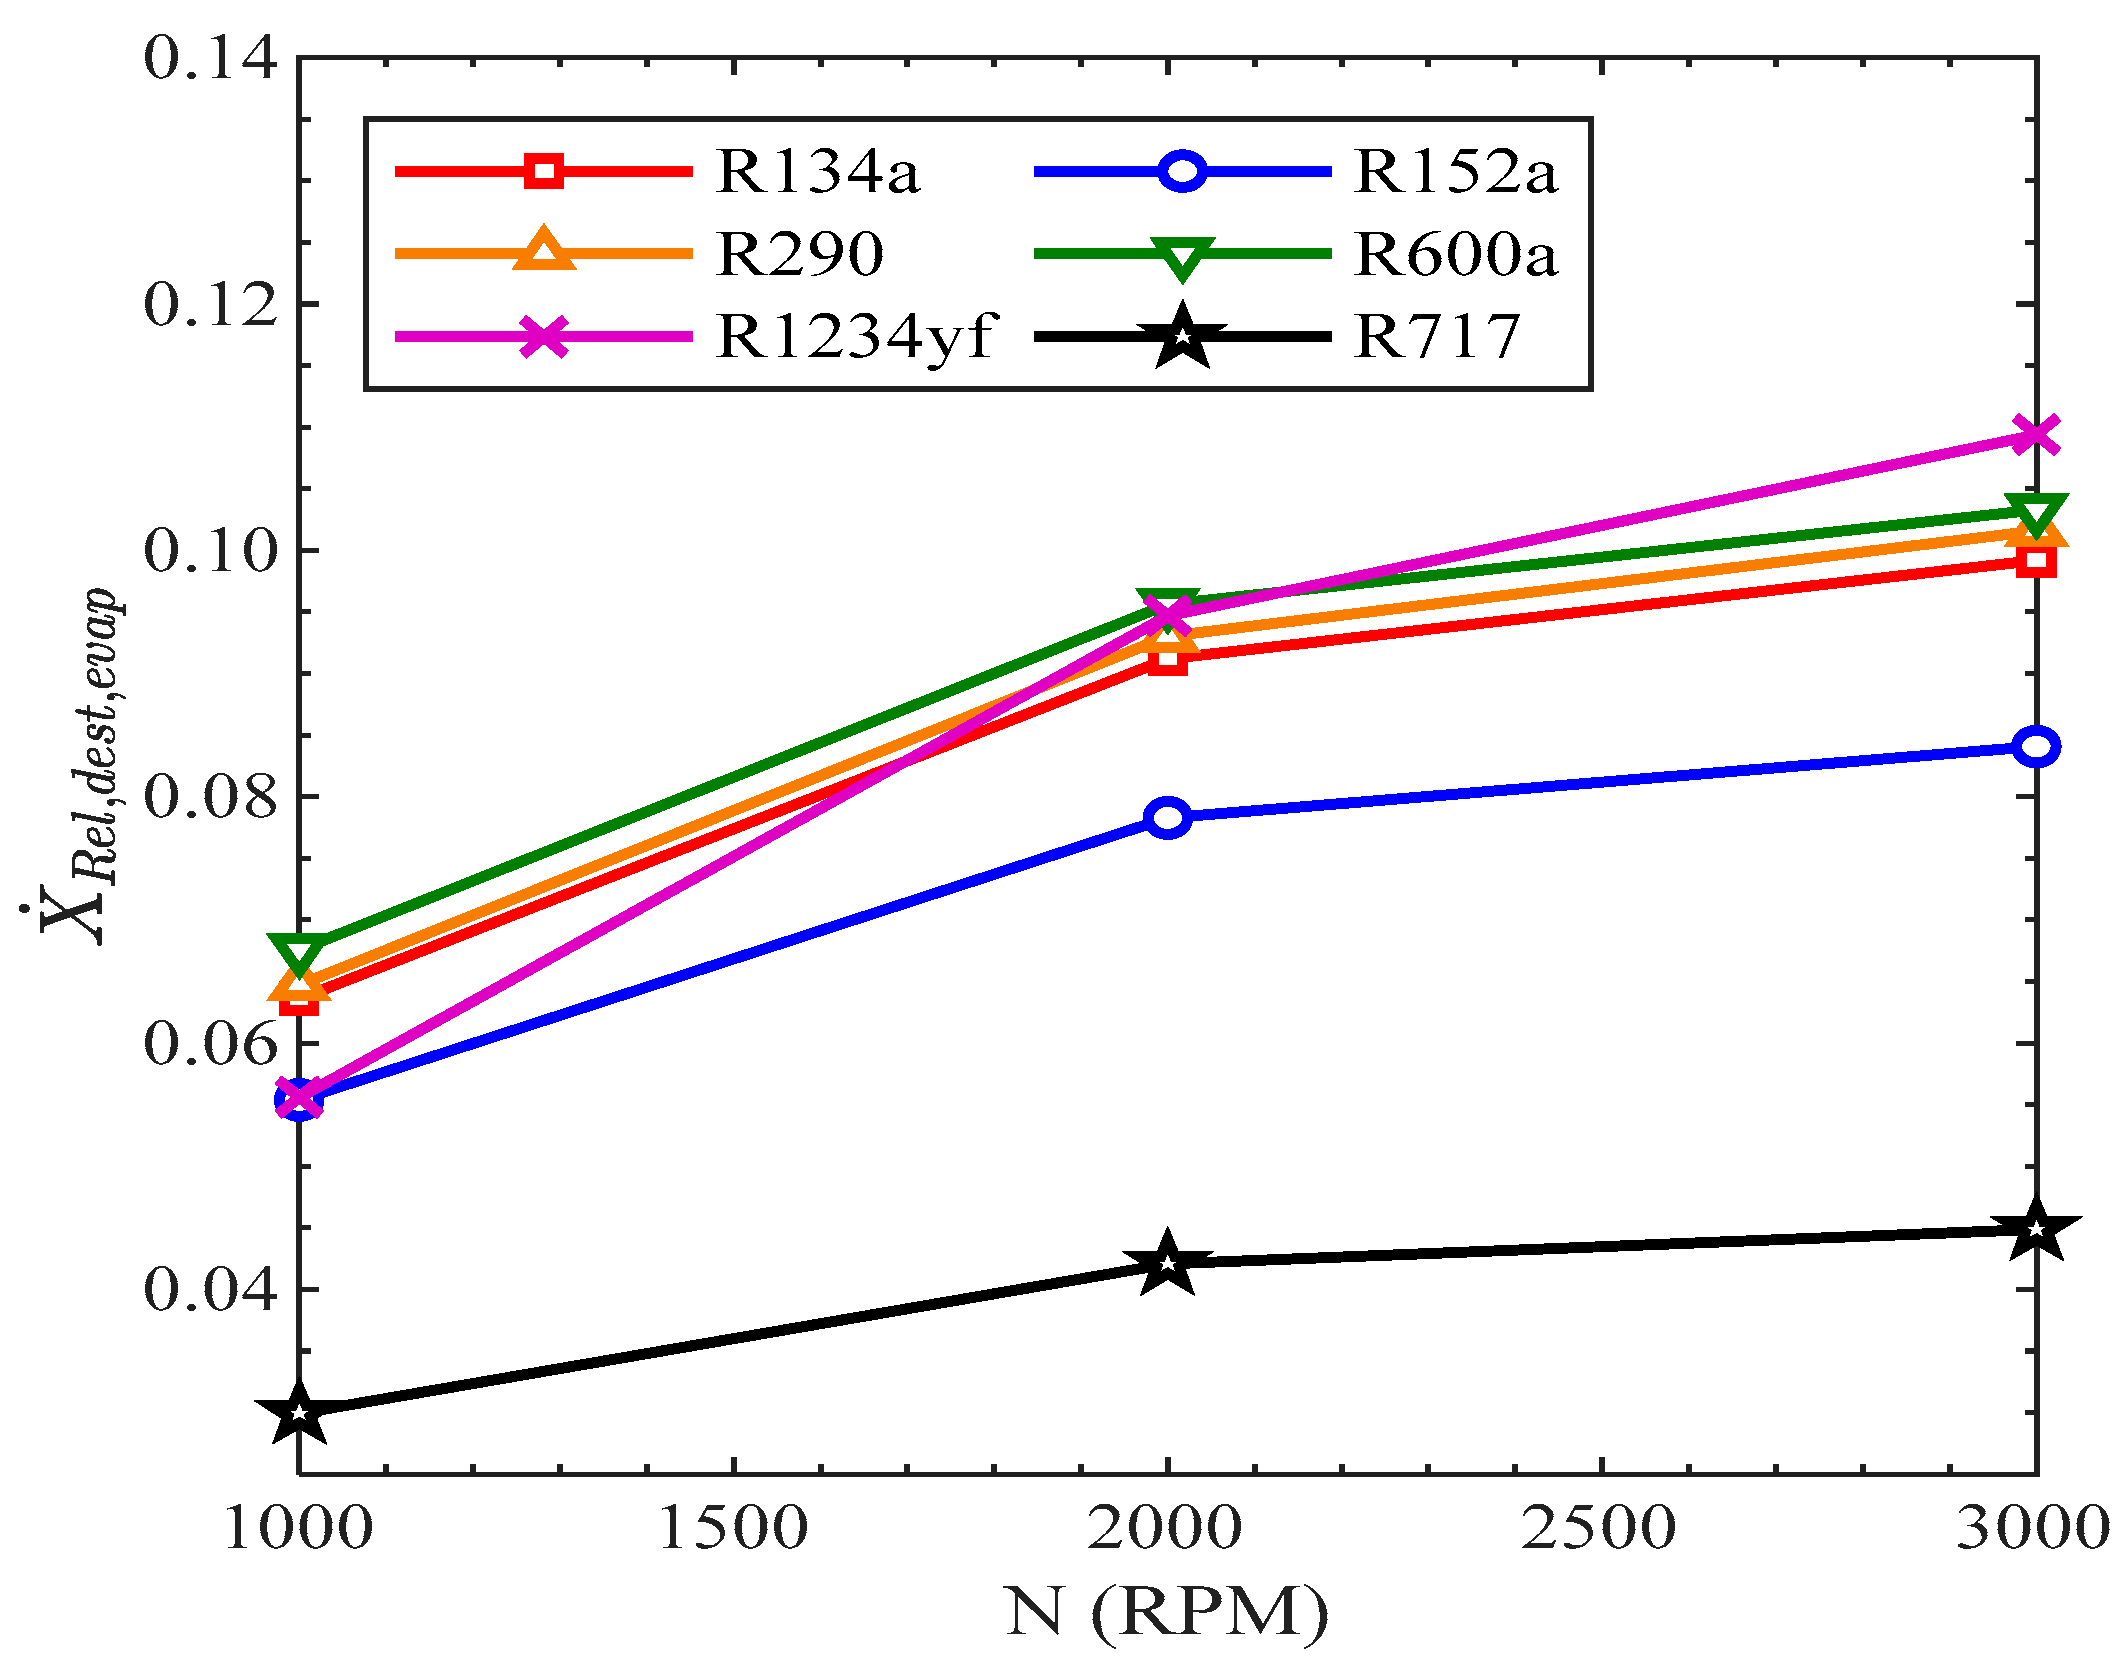
3.3.4. Exergy Destruction Rate

Figure 12 shows the variation in total exergy destruction with compressor speed for various refrigerants. The total exergy destruction increased with the rise in revolutions of the compressor from 1000 RPM to 3000 RPM with respect to each refrigerant. The mass flow rate of the refrigerants increased with the rise in revolutions of the compressor. Due to this, the difference in pressure increased, which increased the condensation and decreased the evaporation. This is why, with the rise in compressor speed, the exergy destruction rose, thus resulting in more irreversibility and entropy generations. The total exergy destruction of R717 was the highest, while it was lowest for R600 among all of the refrigerants. The values of total exergy destruction of R134a and R1234yf were very close to each other. The total exergy destruction of R134a was 0.3917 kW, 0.9438 kW, and 1.641 kW at 1000 RPM, 2000 RPM, and 3000 RPM, respectively. The total exergy destruction of R1234yf was 0.4162 kW, 0.9884 kW, and 1.698 kW at 1000 RPM, 2000 RPM, and 3000 RPM, respectively.
In Figure 13, the relative exergy destruction of the compressor rose with compressor speed in all the refrigerants. In R134a, the exergy destruction of the compressor was 54%, 62%, and 68% at the compressor speeds of 1000 RPM, 2000 RPM, and 3000 RPM, respectively. The relative exergy destruction of the compressor was highest in R600a from 1000 RPM to 3000 RPM. At 1000 RPM, the relative exergy destruction of the compressor was lowest in R1234yf, while at 3000 RPM, the exergy destruction of the compressor in R717 was lowest.
In Figure 14, the relative exergy destruction of the condenser rose gradually with the increase in speed of the compressor for all the other refrigerants, excluding R1234yf and R717. In R1234yf, the relative exergy destruction slightly decreased with the rise in speed of the compressor. In R717, the relative exergy destruction of the compressor first decreased from 1000 RPM to 2000 RPM and then increased from 2000 RPM to 3000 RPM. In R134a, the exergy destruction of the condenser was 1.96%, 2.8%, and 3.9% at 1000 RPM, 2000 RPM, and 3000 RPM, respectively.
The relative exergy destruction in the condenser was highest in R717 and lowest in R600a at all speeds of the compressor.
In Figure 15, the relative exergy destruction in the expansion valve reduced with the rise in revolutions of the compressor. All the refrigerants showed the same decreasing trend with the rise in compressor speed. The highest relative exergy destruction in the throttle valve was in R1234yf, while it was lowest for R717 from 1000 RPM to 3000 RPM. The values of relative exergy destruction in the throttle valve for R134a were 37.61%, 25.86%, and 18% for 1000 RPM, 2000 RPM, and 3000 RPM.
In Figure 16, the variation in the relative exergy destruction in the evaporator with the speed of the compressor is presented. All the refrigerants showed the same increasing trend with the increase in speed of the compressor. The relative exergy destruction in the evaporator was lowest for R717. The relative exergy destruction in the evaporator at 1000 RPM was highest for R600a and at 3000 RPM for R1234yf. For R134a, the values of relative exergy destruction in the evaporator were 6.36%, 9.1%, and 9.9% at 1000 RPM, 2000 RPM, and 3000 RPM, respectively.

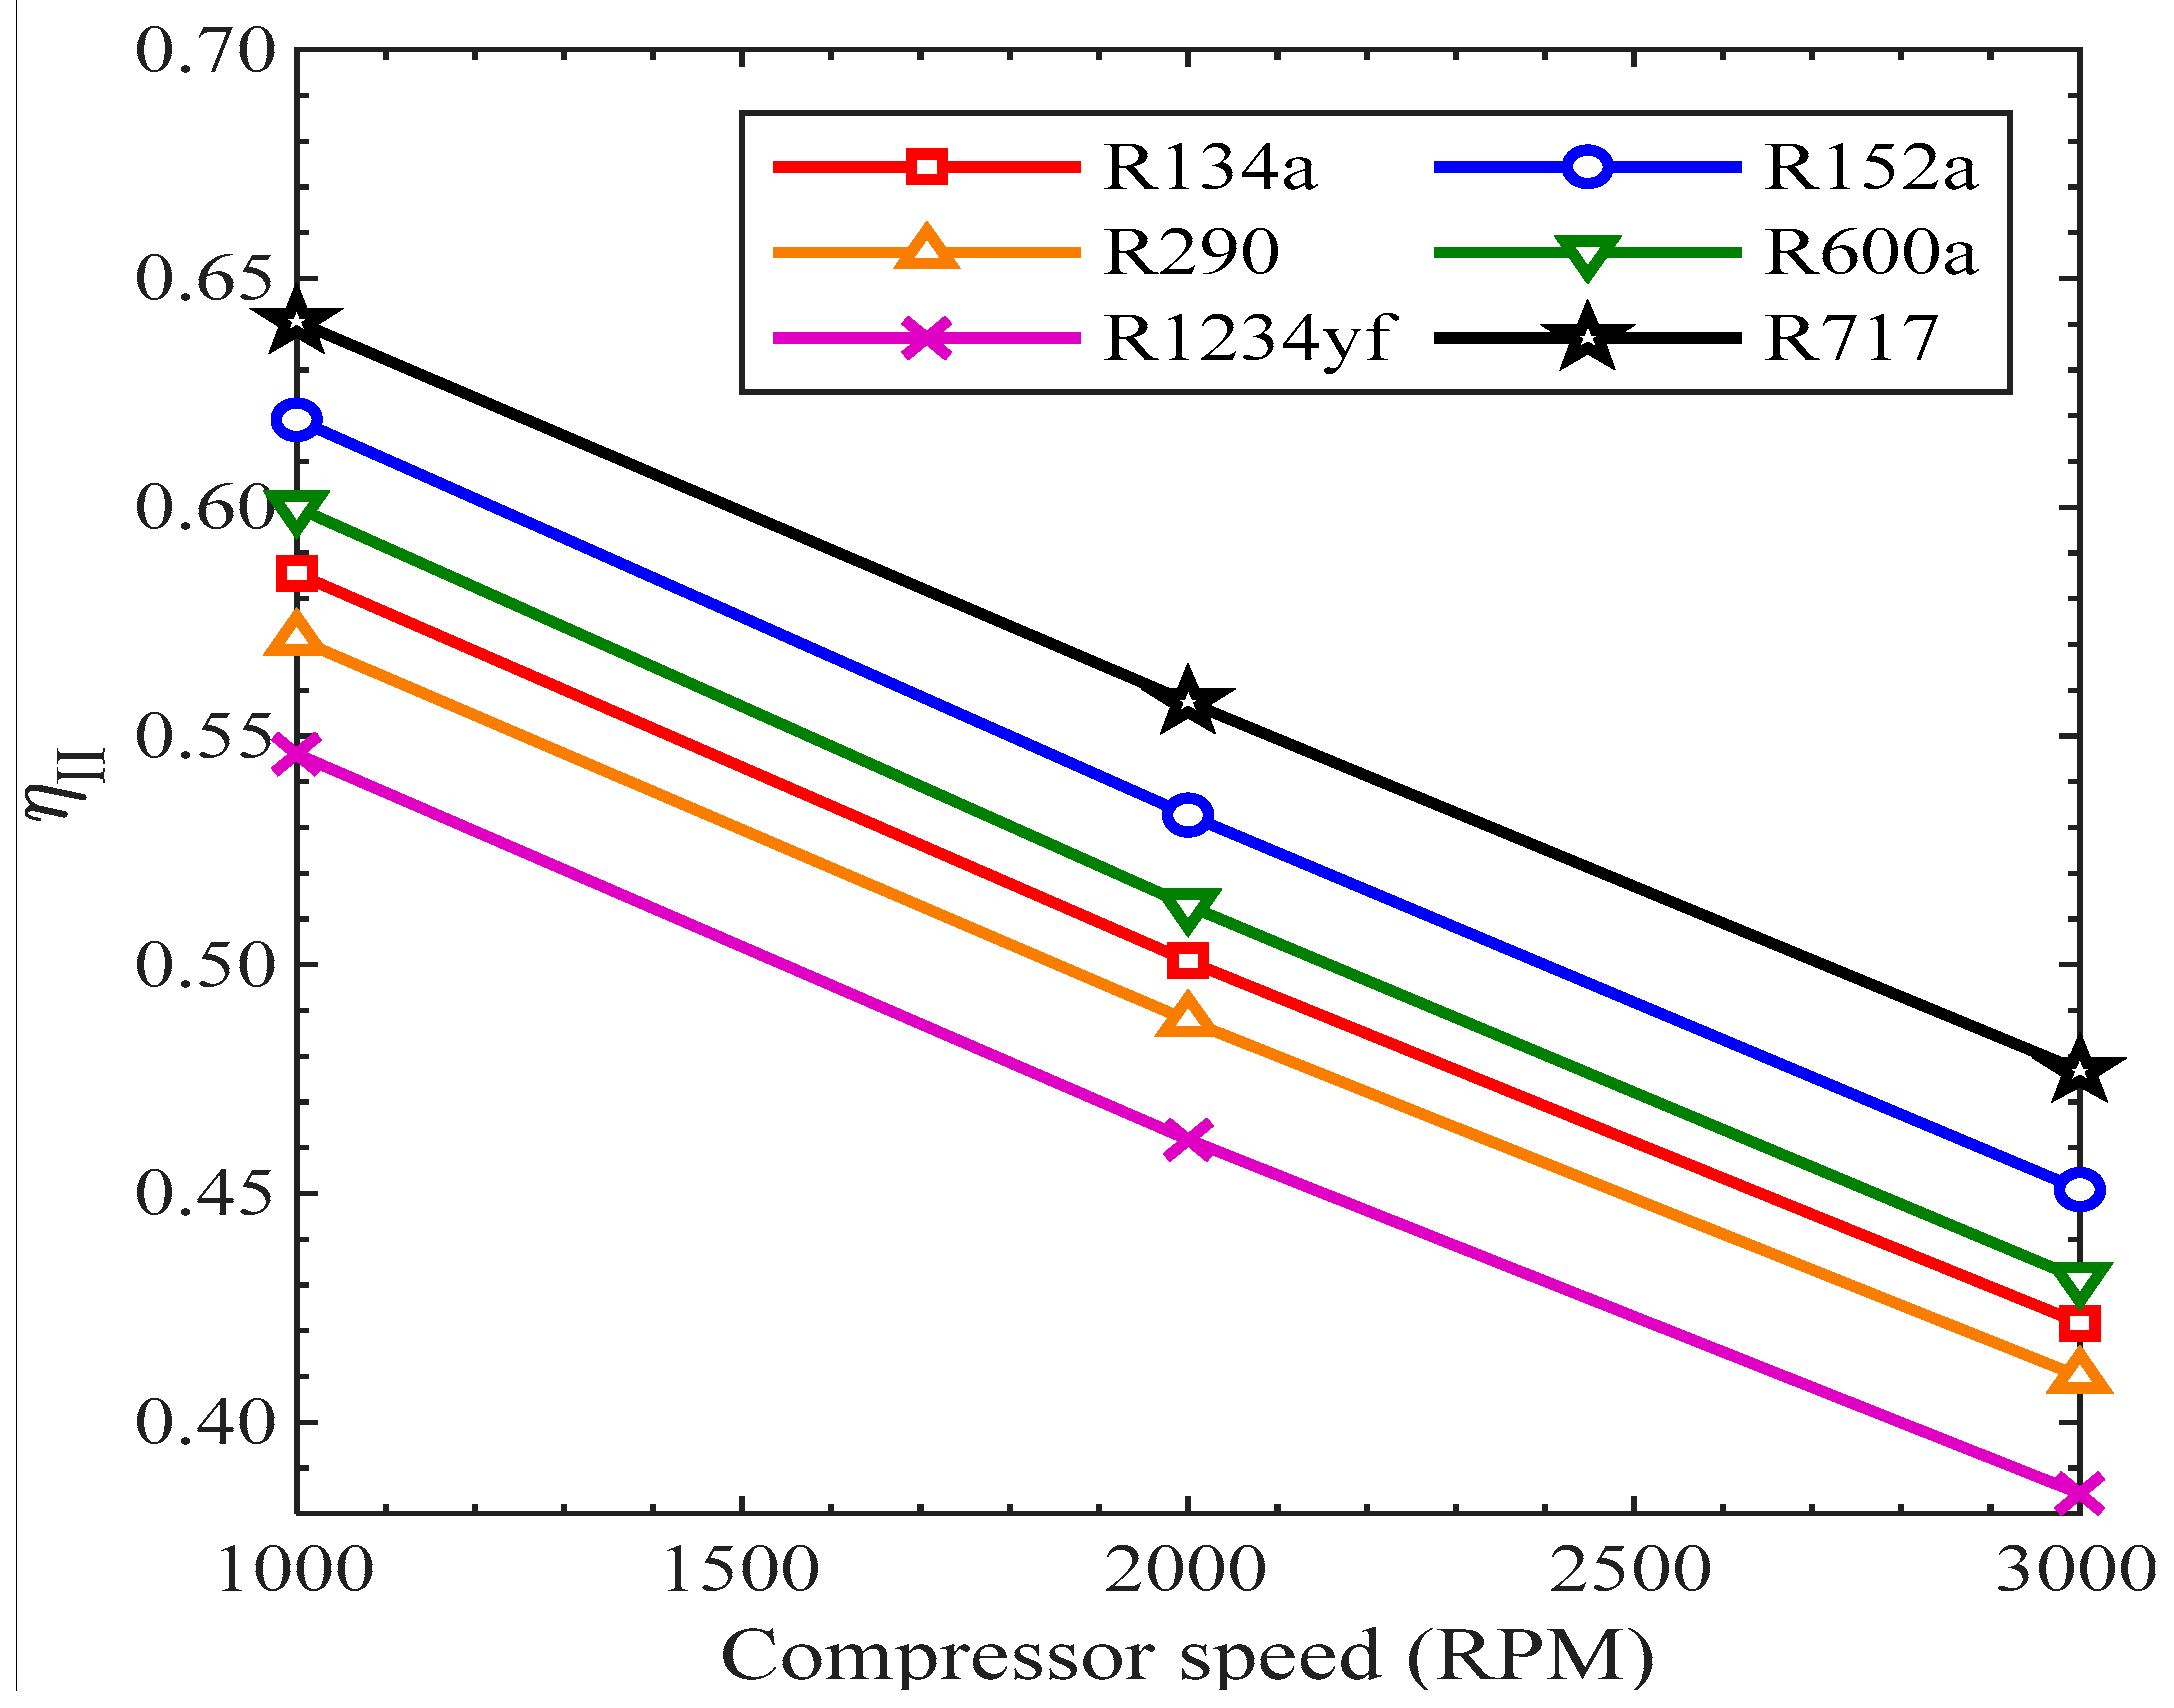
3.3.5. Exergy Efficiency

Figure 17 shows the variation of Exergy Efficiency with the compressor rotational speed. As shown, when the speed of the compressor rose, the exergy destruction rose due to entropy generation and irreversibilities, which resulted in a decrease in second-law efficiency. All the refrigerants showed the same reducing trend with the rise in compressor speed. The second-law efficiency was highest for R717, while it was lowest for R1234yf from 1000 RPM to 3000 RPM. The second-law efficiency of R600a, R134a, and R290 was 60%, 58.55%, and 57.12% at 1000 RPM, while it was 43.13%, 42.16%, and 41% at 3000 RPM, respectively.

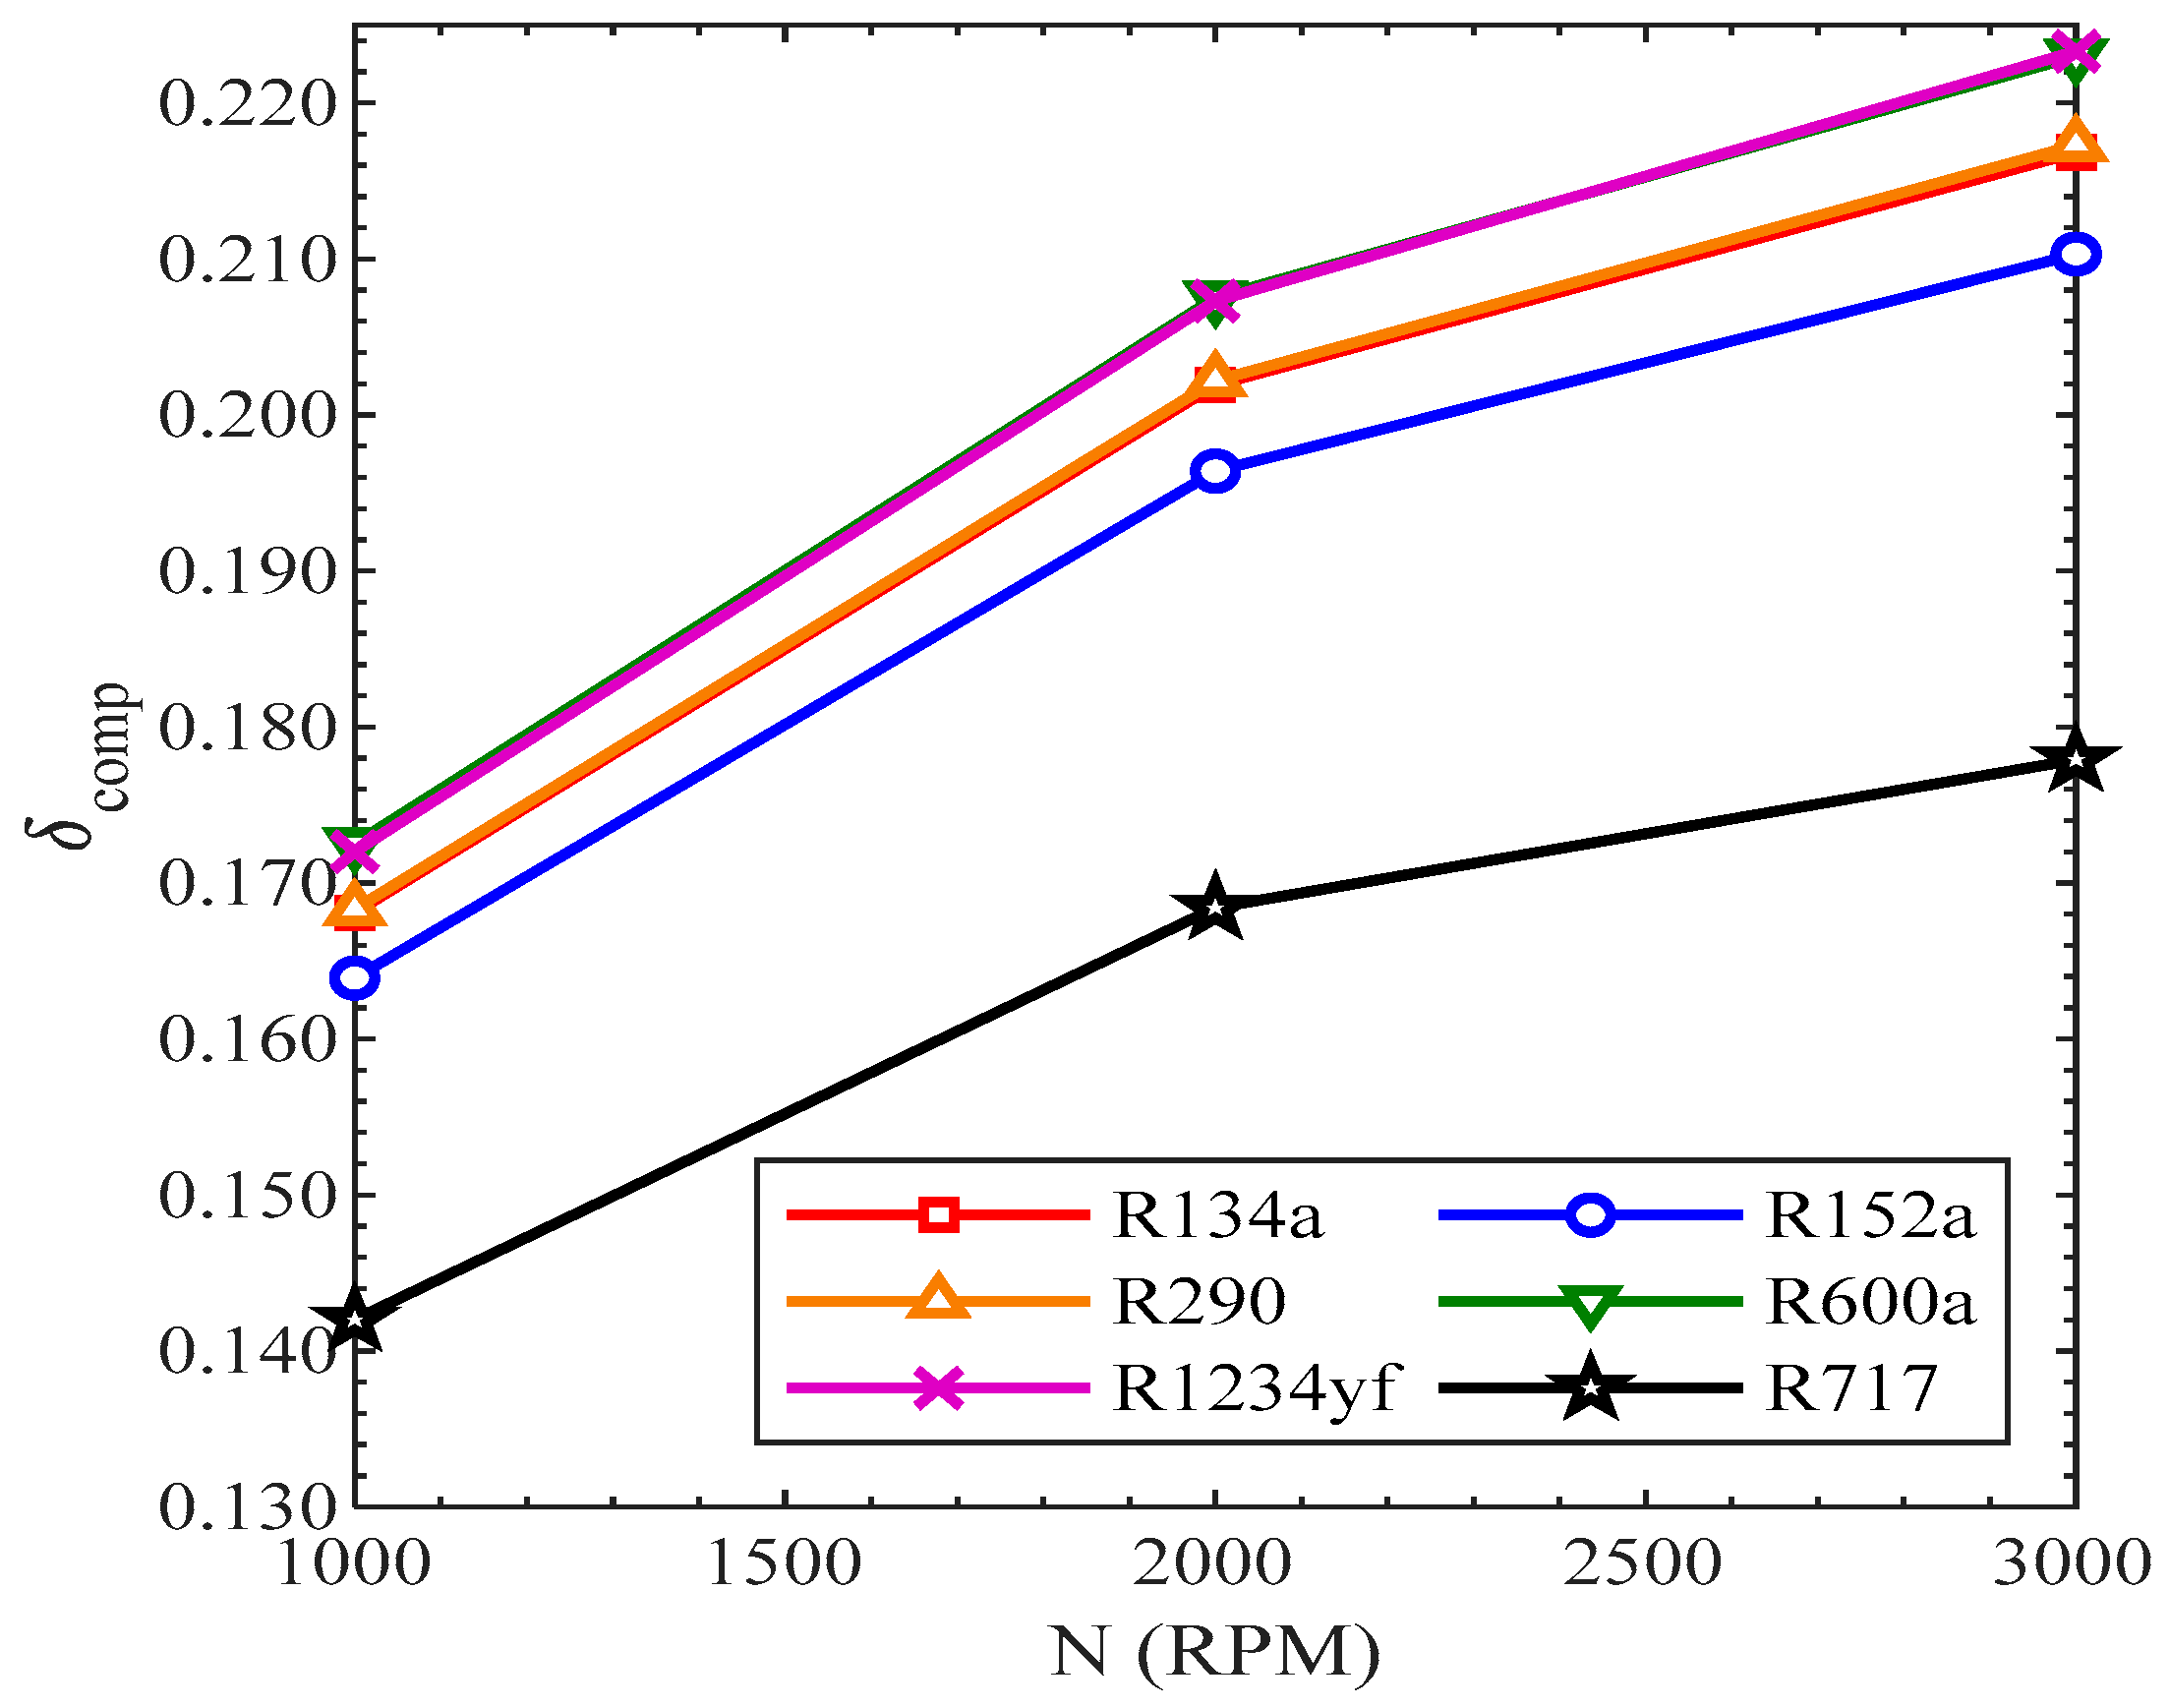
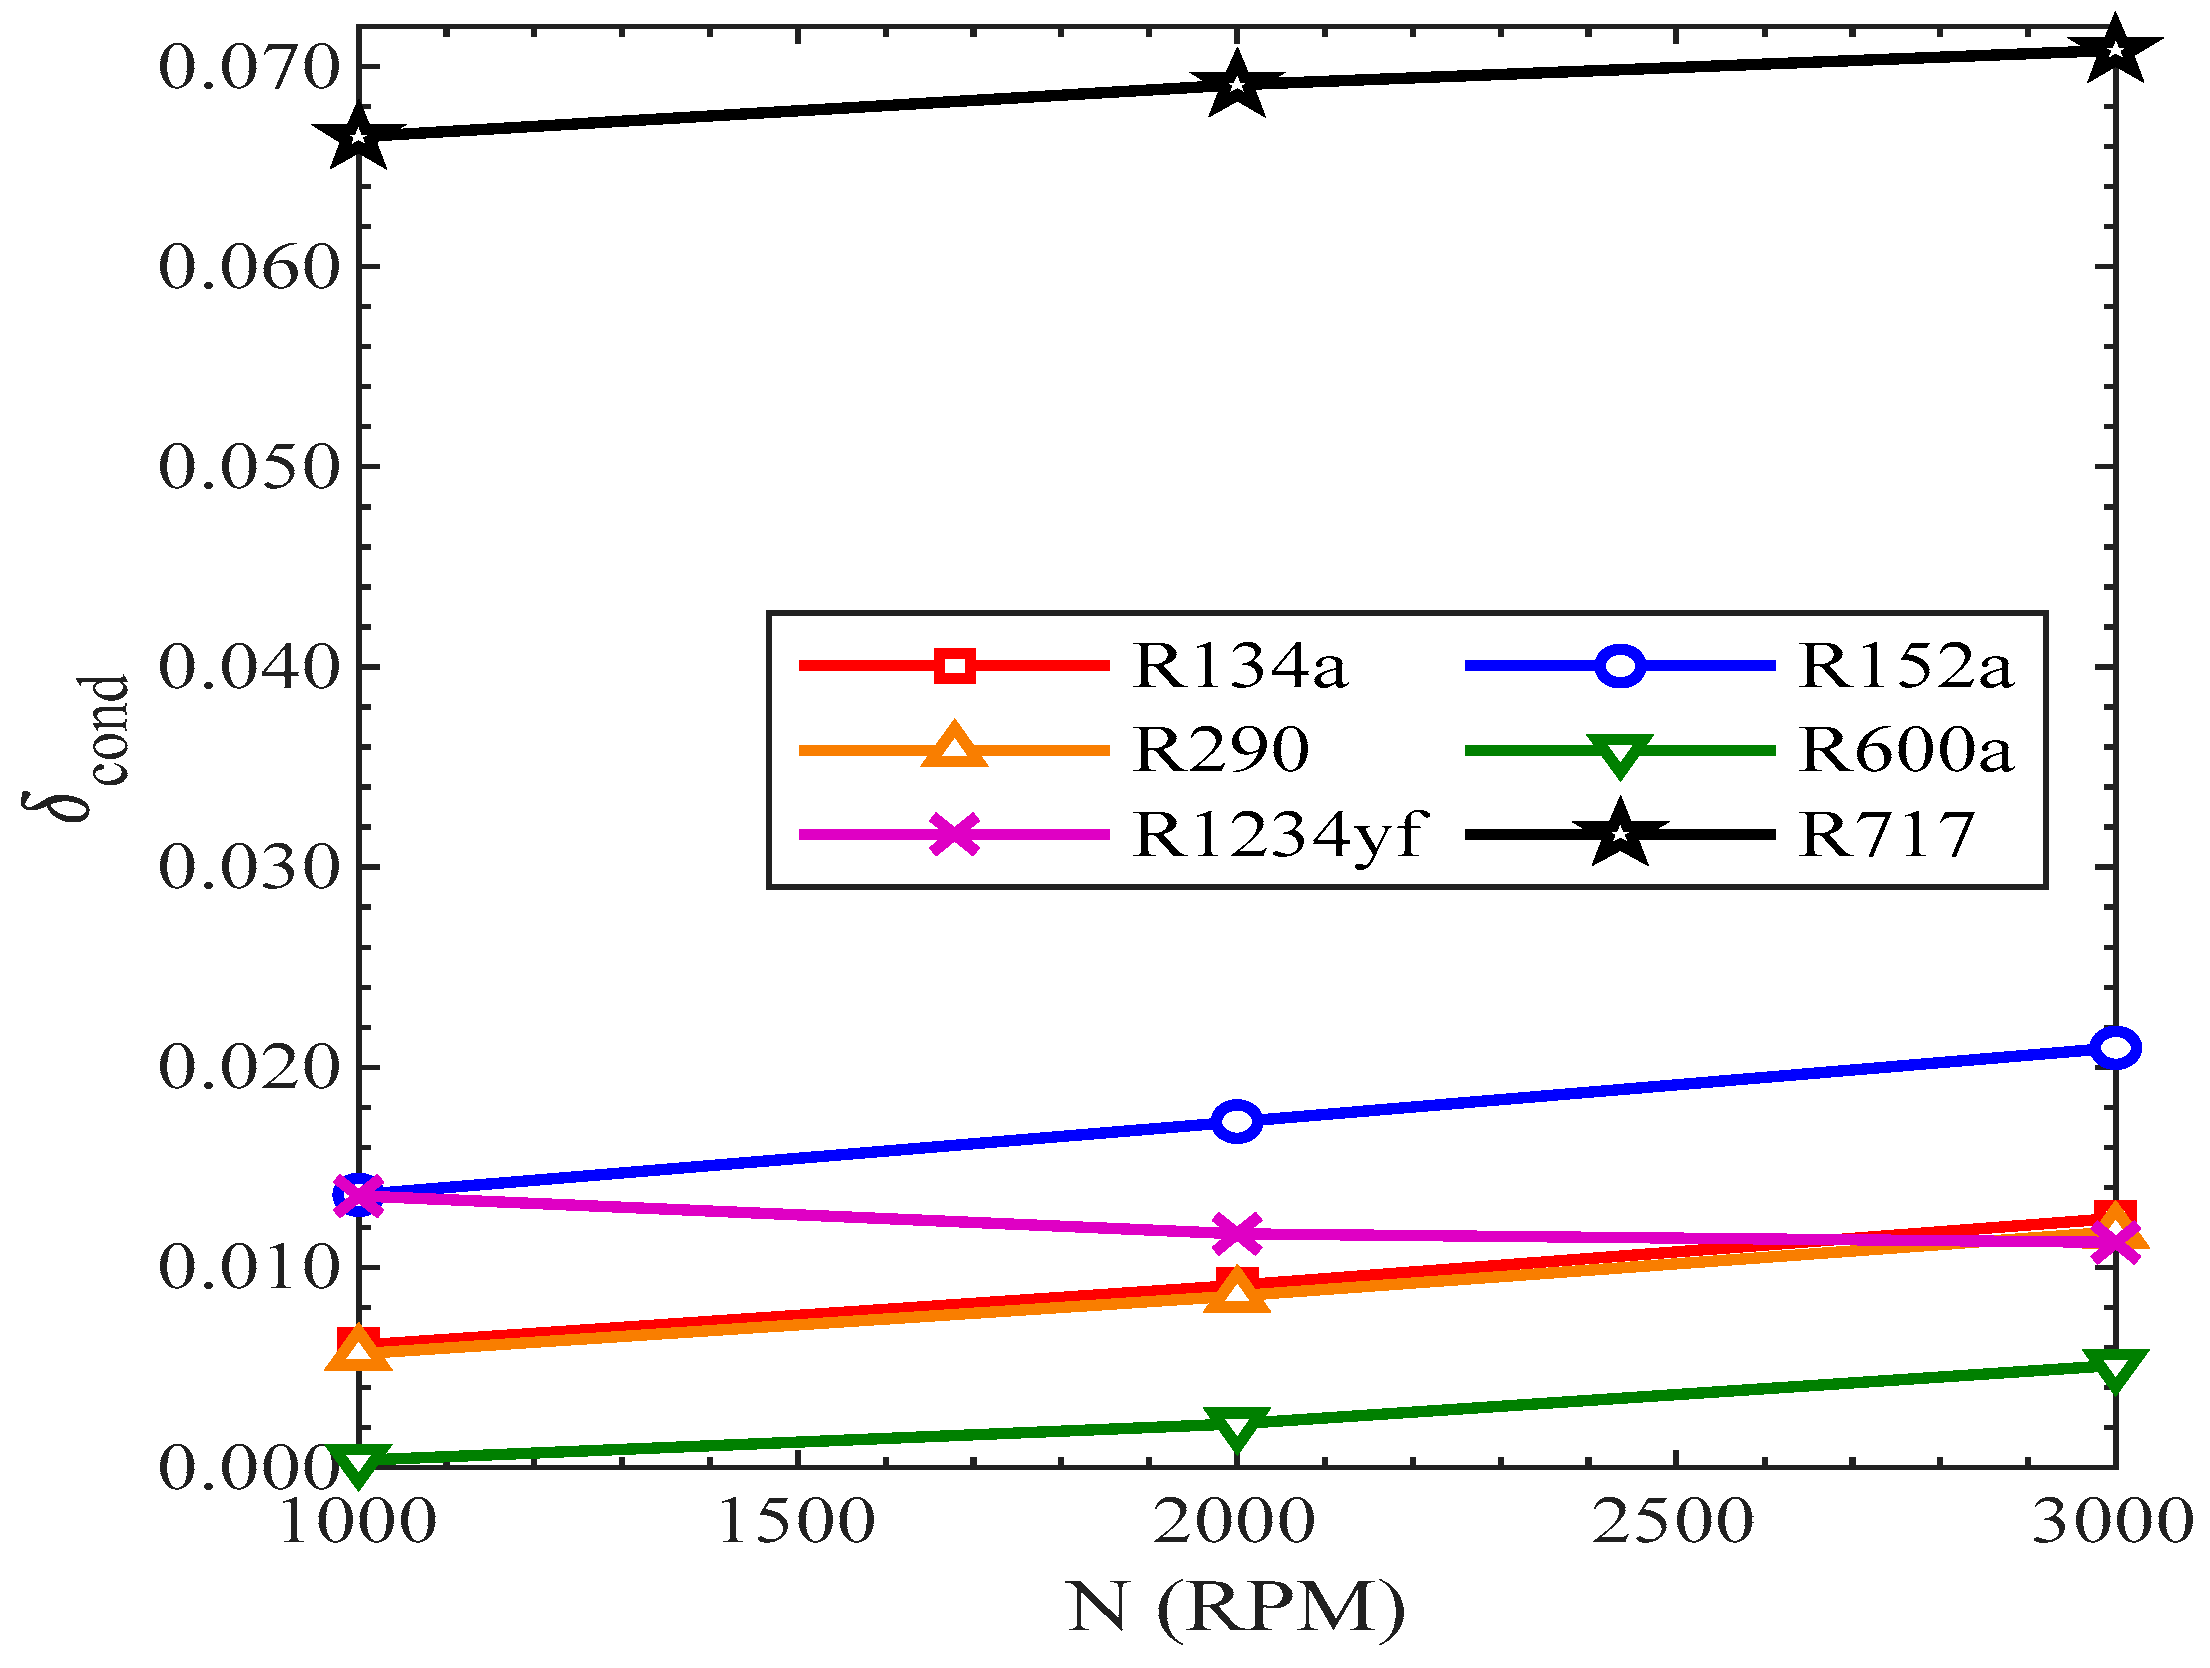
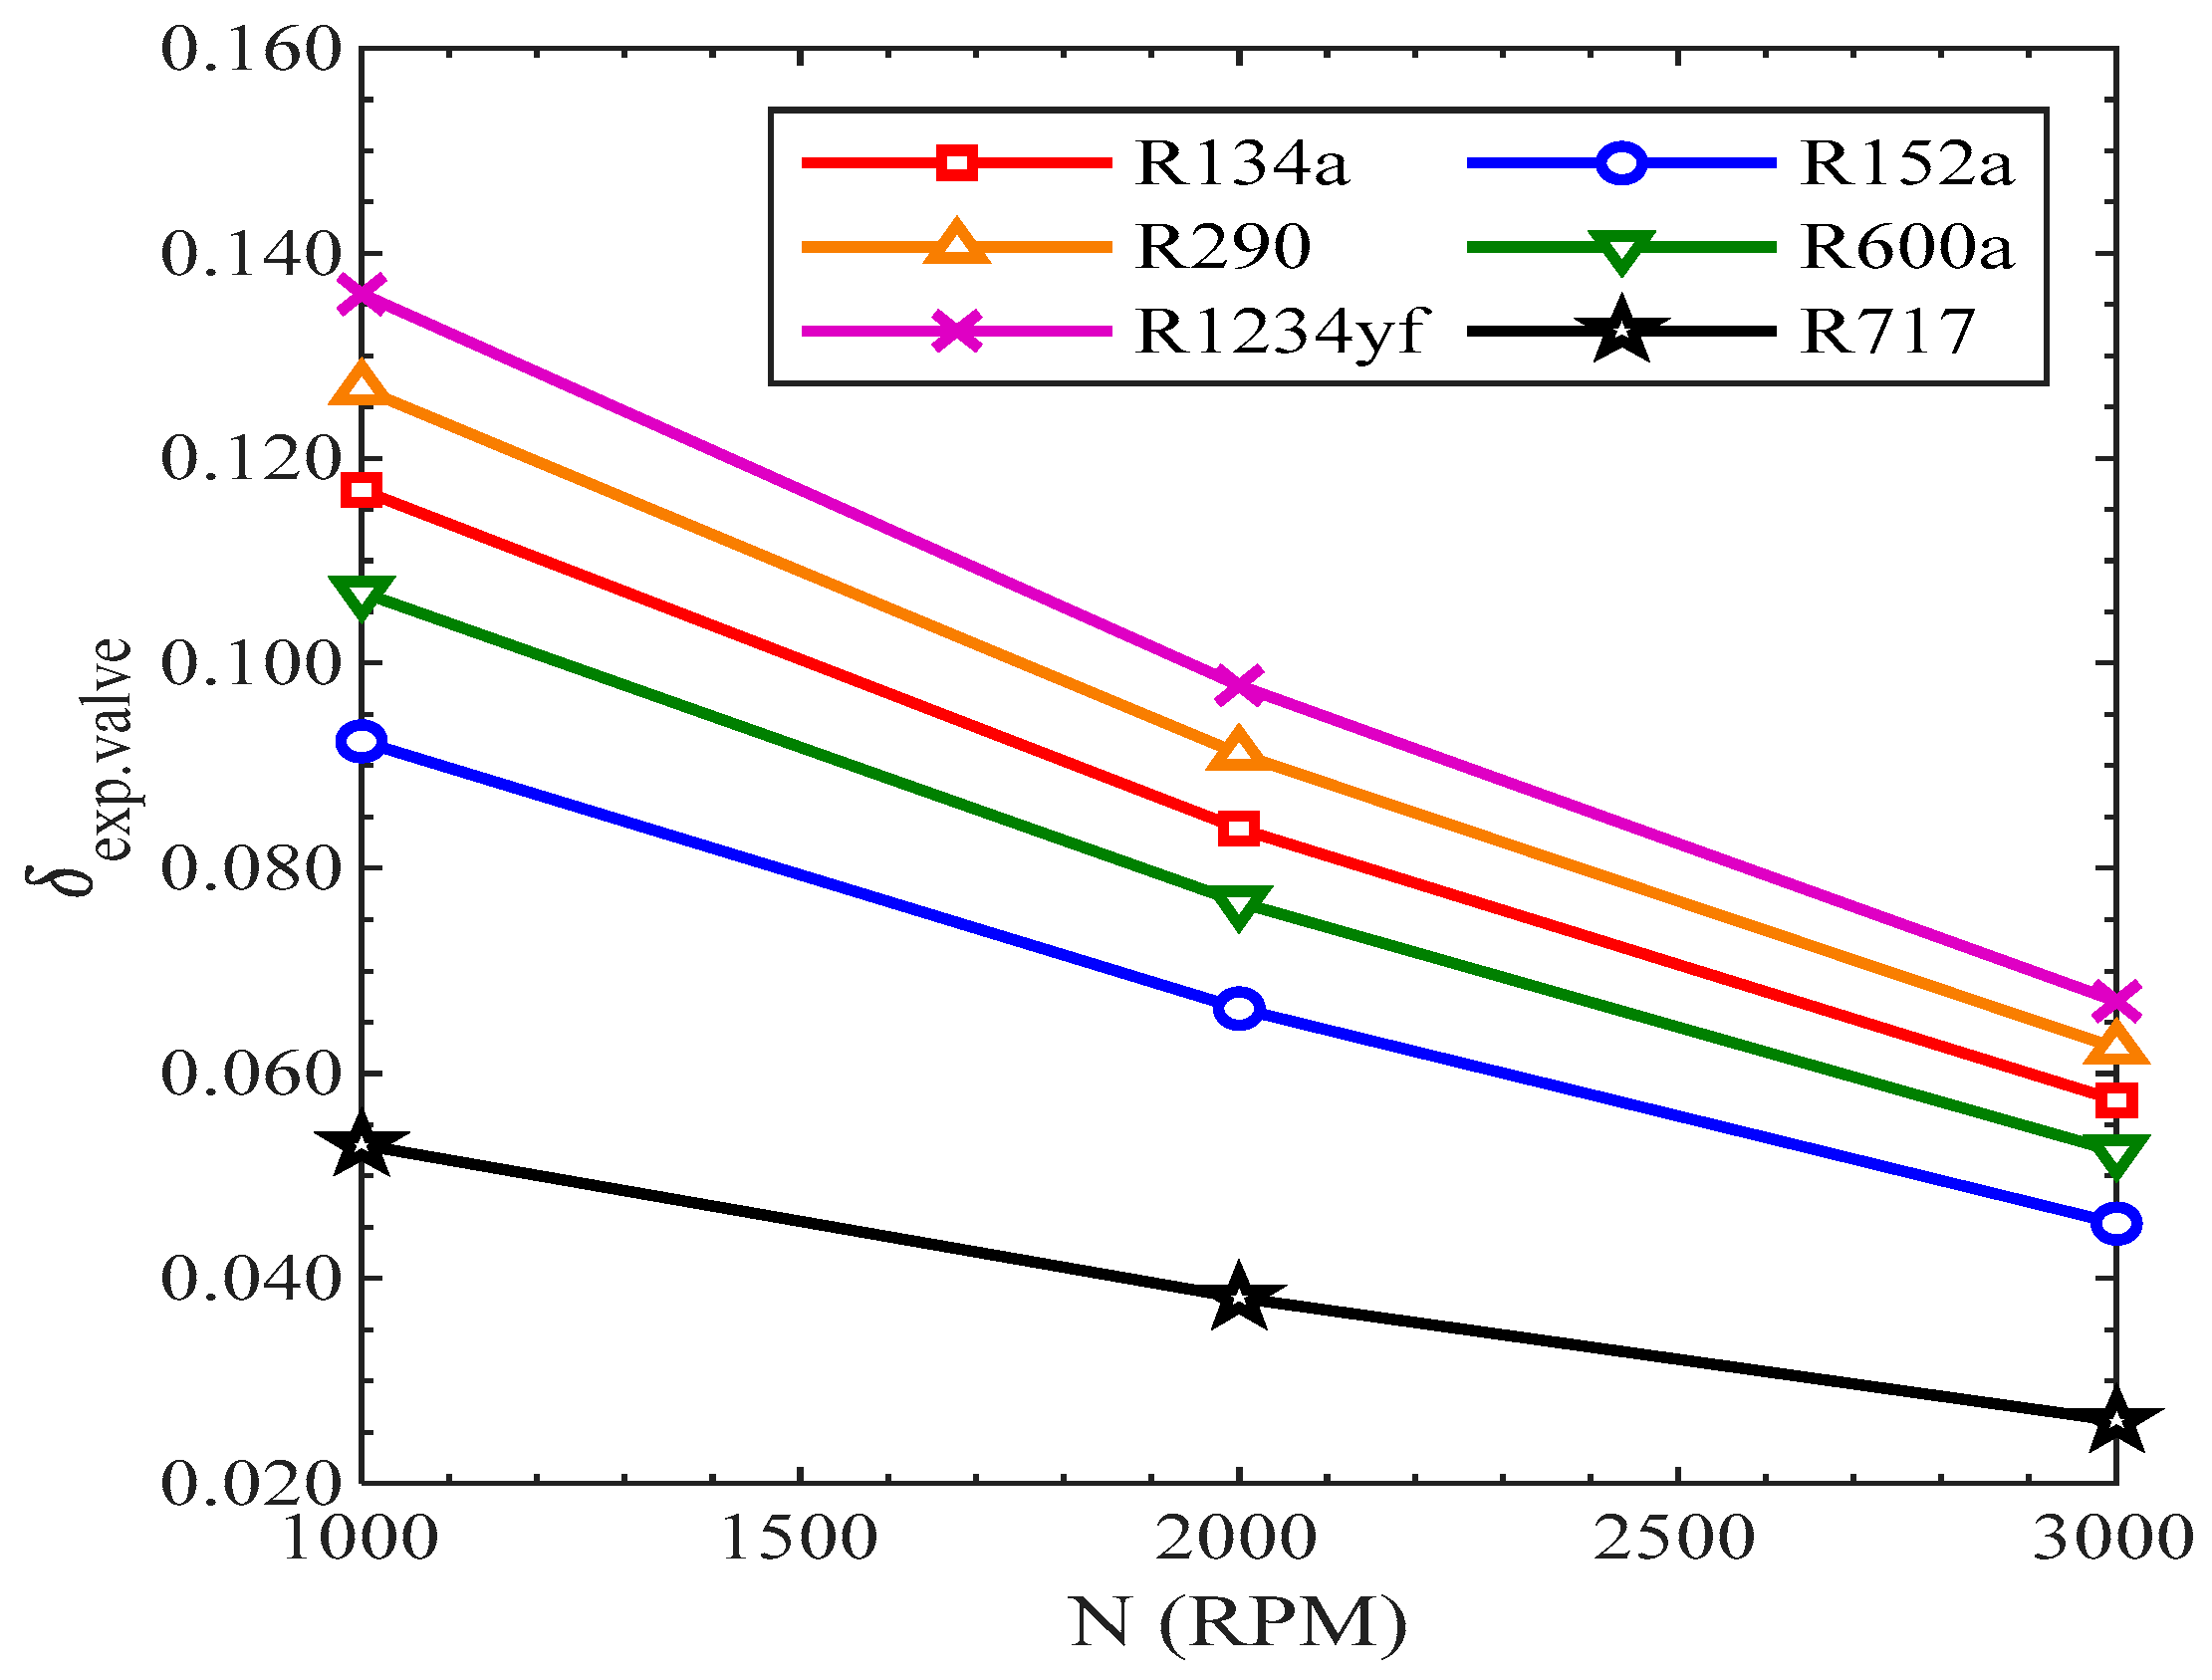
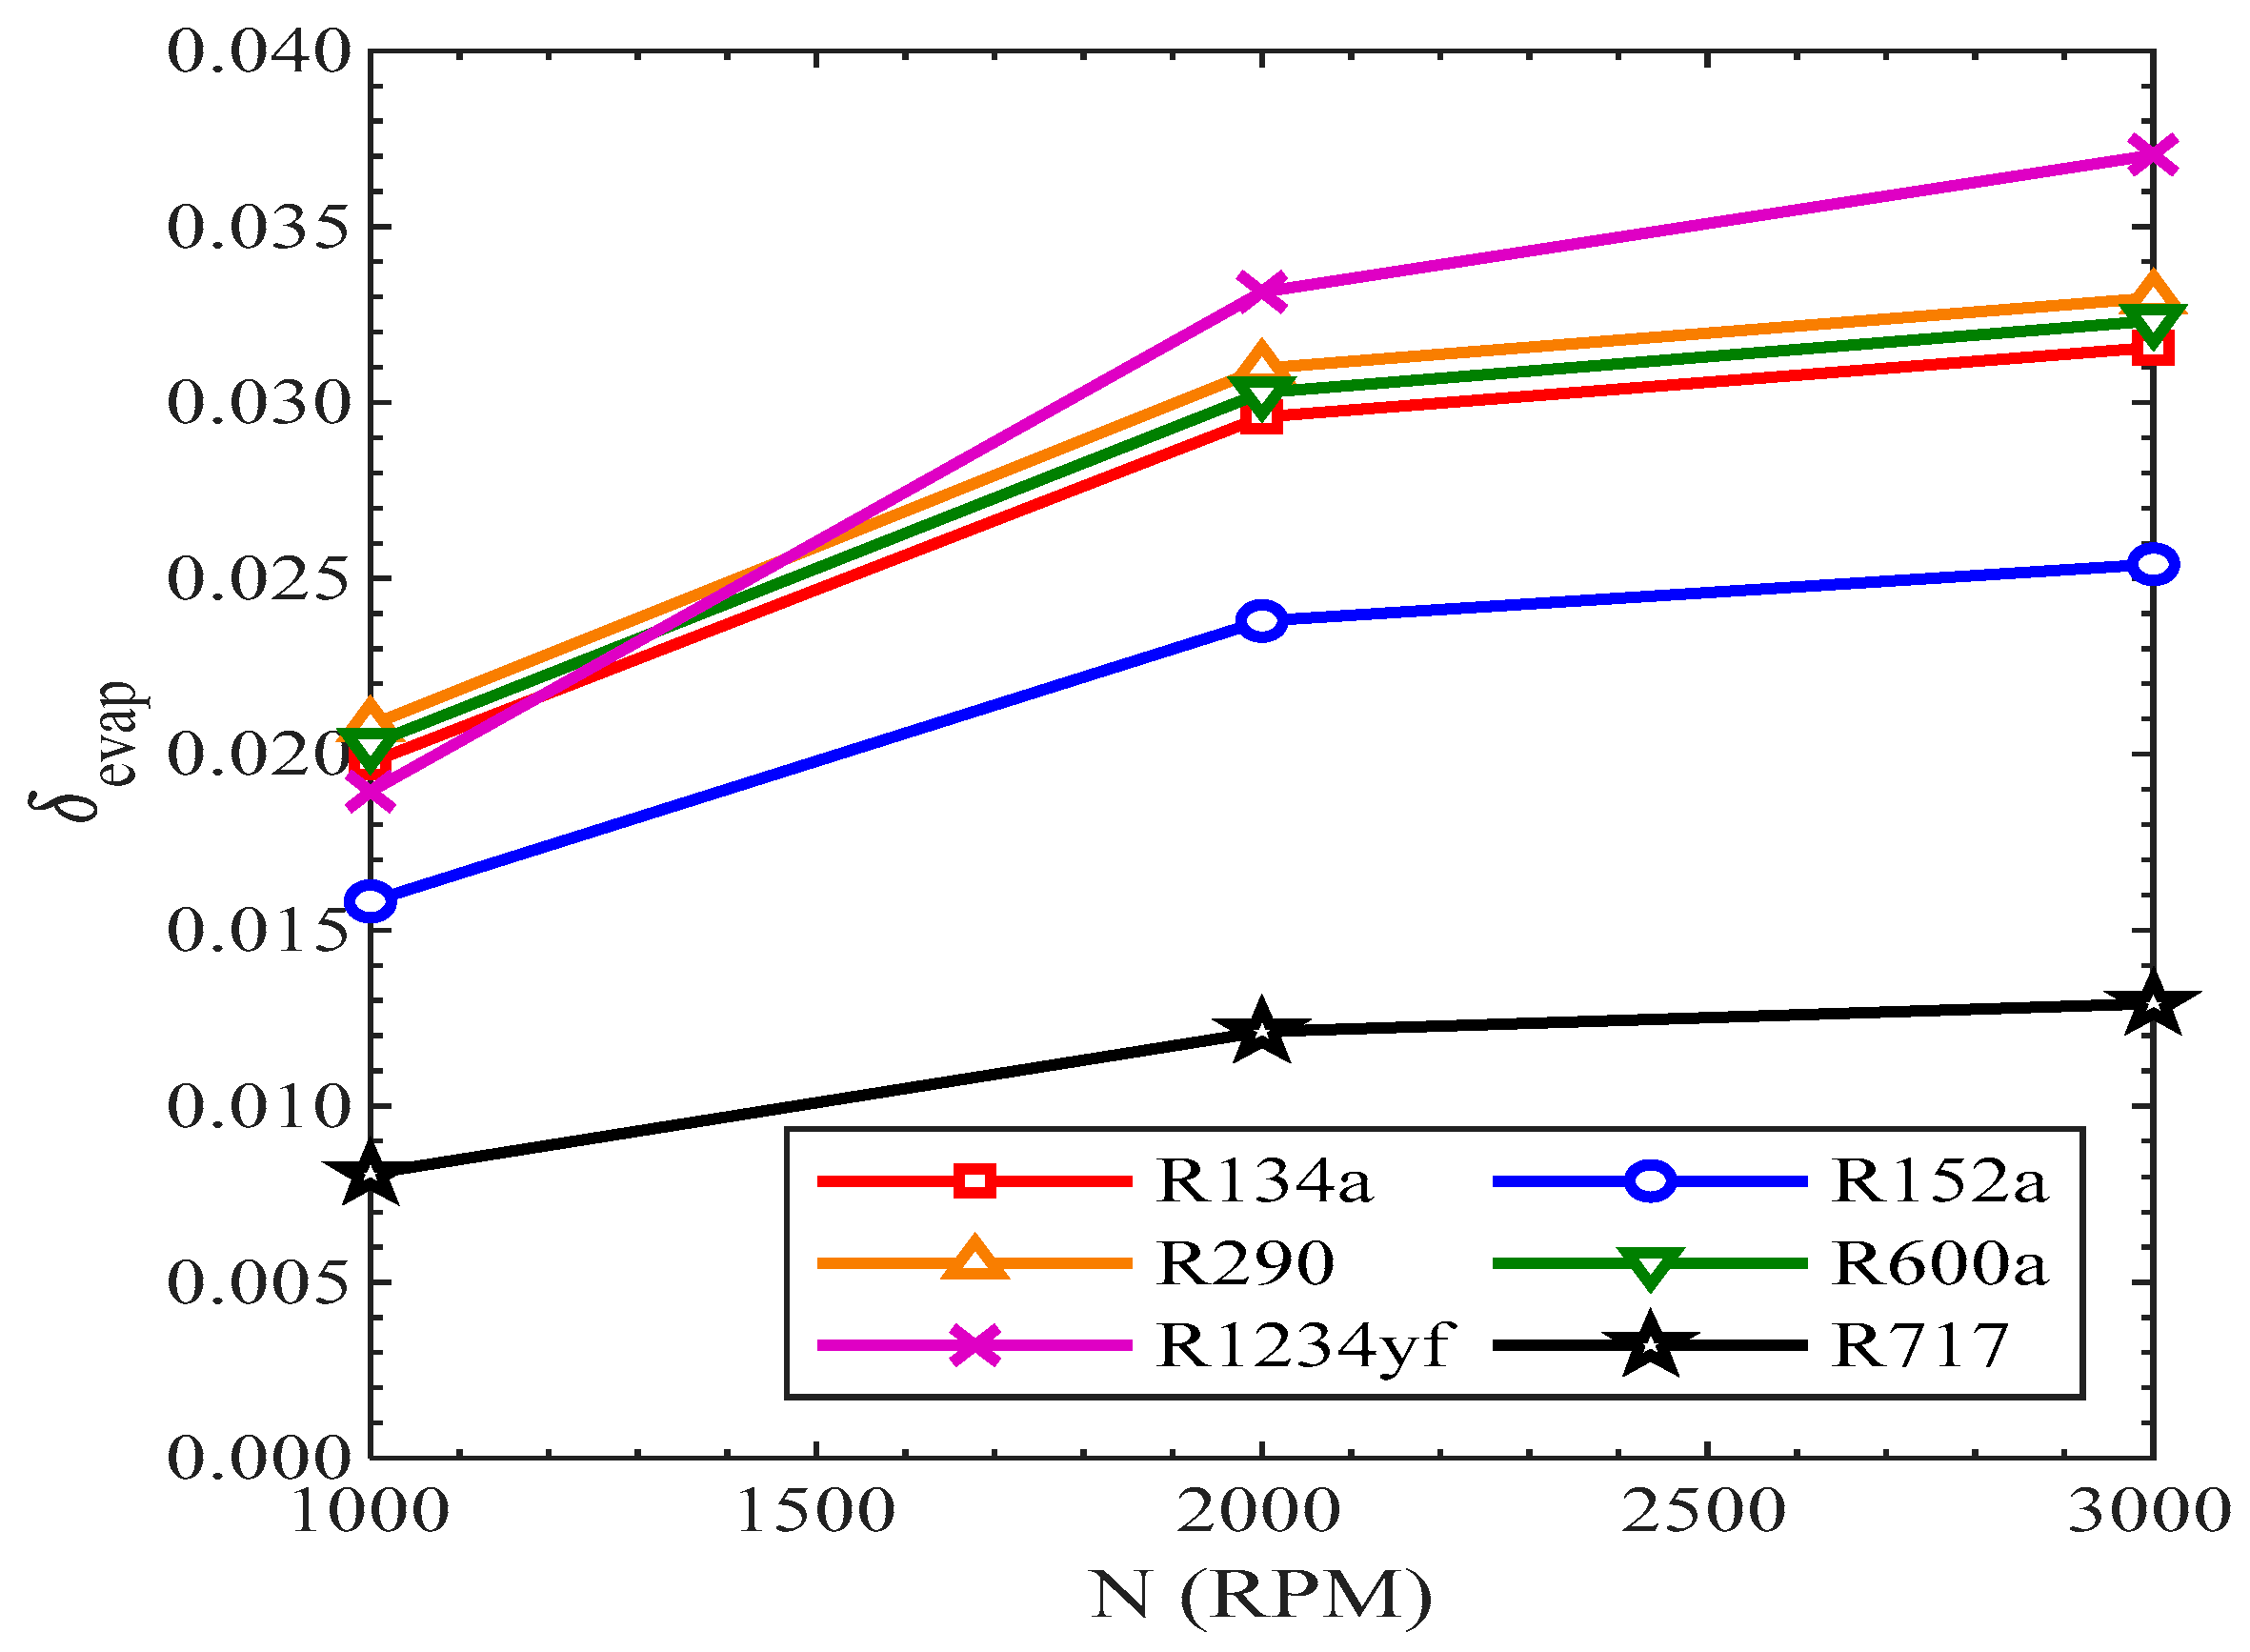
3.3.6. Efficiency Defect

The parameter used to estimate the correlations between the irreversibilities of components and their impacts on the efficiency of a refrigeration system is known as the efficiency defect. It is the ratio between the irreversibility of the component to the work of the compressor. As the speed of the compressor increased, both the irreversibility of the component and the work of compressor were increased, which resulted in an increased flow rate of the refrigerants. The irreversibility of the compressor was increased more than the increase in work of the compressor. This is the reason that the efficiency defect of the compressor was increased with the rise in revolutions of the compressor. As in Figure 18, the highest efficiency defect was in R1234yf, while it was lowest for R717 from 1000 RPM to 3000 RPM.
Figure 19 presents the variation of efficiency defect with the compressor speed. The efficiency defect of the condenser also rose with the rise in revolutions of the compressor for all the refrigerants, excluding R1234yf, as shown in Figure 19. On the contrary, the efficiency defect of R1234yf was reduced with the rise in the speed of the compressor. The efficiency defect in the condenser was highest for R717, while it was lowest for R600a from 1000 RPM to 3000 RPM.
On the contrary, the efficiency defect of the expansion valve was reduced with the rise in revolutions of the compressor, as shown in Figure 20. All the refrigerants showed the same decreasing trend with the rise in revolutions of the compressor. The efficiency defect in the expansion valve was highest for R1234yf, while it was lowest for R717 from 1000 RPM to 3000 RPM.
The efficiency defect in the evaporator was also enhanced with the rise in revolutions of the compressor, as presented in Figure 21. All the refrigerants showed the same increasing trend of efficiency defect with the rise in revolutions of the compressor. At 3000 RPM, the efficiency defect in the evaporator was highest for R1234yf, while it was lowest for R717.
In the literature, most articles have studied the basis of condenser and evaporator temperatures. However, some papers have studied the effects of wind speed and mass flow rates of refrigerants. In the present article, the exergy and first-law parameters were examined on the basis of compressor speed. Moreover, six different refrigerants were studied simultaneously, where the condenser and evaporator temperatures remained constant.
The study showed that the refrigerant R152a may be used as a replacement for refrigerant R134a because it had zero ozone depletion potential, as well as low global warming potential with low energy destruction and irreversibilities. It was evident that the global warming potential of R134a was 1410, which was far greater than the global warming potential of R152a. The contribution of this study is that it identified the most suitable replacement for R134a that had high benefits in terms of environmental friendliness, with less energy destruction and irreversibilities. This is a great step in the refrigeration industry to save the environment from the greenhouse gases. Most articles have presented exergy analyses with respect to condenser and evaporator temperatures. The present article represented the exergy destruction with respect to compressor speed.

4. Conclusions

A first- and second-law analysis was presented to estimate the exergy destruction, exergy efficiency, and irreversibilities of all the components, as well as of a vapor compression refrigeration system. The analysis was performed on six different refrigerants at various compressor speeds of 1000, 2000, and 3000 RPM, and low-GWP refrigerants were used as replacements for R134. Some estimated remarks were made as follows: The cooling capacity of the refrigerants at the fixed condenser and evaporator temperatures increased with the rise in speed of the compressor. The refrigeration effects of R1234yf and R600a were smaller than that of R134a, while the refrigeration effects of R290 and R717 were greater than that of R134a. The refrigeration effect of R717 was the highest among all the refrigerants. The discharge temperature increased at fixed evaporator and condenser temperatures with the rise in revolutions of the compressor. The discharge temperatures of R1234yf and R600a were smaller than that of R134a, while the discharge temperatures of R717 and R152a were higher than that of R134a. The COP values for R717 and R290 were higher than that of R134a, while all the other refrigerants had COP values smaller than that of R134a. The COP values of the refrigerants reduced with the increase in the speed of the compressor. The total exergy destruction rate rose with the rise in compressor speed. The total exergy destruction rates of R152a and R600a were less than that of R134a, while for the other refrigerants, they were greater than that of R134a. The relative exergy destruction rates of the compressor, evaporator, and condenser rose with the rise in revolutions of the compressor, but on the contrary, it decreased with the rise in revolutions of the compressor for the expansion valve. The relative exergy destruction rate of the compressor was greatest, and it was lowest for the condenser. The second-law efficiency reduced with the rise in compressor speed. The second-law efficiencies of R600a, R152a, and R717 were higher than that of R134a, but they were smaller than R134a for R290 and R1234yf. The second-law efficiency of R717 was highest, while it was lowest for R1234yf. The efficiency defects of the compressor, condenser, and evaporator increased with the rise in revolutions of the compressor. On the contrary, the efficiency defect of the expansion valve decreased with the rise in speed of the compressor. Finally, it was estimated that refrigerant R717 could not be replacement for R134 due to its poisoning effect; it may not be used with copper material, and it has a high discharge temperature. The only replacement for R134a could be R152a due to a low GWP, as well as suitable COP and cooling capacity values. It was estimated that R152 was a suitable replacement for R134a and could be used commercially due to its low GWP and ODP values, as well as having less having less exergy destruction and entropy generation. The only drawback of R152a is its inflammable property. It contains fluorine in its molecular structure. The combustion of R152a produces harmful hydrogen fluoride gas; therefore, in order to avoid combustion, safe use of R152a is needed. According to the International Energy Agency, in addition to the deployment of climate-friendly cooling equipment with or without natural refrigerants [39,40,41,42,43,44], the presented considerations on the use of refrigerants with a low global warming potential are in line with the Net Zero Emissions by 2050 scenario [45].

Author Contributions

Conceptualization, T.A. and M.R.; methodology, T.A. and M.R.; validation, T.A. and M.R.; formal analysis, J.K. and W.M.A.; investigation, T.A. and M.R.; resources, T.A. and M.R.; data curation, T.A. and M.R.; writing—original draft preparation, T.A., M.R., H.Z.N., F.R. and M.S.; writing—review and editing, J.K. and W.M.A.; visualization, T.A., M.R., A.H., H.Z.N., F.R. and M.S.; supervision, T.A., M.R., W.M.A. and J.K.; project administration, A.H., H.Z.N., F.R., W.M.A. and M.S. All authors have read and agreed to the published version of the manuscript.

Funding

This research received no external funding.

Conflicts of Interest

The authors declare no conflict of interest.

Appendix A. EES Code for R134a

“R134a”
$REFERENCE R134a IIR“reference state for refrigerant”
R$ = ‘R134a’
disp_comp = 120E-6 [m^3/rev]“compressor displacement”
dT [1..3] = [1,2,3]“degree of superheat”
ettacomp [1..3] = [0.75,0.65,0.55]
N [1..3] = [1000,2000,3000]“engine speed”
T_evap = ConvertTEMP(C,K,5)“evap. sat. temp.”
T_cond = ConvertTEMP(C,K,50)“cond. sat. temp. “
T_o = ConvertTEMP(C,K,25)
DUPLICATE i = 1,3
T1[i] = T_evap+dT[i]
P1[i] = P_sat(R$,T = T_evap)
s1[i] = Entropy(R$,T = T1[i],P = P1[i])
h1[i] = Enthalpy(R$,T = T1[i],P = P1[i])
s_2s[i] = s1[i]
P2[i] = P_sat(R$,T = T_cond)
T_2s[i] = Temperature(R$, P = P2[i],s = s_2s[i])
T_sat[i] = T_sat(R$,P = P2[i])
h_2s[i] = Enthalpy(R$,T = T_2s[i],s = s_2s[i])
h2[i] = (h_2s[i]-h1[i])/ettacomp[i]+h1[i]
T2[i] = Temperature(R$,P = P2[i],h = h2[i])
s2[i] = Entropy(R$,P = P2[i],h = h2[i])
P3[i] = P2[i]
T3[i] = T_sat(R$,P = P3[i])
h3[i] = Enthalpy(R$,T = T3[i],x = 1)
s3[i] = Entropy(R$,T = T3[i],x = 1)
P4[i] = P3[i]
T4[i] = T_sat(R$,P = P4[i])
s4[i] = Entropy(R$,P = P4[i],x = 0)
h4[i] = Enthalpy(R$,P = P4[i],x = 0)
P5[i] = P4[i]
T5[i] = T4[i]-dT[i]
s5[i] = Entropy(R$,T = T4[i]-dT[i],P = P4[i])
h5[i] = Enthalpy(R$,T = T4[i]-dT[i],P = P4[i])
h6[i] = h5[i]
s6[i] = Entropy(R$,T = T_evap,h = h6[i])
T6[i] = T_evap
T8[i] = T1[i]
P6[i] = P_sat(R$,T = T_evap)
P7[i] = P6[i]
h7[i] = Enthalpy(R$,P = P7[i],x = 1)
s7[i] = Entropy(R$,P = P7[i],x = 1)
T7[i] = Temperature(R$,P = P7[i],x = 1)
P8[i] = P1[i]
h8[i] = h1[i]
s8[i] = s1[i]
rho_refrigerant[i] = Density(R$,T = T1[i],P = P1[i])“density of refrigerant at state point 1”
m_dot[i] = ((N[i])*(disp_comp)*(rho_refrigerant[i])*ettacomp[i])/(60[sec/minute])
“mass flow rate of refrigerant”
Q_evap[i] = m_dot[i]*(h7[i]-h6[i])
“cooling capacity”
P_input[i] =m_dot[i]*(h_2s[i]-h1[i])/ettacomp[i]
“power input”
COP[i] = Q_evap[i]/P_input[i]
“COP”
X_dot_destr_comp[i] = T_o*m_dot[i]*(s2[i]-s1[i])“exergy destruction in compressor”
eta_comp[i] = 1-X_dot_destr_comp[i]/P_input[i]“compressor second-law efficiency”
Q_cond[i] = m_dot[i]*(h2[i]-h5[i])
X_dot_destr_cond[i] = T_o*(m_dot[i]*(s5[i]-s2[i])+Q_cond[i]/T_avg,cond[i])
“exergy destruction in condenser”
X_dot_diff_cond[i] = m_dot[i]*((h2[i]-h5[i])-T_o*(s2[i]-s5[i]))
eta_cond[i] = 1-X_dot_destr_cond[i]/X_dot_diff_cond[i]“condenser second-law efficiency”
X_dot_destr_exp.valve[i] = T_o*m_dot[i]*(s6[i]-s5[i])“exergy destruction in expansion valve”
X_dot_diff_exp.valve[i] = T_o*m_dot[i]*(s6[i]-s5[i])
eta_exp.valve[i] = 1-X_dot_destr_exp.valve[i]/X_dot_diff_exp.valve[i]
“exapnsion valve second-law efficiency”
X_dot_destr_evap[i] = T_o*(m_dot[i]*(s1[i]-s6[i])-Q_evap[i]/T_avg,evap)
“exergy destruction in evaporator”
X_dot_diff_evap[i] = m_dot[i]*((h6[i]-h1[i])-T_o*(s6[i]-s1[i]))
eta_evap[i] = 1-X_dot_destr_evap[i]/X_dot_diff_evap[i]“evaporator second-law efficiency”
X_dot_destr_total[i] = X_dot_destr_comp[i] + X_dot_destr_cond[i] + X_dot_destr_exp.valve[i] + X_dot_destr_evap[i]“total exergy destruction”
eta_system[i] = 1-X_dot_destr_total[i]/P_input[i]“second-law efficiency of system”
“relative exergy destruction rate in each component”
X_dot_destr_relative.comp[i] =X_dot_destr_comp[i]/X_dot_destr_total[i]
“compressor”
X_dot_destr_relative.cond[i] =X_dot_destr_cond[i]/X_dot_destr_total[i]
“condenser”
X_dot_destr_relative.evalve[i] = X_dot_destr_exp.valve[i]/X_dot_destr_total[i]
“expansion valve”
X_dot_destr_relative.evap[i] = X_dot_destr_evap[i]/X_dot_destr_total[i]
“evaporator”
“efficiency defect in each component”
delta_comp[i] = X_dot_destr_comp[i]/P_input[i]“compressor”
delta_cond[i] = X_dot_destr_cond[i]/P_input[i]“condenser”
delta_exp.valve[i] = X_dot_destr_exp.valve[i]/P_input[i]“expansion valve”
delta_evap[i] = X_dot_destr_evap[i]/P_input[i]“evaporator”
“exergy rate of product”
E_dot_p[i] = (1-T_o/T_evap)*Q_evap[i]
“exergy destruction ratio”
EDR[i] = X_dot_destr_total[i]/E_dot_p[i]
END
$copytoLookup/T/R/C Results N 1 N [1..3]
$copytoLookup/R/C Results COP 1 COP [1..3]
$copytoLookup/R/C Results Cooling-capacity 1 Q_evap [1..3]
$copytoLookup/R/C Results X_dot_destr_comp 1 X_dot_destr_comp [1..3]
$copytoLookup/R/C Results X_dot_destr_cond 1 X_dot_destr_cond [1..3]
$copytoLookup/R/C Results X_dot_destr_exp.valve 1 X_dot_destr_exp.valve [1..3]
$copytoLookup/R/C Results X_dot_destr_evap 1 X_dot_destr_evap [1..3]
$copytoLookup/R/C Results X_dot_destr_total 1 X_dot_destr_total [1..3]
$copytoLookup/R/C Results eta_comp 1 eta_comp [1..3]
$copytoLookup/R/C Results eta_cond 1 eta_cond [1..3]
$copytoLookup/R/C Results eta_exp.valve 1 eta_exp.valve [1..3]
$copytoLookup/R/C Results eta_evap 1 eta_evap [1..3]
$copytoLookup/R/C Results eta_system 1 eta_system [1..3]
$copytoLookup/R/C Results X_dot_destr_relative.comp 1 X_dot_destr_relative.comp [1..3]
$copytoLookup/R/C Results X_dot_destr_relative.cond 1 X_dot_destr_relative.cond [1..3]
$copytoLookup/R/C Results X_dot_destr_relative.evalve 1 X_dot_destr_relative.evalve [1..3]
$copytoLookup/R/C Results X_dot_destr_relative.evap 1 X_dot_destr_relative.evap [1..3]
$copytoLookup/R/C Results delta_comp 1 delta_comp [1..3]
$copytoLookup/R/C Results delta_cond 1 delta_cond [1..3]
$copytoLookup/R/C Results delta_exp.valve 1 delta_exp.valve [1..3]
$copytoLookup/R/C Results delta_evap 1 delta_evap [1..3]
$copytoLookup/R/C Results E_dot_p 1 E_dot_p [1..3]
$copytoLookup/R/C Results EDR 1 EDR [1..3]
$SAVELOOKUP Results ‘D:\Study\MSc Mechanical Engg\Rashid paper\Results from EES\R134a.xlsx’

References

  1. Rowland, F.S. Stratospheric ozone depletion by chlorofluorocarbons. Ambio 1990, 19, 281–292. [Google Scholar]
  2. Johnson, E. Global warming from HFC. Environ. Impact Assess. Rev. 1998, 18, 485–492. [Google Scholar] [CrossRef]
  3. Yu, C.-C.; Teng, T.-P. Retrofit assessment of refrigerator using hydrocarbon refrigerants. Appl. Therm. Eng. 2014, 66, 507–518. [Google Scholar] [CrossRef]
  4. Calm, J.M.; Hourahan, G. Refrigerant data update. Hpac Eng. 2007, 79, 50–64. [Google Scholar]
  5. Calm, J.M. The next generation of refrigerants–Historical review, considerations, and outlook. Int. J. Refrig. 2008, 31, 1123–1133. [Google Scholar] [CrossRef]
  6. Qi, Z. Performance improvement potentials of R1234yf mobile air conditioning system. Int. J. Refrig. 2015, 58, 35–40. [Google Scholar] [CrossRef]
  7. Purohit, N.; Gullo, P.; Dasgupta, M.S. Comparative Assessment of Low-GWP Based Refrigerating Plants Operating in Hot Climates. Energy Procedia 2017, 109, 138–145. [Google Scholar] [CrossRef] [Green Version]
  8. Oberthür, S.; Ott, H.E. The Kyoto Protocol: International Climate Policy for the 21st Century; Springer Science & Business Media: Cham, Switzerland, 1999. [Google Scholar]
  9. Sumeru, K.; Sunardi, C.; Aziz, A.A.; Nasution, H.; Abioye, A.M.; Said, M.F.M. Comparative Performance between R134a and R152a in an Air Conditioning System of A Passenger Car. J. Teknol. 2016, 78, 10–12. [Google Scholar] [CrossRef] [Green Version]
  10. Aized, T.; Hamza, A. Thermodynamic Analysis of Various Refrigerants for Automotive Air Conditioning System. Arab. J. Sci. Eng. 2019, 44, 1697–1707. [Google Scholar] [CrossRef]
  11. Brown, J.S.; Yana-Motta, S.F.; Domanski, P.A. Comparitive analysis of an automotive air conditioning systems operating with CO2 and R134a. Int. J. Refrig. 2002, 25, 19–32. [Google Scholar] [CrossRef]
  12. Joudi, K.A.; Mohammed, A.S.K.; Aljanabi, M.K. Experimental and computer performance study of an automotive air conditioning system with alternative refrigerants. Energy Convers. Manag. 2003, 44, 2959–2976. [Google Scholar] [CrossRef]
  13. Lee, G.; Yoo, J. Performance analysis and simulation of automobile air conditioning system. Int. J. Refrig. 2000, 23, 243–254. [Google Scholar] [CrossRef]
  14. Yataganbaba, A.; Kilicarslan, A.; Kurtbaş, I. Exergy analysis of R1234yf and R1234ze as R134a replacements in a two evaporator vapour compression refrigeration system. Int. J. Refrig. 2015, 60, 26–37. [Google Scholar] [CrossRef]
  15. Belman-Flores, J.; Rangel-Hernandez, V.H.; Usón, S.; Rubio-Maya, C. Energy and exergy analysis of R1234yf as drop-in replacement for R134a in a domestic refrigeration system. Energy 2017, 132, 116–125. [Google Scholar] [CrossRef]
  16. Golzari, S.; Kasaeian, A.; Daviran, S.; Mahian, O.; Wongwises, S.; Sahin, A.Z. Second law analysis of an automotive air conditioning system using HFO-1234yf, an environmentally friendly refrigerant. Int. J. Refrig. 2017, 73, 134–143. [Google Scholar] [CrossRef]
  17. Jemaa, R.B.; Mansouri, R.; Boukholda, I.; Bellagi, A. Energy and exergy investigation of R1234ze as R134a replacement in vapor compression chillers. Int. J. Hydrogen Energy 2017, 42, 12877–12887. [Google Scholar] [CrossRef]
  18. Kaynakli, O.; Horuz, I. An Experimental Analysis of Automotive Air Conditioning System. Int. Commun. Heat Mass Transf. 2003, 30, 273–284. [Google Scholar] [CrossRef]
  19. Alkan, A.; Hosoz, M. Comparative performance of an automotive air conditioning system using fixed and variable capacity compressors. Int. J. Refrig. 2010, 33, 487–495. [Google Scholar] [CrossRef]
  20. Riaz, F.; Yam, F.; Qyyum, M.; Shahzad, M.; Farooq, M.; Lee, P.; Lee, M. Direct Analytical Modeling for Optimal, On-Design Performance of Ejector for Simulating Heat-Driven Systems. Energies 2021, 14, 2819. [Google Scholar] [CrossRef]
  21. Hosoz, M.; Kaplan, K.; Aral, M.C.; Suhermanto, M.; Ertunc, H.M. Support vector regression modeling of the performance of an R1234yf automotive air conditioning system. Energy Procedia 2018, 153, 309–314. [Google Scholar] [CrossRef]
  22. McLinden, M.O.; Kazakov, A.F.; Brown, J.S.; Domanski, P.A. A thermodynamic analysis of refrigerants: Possibilities and tradeoffs for Low-GWP refrigerants. Int. J. Refrig. 2014, 38, 80–92. [Google Scholar] [CrossRef]
  23. Navarro-Esbrí, J.; Molés, F.; Barragán-Cervera, Á. Experimental analysis of the internal heat exchanger influence on a vapour compression system performance working with R1234yf as a drop-in replacement for R134a. Appl. Therm. Eng. 2013, 59, 153–161. [Google Scholar] [CrossRef]
  24. Chen, X.; Liang, K.; Li, Z.; Zhao, Y.; Xu, J.; Jiang, H. Experimental assessment of alternative low global warming potential refrigerants for automotive air conditioners application. Case Stud. Therm. Eng. 2020, 22, 100800. [Google Scholar] [CrossRef]
  25. Hinze, J.F.; Klein, S.A.; Nellis, G.F. Thermodynamic optimization of mixed refrigerant Joule- Thomson systems constrained by heat transfer considerations. IOP Conf. Ser. Mater. Sci. Eng. 2015, 101, 012133. [Google Scholar] [CrossRef] [Green Version]
  26. Riaz, F.; Tan, K.H.; Farooq, M.; Imran, M.; Lee, P.S. Energy Analysis of a Novel Ejector-Compressor Cooling Cycle Driven by Electricity and Heat (Waste Heat or Solar Energy). Sustainability 2020, 12, 8178. [Google Scholar] [CrossRef]
  27. Gullo, P.; Cortella, G. Theoretical evaluation of supermarket refrigeration systems using R1234ze(E) as an alternative to high-global warming potential refrigerants. Sci. Technol. Built Environ. 2016, 22, 1145–1155. [Google Scholar] [CrossRef]
  28. Trott, A.R.; Welch, T.C. Refrigeration and Air Conditioning; Elsevier Science: Amsterdam, The Netherlands, 1999. [Google Scholar]
  29. Deymi-Dashtebayaz, M.; Sulin, A.; Ryabova, T.; Sankina, I.; Farahnak, M.; Nazeri, R. Energy, exergoeconomic and environmental optimization of a cascade refrigeration system using different low GWP refrigerants. J. Environ. Chem. Eng. 2021, 9, 106473. [Google Scholar] [CrossRef]
  30. Dincer, I.; Midilli, A.; Kucuk, H. Progress in Exergy, Energy, and the Environment; Springer International Publishing: Berlin/Heidelberg, Germany, 2014. [Google Scholar]
  31. Riaz, F.; Qyyum, M.; Bokhari, A.; Klemeš, J.; Usman, M.; Asim, M.; Awan, M.; Imran, M.; Lee, M. Design and Energy Analysis of a Solar Desiccant Evaporative Cooling System with Built-In Daily Energy Storage. Energies 2021, 14, 2429. [Google Scholar] [CrossRef]
  32. Meng, Z.; Zhang, H.; Lei, M.; Qin, Y.; Qiu, J. Performance of low GWP R1234yf/R134a mixture as a replacement for R134a in automotive air conditioning systems. Int. J. Heat Mass Transf. 2018, 116, 362–370. [Google Scholar] [CrossRef]
  33. Arora, A.; Sachdev, H.L. Thermodynamic analysis of R422 series refrigerants as alternative refrigerants to HCFC22 in a vapour compression refrigeration system. Int. J. Energy Res. 2009, 33, 753–765. [Google Scholar] [CrossRef]
  34. Saravanakumar, R.; Selladurai, V. Exergy analysis of a domestic refrigerator using eco-friendly R290/R600a refrigerant mixture as an alternative to R134a. J. Therm. Anal. Calorim. 2014, 115, 933–940. [Google Scholar] [CrossRef]
  35. Arora, A.; Kaushik, S. Theoretical analysis of a vapour compression refrigeration system with R502, R404A and R507A. Int. J. Refrig. 2008, 31, 998–1005. [Google Scholar] [CrossRef]
  36. Baakeem, S.S.; Orfi, J.; Alabdulkarem, A. Optimization of a multistage vapor-compression refrigeration system for various refrigerants. Appl. Therm. Eng. 2018, 136, 84–96. [Google Scholar] [CrossRef]
  37. Ally, M.R.; Munk, J.D.; Baxter, V.D.; Gehl, A.C. Exergy and energy analysis of a ground-source heat pump for domestic water heating under simulated occupancy conditions. Int. J. Refrig. 2013, 36, 1417–1430. [Google Scholar] [CrossRef]
  38. Riaz, F.; Lee, P.S.; Chou, S.K.; Ranjan, R.; Tay, C.S.; Soe, T. Analysis of Low-Grade Waste Heat Driven Systems for Cooling and Power for Tropical Climate. Energy Procedia 2017, 143, 389–395. [Google Scholar] [CrossRef]
  39. Sztekler, K.; Kalawa, W.; Nowak, W.; Mika, L.; Gradziel, S.; Krzywanski, J.; Radomska, E. Experimental Study of Three-Bed Adsorption Chiller with Desalination Function. Energies 2020, 13, 5827. [Google Scholar] [CrossRef]
  40. Krzywanski, J.; Grabowska, K.; Sosnowski, M.; Żyłka, A.; Sztekler, K.; Kalawa, W.; Wójcik, T.; Nowak, W. Modeling of a re-heat two-stage adsorption chiller by AI approach. MATEC Web Conf. 2018, 240, 05014. [Google Scholar] [CrossRef]
  41. Kulakowska, A.; Pajdak, A.; Krzywanski, J.; Grabowska, K.; Zylka, A.; Sosnowski, M.; Wesolowska, M.; Sztekler, K.; Nowak, W. Effect of Metal and Carbon Nanotube Additives on the Thermal Diffusivity of a Silica Gel-Based Adsorption Bed. Energies 2020, 13, 1391. [Google Scholar] [CrossRef] [Green Version]
  42. Skrobek, D.; Krzywanski, J.; Sosnowski, M.; Kulakowska, A.; Zylka, A.; Grabowska, K.; Ciesielska, K.; Nowak, W. Prediction of Sorption Processes Using the Deep Learning Methods (Long Short-Term Memory). Energies 2020, 13, 6601. [Google Scholar] [CrossRef]
  43. Grabowska, K.; Sosnowski, M.; Krzywanski, J.; Sztekler, K.; Kalawa, W.; Zylka, A.; Nowak, W. Analysis of heat transfer in a coated bed of an adsorption chiller. MATEC Web Conf. 2018, 240, 01010. [Google Scholar] [CrossRef] [Green Version]
  44. Sztekler, K.; Kalawa, W.; Nowak, W.; Mika, Ł.; Krzywański, J.; Grabowska, K.; Sosnowski, M.; Al-Harbi, A.A. Performance Evaluation of a Single-Stage Two-Bed Adsorption Chiller With Desalination Function. J. Energy Resour. Technol. 2021, 143, 082101. [Google Scholar] [CrossRef]
  45. Cooling—Analysis, IEA. (n.d.). Available online: https://www.iea.org/reports/cooling (accessed on 11 March 2022).
Figure 1. Schematic diagram of vapor compression cycle. (state 1: evaporator outlet and compressor inlet, state 2: compressor outlet and condenser inlet, state 3: condenser outlet and expansion valve inlet, state 4 (expansion valve outlet and evaporator inlet).
Energies 15 07246 g001
Figure 2. T-s diagram of vapor compression refrigeration cycle running with R134a.
Energies 15 07246 g002
Figure 3. P-h diagram of vapor compression refrigeration cycle running with R134a.
Energies 15 07246 g003
Figure 4. T-s diagram of vapor compression refrigeration cycle running with R152a.
Energies 15 07246 g004
Figure 5. P-h diagram of vapor compression refrigeration cycle running with R152a.
Energies 15 07246 g005
Figure 6. Comparison of COP values of systems running with R134a and R152a at different compressor speeds [9].
Energies 15 07246 g006
Figure 7. Comparison of discharge temperature vs. compressor speed [9].
Energies 15 07246 g007
Figure 8. Comparison of cooling capacity vs. compressor speed.
Energies 15 07246 g008
Figure 9. COP vs. compressor speed trends for various refrigerants.
Energies 15 07246 g009
Figure 10. Discharge temperature vs. compressor speed.
Energies 15 07246 g010
Figure 11. Cooling capacity vs. compressor speed for various refrigerants.
Energies 15 07246 g011
Figure 12. Total exergy destruction vs. compressor speed.
Energies 15 07246 g012
Figure 13. Relative exergy destruction of compressor vs. compressor speed.
Energies 15 07246 g013
Figure 14. Relative exergy destruction of condenser vs. compressor speed.
Energies 15 07246 g014
Figure 15. Relative exergy destruction of expansion valve vs. compressor speed.
Energies 15 07246 g015
Figure 16. Relative exergy destruction of evaporator vs. compressor speed.
Energies 15 07246 g016
Figure 17. Exergy efficiency vs. compressor speed.
Energies 15 07246 g017
Figure 18. Efficiency defect of compressor vs. compressor speed.
Energies 15 07246 g018
Figure 19. Efficiency defect of condenser vs. compressor speed.
Energies 15 07246 g019
Figure 20. Efficiency defect of expansion valve.
Energies 15 07246 g020
Figure 21. Efficiency defect evaporator vs. compressor speed.
Energies 15 07246 g021
Table 1. Comparison of parameters of refrigerants.
RefrigerantMolecular Weight kg/kmolODPGWPNormal Boiling Point (°C)Critical Temperature (°C)Critical Pressure (MPa)Group
R134a10201430−15214590HFC
R1234yf11404−29953.382HFO
R7171700−282711657B2L
R29044.103−44206617HC
R152a66.050140−25113.545.8HFC
R600a58.120310.8275529HC
Table 2. Input parameters.
ParameterValue
Compressor speed (N)1000 RPM, 2000 RPM, 3000 RPM
Evaporator temperature (TE)5 °C
Condenser temperature (TC)50 °C
Publisher’s Note: MDPI stays neutral with regard to jurisdictional claims in published maps and institutional affiliations.

