Abstract
Existing fractured gas reservoir development techniques are mainly based on dual medium numerical-simulation models, which can, to a certain extent, effectively simulate natural fractures with high fracture density; however, these models have some limitations, particularly in terms of simulating the fracture morphology and distribution. Considering carbonate gas reservoirs with complex fractures, in this paper, we establish a numerical-simulation model of embedded discrete-fracture seepage in horizontal wells of carbonate gas reservoirs, in order to compare and study the development effect of carbonate gas reservoirs under different horizontal well fracture parameters. The fracture distribution and structure in carbonate gas reservoirs is obtained using an ant-tracking approach based on 3D seismic bodies, and a numerical-simulation model based on the embedded discrete-fractures model is solved using the open-source program MRST. We considered the following parameters: half fracture length, fracture permeability, and horizontal segment length. By changing the fracture parameters of horizontal wells and comparing the gas-production trends, technical optimization in gas reservoir development can be realized. The results show that the embedded discrete-fracture model can effectively solve the difficult problem of characterizing fluid seepage in fractures of different scale in carbonate gas reservoirs. Although gas production increases with increasing fracture length, fracture conductivity, horizontal section length, and natural fracture conductivity, the contributions of these parameters to gas well production capacity are greatly influenced by the natural fractures.
1. Introduction
Deep carbonate gas plays an important role in global natural-gas development, but the focus of natural-gas development has been gradually shifting towards unconventional resources [1,2]. With the development of unconventional gas, the efficient development of carbonate gas reservoirs has become important for the replenishment of natural-gas production capacity. Fluid percolation in carbonate reservoirs is difficult to characterize due to the highly developed natural fractures in carbonate reservoirs [3]. Gas reservoir development is highly influenced by the uncertainty of fracture development, which makes the efficient development of carbonate gas reservoirs extremely constrained [4].
To reduce the uncertainty in gas reservoir development, numerical simulations are often used to predict reservoir development targets and to optimize well production [5,6]. Numerical simulation of a gas reservoir involves solving a mathematical model of gas reservoir seepage, through the use of numerical methods based on a fine geological description of the gas reservoir [7,8]. In this way, we can accurately portray the distribution and transport characteristics of pressure and fluid in a gas reservoir [9], as well as predict the development index of the gas reservoir [10]. Fractured carbonate gas reservoirs are naturally fractured, and accurate fracture simulation is required for numerical simulation of this type of gas reservoir [11,12]. In addition to natural fractures, carbonate reservoirs are also often artificially fractured by hydraulic fracturing [13,14], and the complexity of artificial and natural fractures makes reservoir modeling and production prediction difficult [15,16]. To accurately predict the main indicators for the development of fractured gas reservoirs, reliable fracture characterization methods and numerical simulation techniques are needed, in order to characterize both hydraulic and natural fractures [17,18,19,20]. Modeling of natural fractures in fractured reservoirs has been a difficult problem that has plagued researchers [21]. Traditional fracture modeling methods rely heavily on coring and logging data, which are costly to obtain and only applicable to the reservoir near the well perimeter, making such methods difficult to apply to the entire fractured reservoir [22]. Ant-tracking technology possesses advantages that conventional fracture modeling techniques do not have. It does not depend on the coring data of a single well, and through the fine interpretation of seismic data, the location of natural fractures within the range of seismic data can be more accurately portrayed [23,24,25]. This technology has been widely used and recognized in industry.
Since the introduction of the dual-media approach to petroleum engineering, ant-tracking technology it has been widely used for the numerical simulation of fractured reservoirs [26]. A mathematical model for the coupling of cave-flow and fracture-flow seepage in a seam-hole-type carbonate reservoir has been calculated using the finite volume method, and good application results were achieved [27]. A dual porosity model has been used to fit the history of fractured carbonate gas reservoirs with marginal bottom water, and the effect of the marginal bottom water on gas reservoir development was investigated [28]. It has been found that such models can, to some extent, effectively simulate natural fractured reservoirs with high fracture density, but cannot characterize the location or geometry of individual fractures; it is especially difficult to portray the fluid transport pattern in hydraulic fractures [29,30]. To address this problem, researchers have developed the discrete-fracture model (DFM); however, the presence of too many natural fractures can lead to sparse pathological matrices in the DFM during computation, which affects the computation speed [31,32,33]. Therefore, in this paper, we introduce the embedded discrete-fracture model (EDFM) [34,35,36], which assembles the fractures into a matrix grid, and the flow exchanges between the fractures and the matrix and between fractures are defined by non-adjacent connections (NNC). The computational efficiency and fluid-flow description of this method can allow for better results to be achieved [37]. However, the conventional embedded discrete-fractures model usually adopts the random fracture method, which cannot truly reflect the shape of underground fractures. Therefore, we use ant-tracking technology to obtain the real natural fractures, in order to ensure the accuracy of the model.
In this paper, we establish a more complete workflow for fractured carbonate reservoirs, and compared with previous studies, our research results can be more effectively applied to field construction. The complete workflow includes fracture extraction, model building, program solving, and field-development-process optimization. Compared with previous studies, we improved the fracture-extraction process, used ant-tracking technology to make the fracture more consistent with the real formation situation, and added economic-benefit evaluation. The real fracture distribution in the reservoir is obtained based on 3D seismic data using an ant-tracking technique, following which a numerical-simulation model of the fractured reservoir is constructed based on the embedded discrete-fracture model, and the model is solved using the open-source program MRST [38]. Finally, the development technology of a deep carbonate gas reservoir from the Sichuan Basin is optimized using the workflow proposed in this paper. The research results presented in this paper have significance for the efficient development of fractured gas reservoirs.
2. Mathematical Model
2.1. The Governing Equation
Assuming that only gas and water phases exist in the reservoir and do not dissolve each other, the fluid exhibits isothermal seepage. The rock reservoir is considered slightly compressible, while the fluid is compressible. The reservoir is heterogeneous and anisotropic, ignoring the influence of gravity and capillary forces. For a carbonate gas reservoir with Nf explicit hydraulic fractures, the fluid flow in the matrix is modeled by mass conservation equations [39]:
where the superscript m represents the matrix, the subscript α represents different fluid phases (g or w), t denotes time, is the fluid density (g/cm3), is the matrix porosity, denotes fluid saturation, is the divergence operator, is velocity of fluid movement (m/s), represents the source–sink term in the matrix [(m3/s)/m2], and represents the fluid exchange term of phase between matrix and fracture [(m3/s)/m2].
Nf mass conservation equations are used for the flows in fractures, where each fracture is represented by the index fi. For each fracture, the following conservation equation holds:
where the superscript represents the index of the fracture, represents the flow exchange between the fracture and well, represents the flow exchange between the fracture and matrix [(m3/s)/m2], and is the flow velocity of the fluid phase in medium . The seepage velocity in the carbonate gas reservoir is as follows:
where is the permeability of the medium (m−2), is the relative permeability of fluid phase , and is the viscosity of fluid phase .
2.2. Discretization of Finite Volume
We discretized the equation using the finite volume method, and rewrote the equation in the integral form of discrete element as follows [36]:
The flux between two adjacent grid cells and is as follows:
Two adjacent grid cells and are connected by a plane in the middle to form a region with area . The grid cells on both sides of the plane have two normal vectors and , respectively. For a given grid cell, the midpoint rule and Darcy’s law are used to approximate the expression on the cell surface, as follows:
where indicates the centroid of .
The pressure gradient of a single grid cell is determined using the difference between the centroid pressure of surfaces and the pressure at a point in the grid cell. The central pressure value of a single grid cell is equal to the average pressure of the whole grid cell; thus, the results are as follows:
The half-conductivity of grid is as follows:
The half-conductivity is related to a single cell, and provides a two-point relation between the flux across a cell face and the pressure difference between the cell and face centroids, as shown in Figure 1.
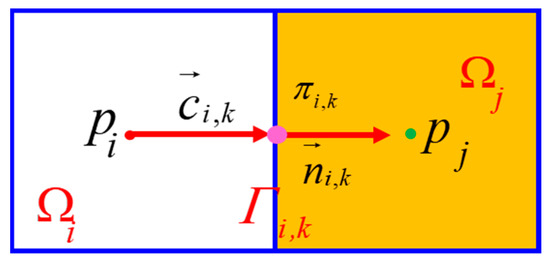
Figure 1.
Two cells used to define the matrix–matrix discretization.
Obviously, the relationship between and is , while the relationship between and is . This gives:
Combined with Equations (9) and (10), the interface pressure can be eliminated, and the two-point flux approximation (TPFA) format is as follows:
is the transmissibility associated with the connection between the two cells. The TPFA scheme uses two “points”—the cell averages pi and pj—to approximate the flux across the interface between cells and . The TPFA scheme in a compact form, obtains a set of cell averages that meet the following system of equations.
Where is the fluidity of phase , is the conductivity between cells and , and and are the pressures of cells and , respectively.
The conductivity between cells and can be calculated as follows:
where and are the half-surface conductivities of cells and , respectively.
For associated to each matrix and fracture cell, as shown in Figure 2, the fluid-phase motion is discretized by TPFA to obtain:
where and are the pressures of the matrix cell and fracture cell, respectively, and is the conductivity between the matrix cell and fracture cell, which is calculated using the following equation:
where is the harmonic mean value of the fracture and matrix permeability weighted by the pore volume (m−2), is the fluid exchange zone between the matrix and fracture cell pair (m2), and is the average vertical distance between the midpoint of the matrix and fracture cells (m).
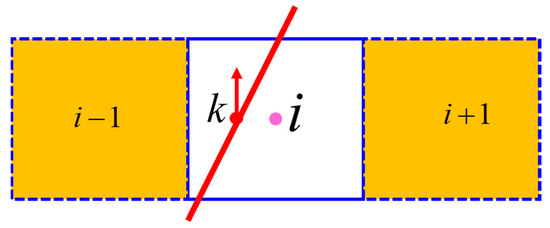
Figure 2.
Unit EDFM NNC fracture–matrix connectivity [40].
Similarly, the source–sink terms of wells can also be discretized in the same way:
where is the production index of the well, is the connection conductivity factor, is the pressure of the cell where the well is located, and is the bottom hole flow pressure.
2.3. Simulation Strategy
The solution of the model was completed using the open-source reservoir numerical simulation tool MRST; the solution process is depicted in Figure 3. Under the automatic differential framework of MRST, the residual of the implicit discrete scheme of Equation (1) is expressed as:
where div is the divergence operator in the automatic differential framework.
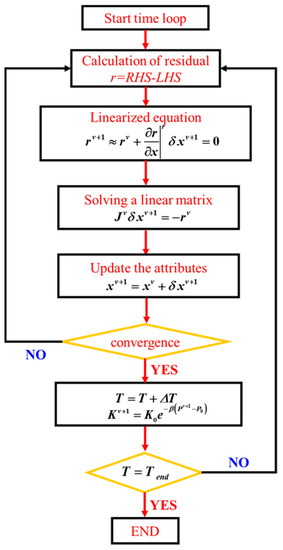
Figure 3.
Numerical simulation process of embedded discrete-fracture model.
The discrete form of flow, Equation (3) can be expressed as:
where grad is the gradient operator in the automatic differential framework.
With the help of the automatic differential framework, it is no longer necessary to write the coefficient matrix of the equation when solving the partial differential equations, and the code required to compute all of the Jacobian matrices is implicitly defined by the functions in MRST’s AD library. In this process, the AD library will correctly combine each seed Jacobian matrix and establish the Jacobian matrix for the whole system. We only need to extract the Jacobian matrix, calculate the Newtonian increment, and update the main unknowns to complete the iterative calculation.
3. Optimization of Workflow
Ants can secrete a pheromone, which is perceived by their companions during crawling. Therefore, the accumulation of pheromones increases the probability of companions choosing a certain path randomly when foraging, in order to obtain the optimal foraging path. It can be concluded that, by considering the way in which ants forage along tracks in the process of identifying faults, we can use an operator with similar functionality to an ant to detect fractures in seismic data. When the operator meets the preconditions of fracture tracking in the seismic data, it will mark the location and leave a pheromone; otherwise, the fracture-tracking conditions are not met and the location is not marked. Other operators continue to track the markers, according to preset criteria, until the fault and fracture structure recognition process is completed.
According to the ant-tracking results, the distribution of natural fractures around a single well can be obtained. According to the location relationship between the well and the fractures, the coordinates of the well and fractures and the distribution relationship between the single well and natural fractures can be obtained. In this way, we developed a numerical simulation software for the detection of embedded discrete fractures in a single well; the obtained ant-tracking model is depicted in Figure 4.
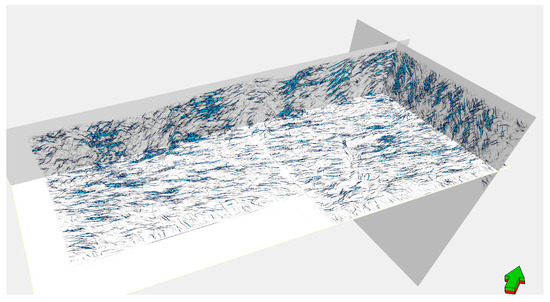
Figure 4.
Ant-tracking model extracted from seismic body.
Conventional fracture interpretation methods have various drawbacks, such as highly subjective judgments, a lack of fracture pattern clarity, and high time consumption. For this reason, in this paper, we adopt an ant-tracking method to finely portray the distribution pattern of fractures and the structural changes of fractures, such that the interpretation of fractures can be more accurate and reliable, increasing the objectivity of the results. The considered ant body is a kind of seismic attribute body which better highlights the discontinuous part of seismic-body data, such as faults and fractures. The process of ant-tracking is divided into four main steps. First, the seismic data are processed, mainly using median filtering, structural smoothing, and other methods to remove the random noise in the original seismic data, thus enhancing the lateral continuity of the seismic-phase axis, while preserving the boundary parts (e.g., faults). Next, boundary detection is performed, in which multiple boundary-detection techniques may be used to generate the variance body, through which the ant body is obtained. Then, the ant body is updated according to the geological features of the corresponding block. Finally, fracture extraction is realized by analyzing and calibrating the faults and fractures.
The embedded discrete-fracture numerical-simulation-model program was constructed based on the MATLAB programming language. According to the final results of ant-tracking deviation, the fractures near horizontal wells were mainly numerical, and a multi-fractured horizontal well was established. The fracture parameters were set according to the field conditions. The specific implementation process is shown in Figure 5.
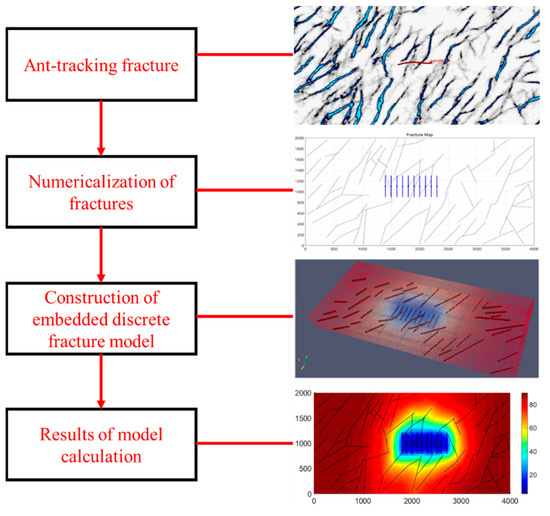
Figure 5.
Numerical simulation process of embedded discrete fracture.
In the process of hydraulic fracturing, due to the heterogeneity of the reservoir, the fracture aperture at different locations varies greatly. Fractures usually extend outward from the well, and the pore size gradually decreases, resulting in a decrease in the permeability of the fractures. In order to realize the change of fracture aperture in the numerical-simulation model, the change of fracture aperture is indirectly reflected by changing the permeability of the fracture grid in the grid model. In order to simulate this phenomenon, the permeability and aperture of the fracture grid are set to gradually decrease linearly from the wellbore to the end of the fracture, so as to realize the change of fracture aperture and make our numerical-simulation model more consistent with the real reservoir conditions, the variation of fracture aperture and permeability is shown in Figure 6.

Figure 6.
Variation of fracture aperture and permeability.
The seepage numerical simulation of carbonate gas reservoirs was realized using the open-source program MRST and MATLAB programming. Numerical simulation using MRST mainly includes three parts: model establishment and initialization of basic parameters, the core computing step, and simulation result post-processing.
4. Optimization of Parameters
Table 1 provides the input parameters that were used for the test cases with isothermal multiphase models. The phase permeability curve of the considered gas reservoir model is shown in Figure 7.

Table 1.
Input parameters of the fluid and rock properties for the isothermal multiphase flow.
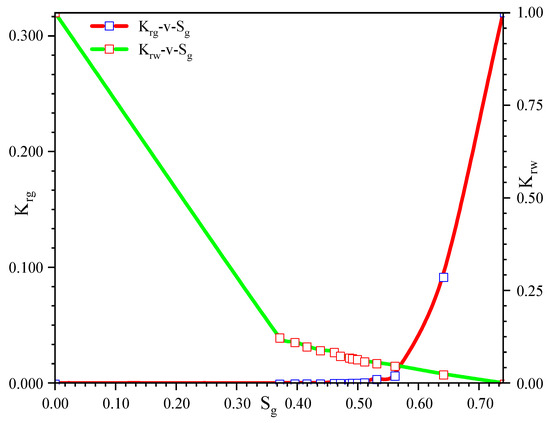
Figure 7.
Gas–liquid two–phase permeability curve.
4.1. Optimization of Well Location
Due to the strong heterogeneity in the distribution of natural fractures, different well locations will connect different natural fractures. In order to obtain the optimal production of gas wells, the optimal well location must be selected. The well placement is shown in Figure 8.
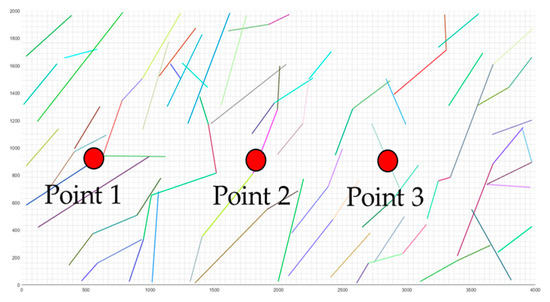
Figure 8.
We set three starting coordinates of the well location: the starting coordinate of the first well location was (600,900), the starting coordinate of the second well location is (1800,900), and the starting coordinate of the third well location is (2850,900).
Based on the embedded discrete-fracture numerical-simulation-model program, numerical-simulation models with different well locations were designed and development index results under different well locations obtained, as shown in Figure 9.
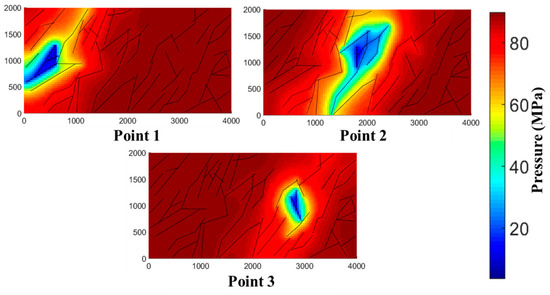
Figure 9.
Schematic diagrams of pressure-drop-vulnerability distribution for different well locations.
The comparison diagram of cumulative gas production under different well locations was obtained by numerical seepage simulation, as shown in Figure 10.
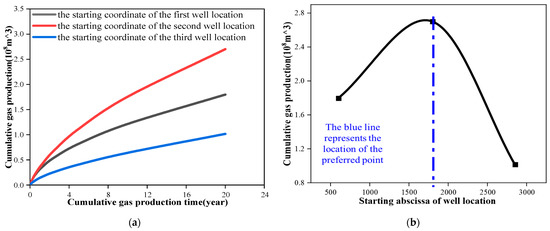
Figure 10.
(a) Comparison of cumulative production under different well locations and (b) schematic diagram of optimization of well location.
From the prediction and simulation results, the cumulative gas production at point 2 was larger than that at point 1 and point 3, and the well location set at the mining site was also point 2, indicating that the site well location setting was very reliable.
4.2. Optimization of Half-Fracture Length
Based on the embedded discrete-fracture numerical-simulation-model program, numerical-simulation models with half-lengths of 80 m, 100 m, 150 m, 200 m, and 250 m were designed and development index results under different crack lengths obtained, as shown in Figure 11.
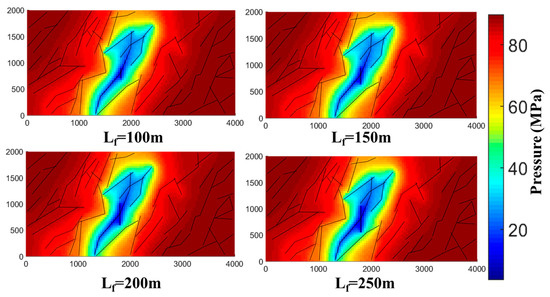
Figure 11.
Schematic diagrams of pressure- drop-vulnerability distribution for different half-fracture-length models.
The comparison diagram of cumulative gas production under different half-fracture lengths was obtained by numerical seepage simulation, as shown in Figure 12.
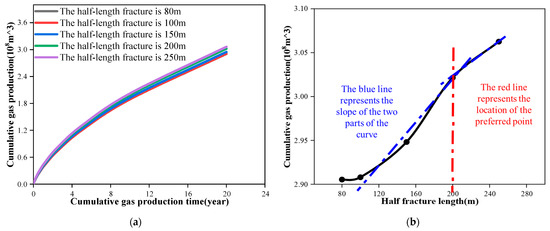
Figure 12.
(a) Comparison of cumulative production under different half-fracture lengths and (b) schematic diagram of optimization of half fracture length.
From the prediction and simulation results, as the half-fracture length increases, the cumulative gas production continues to increase; however, the growth trend gradually slows and, as the half-fracture length increases, the economic cost increases.
The economic benefit evaluation of different fracture parameters can intuitively describe the change of economic benefit produced under different schemes, allowing for selection of the best fracture parameters. This can not only further increase the production of the gas well, but also ensure that the maximum benefit is obtained from the well. According to the production simulation results under different fracture parameters, the economic benefit evaluation under different fracture parameters was carried out based on the economic-benefit-evaluation model. The economic benefit was evaluated mainly with respect to the NPV. The price of natural gas in our area is 2 yuan/m3. The NPV can be calculated as follows:
where CFt is the cash flow at time t ($), is the discount rate ($/year), and is number of periods (year).
The NPV under different half fracture lengths was obtained using Equation (19), as shown in Figure 13.
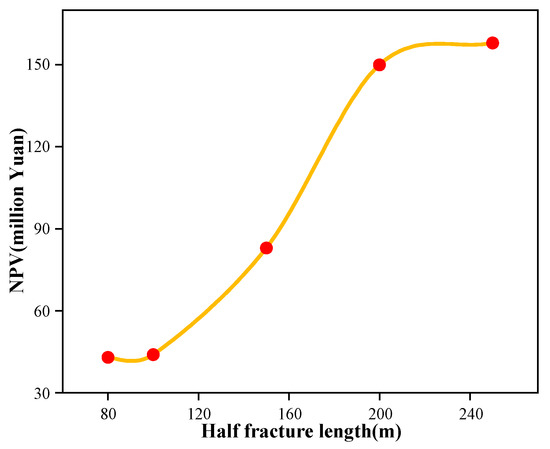
Figure 13.
Diagram of NPV variation with half fracture length.
Therefore, the comprehensive comparison and selection indicated that the economic benefit was optimized with a half-fracture length of 200 m.
4.3. Optimization of Fracture Permeability
Based on the embedded discrete-fracture numerical simulation, the designed fracture permeability was set as 2000 mD, 4000 mD, 6000 mD, 8000 mD, and 10,000 mD. Figure 14 shows schematic diagrams of the distribution of pressure-drop loopholes at the end of the prediction period under different fracture permeabilities.
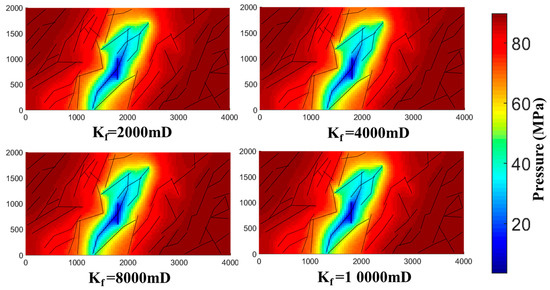
Figure 14.
Schematic diagrams of the distribution of pressure-drop loopholes at the end of the prediction period for different fracture-permeability models.
The results of the seepage numerical simulation yielded the cumulative gas production under different fracture permeabilities, as shown in Figure 15.
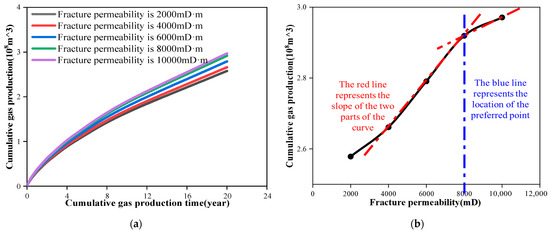
Figure 15.
(a) Comparison of cumulative production under different fracture permeabilities and (b) schematic diagram of fracture permeability optimization.
From the prediction results, the greater the fracture permeability, the greater the gas production. Through optimization of the fracture permeability (Figure 15b), the optimal fracture permeability was found to be 8000 mD.
The NPV under different fracture permeabilities was obtained using Equation (19), the results of which are shown in Figure 16.
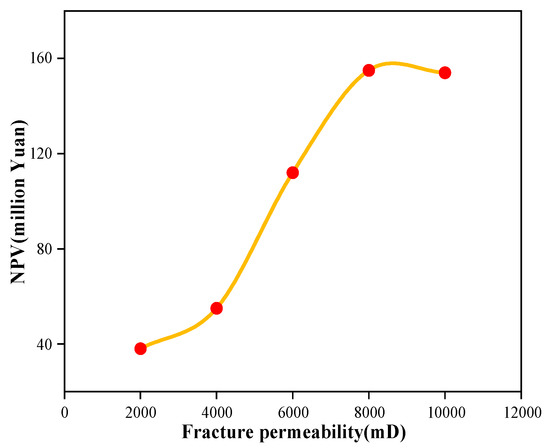
Figure 16.
NPV variation with fracture permeability.
Therefore, the comprehensive comparison and selection indicated that economic benefit was optimized with a fracture permeability of 8000 mD.
4.4. Optimization of Horizontal Length
Based on the embedded discrete-fracture numerical-simulation model program, the optimal half fracture length was 200 m and the optimal fracture conductivity was 8000 mD. Numerical-simulation models with horizontal section lengths of 400 m, 600 m, 800 m, 1000 m, and 1200 m were designed, and the development index results of different horizontal section lengths were obtained. Figure 17 provides schematic diagrams of the pressure-drop vulnerability distribution at the end of the prediction period for different horizontal length models.
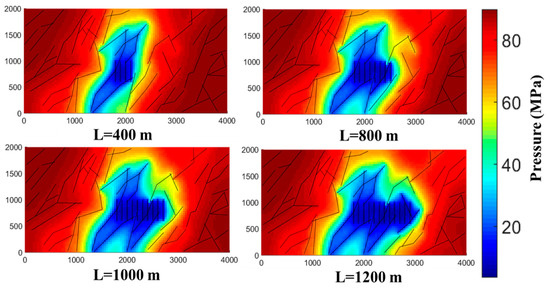
Figure 17.
Schematic diagrams of pressure-drop vulnerability distribution at the end of the prediction period for different horizontal length models.
The cumulative gas production under the numerical-simulation models at different levels is shown in Figure 18.
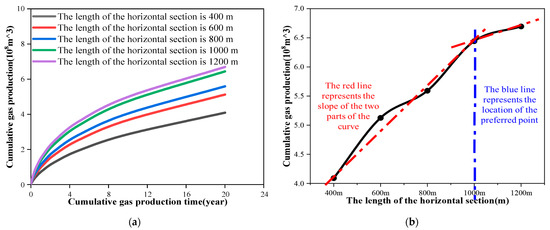
Figure 18.
(a) Comparison of cumulative yield under different horizontal lengths and (b) optimization diagram considering different horizontal section lengths.
It can be seen, from the prediction results, that after considering the embedded natural fractures, the pressure-relief range of horizontal wells shifted from the traditional ellipse to an irregular polygon, which is more consistent with the actual reservoir pressure distribution. In addition, with an increase in horizontal well length, the cumulative gas production of the single well was relatively higher, but the increase rate slowed in the later stage. By optimizing the horizontal segment length (as shown in Figure 18b), the optimal horizontal segment length was found to be 1000 m.
The NPV under different horizontal segment lengths was obtained using Equation (19), as shown in Figure 19.
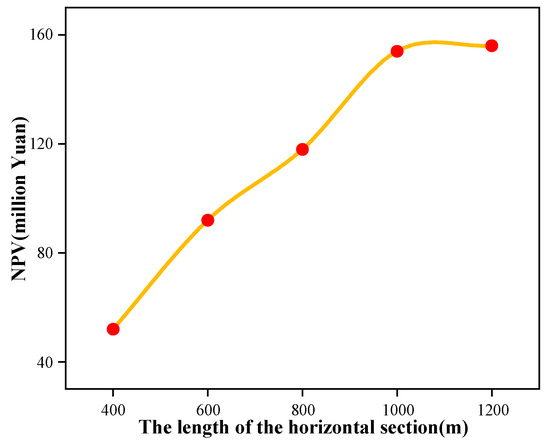
Figure 19.
NPV variation with the length of the horizontal section.
Therefore, the comprehensive comparison and selection indicated that the economic benefit was optimized with a horizontal segment length of 1000 m.
5. Conclusions
In this paper, a mathematical model of fluid flow in deep carbonate reservoirs was described, and a numerical-simulation model of embedded discrete-fracture seepage was established using MATLAB. In this way, the fracture parameters of horizontal wells for the development process of deep carbonate gas reservoirs were optimized.
- (1)
- A mathematical model of gas–water two-phase flow in deep carbonate rocks is established and solved by using the automatic differential framework in MRST.
- (2)
- Ant-tracking technology was used to extract the distribution of natural fractures in the study area, and was applied to our production optimization.
- (3)
- The workflow of deep carbonate production optimization was established from the extraction of fractures, the establishment and solution of numerical models, and the evaluation of benefits, and location of gas wells, half fracture length of gas wells, fracture permeability of gas wells, and horizontal length of gas wells in the study area were optimized.
The results indicate that the fracture length of the horizontal well, fracture permeability, and optimal horizontal section length were set as 200 m, 8000 mD, and 1000 m, respectively.
Author Contributions
Conceptualization, Y.G.; software, S.Z. and Y.Z.; data curation, T.X.; investigation, S.L.; formal analysis, B.K. and B.Z. All authors have read and agreed to the published version of the manuscript.
Funding
This research received no external funding.
Data Availability Statement
The embedded discrete-fracture simulation data used to support the findings of this study are available from the corresponding author upon request.
Conflicts of Interest
The authors declare that there is no conflict of interest regarding the publication of this paper.
References
- Hu, Y.; Peng, X.; Li, Q.; Li, L.; Hu, D. Progress and development direction of technologies for deep marine carbonate gas reservoirs in the Sichuan Basin. Nat. Gas Ind. 2020, 7, 149–159. [Google Scholar] [CrossRef]
- Ghasemi, F.; Ghaedi, M.; Escrochi, M. A new scaling equation for imbibition process in naturally fractured gas reservoirs. Adv. Geo-Energy Res. 2020, 4, 99. [Google Scholar] [CrossRef]
- Xue, X.; Yang, C.; Park, J.; Sharma, V.K.; Daffa-Gupta, A.; King, M.J. Reservoir and Fracture-Flow Characterization Using Novel Diagnostic Plots. Spe J. 2019, 24, 1248–1269. [Google Scholar] [CrossRef]
- Fang, J.; Gong, B.; Caers, J. Data-driven model falsification and uncertainty quantification for fractured reservoirs. Engineering, 2022; in press. [Google Scholar] [CrossRef]
- Jiang, J.; Younis, R.M. Hybrid Coupled Discrete-Fracture/Matrix and Multicontinuum Models for Unconventional-Reservoir Simulation. Spe J. 2016, 21, 1009–1027. [Google Scholar] [CrossRef]
- Huang, X.; Zhang, L.; Zhang, R.; Chen, X.; Zhao, Y.; Yuan, S. Numerical simulation of gas-liquid two-phase flow in the micro-fracture networks in fractured reservoirs. J. Nat. Gas Sci. Eng. 2021, 94, 104101. [Google Scholar] [CrossRef]
- Wang, Y.; Yao, J.; Huang, Z. Parameter Effect Analysis of Non-Darcy Flow and a Method for Choosing a Fluid Flow Equation in Fractured Karstic Carbonate Reservoirs. Energies 2022, 15, 3623. [Google Scholar] [CrossRef]
- Ke, X.; Zhao, Y.; Li, J.; Guo, Z.; Kang, Y. Production Simulation of Oil Reservoirs with Complex Fracture Network Using Numerical Simulation. Energies 2022, 15, 4050. [Google Scholar] [CrossRef]
- Chen, D.; Pan, Z.; Ye, Z. Dependence of gas shale fracture permeability on effective stress and reservoir pressure: Model match and insights. Fuel 2015, 139, 383–392. [Google Scholar] [CrossRef]
- Chuprakov, D.A.; Akulich, A.V.; Siebrits, E.; Thiercelin, M. Hydraulic-Fracture Propagation in a Naturally Fractured Reservoir. Spe Prod. Oper. 2011, 26, 88–97. [Google Scholar] [CrossRef]
- Hu, Y.; Wei, J.; Li, T.; Zhu, W.; Gong, W.; Hui, D.; Wang, M. Numerical Simulation of Fluid Flow in Carbonate Rocks Based on Digital Rock Technology. Energies 2022, 15, 3748. [Google Scholar] [CrossRef]
- Han, X.; Tan, X.; Li, X.; Pang, Y.; Zhang, L. Research on water invasion performance of complex fracture-vuggy gas reservoirs based on classification modeling. Adv. Geo-Energy Res. 2021, 5, 222–232. [Google Scholar] [CrossRef]
- Maxwell, S.C.; Cho, D.; Pope, T.L.; Jones, M.; Leonard, J.A. Enhanced Reservoir Characterization Using Hydraulic Fracture Microseismicity. Phys. Rev. Spec. Top.-Accel. Beams 2011, 10, 2118. [Google Scholar]
- Wang, D.; Dong, Y.; Sun, D.; Yu, B. A three-dimensional numerical study of hydraulic fracturing with degradable diverting materials via CZM-based FEM. Eng. Fract. Mech. 2020, 237, 107251. [Google Scholar] [CrossRef]
- Xia, Y.; Wei, S.; Deng, Y.; Jin, Y. A new enriched method for extended finite element modeling of fluid flow in fractured reservoirs. Comput. Geotech. 2022, 148, 104806. [Google Scholar] [CrossRef]
- Cipolla, C.L.; Warpinski, N.R.; Mayerhofer, M.J.; Lolon, E.; Vincent, M.C. The Relationship Between Fracture Complexity, Reservoir Properties, and Fracture Treatment Design. Spe Prod. Oper. 2010, 25, 438–452. [Google Scholar] [CrossRef]
- Clarkson, C.R.; Yuan, B.; Zhang, Z. A New Straight-Line Analysis Method for Estimating Fracture/Reservoir Properties Using Dynamic Fluid-in-Place Calculations. Spe Reserv. Eval. Eng. 2020, 23, 606–626. [Google Scholar] [CrossRef]
- Clarkson, C.R.; Haghshenas, B.; Ghanizadeh, A.; Qanbari, F.; Williams-Kovacs, J.D.; Riazi, N.; Debuhr, C.; Deglint, H.J. Nanopores to megafractures: Current challenges and methods for shale gas reservoir and hydraulic fracture characterization. J. Nat. Gas Sci. Eng. 2016, 31, 612–657. [Google Scholar] [CrossRef]
- Xue, X.; Yang, C.; Sharma, V.K.; Datta-Gupta, A.; King, M.J. Reservoir and Fracture Flow Characterization Using a Novel W(τ) Formulation. In Proceedings of the SPE/AAPG/SEG Unconventional Resources Technology Conference, San Antonio, TX, USA, 1–3 August 2016. [Google Scholar]
- Wang, D.; Zlotnik, S.; Diez, P.; Ge, H.; Zhou, F.; Yu, B. A Numerical Study on Hydraulic Fracturing Problems via the Proper Generalized Decomposition Method. Cmes Comput. Modeling Eng. Sci. 2020, 122, 703–720. [Google Scholar] [CrossRef]
- Gupta, J.; Templeton-Barrett, E.; Yao, Y.; Choi, N.H.; Albert, R.A. Integration of Fracture, Reservoir, and Geomechanics Modeling for Shale Gas Reservoir Development. In Integration of Fracture Reservoir and Geomechanics Modeling for Shale Gas Reservoir Development; OnePetro: Richardson, TX, USA, 2013. [Google Scholar]
- Ni, X.; Shen, A.; Pan, W.; Zhang, R.; Yu, H.; Dong, Y.; Zhu, Y.; Wang, C. Geological modeling of excellent fracture-vug carbonate reservoirs: A case study of the Ordovician in the northern slope of Tazhong palaeouplift and the southern area of Tabei slope, Tarim Basin, NW China. Pet. Explor. Dev. 2013, 40, 444–453. [Google Scholar] [CrossRef]
- Jenkins, C.; Ouenes, A.; Zellou, A.; Wingard, J. Quantifying and predicting naturally fractured reservoir behavior with continuous fracture models. Aapg Bull. 2009, 93, 1597–1608. [Google Scholar] [CrossRef]
- Yan, L.; Liu, Q.; Liu, X. Research on 3D geological modeling of fractured-vuggy carbonate reservoirs. Energy Rep. 2022, 8, 491–500. [Google Scholar] [CrossRef]
- Li, Y.; Hou, J.; Li, Y. Features and classified hierarchical modeling of carbonate fracture-cavity reservoirs. Pet. Explor. Dev. 2016, 43, 655–662. [Google Scholar] [CrossRef]
- Hawez, H.K.; Sanaee, R.; Faisal, N.H. A critical review on coupled geomechanics and fluid flow in naturally fractured reservoirs. J. Nat. Gas Sci. Eng. 2021, 95, 104150. [Google Scholar] [CrossRef]
- Rashid, H.; Olorode, O.; Chukwudozie, C. An iteratively coupled model for flow, deformation, and fracture propagation in fractured unconventional reservoirs. J. Pet. Sci. Eng. 2022, 214, 110468. [Google Scholar] [CrossRef]
- Xiong, S.; Liu, S.; Weng, D.; Shen, R.; Yu, J.; Yan, X.; He, Y.; Chu, S. A Fractional Step Method to Solve Productivity Model of Horizontal Wells Based on Heterogeneous Structure of Fracture Network. Energies 2022, 15, 3907. [Google Scholar] [CrossRef]
- Zhang, N.; Abushaikha, A.S. An implementation of mimetic finite difference method for fractured reservoirs using a fully implicit approach and discrete fracture models. J. Comput. Phys. 2021, 446, 110665. [Google Scholar] [CrossRef]
- Wang, W.; Zheng, D.; Sheng, G.; Zhang, Q.; Su, Y. A review of stimulated reservoir volume characterization for multiple fractured horizontal well in unconventional reservoirs. Adv. Geo-Energy Res. 2017, 1, 54–63. [Google Scholar] [CrossRef]
- Berre, I.; Doster, F.; Keilegavlen, E. Flow in Fractured Porous Media: A Review of Conceptual Models and Discretization Approaches. Transp. Porous Media 2019, 130, 215–236. [Google Scholar] [CrossRef]
- Eisner, L.; Williams-Stroud, S.; Hill, A.; Duncan, P.; Thornton, M. Beyond the dots in the box: Microseismicity-constrained fracture models for reservoir simulation. Lead. Edge 2010, 29, 326–333. [Google Scholar] [CrossRef]
- Wang, D.-B.; Zhou, F.-J.; Li, Y.-P.; Yu, B.; Martyushev, D.; Liu, X.-F.; Wang, M.; He, C.-M.; Han, D.-X.; Sun, D.-L. Numerical simulation of fracture propagation in Russia carbonate reservoirs during refracturing. Sustainability 2022, 10, 1016. [Google Scholar] [CrossRef]
- Xie, H.; Fiallos Torres, M.; Cheng, P.; Yu, W.; Xin, Y.; Miao, J.; Cheng, M. A new-generation Embedded Discrete Fracture Model calibration workflow applied to the characterization of complex naturally fracture reservoir. Pet. Res. 2022, 7, 1–12. [Google Scholar] [CrossRef]
- Xu, Y.; Sergio, D.; Yu, W.; Sepehrnoori, K. Discrete-Fracture Modeling of Complex Hydraulic-Fracture Geometries in Reservoir Simulators. Spe Reserv. Eval. Eng. 2016, 20, 403–422. [Google Scholar] [CrossRef]
- Hosseinimehr, M.; Tomala, J.P.; Vuik, C.; Kobaisi, M.A.; Hajibeygi, H. Projection-based embedded discrete fracture model (pEDFM) for flow and heat transfer in real-field geological formations with corner-point grid geometries. Adv. Water Resour. 2021, 159, 104091. [Google Scholar] [CrossRef]
- Tao, W.A.; Yan, Y.B.; Yu, P.C.; Jz, C.; Tao, Q.B.; Ji, Z.A.; Ph, A. Simulation and evaluation for acid fracturing of carbonate reservoirs based on embedded discrete fracture model-ScienceDirect. Nat. Gas Ind. B 2021, 8, 637–649. [Google Scholar]
- Wang, B. MRST-Shale: An Open-Source Framework for Generic Numerical Modeling of Unconventional Shale and Tight Gas Reservoirs. Preprints 2020, 10, 20944. [Google Scholar]
- Geng, S.; Li, C.; Zhai, S.; Gong, Y.; Jing, M. Modeling the Mechanism of Water Flux in Fractured Gas Reservoirs With Edge Water Aquifers Using an Embedded Discrete Fracture Model. J. Energy Resour. Technol.-Trans. ASME 2022, 145, 033002. [Google Scholar] [CrossRef]
- Wang, B.; Fidelibus, C. An Open-Source Code for Fluid Flow Simulations in Unconventional Fractured Reservoirs. Geosciences 2021, 11, 106. [Google Scholar] [CrossRef]
Publisher’s Note: MDPI stays neutral with regard to jurisdictional claims in published maps and institutional affiliations. |
© 2022 by the authors. Licensee MDPI, Basel, Switzerland. This article is an open access article distributed under the terms and conditions of the Creative Commons Attribution (CC BY) license (https://creativecommons.org/licenses/by/4.0/).