1. Introduction
The operating rooms (OR) are places with high indoor air quality (IAQ) requirements, which must be maintained 24/7. HVAC systems are the primary approach of airborne particulate and pathogen control in OR. However, these systems have complex regulation systems, due to the multitude of factors that must be considered, such as sanitary equipment, room size, type of surgery, healthcare staff and patients. [
1] The monitoring of IAQ in ORs is performed through the indicator of live microorganisms in different areas of the operating room. These are evaluated by colony forming units (CFU). Many researchers have studied the flow rate of outside air that is required to be below 10 CFU. Ching-Chieh et al. [
2] studied the airflow required to maintain contaminant concentrations below the established ranges. Ching-Chieh et al. found that there is an inverse relationship between airflow and concentration in surgical procedures. Annaqeeb et al. [
3] carried out a study on how the presence of personnel and activity in operating rooms affects the concentration of microorganisms. They established a direct correlation between the presence of microorganisms and activity. Vonci et al. [
4] applied a regression model to determine air changes per hour (ACH), in order to maintain the concentration of CFU below the required limit concentration in operating rooms. The model obtained was validated with data taken during last 3 years, in 19 operating rooms.
Other researchers have studied the requirement of ventilation to control the concentration of anesthetic gases during surgical interventions. Dascalaki et al. [
5] and San José et al. [
6] monitored the concentration of anesthetic gases during surgery. They found that there were periods in which the concentration of anesthetic gases exceeded the threshold limit values (TLV). Hence, they proposed localized extraction systems for the patient in order to avoid having to increase the flow rates of external air in the ORs.
All these studies support the specifications of the American Society of Heating, Refrigerating, and Air-Conditioning Engineers ASHRAE [
7], the Deutsche Gessellschaft fur Krankenhaushygienen (DGKH) guidelines [
8] and the Spanish standards UNE 100713:2005 [
9]. The minimum air flow rate to be used in the operating room is set at around 20 ACH or 2400 m
3/h, with limitations in terms of the particles present within the OR according to the UNE-EN-ISO 14644 standard [
10]. This requires three stages of filtration, where the final stage is high efficiency particulate air (HEPA), providing a retention efficiency of 99.9%.
If hygrothermal treatment is added to the supply air, IAQ control involves a high economic cost. Studies carried out by Cacabelos-Reyes et al. [
11] estimate that thermal energy consumption in Spanish ORs is between 1685 kWh/m
2·y to 1021 kWh/m
2·y, excluding adjacent areas. This represents a high energy consumption.
To reduce the cost of maintaining the IAQ in an OR, different scenarios can be studied. Cacabelos-Reyes et al. [
11] conducted a model in TRNSYS to study energy consumption in ORs. The model was validated with experimental data collected in a real facility, obtaining results of savings of 50%. This was achieved by adjusting comfort conditions and supply air flow, all without compromising IAQ.
On the other hand, Alsved et al. [
12] studied different ways of diffusing outside air in the OR, including laminar air flow (LAF) and turbulent air flow (TAF), for the purpose of maintaining CFU < 10 with surgical activity. The study concluded that there are no substantial differences in OR energy savings based on the method of diffusing the air inside the OR.
Fan et al. [
13] studied different ventilation systems in operating rooms to reduce the thermal and electrical energy consumption of ventilators. For this purpose, they monitored the indoor conditions in operating rooms. In this study, they analyzed particulates, thermal comfort, and sound level, establishing an adjustment of the air flow rate in the OR when it is free of activity.
Porowsky et al. [
14] carried out an HVAC simulation model of an operating room, introducing a multitude of variables and operating ranges. This allowed the researchers to establish the energy consumptions when adjusting any of the factors of the model, such as occupancy time.
The Standard UNE 100713 [
9] allows a reduction in the air flow rate in the OR by 50% during periods when there is no surgical activity, as long as the asepsis of the operating room is guaranteed. This is achieved by maintaining the OR overpressure with respect to the adjoining enclosures at 20 Pa, and ensuring that the concentration of particles in the OR complies with the UNE-EN-ISO 14644 requirements [
10]. These specifications are achieved by not having particle emissions during periods of OR inactivity, maintaining the supply air filtration system. [
15]
In accordance with the regulations [
9], this study aims to quantify the savings produced by introducing a regulation system in the air supply of an OR, during periods of inactivity, without putting the asepsis of the OR at risk, for five different climatic zones, based on data obtained from operating rooms of a specific surgical area. For this purpose, this paper studies the adjustment of the external air flow rate of the ORs of hospital centers located in a Spanish continental climate zone. In the initial scenario, the ORs that operate continuously, where the flow rate is kept constant at 100% throughout the year, are analyzed. Then, the reduction in the ventilation flow rate in the ORs is carried out following two strategies, regulation by occupancy and regulation by schedule. The methodology is validated and then applied to hospital centers located in the rest of the climatic zones of Spain. For this purpose, the external air temperature and relative humidity data for the typical climatic year of each zone, published annually by the Ministry of Transport, Mobility, and Urban Agenda (Government of Spain), are used [
16]. Finally, energy consumption, environmental (CO
2 emissions reduction), and economic savings have been determined, considering some energy factors.
2. Materials and Methods
This study was based on the activity data of the annual ORs at UCH located in Valladolid (Spanish continental climate zone). Measurements were recorded with the performance of the air handling unit (AHU) in the ORs and the performance of the air-conditioning system of four ORs was monitored.
2.1. Annual OR Activity at the UHC
The UHC has 900 beds, a total floor area of 136,000 m
2, and a surgical area made up of 24 operating rooms. The occupancy rate of the surgical area is quite high. A total of 24,126 surgeries have been performed per year, classified as indicated in
Table 1 into the following categories: scheduled, emergency, and cancelled. These were also classified according to if it included hospitalization or not.
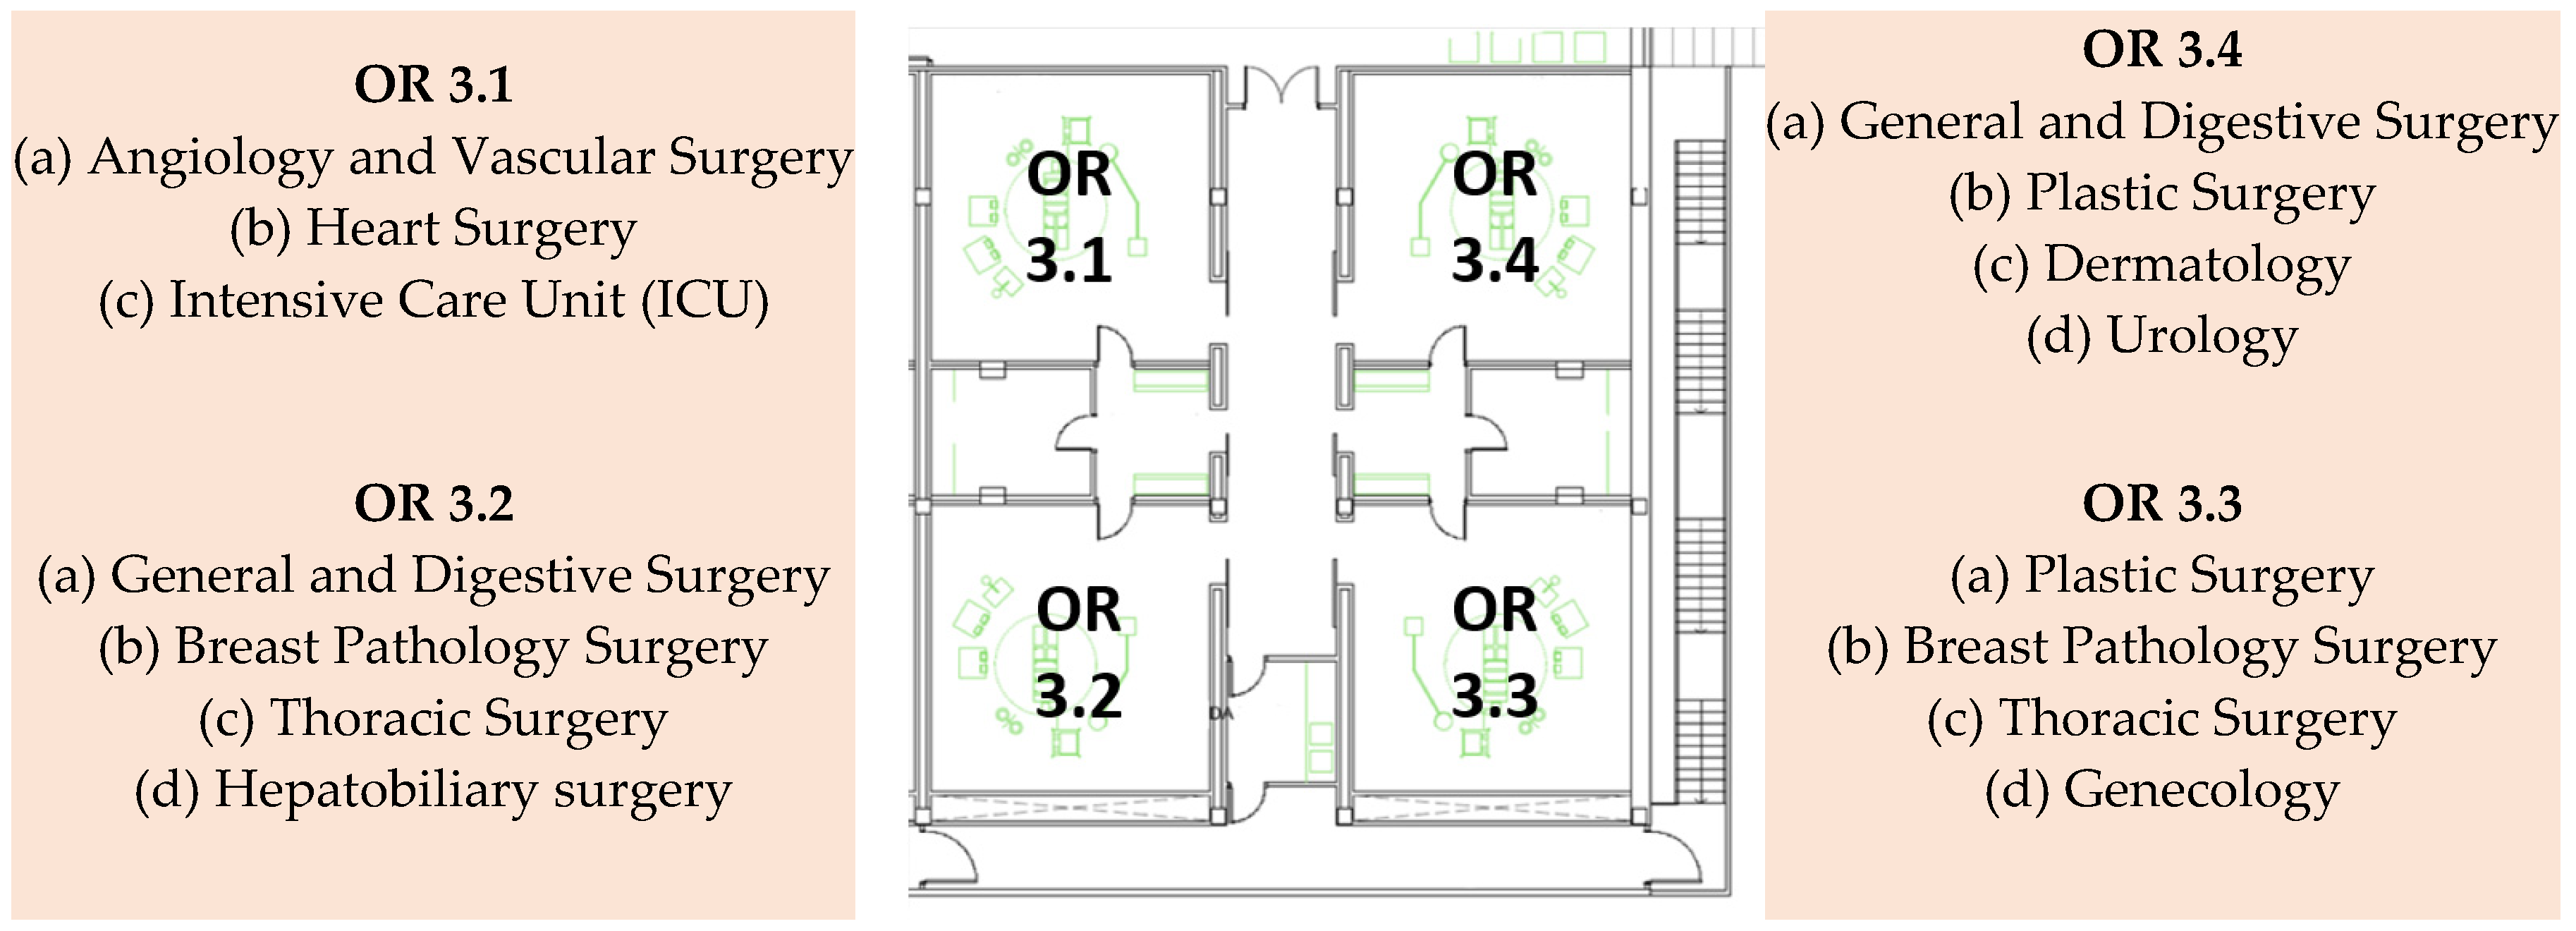
The study focuses on block three at the UHC, where four operating rooms are equipped with turbulent air flow (TAF) air diffusion systems. These correspond to ORs (3.1, 3.2, 3.3 and 3.4). The selection of block three ORs was due to the fact that they are used by a wide variety of services; thus, the estimated average surgical time can be representative for all the operating rooms at the UHC. Surgical block and the services that each of the ORs use are shown in
Figure 1.
Annual occupancy and average surgical time, in each OR, are shown in
Table 2.
The average occupation represents 20.68% of the annual hours. Although it is possible to admit some gaps between intervention and restoration of aseptic conditions, it is estimated that the annual occupancy time per OR is 25%.
2.2. HVAC Systems of OR
The operating rooms have been designed according to UNE 100713 [
9], and meet the requirements specified in
Table 3.
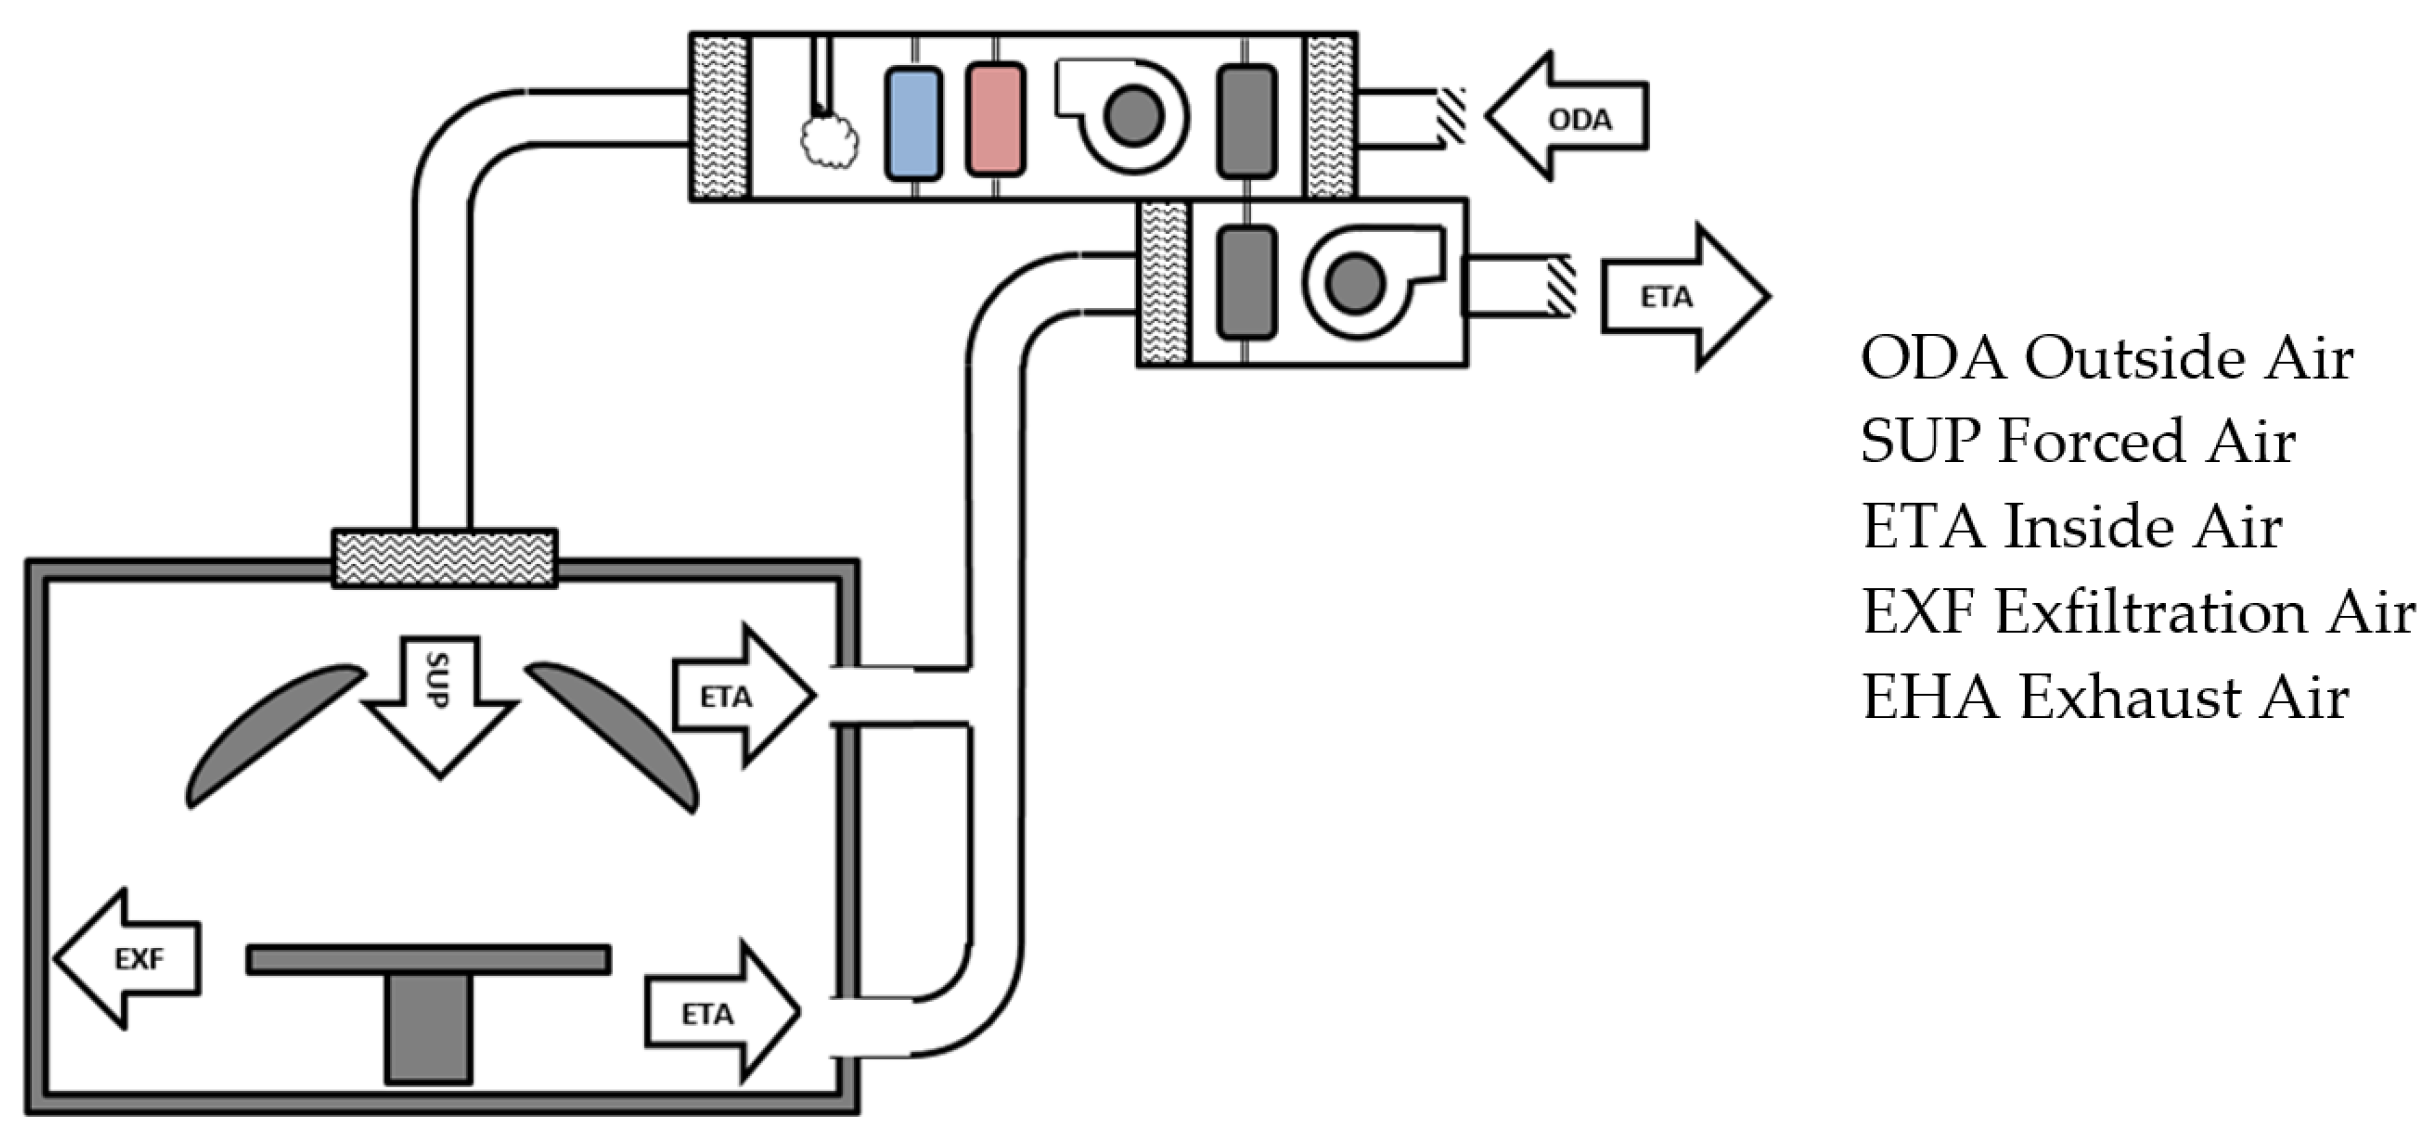
Each operating room has an air handing unit (AHU), regulated and controlled by supervisory control and data acquisition (SCADA). A schematic diagram of the heating-ventilation-air conditioning (HVAC) system is shown in
Figure 2.
The HVAC system is regulated from three setpoints that are measured and recorded at the same time.
The first mode of regulation is through thermal comfort. The thermal comfort of the OR is achieved using temperature and humidity sensors placed inside the OR. These sensors adjust the temperature and humidity of the SUP air, from the setpoint selected by the healthcare staff according to the surgery [
17]. Under the standard mode, 20 to 26 °C and 50% RH are considered. These values are considered as the indoor conditions of the OR in this study.
A second mode of regulation is through the SUP flow rate. The standard requires that OR has more than 20 air changes per hour (ACH) or 2400 m3/h. Therefore, the AHU has an air nozzle to measure and maintain the SUP flow rate. By means of a frequency inverter, the discharge fan is regulated to maintain the flow rate, independent of the climatic conditions and the state of the filters.
The last regulation mode is by overpressure in the OR. This overpressure is set at 20 Pa, by means of a frequency inverter that regulates the exhaust fan. When the pressure increases, the frequency inverter regulates the exhaust fan to increase the ETA flow rate. When the overpressure drops below the preset value (20 Pa), the ETA flow rate is reduced, as in the case of the door opening.
In order to verify that HVAC system in the OR is working as specified by the regulations, the following measurements are recorded: supply and extraction flow rates; overpressure; temperature; and relative humidity. To obtain all these measurements, a KIMO multifunction equipment model AMI-300 is used. Characteristics of the measurement probes are shown in
Table 4.
The results obtained that are used to set the flow rates of the model are shown in
Table 5.
2.3. Experimental Data of ORs at UHC and Efficiency of Run-Around Loop Heat Recovery
A coil runaround loop that avoids any risk of leakage between airflows is installed in the AHU as a heat recovery system, in order to reuse energy from the ETA air and to precondition the ODA air. Air by-pass between the ETA and ODA is not allowed.
This heat exchanger operates when the temperature drops between the outdoor and return air flows is at less 5 °C (
Figure 3). This value is set by the control of the AHU.
Performance data of the ORs have been recorded via UHC SCADA, allowing us to analyze the efficiency of run-around loop heat recovery, and to validate the calculation model.
Figure 4 shows the SCADA screenshot of OR 3.1, showing the parameters that were monitored and controlled in the OR.
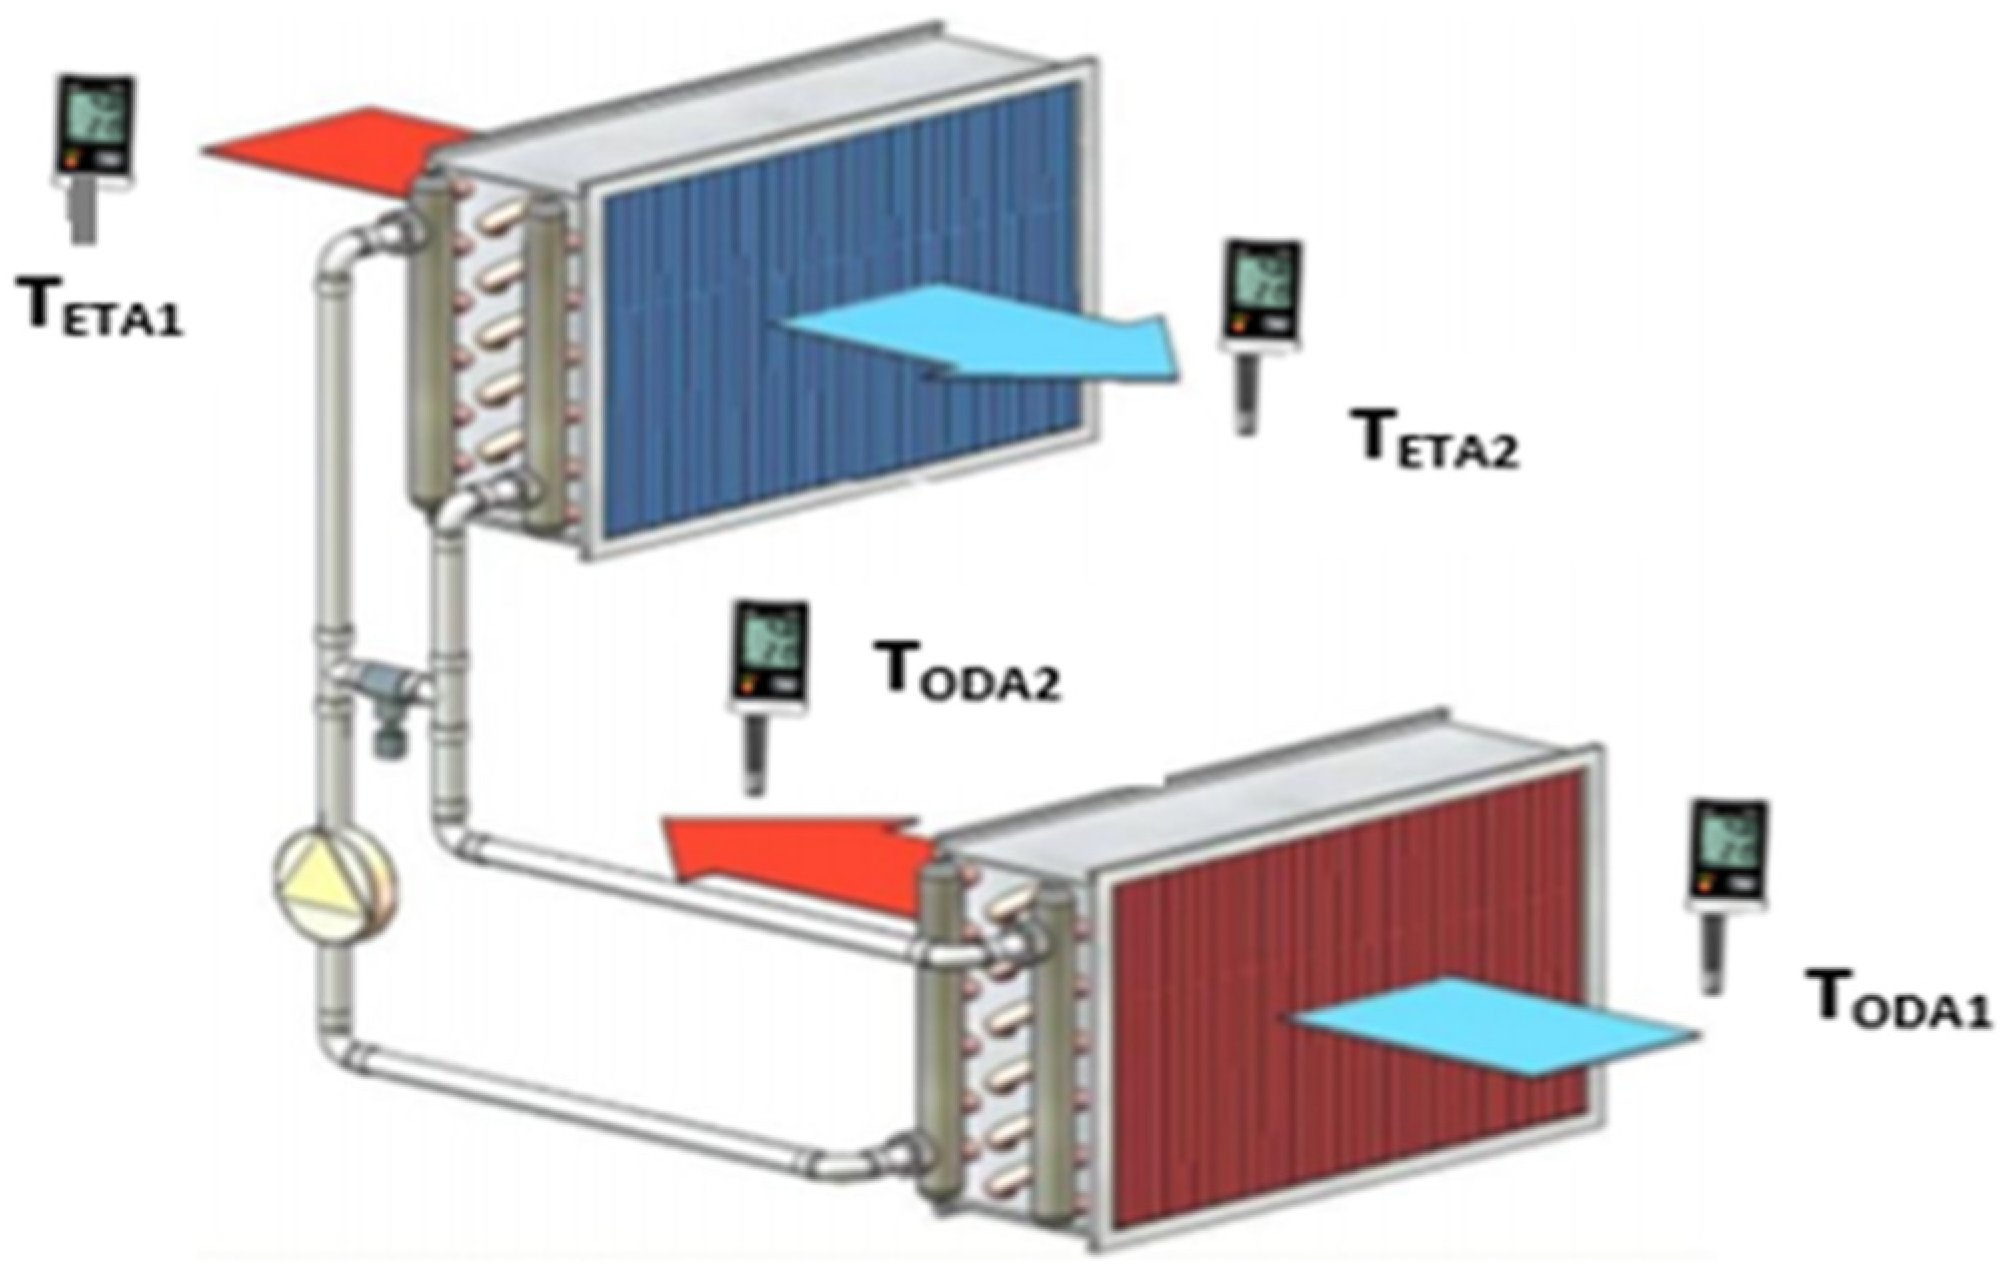
To determine the value of the run-around loop efficiency of the OR 3.1, the methodology used is based on the work of Vali et al. [
18]. Several parameters have been recorded. The inlet temperature “1” and outlet temperature “2” of the outside air (ODA) and of the exhaust air (ETA), as well as the flow rates of the outside air (
) and exhaust air (
), are recorded every 5 min.
The heat recovery system efficiency is calculated by the following equation:
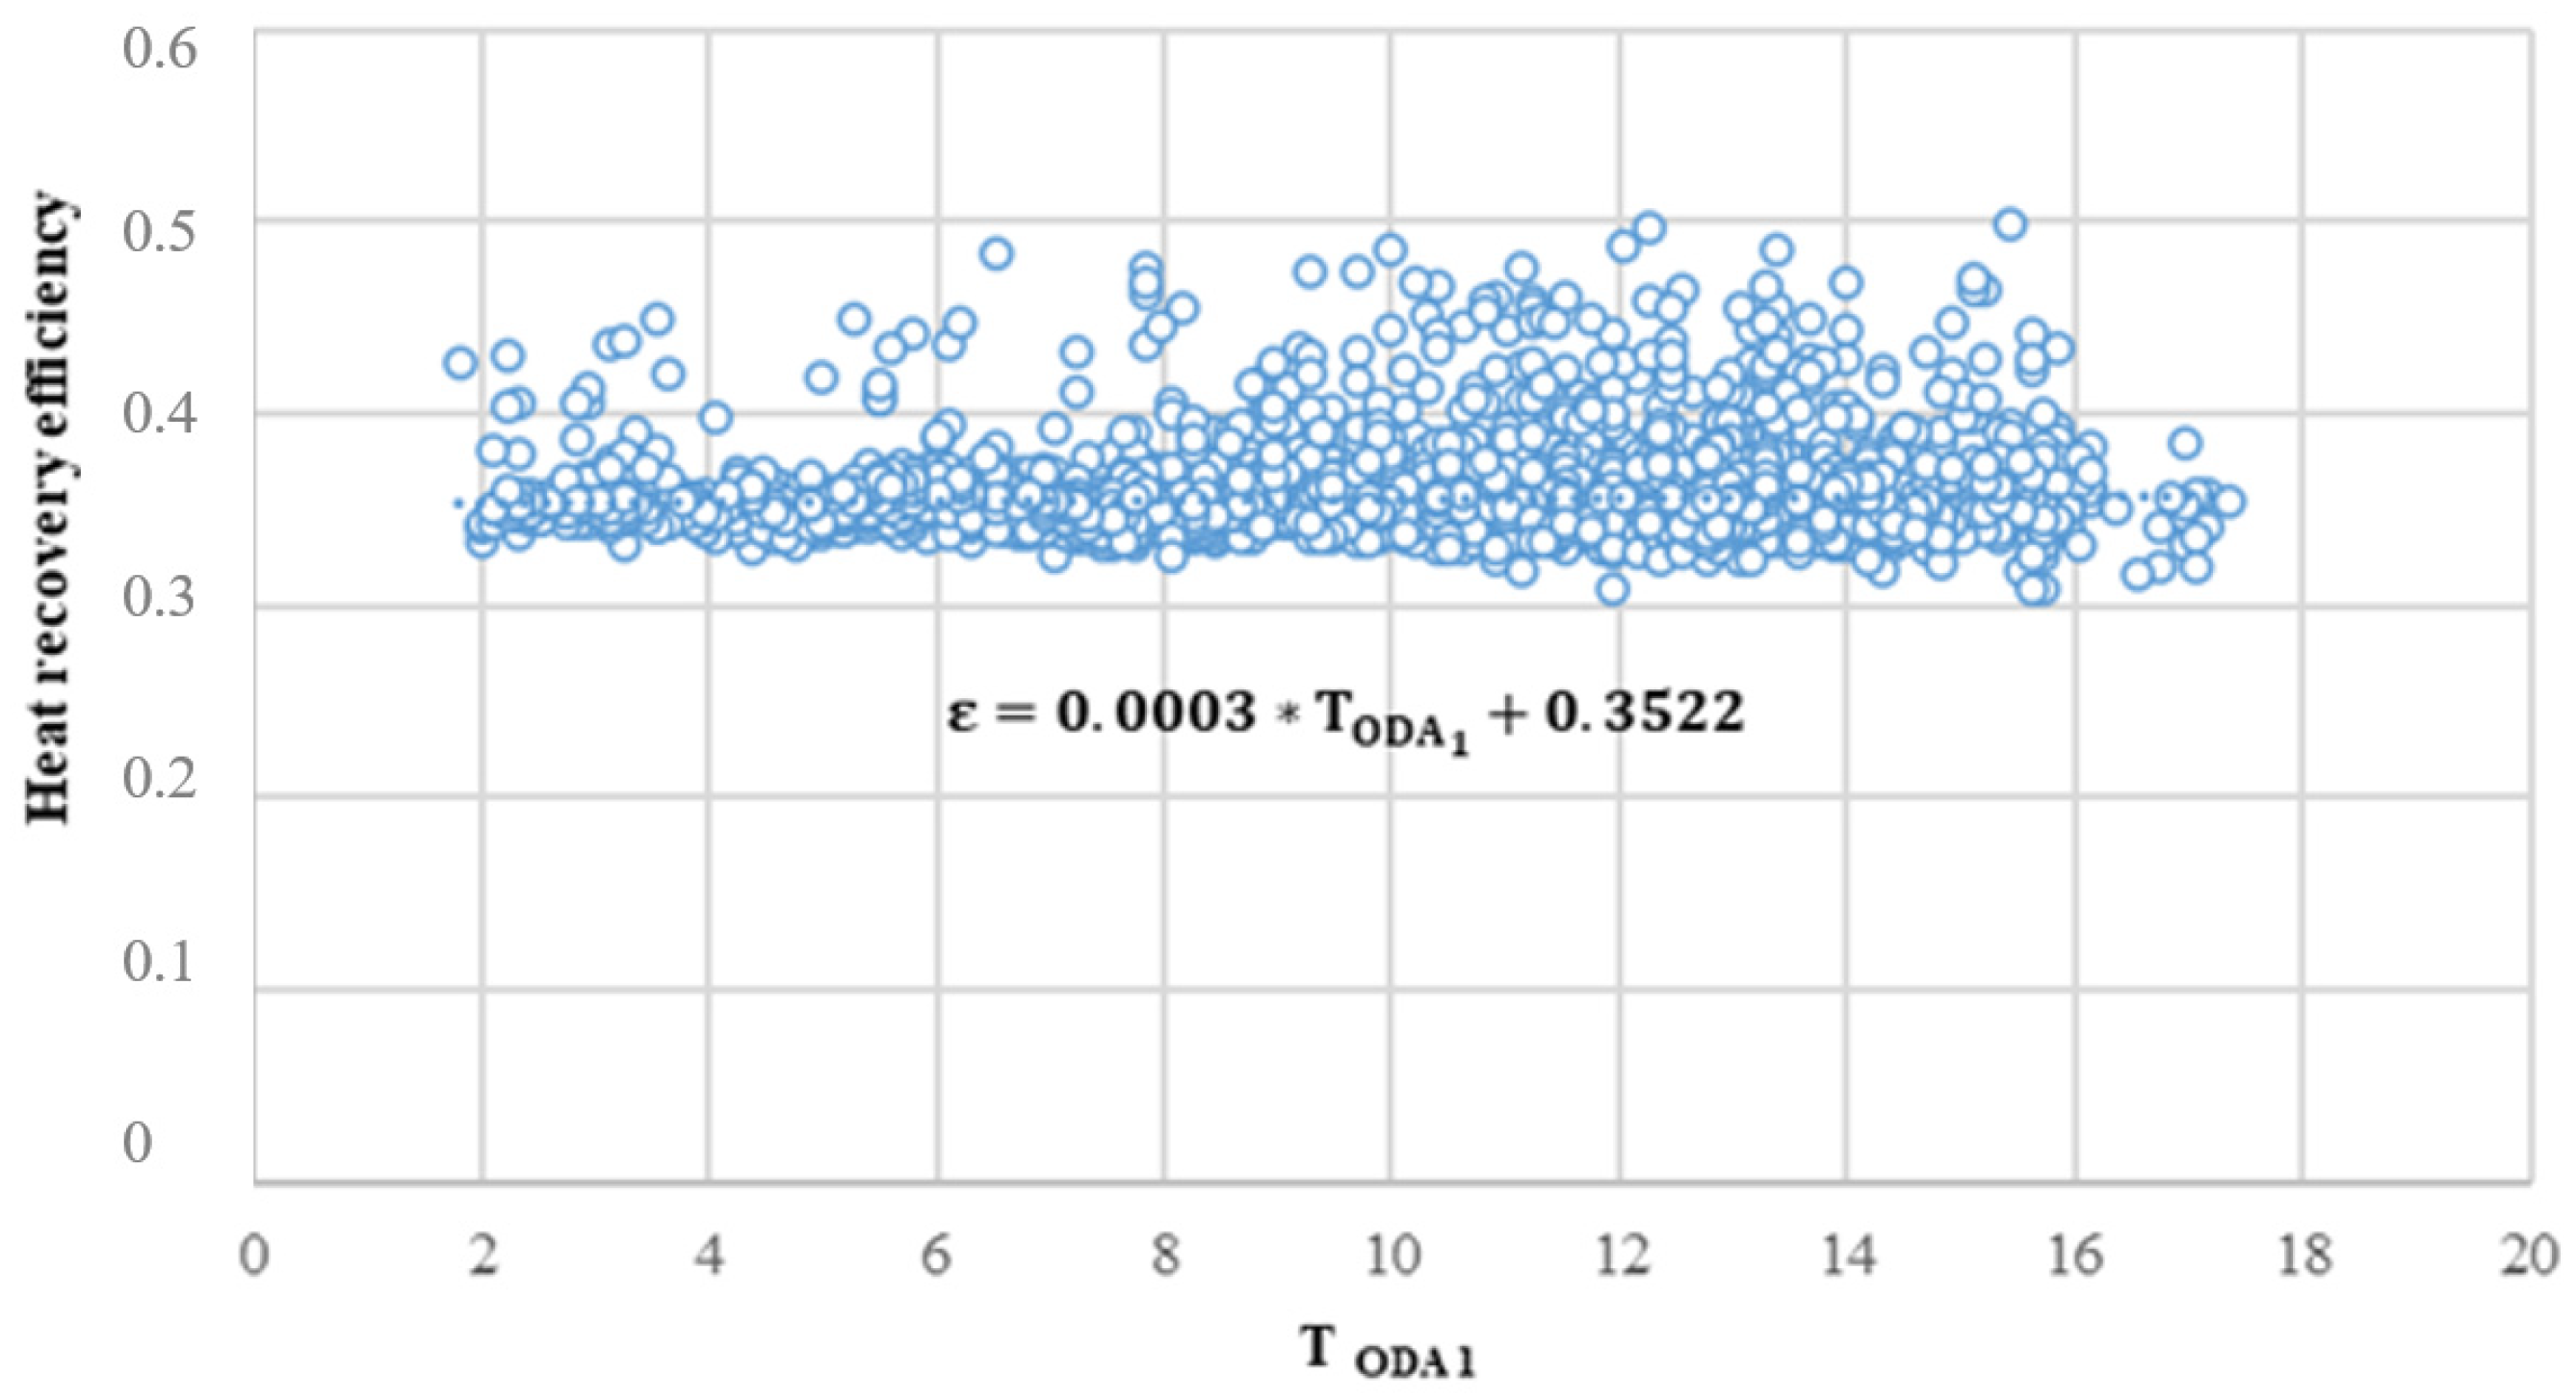
Figure 5 shows the analyzed data. These obtained data allow us to determine, by means of least-squares interpolation, the efficiency expression of the run-around loop (
ε) according to the outside air temperature. This is used in the simulation model to determine the pretreated air entering the AHU.
2.4. Methodology
The energy savings achieved with the strategy of regulation and control of the OR ventilation system are thermal and electrical. Thermal savings in heating involve a reduction in natural gas consumption, while thermal savings in cooling involve electrical energy savings.
The reduction in energy consumed by the fans means electrical energy savings, and humidification is carried out by steam injection. As a result, natural gas consumption in the boilers is reduced.
Figure 6 shows the energy demand of the AHU of an OR.
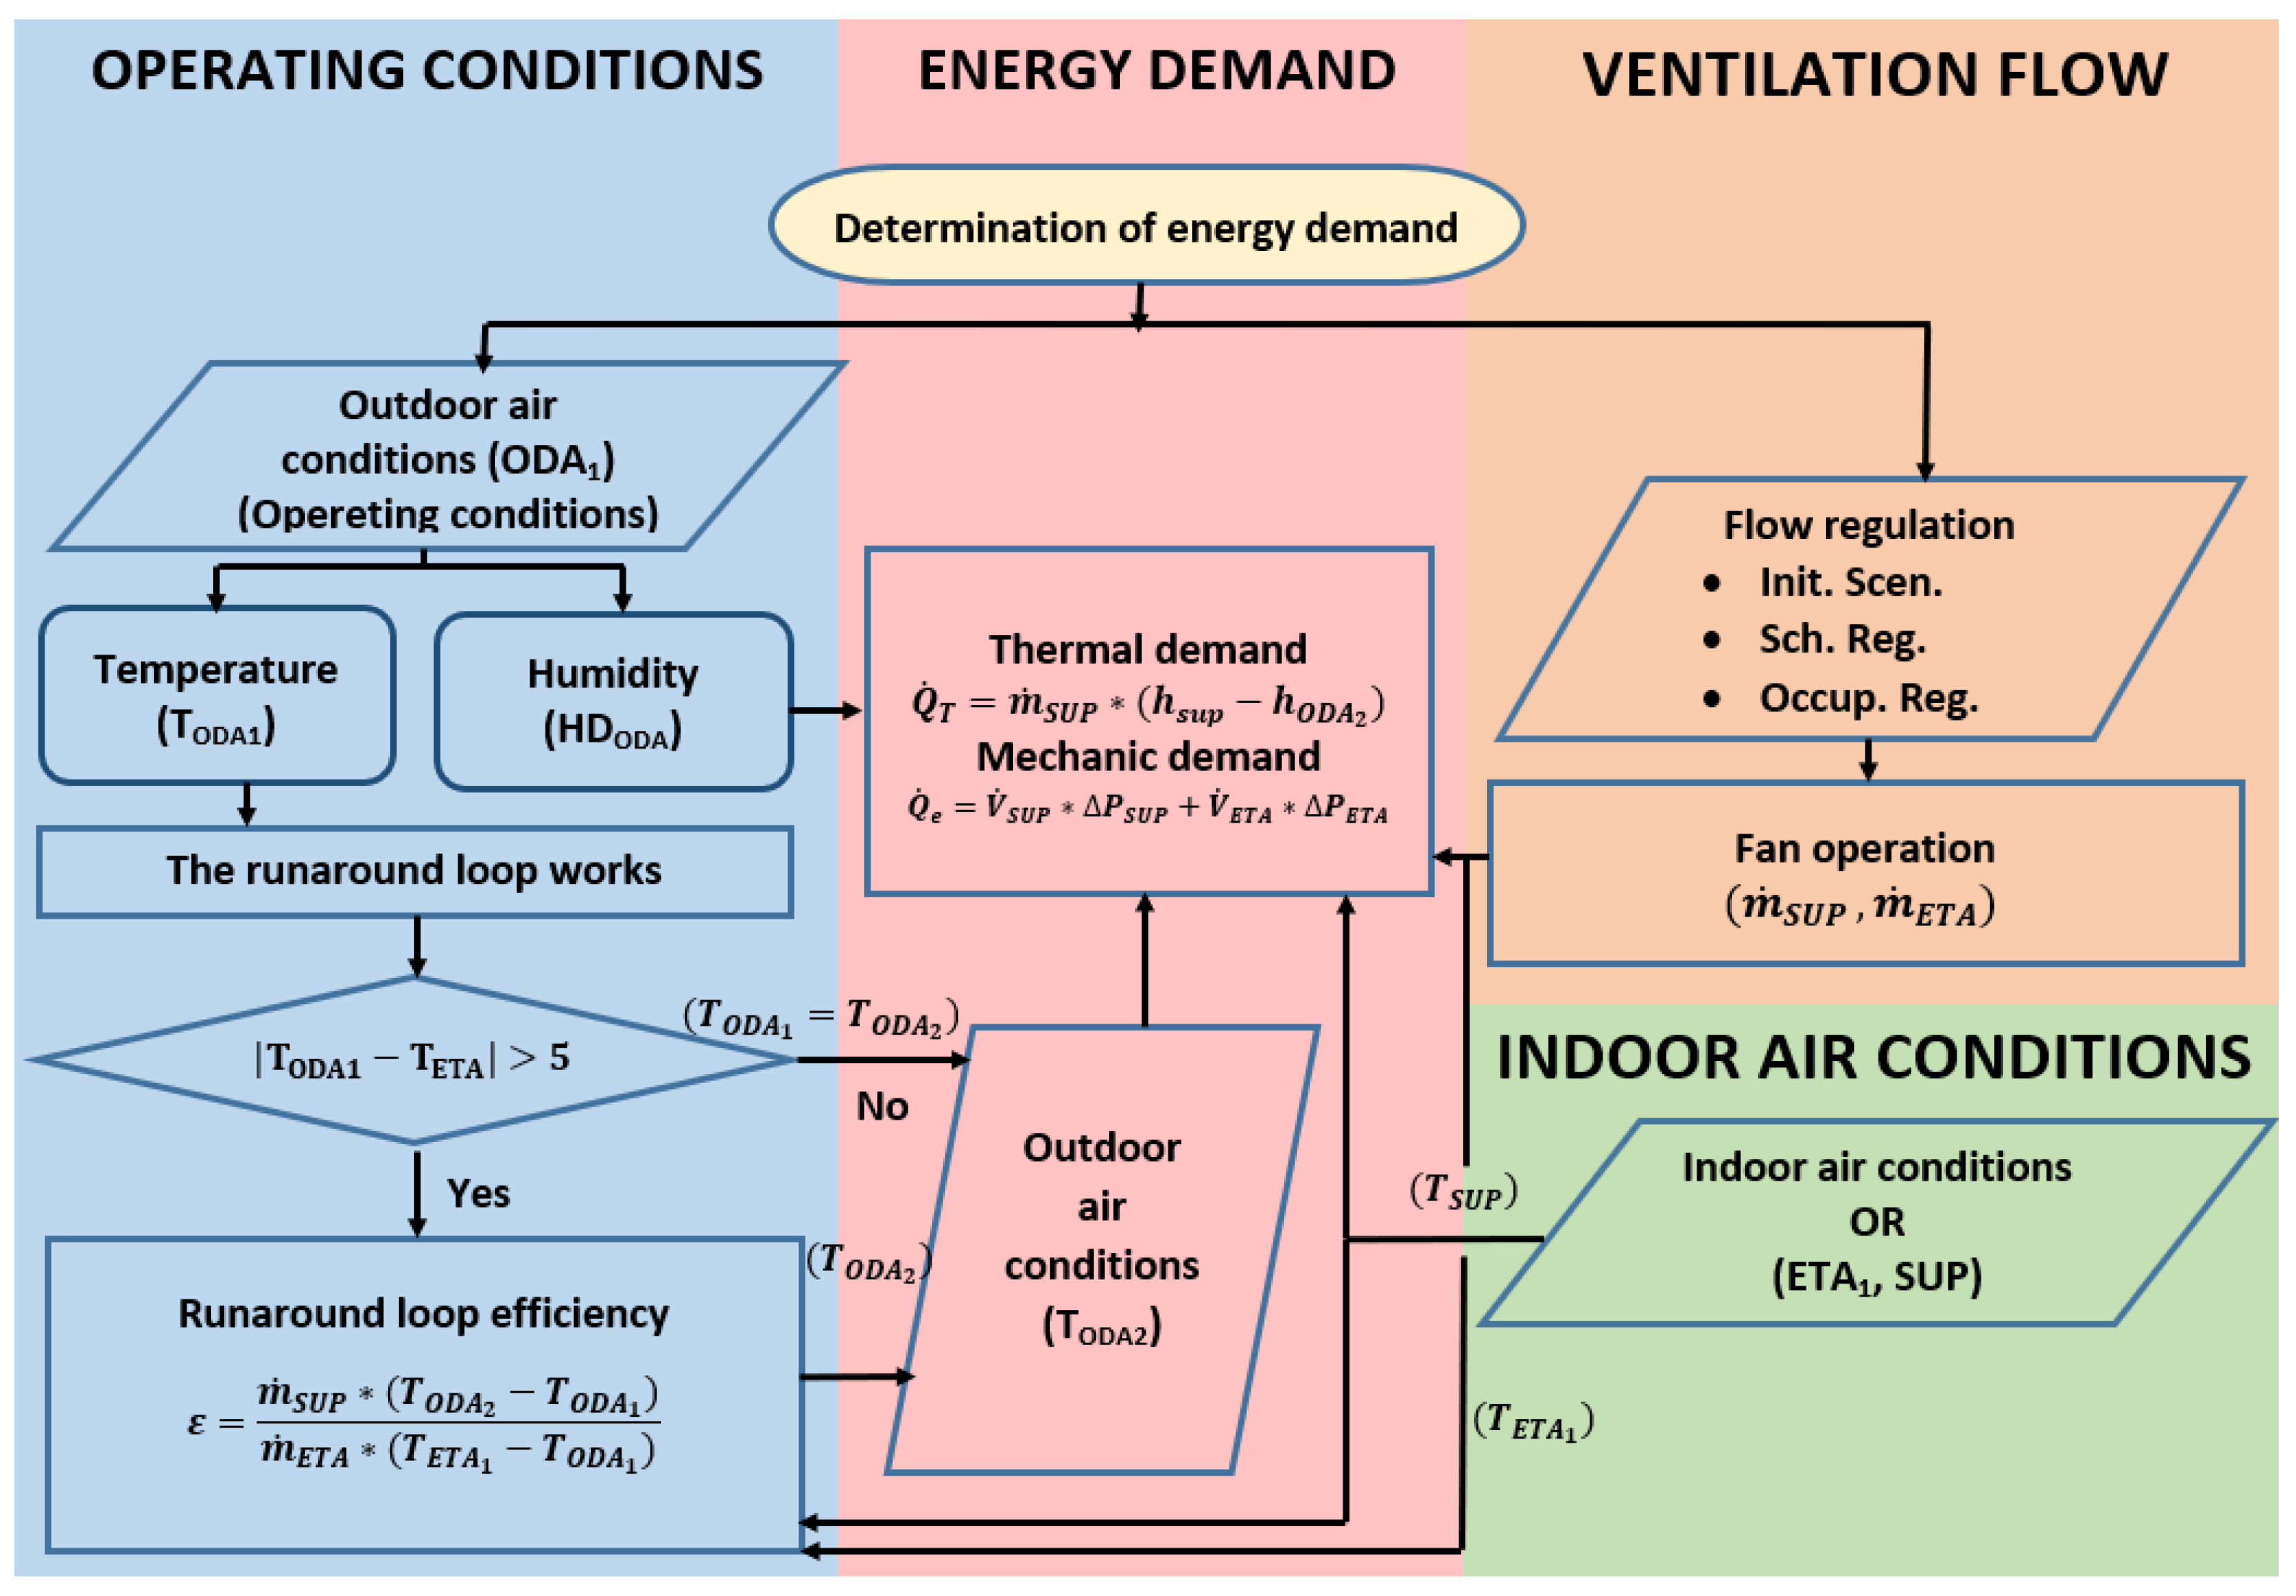
2.5. Determination of Energy Demand
The thermal and electrical energy demands of each OR are calculated hour by hour, and the process applied is shown in
Figure 7 as a flow chart.
Energy demand is determined according to following expression:
where
is the volume flow rate of force air (m
3/h,
Table 5),
is the density of force air (kg/m
3),
hSUP is the specific enthalpy of air in the OR, at 20 °C and 50% RH (kJ/kg), and
hODA2 is the specific enthalpy of outside air after run-around loop heat recovery (kJ/kg) (Equation (1)).
2.6. Operating Conditions
In order to apply the methodology presented above, it is necessary to establish the following operating conditions of the ORs: indoor conditions of the ORs; outdoor conditions (climatic zones); operating conditions of the AHU and energy factors.
The indoor conditions in the OR for temperature and humidity are set (20 °C and 50% RH).
Spain has five climatic zones, which are classified into the following climates: subtropical (A), Mediterranean (B), oceanic (C), continental (D) and mountain (E). Spanish regulations have classified climatic zones according to climatic severity in winter and summer. The climatic harshness is based on the degree days and the accumulated solar radiation in winter and summer.
Figure 8 shows the different climatic zones in Spain [
19].
In the established climatic zones, reference climates have been defined, which are freely available. These contain the hour-by-hour outdoor conditions of a typical year for each zone, which are the ones used in this study [
19]. Specifically, the databases zonaA1c.met, zonaB1c.met, zonaC1c.met, zonaD1c.met and zonaE1c.met have been used.
The AHU has two modes of operation, OR with and without surgical activity.
In the OR with surgical activity, the SUP volumetric flow rate (
) is set at 2467 m
3/h, and the ETA volumetric flow rate (
) is set at 1680 m
3/h (
Table 5). This allows one to keep the overpressure in the OR higher than 20 Pa. The ODA flow rate according to the AHU principle scheme (
Figure 2) coincides with the SUP flow rate.
In the OR with no surgical activity, the SUP volumetric flow rate () is reduced by 50% to 1233 m3/h, and the ETA volumetric flow rate () is set to hold the overpressure at 20 Pa; it is set at 446 m3/h.
ODA and ETA flows always go through the run-around loop, which can have the pump “ON” or “OFF”. The run-around is controlled by the difference between the ETA temperature and the ODA temperature as shown below.
Reference energy coefficients are used to determine energy consumption, primary energy, greenhouse gas emissions and economic costs. For this purpose, the following heating and cooling factors are used.
Heating: seasonal energy efficiency, SEE, natural gas NG, (0.95); conversion factor NG: 1.195 kWh
Primary Energy/kWh
Final Energy; NG emissions factor: 0.252 kg CO
2/kWh
Final Energy [
20]; and cost 3.94 c€/kWhNG.
Refrigeration: seasonal coefficient of performant, SCOP, (2.8); electricity conversion factor: 2403 kWh
Primary Energy/kWh
Final Energy; NG emissions factor: 0.357 kg CO
2/kWh
Final Energy [
20]; and cost 11.31 c€/kWh
Electricity.
2.7. Regulation Strategies
In this study, three regulation and control strategies have been analyzed, including initial scenario, regulation by occupancy and regulation by schedule.
In the first strategy, the initial scenario, the system maintains the supply and exhaust flow rates in the “OR with surgical occupancy” mode at a constant level.
In the second strategy, regulation by surgical occupation, a presence sensor is installed in the OR. Thus, there are two situations. The first one, with the occupancy of people in the OR, the operation of the system is in “OR with surgical occupancy” mode, and the second, without the presence of people for more than 15 min, the system is regulated in “OR without occupancy” mode.
Finally, with the regulation by time, 25% of the total annual timetable is set as “OR with surgical occupancy”. A period with or without occupancy of 8 h each day is set, not including weekends and days off. From 7 a.m. to 3 p.m., the operation of the system is in “OR with surgical occupancy” mode; and from 3 p.m. to 7 a.m., the operation of the system is in “OR without surgical occupancy” mode.
2.8. Model Validation
Energy monitoring of OR 3.1 at UHC reaches an analysis of 980,000 data. In order to assess the accuracy of the methodology applied to ORs in different climate zones,
Table 6 compares HVAC performance with surgical activity between the experimental and model data.
It can be observed that the error in heating consumption is acceptable. However, the errors in cooling are very high. This is due to not considering the energy contributions of the existing equipment in the OR. However, it should be noted that this error is considered in all three control strategies used in this study.
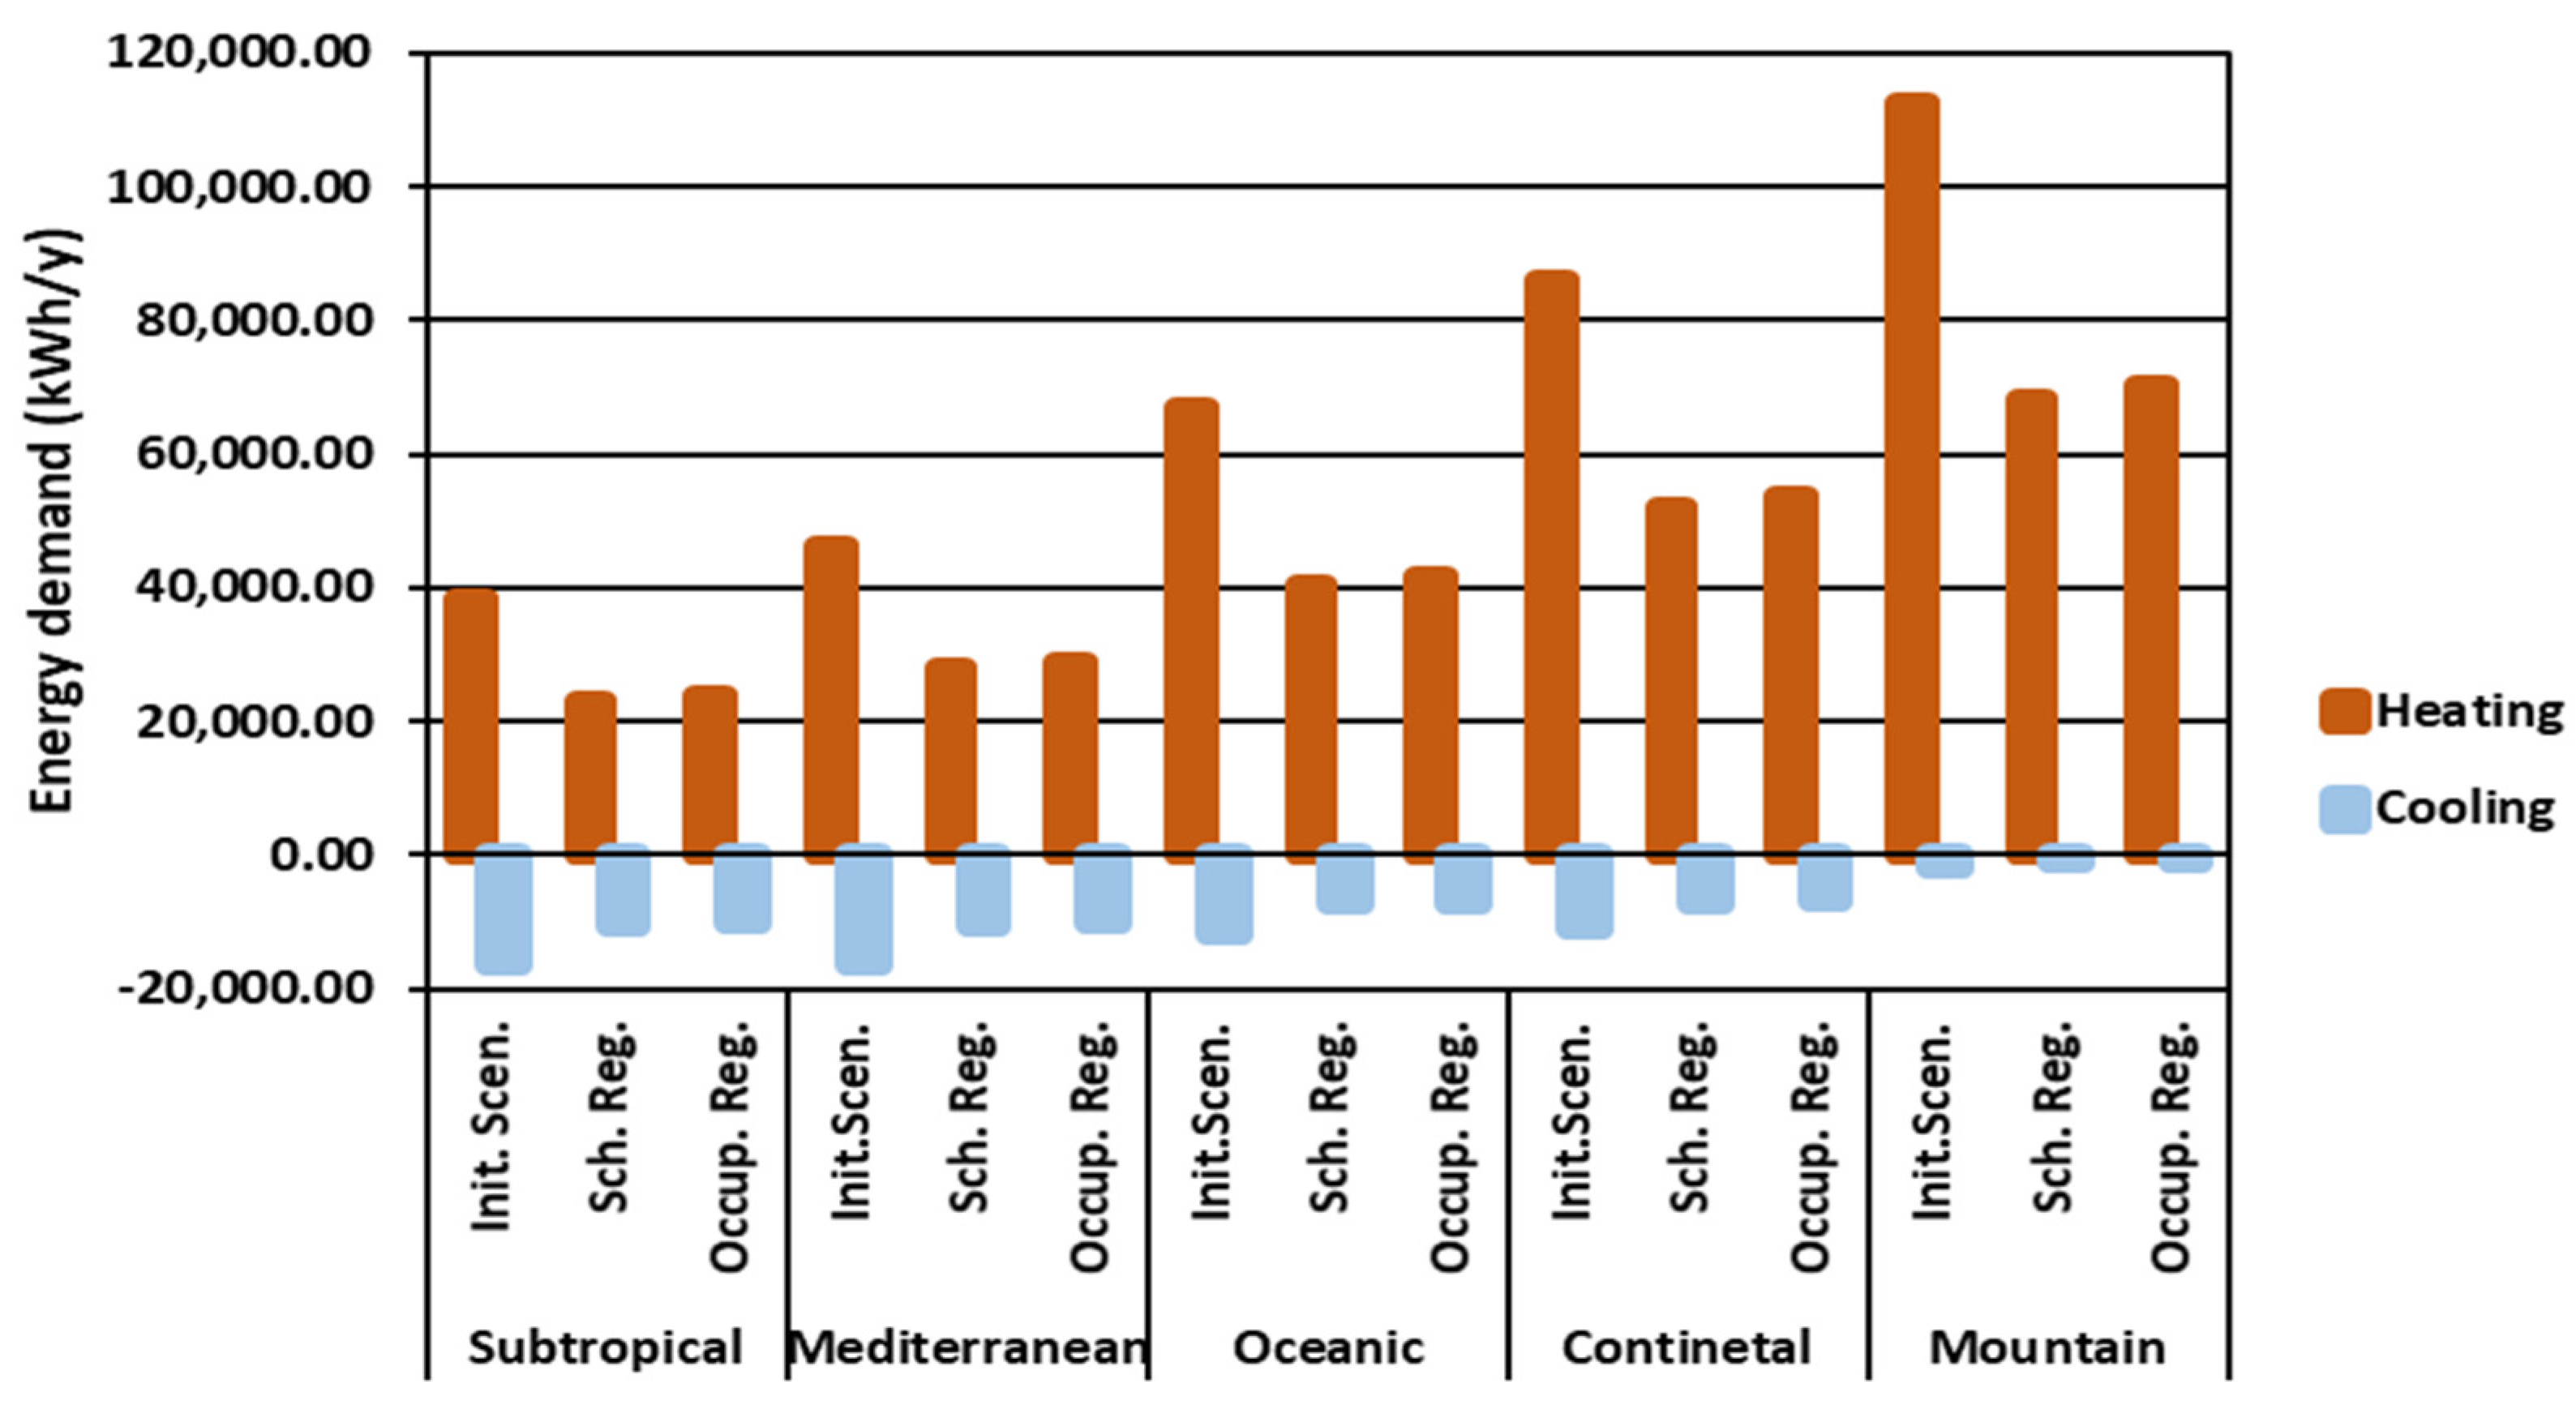
3. Results
The winter and summer energy demand of an OR working under the three strategies are shown in
Figure 9 for the five climate zones.
As shown in
Figure 9, heating consumption is much higher than cooling consumption. In terms of the control strategy used, schedule regulation is the best strategy. This is because the occupancy time considered was very conservative, with respect to those considered by the staff. However, there is a lack of experimental values in this regard.
On the other hand, the regulation by occupancy is very useful and versatile, allowing the OR to be used at all times. This is because the presence sensor restores the “OR with surgical occupancy” conditions, without the need to modify the working setpoints.
Results Obtained for the Case Studies
Once the thermal demands per OR were analyzed for the different climatic zones, the primary and final energy, CO
2 emissions, and costs were calculated for the three scenarios studied. These calculations were carried out by applying the reference values described above (3.2). The results obtained are shown in
Table 7,
Table 8 and
Table 9.
In all cases, hourly regulation is the strategy that requires the least energy, and the primary energy and emissions are also lower. This strategy does not require any investment, as the SCADA allows the system to be programmed for surgeries. This is not the case with the strategy by occupancy, which would require the ORs to be equipped with a presence sensor system.
5. Conclusions
A simulation has been carried out for the five climatic zones in Spain, which has made it possible to study the ventilation demand of ORs, hour by hour, with data from a real hospital center. Data can be exported to other ORs.
A 50% reduction in the discharge flow rate has been applied in ORs where there is no surgical activity, in accordance with Spanish and American standards. This allows one to maintain the asepsis of the OR, and a reestablishment of the occupancy conditions in less than five minutes.
The regulation by schedule is the system that allows greater energy, emissions, and economic savings. The presence-based system has been estimated to have a restitution time of 5% of the annual time, so the installation of a presence detector in the OR could reduce this time and improve or equal the schedule control.
The primary energy savings in the different climatic zones range from 48,060 (oceanic climate, occupancy strategy) to 53,579 kWh/year per OR (mountain climate, schedule control).
Emission savings vary in the different climate zones between 8775 and 15,765 kg/year per OR and economic savings between 2128 and 3114 EUR/year per OR with schedule control.


 ,
, 


