1. Introduction
Energy Communities (ECs) can play a significant role in the energy transition, with the potential to bring social and environmental benefits by unlocking private investments for Renewable Energy Sources (RES) and arguably improve efficient use of the grid. Two definitions of Energy Communities have been provided by the Clean Energy Package (CEP), the “Renewable Energy Community” and the “Citizen Energy Community”, introduced by the Renewable Energy Directive II (RED II) and the Internal Electricity Market Directive (IEMD), respectively. However, the provision in the CEP leaves much room for interpretation, each MS has thereby the freedom to choose how the major elements of the transposition process should be treated.
The energy transition calls for a contribution from every actor of the energy sector, including end consumers, who are now asked to assume an active role. This is a task that can be achieved by, for instance, participating in demand response schemes or investing in RES coupled with energy storage systems. Engaging consumers through collective energy actions can reinforce positive social norms and support the energy transition [
1]. Active consumers (i.e., prosumers) with common interests and goals can group together to form energy communities. Nevertheless, already, other similar forms of energy sharing initiatives have been adopted, such as energy cooperatives or energy clusters. Lowitzsch et al. [
2] indicate how RECs and renewable energy clusters are sociotechnical mirrors of the same concept, where energy community projects are compared in terms of compliance with the RED II governance requirements of heterogeneity of members and of ownership structure. Several works have been proposed regarding the regulatory aspect of energy communities under the CEP [
3,
4,
5,
6,
7], highlighting the barriers that can hinder the development of RECs including comparisons among the MSs enabling frameworks.
Since the development of energy communities is only at the early stages, it is relevant to identify the optimal portfolio for an energy community, given its local energy source availability and member consumption patterns. The environmental or economic goals of energy communities can be expressed through the objective function of an optimization problem. In this regard, MILP models are frequently used, in which linear constraints are used to represent the energy systems. Gjorgievski et al. [
8] evidence how the economic goals are the most dominant design objective, whereby the majority of them are translated in terms of a cost function that includes investment, operation and maintenance costs over the lifetime of the energy system, as proposed in [
9]. Thus, in order to analyse different goals, multi-objective approaches have been proposed to include environmental goals alongside the economic goals of the community. Fleischhacker et al. [
10] propose a multi-objective optimization model to quantify an EC’s trade-off curve of costs and emissions. A wide range of MILP models have been proposed in literature addressing optimization strategies for Renewable Energy Communities. Corsic et al. [
11] propose a MILP model whose objective function is the minimization of the total energy costs and the total CO
2 emissions of an energy community testbed based in Austria. Cielo et al. [
12] use self-consumption and self-sufficiency as key performance indicators for the energy community needs and objectives that can guide the optimization algorithm in the choosing process for the sizing of the active parts. Fioriti et al. [
13] propose a sizing methodology based on a custom business model for ECs, highlighting the key role of aggregators together with a sensitivity analysis on game-theoretic reward allocation measures. Norbu et al. [
14] provide a techno-economic model that compares the economic performance of investments in community-owned assets and individually owned assets.
Therefore, most of the applications of the aforementioned optimization models focus on the planning of ECs and fair redistribution of community benefits. However, the improvement of existing ECs and the economic conditions which make participation in RECs attractive for prosumers, to the best of the author’s knowledge, has not been fully investigated yet in detail.
The first contribution of this paper is application of the modified Mixed Integer Linear Programming optimization algorithm proposed in [
15] on a real case study of the energy community of Magliano d’Alpi, to evaluate whether the current structure of the EC under study could be further improved in economic and energetic terms. The objective is to assess to what extent increasing the current total generation capacity of the community can bring economic benefits in terms of the community Net Present Value (NPV).
Secondly, this paper proposes a methodology aimed at describing the relationship between a private user wishing to join the community and the REC, emphasizing which conditions pave the way for a profitable collaboration for the two sides. Furthermore, a last analysis based on a sensitivity approach is performed to highlight the key parameters which most influence the solution of the economic profitability for the private investor.
In conclusion, this research work provides the following key contributions:
Maximizing the amount of installed power in existing ECs;
Evaluating the economic feasibility of new passive or active members joining the EC and investing in a PV system;
Examining through a sensitivity approach the most significant factors influencing private investors’ willingness to join ECs.
The remainder of paper is structured as follows: in
Section 2, a detailed investigation of the current regulatory frameworks introduced by MSs regarding ECs is presented, underlying the main points of difference among the regulatory frameworks adopted.
Section 3 presents the case study on which the EC optimization model, detailed in
Section 4, is tested. Additionally, in
Section 4, the citizen engagement model is presented.
Section 5 discusses the results obtained with the simulations. Finally,
Section 6 summarizes the main conclusions on the proposed methodology.
2. Energy Communities in the EU
With the Clean Energy for All Europeans Package, the EU sets an important contribution to the long-term strategy of achieving carbon neutrality by 2050 and to facilitate the transition away from fossil fuels. The CEP is composed of eight legislative acts addressing the five dimensions of the Energy Union: energy security, the internal energy market, energy efficiency, decarbonisation of the economy and research, innovation and competitiveness. The CEP was conceived with the clear goal to expand consumer rights, promoting an active participation of the consumer in the power market, making it easier for individuals to produce, store or sell their own energy. Thus, the new instruments introduced to empower citizens not only stimulate the private investment in RES, but can help to achieve other ambitions, such as improving security of supply, introducing flexibility to the grid and providing environmental, economic and social community benefits for the local areas.
Before deepening the analysis on the definition of RECs and CECs, it must be pointed out that the development of ECs in the EU is still at the early stages, facing a transitory phase. Most of the frameworks developed so far in the EU are of a transitory nature too and often driven by pilot projects [
16,
17]. Hence, the analysis conducted in this study aims at shedding some light on the current adopted regulatory frameworks, acknowledging the fact that these frameworks only represent a temporary solution.
RECs and CECs, in order to be recognised as such, must assume a legal form, but the Directives do not specify the precise type of legal entity. Therefore, the first question for the citizens’ initiative concerns the legal forms which are the most appropriate (e.g., cooperatives, foundations, associations, etc.) according to the national law.
Both directives emphasise that these initiatives should not be profit-driven. However, this condition does not forbid CECs to make a profit. Therefore, it is clear that certain legal forms, such as private companies, would not comply with the EU legislation requirements. Open and voluntary participation is another requirement present in both definitions, which introduce a non-discriminatory approach. The openness requirement can be interpreted as RECs and CECs not being allowed to exclude eligible citizens arbitrarily, while the voluntary clause refers to the freedom of the members to leave the community at any moment. MSs should guarantee that members of the CEC maintain their rights as consumers: that is, the free choice of suppliers, and the possibility to switch suppliers or aggregators. Even though the two definitions seem to be very similar, there are some crucial differences that distinguish RECs from CECs in a very clear manner (see
Table 1). Some of them are:
Technological: While the CEC assumes a technology-neutral approach, REC instead specifies the production of energy exclusively from RES. This is already a net difference, as CEC allows production of electricity from any kind of resources, including production from fossil fuels.
Geographical limitation: RED II binds the REC in terms of local communities. It is specifically required for shareholders or members to be located within the proximity of the renewable energy projects that are owned and developed by that community. This condition is absent in the IEMD. Clearly, the proximity concept leaves much room for interpretation for MSs, which can adopt different solutions.
Membership and effective control: the IEMD clearly states that “membership of citizen energy communities should be open to all categories of entities” (IEMD, recital 44). Therefore, the CEC accepts members that can have the energy sector as their primary area of economic activity. On the contrary, actors eligible to participate in a REC are natural persons, SMEs (whose participation does not constitute their primary economic activity) and local authorities (including municipalities). Therefore, only for RECs do limitations apply, excluding large enterprises. A further difference is present in the two definitions regarding which members or shareholders can effectively control the community. In this context, effective control is to be interpreted as the ability of a group of members/shareholders to exert a decisive influence in the community decision-making, even though no official definition is provided in the CEP. As far as CECs are concerned, it is mandatory that the decision-making powers should be attributed only to natural persons, local authorities and small enterprises. In other words, medium and large enterprises are not excluded from membership in CECs, but should not be able to exert effective control of the community. Moreover, in RECs, the effective control should be in the hands of shareholders or members that are located in the proximity of the renewable energy projects owned and operated by the community.
Activities: RECs and CECs are both entitled to engage in activities of generation, consumption, supply, energy sharing, energy storage, aggregation and management of distribution networks. CECs can as well engage in the provision of energy efficiency, charging, and managing of distribution networks, therefore assuming the role of a DSO.
2.1. RED II Transposition Progress in the EU
The provision in the CEP leaves much room for interpretation, each MS has thereby the freedom to choose how the major elements of the transposition process should be treated. The first layer of this paper encompasses a study on the regulatory and legislative frameworks adopted by Germany, France, Portugal, Greece and Italy regarding RECs.
2.1.1. Germany
Ownership of renewable energy projects, by citizens or communities, has a strong tradition in Germany, along with northern European countries. The revision of the Renewable Energy Act (Erneuerbare-Energien-Gesetz, EEG) in 2017 introduced the first ever definition of “
Bürgerenergiegesellschaft” or ‘Citizen Energy Company’. The Citizen Energy Company consists of at least 10 natural persons. Additionally, 51% of the voting rights must be held by natural persons who are located in the urban or rural district in which the onshore wind project is planned to be built. In addition, no member can hold more than 10 percent of the voting rights of the undertaking [
18]. Project size is limited to six turbines with a total capacity of up to 18 MW. Solar and wind projects smaller than 750 kW are allowed to be built without participating in the auction mechanism. To facilitate the accommodation of community wind in auctions, the
Bürgerenergie was introduced. This particular type of EC is technology-specific, aiming to facilitate the development of wind power projects, whereby wind-based ECs are granted a series of privileges in the auction mechanism. However, when comparing the German Energy Community provision to the RED II, one should consider that the EEG was adopted without the RED II and the IEMD in mind.
2.1.2. France
With the Ordinance N° 2021-236 of 3 March 2021 [
19], France began officially the transposition process for both the RED II and the IEMD by introducing a framework for “
Communautés d’énergie renouvelable” (or Renewable Energy Communities) in Article 5 (Art. L. 291-1) and “
Communautés énergétiques citoyennes” (or Citizens Energy Communities) in Article 5 (Art. L. 292-1). A REC is described as an autonomous legal person to which participation is open and voluntary, where members or shareholders are natural persons, SMEs, local authorities, or groups of these. Participation of an SME is allowed only if it does not constitute its primary commercial or professional activity. The concept of REC introduced by the French Law is quite identical to the one present in Article 2 (16) RED II.
2.1.3. Greece
On 17 January 2018, the Greek Parliament adopted Law N° 4513/2018 [
20] which sets the legal framework for energy communities or ‘
Energiaki Kinotita’. ECs are placed at the centre of the energy transition, with the aim of stimulating active participation of local actors, providing sustainable energy and tackling the energy poverty issue. Energy poverty in Greece is a major issue that has gained further attention after the 2008 economic crisis. Therefore, tackling energy poverty is a top priority among the several purposes of ‘
Energiaki Kinotita’. The Greek definition of ECs diverges in many points with respect to the definitions given by RED II and IEMD. For instance, despite not being explicitly mentioned, Article 6 implicitly distinguishes EC between profit or not-for-profit on the basis of surplus distribution [
21]. Both types must allocate at least 10% of the surplus as legal reserve for the EC. For what concerns a for-profit EC, the surplus (after being deducted for the legal reserve) is allowed to be distributed among its members, as long as the EC consists of at least 15 members and 51% of them are physical and not legal persons. Instead, the surpluses of a not-for-profit EC must remain in the EC in the form of reserves that can be used for pursuing other EC goals.
2.1.4. Portugal
‘Comunidade de Energia Renovável’ is the Portuguese name given for Renewable Energy Communities introduced in October 2019 by Decree-Law N° 162/2019 [
22], partially transposing RED II. This Decree-Law aims to promote and facilitate self-consumption of energy and renewable energy communities, eliminating unjustified legal obstacles and creating conditions to simplify active participation in the energy transition of companies and citizens interested in investing in the renewable and distributed energy resources necessary to cover the respective consumption. Similar to Greece, ECs are seen as a key tool to tackle the growing energy poverty problem and are given the possibility to be profit profit-oriented or not, although the main purpose is still to provide to its members environmental, economic and social benefits, rather than financial profits. Dispatch N° 6453/2020, published on June 2020, establishes the conditions for exemption from charges corresponding to the Cost of General Economic Interest (Custos de Interesse Económico Geral, CIEG) for consumers who produce and inject energy into the network through collective self-consumption projects or energy communities [
23]. According to the Dispatch N° 6453/2020, RECs can benefit from a 100% exemption of the CIEG.
2.1.5. Italy
The Italian experience with energy communities has been limited so far. There are three main initiatives (èNostra, WeForGreen and Energia Positiva) which have emerged and managed to expand their member base and develop multiple projects [
24]. It was only on 28 February 2020 that the Italian Government made a first step toward the national transposition of Articles 21 and 22 of the EU directive 2018/2001 (RED II) concerning Renewable Energy Communities, with the conversion of the Decree-Law “Milleproroghe” [
25] into Law N° 8/2020 [
26]. The nature of the regulatory framework is experimental, allowing in advance the activation of collective self-consumption schemes and the creation of the first renewable energy communities, namely, ‘
Comunità di Energia Rinnovabile’, while awaiting the completion of the RED II transposition (officially transposed in November 2021). It is worth pointing out the proximity requirement interpretation by the Law, specifying that participants must be connected on the low voltage grid underlying the same medium-to-low voltage substation (Secondary Substation). The same applies to community renewable plants, with the additional condition to limit new plants (i.e., having entered into service after 1 March 2020) installed power up to 200 kW.
The Resolution Document (318/2020/R/EEL) published on the 4 August 2020 by ARERA [
27], the Italian National Regulatory Authority, sets out the transitory regulatory framework for RECs and collective self-consumers of renewable energy. The “virtual” scheme is chosen as the preferred regulatory model in order to valorise the energy shared by avoiding the intervention on existing infrastructure (e.g., building new distribution lines), where the energy shared is explicitly defined as the minimum, on an hourly basis, between the electricity produced and fed into the grid by renewable sources plants and the electricity taken from all the associated end customers. It is worth pointing out that the simplicity of the virtual model allows for a direct implementation, although it requires the intervention of a third party, precisely, Gestore dei Servizi Energetici (GSE), which is left in charge to present to the EC representative the yearly revenues arising from the energy shared by the community. In other words, members of the community still pay their retailer for every kWh of electricity withdrawn from the grid, the energy shared is not directly discounted in the electricity bill, instead, the revenues arising from energy shared and given by GSE are redistributed among members on the basis of the internal rule of distribution of the community. The same Resolution defines an economic refund on the variable components of the transmission and distribution charges for the shared energy. Since the energy produced is supposed to be consumed locally (i.e., behind the same secondary station), members can obtain a refund on the variable components of the transmission and distribution charges for the shared energy. As these variable components change every year, the refund value is updated accordingly. As of 2021, the refund amounts to 0.856 €c/kWh. In addition, with the Ministerial Decree on 16 September 2020 [
28], the Ministry of Economic Development (MiSE) has introduced the incentive schemes, consisting of a feed-in-premium tariff of 110 € for each MWh shared for RECs for the duration of 20 years. In conclusion, the Italian RECs income voices are:
A refund on the variable components of the transmission and distribution charges in the energy bill for the shared energy, defined by ARERA and delivered by GSE. Equal approximately to 8 €/MWh for RECs;
An incentive on shared energy equal to 110 €/MWh for RECs, defined by MiSE and delivered by GSE;
Remuneration for the energy injected into the grid evaluated at the zonal price by GSE (wholesale prices are calculated for six market zones determined with a zonal approach. The weighted average of zonal prices is used to compute the Prezzo Unico Nazionale (PUN), used as clearing price);
Financial discounts for community renewable projects.
2.2. Regulatory Frameworks Comparison
Although RECs are used as a way to enhance local consumption of energy, by fostering new RES installations in the distribution grid, most of the MSs under study (e.g., Greece) find RECs to be a powerful tool to tackle and to raise awareness on the growing energy poverty issue. The definition provided by Greece concerning Energy Communities is quite broad and can be considered as a mix between RECs and CECs definitions, since other forms of energy resources, aside from renewables, are included in the generation mix of a Greek Energy Community. It is worth noting that while MSs such as Italy, Portugal and France allow energy production for communities exclusively from RES, in line with the REC definition by the EU, Germany restricted energy production for communities only from wind power plants, although this approach was adopted without the RED II in mind. The drivers pushing MSs for the implementation of a specific REC definition, with respect to another, are not explicitly declared, although some insights can be found in their relative National Laws. For example, Italy has chosen the virtual model to avoid unnecessary duplication of existing distribution lines. The most relevant matter of discrepancy, arising from the transposition analysis, among the solutions adopted by each MS regards the proximity requirement to the community renewable energy project. Some countries (e.g., France, Greece) interpret the proximity requirement in terms of geographical distance from the renewable energy project, while others, such as Italy, evaluate the latter requirement in terms of electrical distance, i.e., connection to the LV grid under the same MV/LV transformer. The main features of the transposition progress are summarised in
Table 2.
4. Materials and Methods
4.1. Energy Community Model
The energy community is supposed to be composed of a set of users and a set of generators. Each passive user is connected to the grid by means of a specific Point Of Delivery (POD), while generators can be connected to a dedicated POD as well as to one of the POD of the passive users. Regardless of the connection points, it is assumed that the REC owns generators and storage within the community.
Given this configuration, the energy consumed by each user can be categorized in three different ways:
Self-consumed—It is produced and consumed under the same POD;
Shared—It is produced by a generator of the community, and it is consumed by users of the community connected to different PODs;
Bought—It is bought from the market if the production of the REC’s generators is not enough to satisfy the request of passive users.
The energy balances are evaluated hourly (the hourly time step was chosen to comply with the hourly electricity wholesale market prices) to quantify the energy produced, self-consumed, shared, bought and sold from the single users’ and the community’s perspectives. The installation of new generators for the community is evaluated, and the relative economical revenues provide different incomes for the community.
With respect to the economic perspective, the optimal solution is commonly defined as the one that maximizes the net present value of the investment for the energy community. NPV is calculated as:
where
is the initial investment and
is the cash flow at year
, discounted during the expected asset lifetime (
) and
DR is the discount rate.
The investment term is equal to:
where
is the generator capacity per each
j and
is its average cost of installation,
and
are the energy storage system capacity and its average unit cost (per kW, kWh).
For each year
, the net cash flow is evaluated as the sum of savings (
), revenues (
), financial incentives (
) and minus cost (
):
The savings for each year
are the sum of the instantaneous savings due to self-consumption of each member
and the saving due to shared energy in the considered year.
is the energy selfconsumed by user
, while
is the energy shared within the energy community. In both cases, the cost of the energy
is saved. Moreover, other tariff components are also saved: these are synthetized in the
Self Consumption Saving Index (SCSI) and the
Shared Energy Saving Index (SESI).
The revenues at year
come from the energy sold to the market in each time step or from the incentive
.
In some particular cases of the Italian context, there is the possibility of deducting a part of the investments in photovoltaic generators from the taxes of the years following the investment. This financial incentive can be treated as a yearly revenue from year
to
and can be evaluated as:
The total cost at year
is:
Since the benefits are mainly given by the energy shared and self-consumed, there will be an optimal choice for the type and size of the power plants, given the local availability. Operational cost of the generators are considered, and some administration cost are also taken into account. The complete model of the renewable energy community and the investment in new power plants has already been detailed in [
15].
4.2. Proposed Citizen Engagement Model
The model presented so far is capable of obtaining the overall NPV of a community where costs and revenues are considered as monetary flows of a single entity. However, in reality, the return on investment should be evaluated for each actor involved in a community project. This problem is indeed community-specific, as the rules for the sharing of benefits are not defined by law but instead depend on the private agreement among REC participants. In other words, a profitable investment does not always imply a sufficient return for all individual investors. It is relevant to investigate which economic agreement is advantageous for both the REC and the citizen. For this reason, the current paper considers a citizen whose interest is to invest in a renewable generation plant and who faces the issue of evaluating whether to join a REC or apply for other support schemes. At the same time, the REC perspective is evaluated as well, to identify under which conditions the new prosumer can actually bring a positive effect on the community incomes.
As a key assumption, the citizen takes percentage k of the annual profits arising from the incentivised shared energy and the energy fed into the grid remunerated at wholesale market price. It is the value of k that consequently determines the return on investment of the private investor, thus influencing their willingness to join the REC. The focus of this analysis is to identify under which conditions successful business plan can increase the growth of a REC measured through the engagement of new members. The approach chosen is to pay back the citizen investment in a renewable generation power plant through the application of a redistribution coefficient k to the yearly community earnings. It is up to the REC representative and the private investor to find a compromise on the value of k. The chosen value should at least guarantee a return on investment for the citizen, whilst providing positive marginal revenues for the whole community as well. The private investor (i.e., the citizen) in this analysis is considered as the applicant, which is not yet part of the EC. Thus, when referring to the set of EC members, it is implied that the private investor is excluded from such set, as their application is considered still under evaluation.
Hence, the economic balances are formulated as follows:
where
is the yearly economic revenue of the applicant, while
is the yearly economic revenue of the community. For the applicant, the main three sources of income consist of (i) the savings obtained each year by self-consuming produced energy
, (ii) the revenues arising from the energy shared to the community
and (iii) the revenues arising from the surplus sold to the market
. Note that only a percentage
k of the revenues from shared and injected energy are kept in the applicant’s pocket. In the same fashion, the incomes of the community depend on the monetary flows among its members and an additional term, representing the extra money earned from the applicant.
4.3. Sensitivity Approach
Unquestionably, the value of k plays a crucial role in the model of citizen engagement. However, the evaluation of the latter is accomplished only for a specific community configuration. For this reason, to further expand the study of the conditions which promote the participation of an active user in the energy community, a sensitivity approach was implemented to assess the parameters which mostly influence the return of investment for the applicant. In particular, the following parameters are considered:
Redistribution parameter k;
EC installed generation capacity Pec;
EC members N;
Electricity wholesale prices (e.g., PUN and Pzonal).
The community generation capacity Pec is the summation of all the installed and operating capacity in the community. The choice was made for evaluating the introduction of a new member (i.e., the applicant) under different portfolio configurations of the community. For the same reason, the applicant is excluded from the member’s set N. The number of EC members can be translated in terms of annual electricity demand from the community , whereas Pec provides information on the annual production of electric energy from the community . The ratio between and is a key indicator used in this work to classify two distinct community conditions: excess and scarcity of production. In this context, a community is in scarcity if the ratio is smaller than 30%, while for values greater than 50%, an excess is reached. In other words, under the same value of k, the applicant’s NPV changes accordingly to the current state of the EC. Furthermore, electricity wholesale market prices are yet another vital parameter for the economic balances of the applicant. In the model, the prices of the reference year are subject to a percentage variation throughout the years of simulation. Therefore, the aim is to assess to what extent market prices play a dominant role on the return on investment for the applicant with respect to the other selected parameters. Thus, for each economic analysis, the wholesale market price reference year was changed to understand, for instance, how the solution would deviate by using the 2019 PUN prices or the 2020 PUN prices.
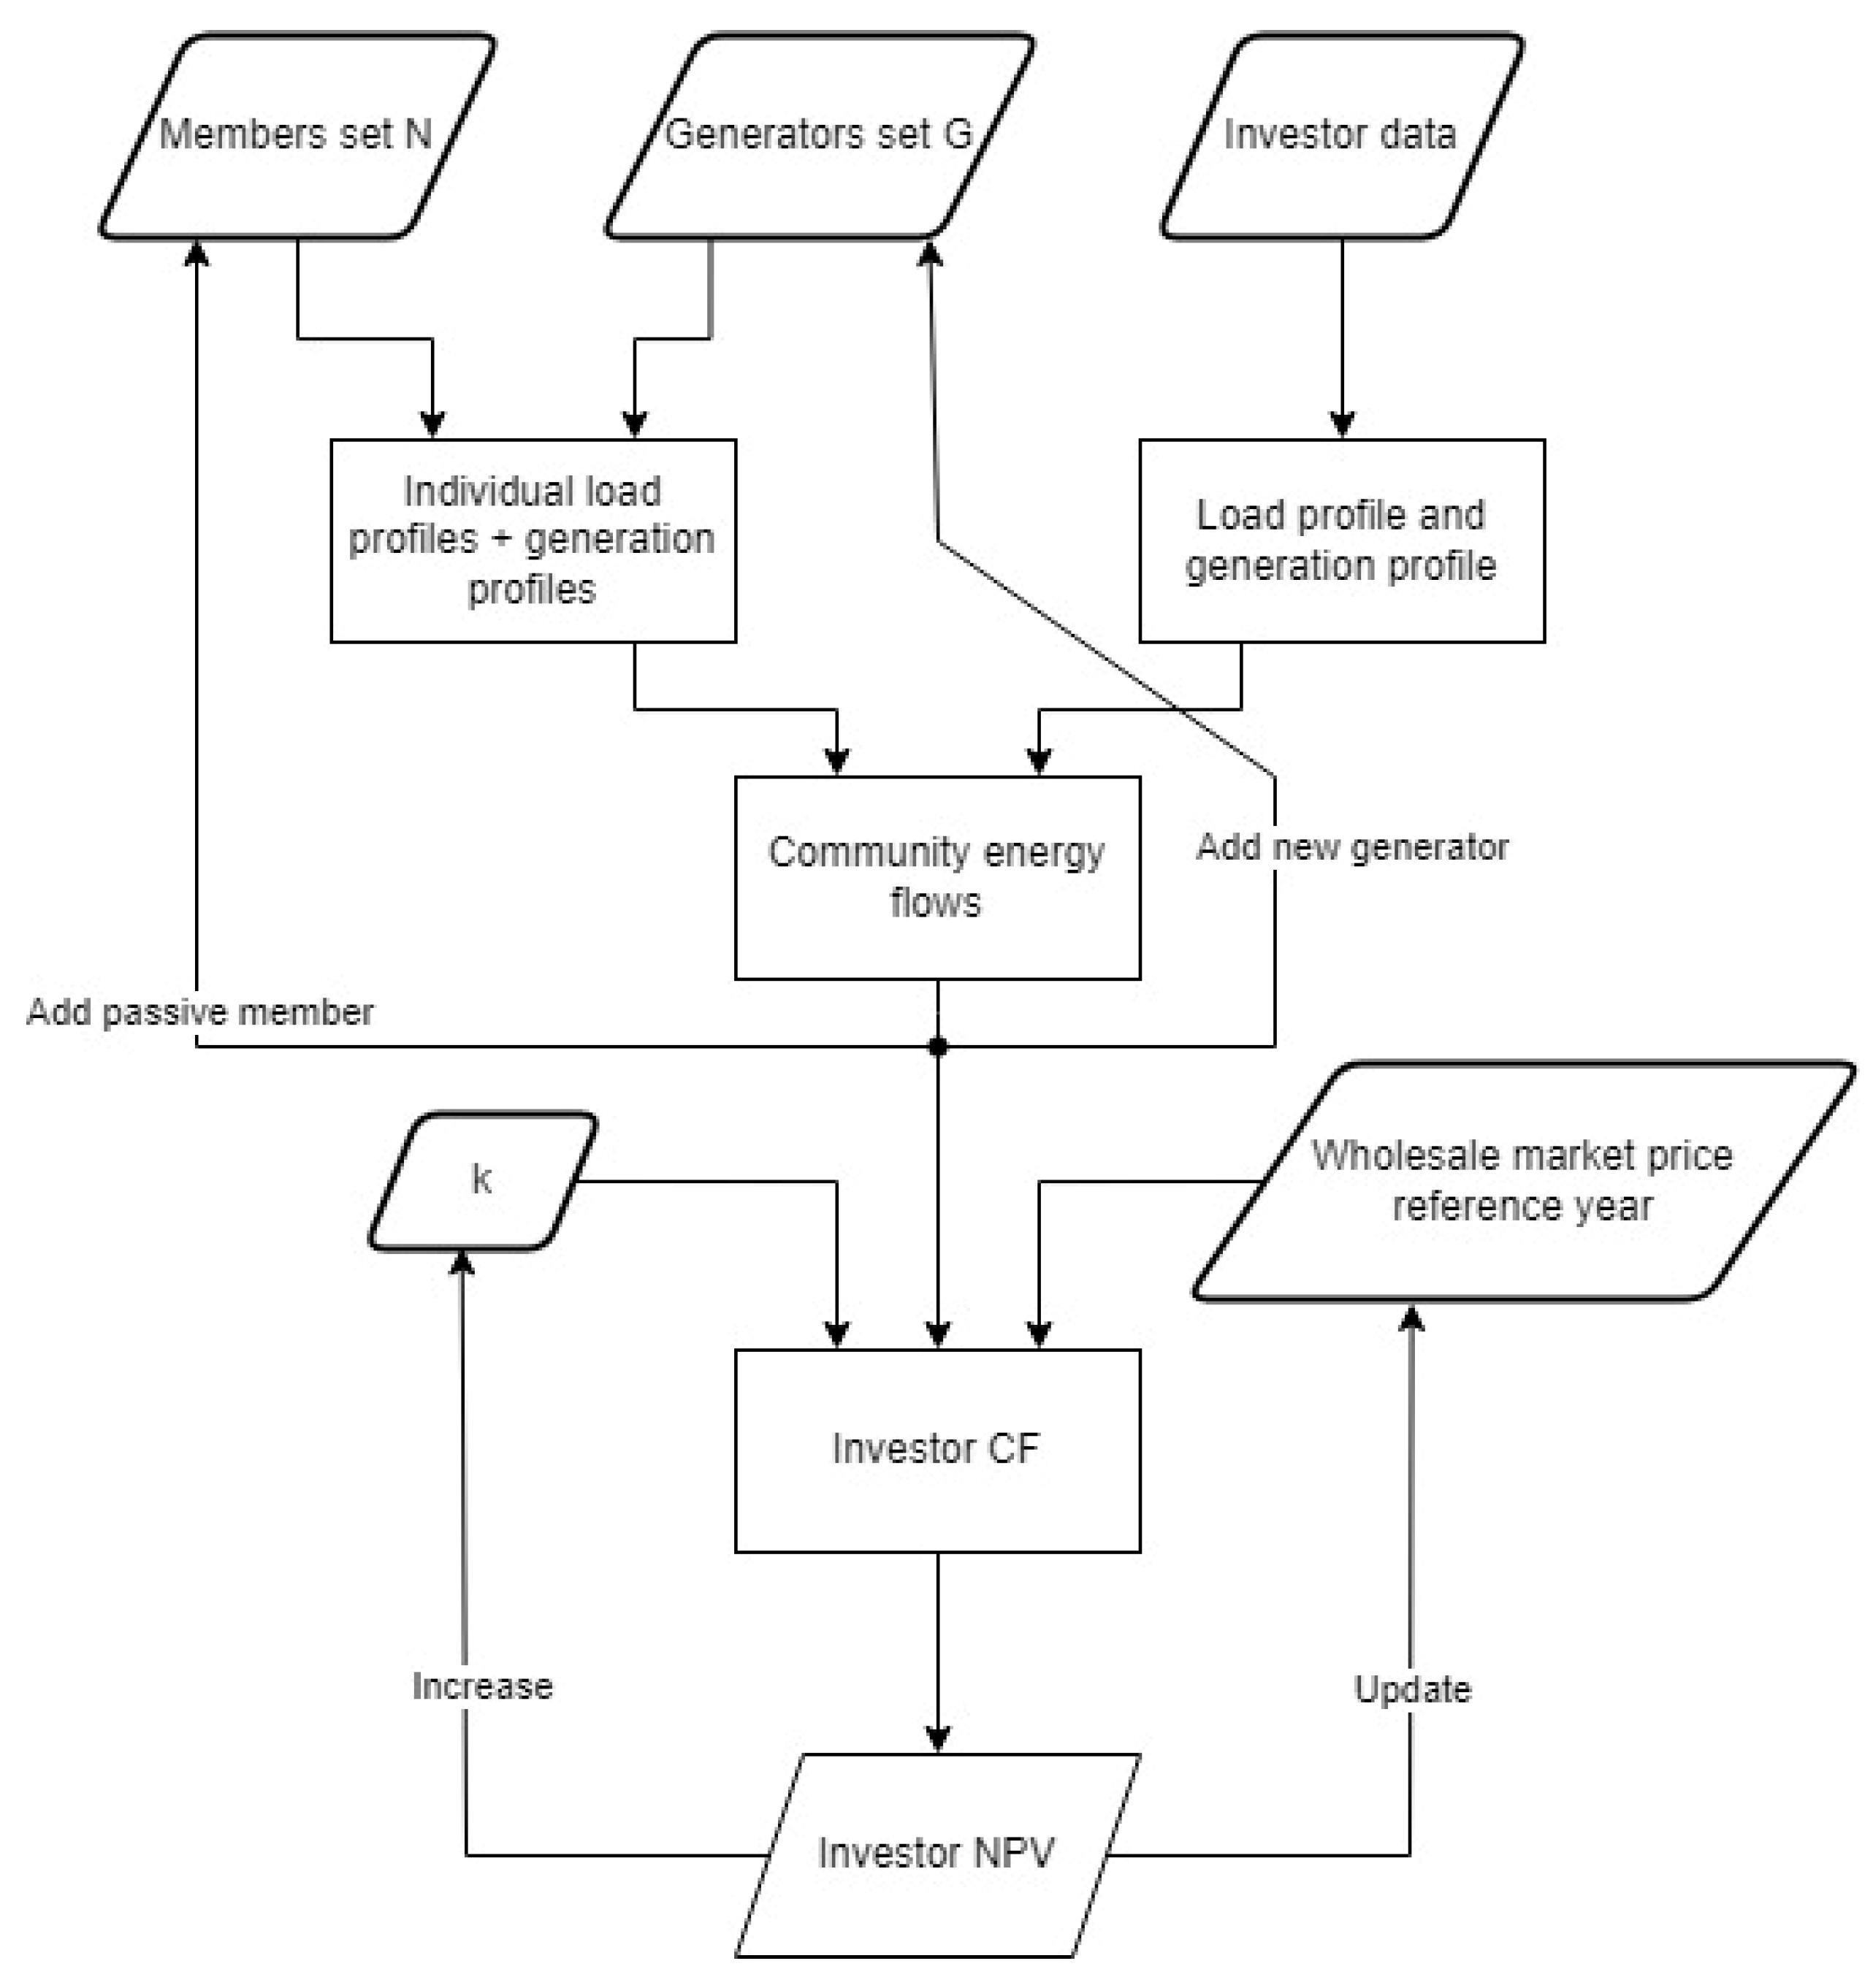
The flow chart depicted in
Figure 1 is introduced to better illustrate how results have been achieved. In order to compute the investor Cash Flow, it is necessary to investigate the hourly energy balance of the energy community and to evaluate the possible contribution resulting from the investor. Hence, in order to simulate the whole energy community, production and load profiles of all actors must be provided as input. In a second step, in order to take into account the investor possible contribution, the number of generators and of passive members is increased. The implications of this procedure are twofold. First, the addition of a new generator can be seen as the conversion of a member from passive to active (i.e., becoming a prosumer), which in turn implies further electricity production while reducing the community’s deficit. Second, the introduction of a new passive user contributes only to the growth in energy demand by the community.
The energy flows for each community configuration are then used to find the CF of the investor for every year of the investment’s expected life. Thus, the obtained cash flows are provided to the algorithm to calculate the NPV of the investment. Indeed, in our analysis, the revenues collected by the investor depend also on the value of the redistribution factor k and on the wholesale market price reference year. Consequently, the NPV is iteratively recalculated for each community configuration by increasing the value of k and updating the reference year for the electricity market wholesale prices.
In the simulations performed, wholesale market prices from 2019, 2020 and 2021 were taken into consideration. The generation capacity of the community was increased from the initial value of 35 kW to 95 kW, with a step of 15 kW, while to each additional passive member, the load profile of user 9 was attributed, consisting of almost 8500 kWh of yearly electricity consumption (this results as the energy need of an user with a very high energy need, e.g., a house provided with electric heating and e-mobility equipment).
5. Results
5.1. Reference Case
The set of generators in this context is exclusively composed of the existing ones (i.e., PV 1, PV 2 and PV 3), thus, no optimization occurs in this case. The results indicate that the total amount of installed power (reaching almost 29 kW) is sufficient to supply nearly 24% of the total electricity demand in a year. Consequently, the revenues emerging from self-consumed, shared and injected energy allow a positive return of investment for the renewable projects of the community, with the NPV is equal to 39,943 €. (The software used in this work was built based on the Python language. In particular, for the optimization, the library Pyomo was adopted.)
5.2. REC Optimal Planning Results
The energy community model described in
Section 4.1 is developed to work on a green field scenario. That means that it is perfectly suitable for building a new energy community from scratch. The optimization algorithm will assign to each member a certain value of installed power based on the input data provided (e.g., rooftop surface availability, generator costs, load profile, etc.) However, these applications are mostly relevant in the designing process of an EC. The changes introduced to the algorithm are focused to make the model provide useful applications for existing energy communities, enabling REC representatives to understand how the community could be improved from an energetic and financial perspective (i.e., expanding the community portfolio).
The simulations performed on the case study are based on the following scenarios:
Case 1 (Green field): the existing generators are considered as available. Thus, there is no pre-selected generator.
Case 2 (Brown field): given the existing assets of the community and the available generators, the model iterates to find the new optimal capacity among the available generators.
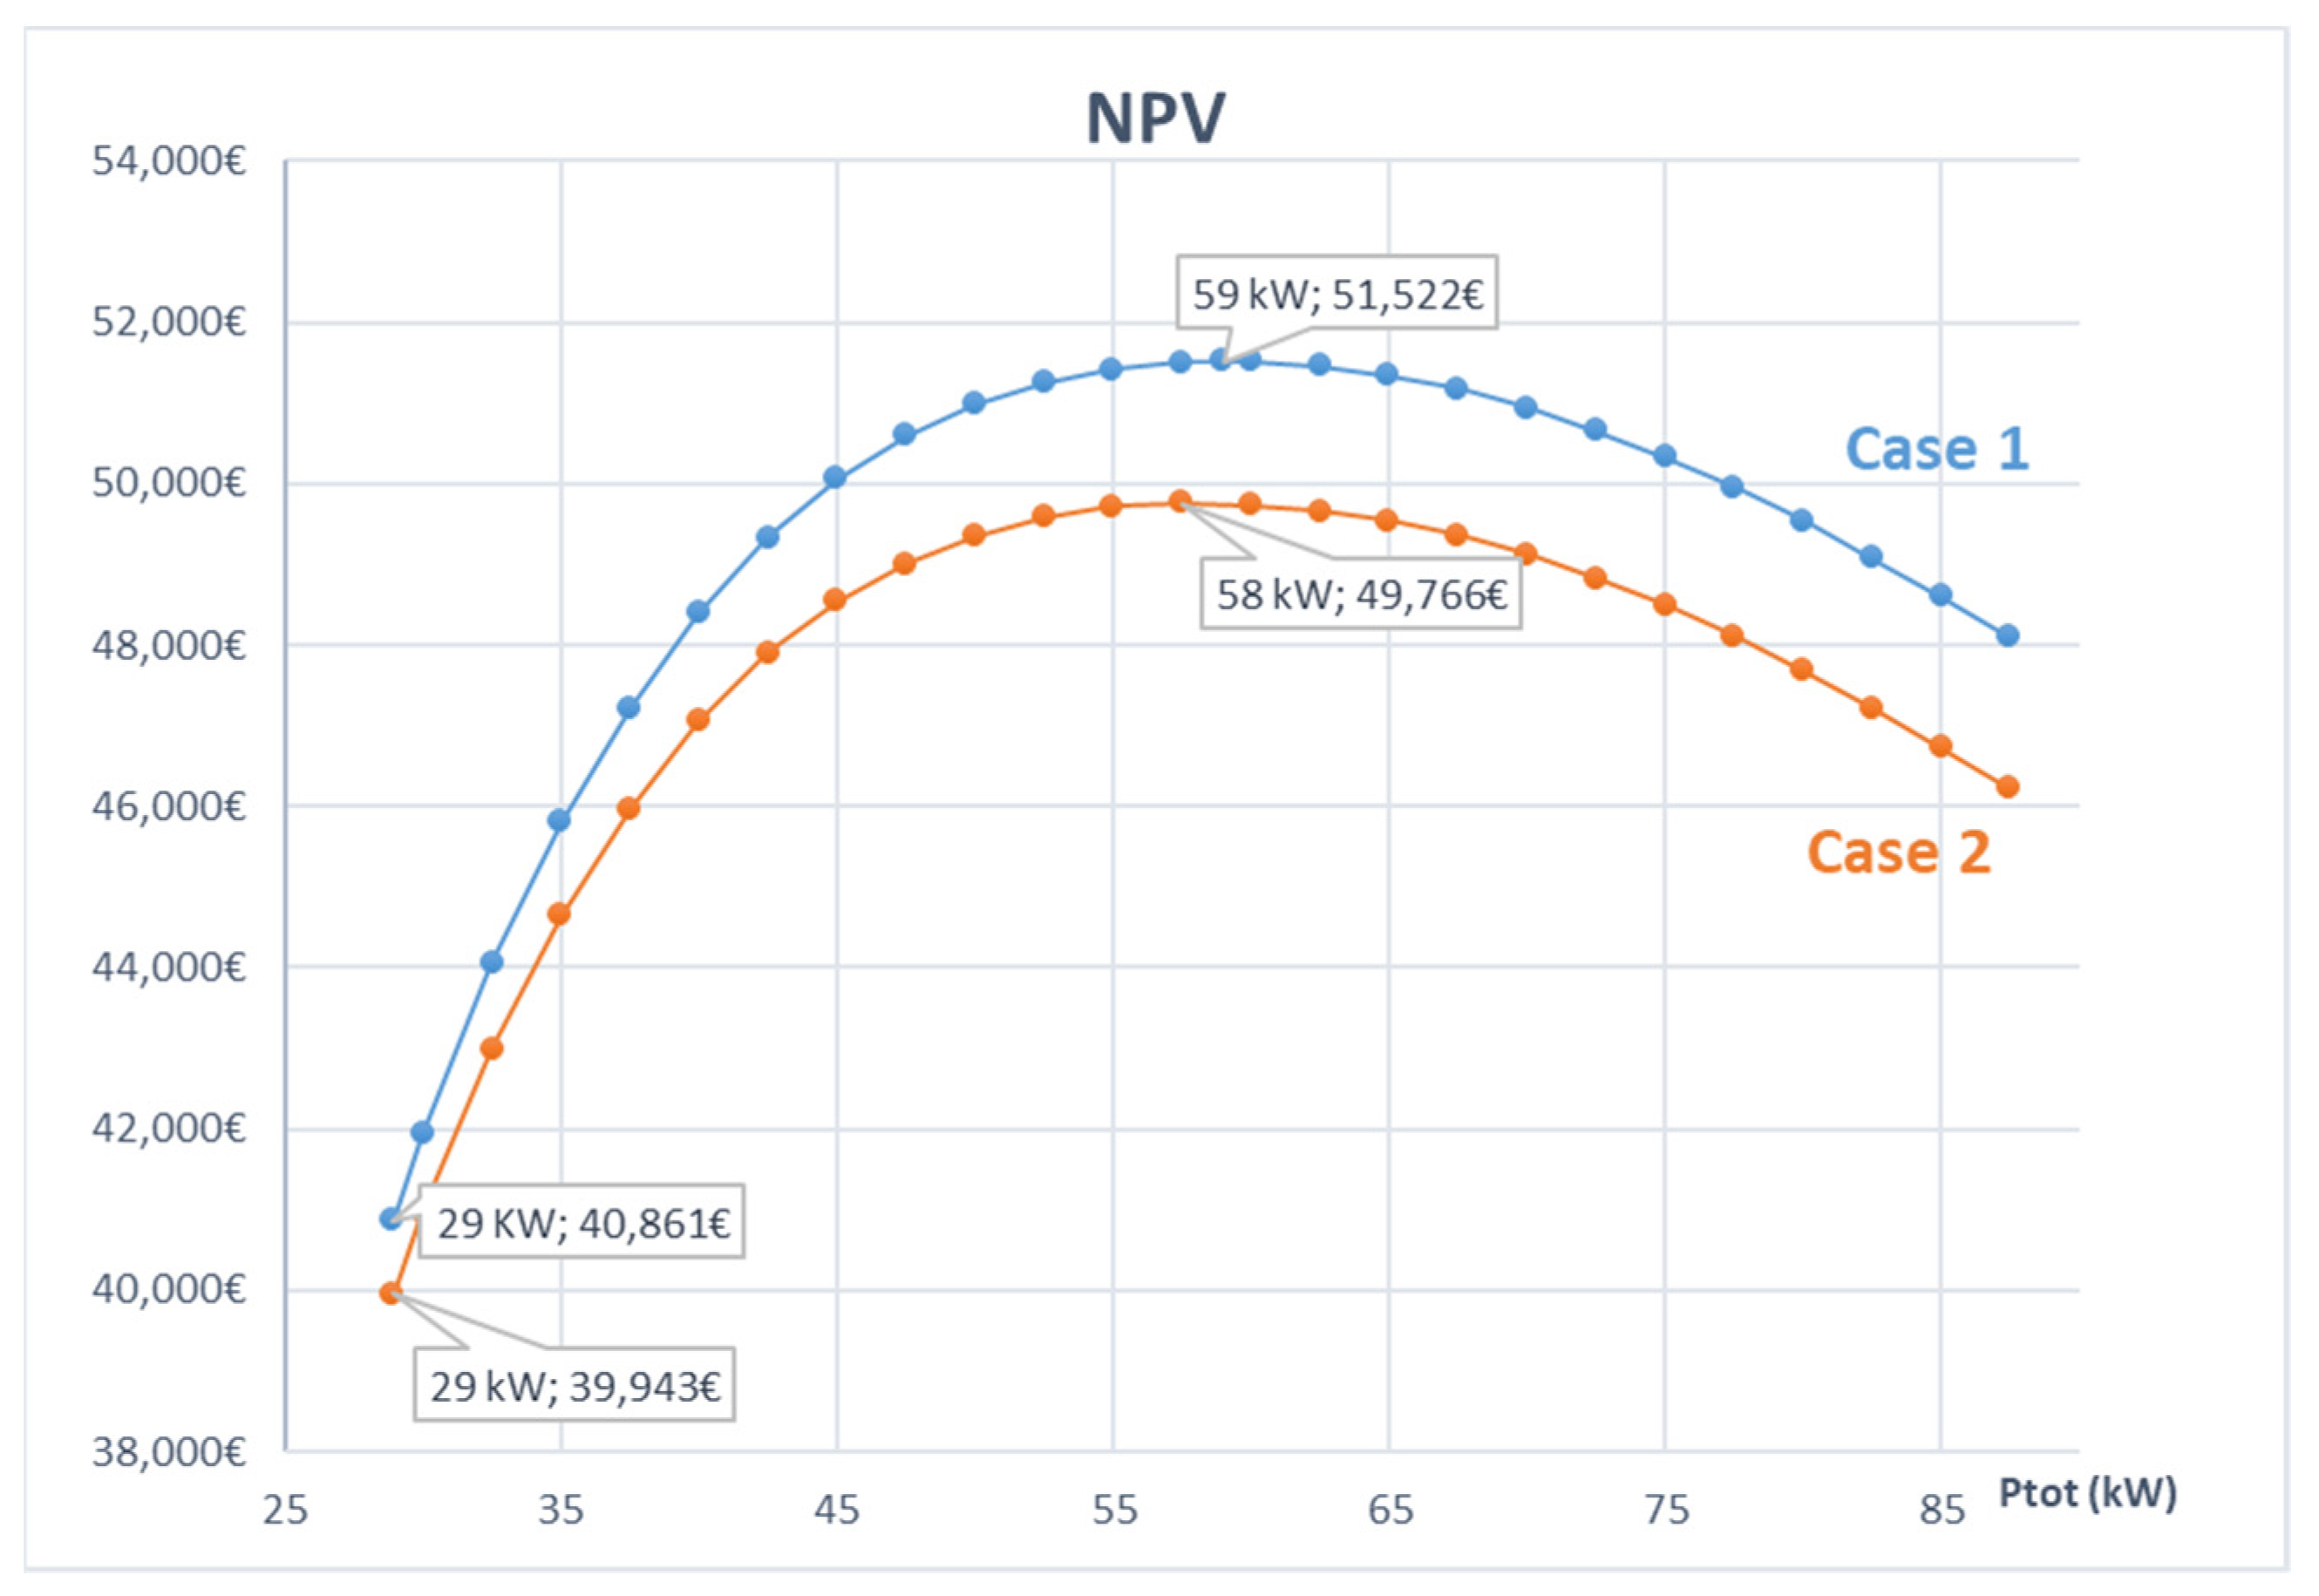
Table 6 reports the capacity allocation obtained for the simulation of the two cases. For the Green Field scenario, the total capacity installed amounts to 59 kW, 30 kW more than the current installed capacity in the EC of Magliano d’Alpi. It is worth noting that, in the Green Field scenario, users U1 and U3 would not obtain any installed power. This is already a key difference with respect to the reference case, where the total generation capacity was composed of User 1, User 2 and User 3. The reason behind this is that PV 1 is characterised by the highest Capex of all generators (2000 €/kW), while PV 3 does not benefit from financial incentives. Not surprisingly, the installed capacity for PV 2 corresponds to its rated power as it is characterised by the lowest investment cost. Hence, in the optimal planning, generators PV 1 and PV 3 would not have been part of the community portfolio.
With respect to generators PV 4 to PV 13, the capacity allocation performed by the optimisation algorithm is almost random, since these generators share the same fixed and variable costs, as well as the same unitary production profile. In these cases, the members of the community could decide on how to select the generators. It is worth noting that the capacity allocated to member 11 suggests that the model tries to attribute a greater generation capacity to those members whose self-consumption is higher. However, this point requires further investigation. A similar reasoning holds as well for the Brown Field scenario, where the capacity allocation to generators PV 4 to PV 13 is differentiated from the one obtained in Case 1. Thus, to really capture which are the best, in an existing REC, it would be essential to provide detailed information about the economic costs and production profiles for each generator. In this study, all generators from PV 4 to PV 13 behave economically essentially in the same way, only the consumption profile related to the owner varies. Consequently, the solution provided by the model, with the input data described in
Section 2.2, provides an insight into the optimal additional capacity for the community, rather than which generator is best to install.
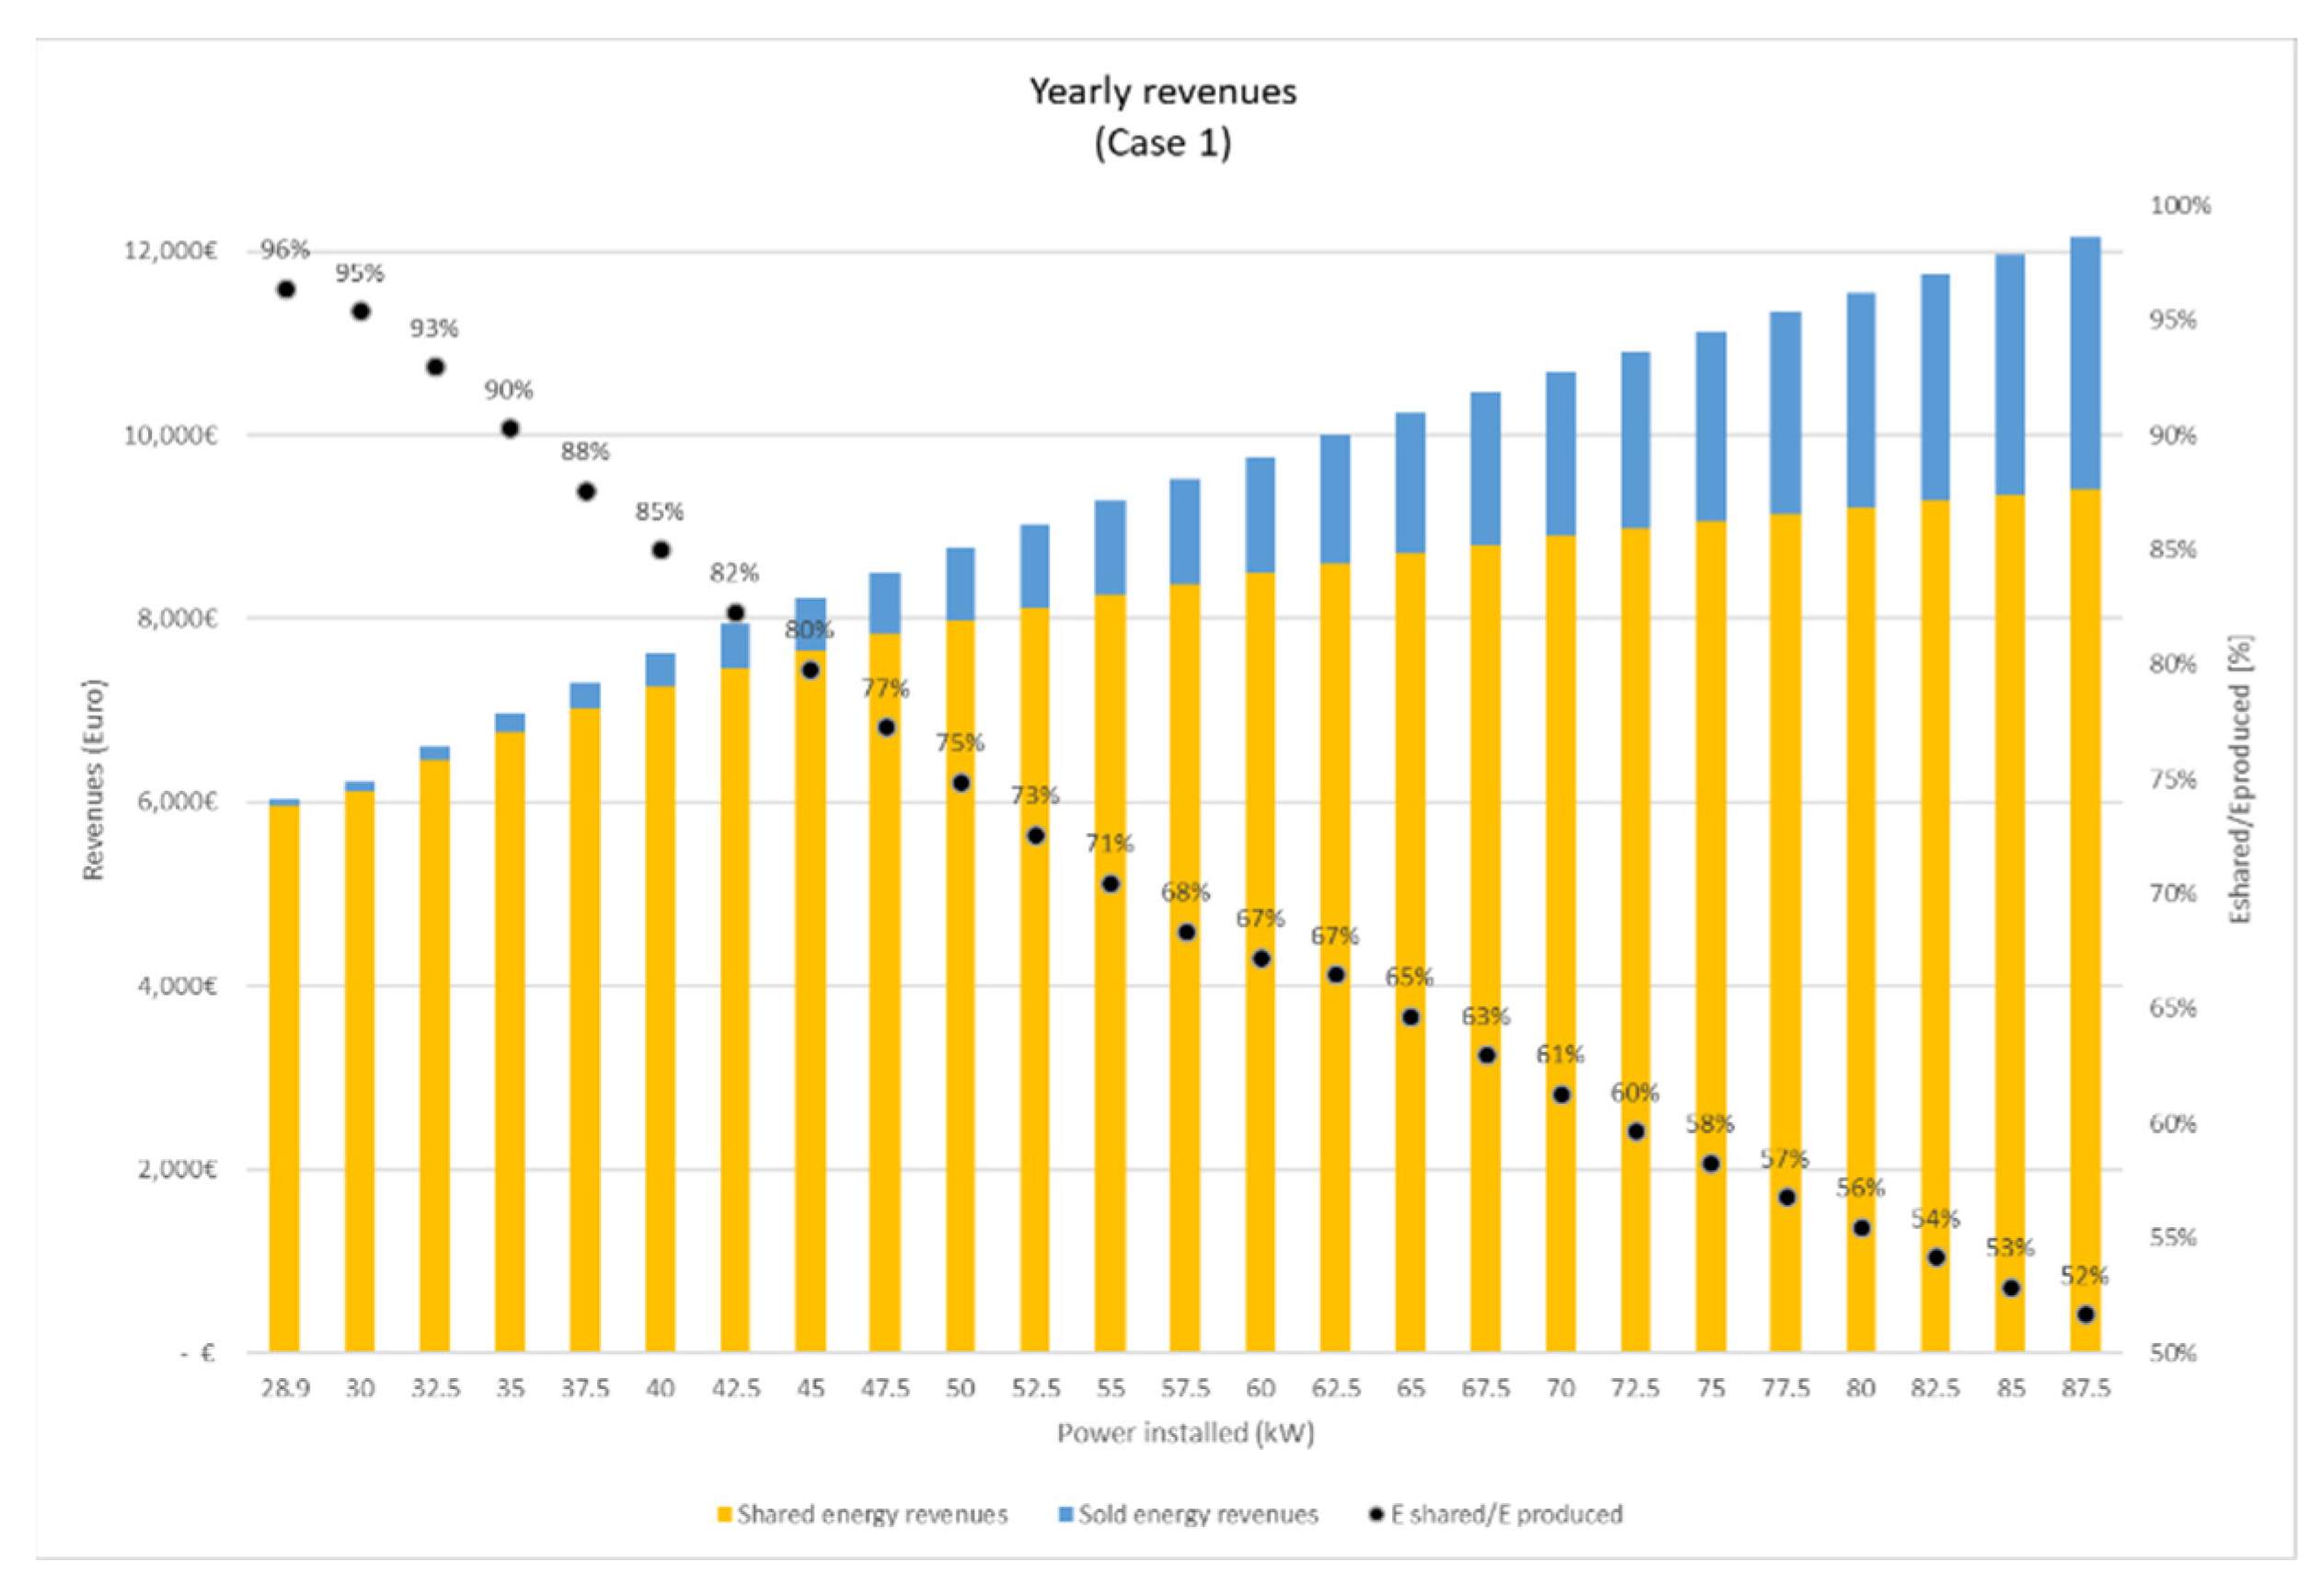
Figure 2 shows the yearly revenues as a function of the installed power obtained in absence of self-consumption for the Green Field scenario. The graph was obtained computing the optimal solution for a pre-defined amount of installed power. Each unit of energy produced is therefore shared or sold to the market. Shared or self-consumed energy is subject to the same economic incentive (i.e., SCSi = SESi = 0.1185 €/kWh), thus, allowing only the share of energy does not introduce a bias in the solution. The orange bars show the revenues obtained from shared energy, while the blue-coloured bars indicate the revenues from energy sold to the market. The black dots instead represent the percentage of shared energy over the total energy produced for each installed capacity. By installing 29 kW, the amount installed in the reference case, it can be seen that 96% of the energy produced is shared. The more the installed capacity increases, the smaller the quota of shared energy is.
Figure 3 depicts the economic performance, expressed in terms of the NPV, of the two cases analysed so far by varying the total installed power. The blue- and orange-coloured lines represent, respectively, the obtained NPV for Case 1 and Case 2 as a function of the total installed power. As expected, when the capacity installed is set to 29 kW, the NPV obtained in Case 2 corresponds to the reference case one. On the other hand, Case 1 provides a greater value for the same capacity installed. The reason for this is the freedom given to the algorithm to choose the least expensive generator among the available generators, thus excluding PV 1 and PV 3. The difference between the two curves is entirely determined by the absence of generators PV 1 and PV 3 in the community portfolio of Case 1. The maximum of the NPV for both cases is reached when almost 67% of the energy produced is shared among the members of the community. This condition is met earlier in the Brown Field scenario than in the Green Field scenario because the energy production profiles of PV 1 and PV 2, which are included only in Case 2, lead to a greater contribution to the overall electricity production by the community with respect to what, for instance, generators PV 4 and PV 7 could provide.
5.3. Citizen Engagement Model Results
The analysis was performed for a citizen who is investing in a 5 kW solar PV plant and must decide whether to join the REC of Magliano d’Alpi, thus exploiting the incentive on shared energy, or to apply for other remuneration schemes. The costs and production profile of the generator are assumed to be the same as the ones assigned to the list of available generators. The consumption profile of the citizen is assumed to be equal to the profile assigned to User 1. By performing an analysis with the Italian Net Metering (Scambio Sul Posto), a private user applying for such an incentive scheme would have their investment paid back after 13 years. Thus, adopting the SSP remuneration becomes a valid alternative for the citizen.
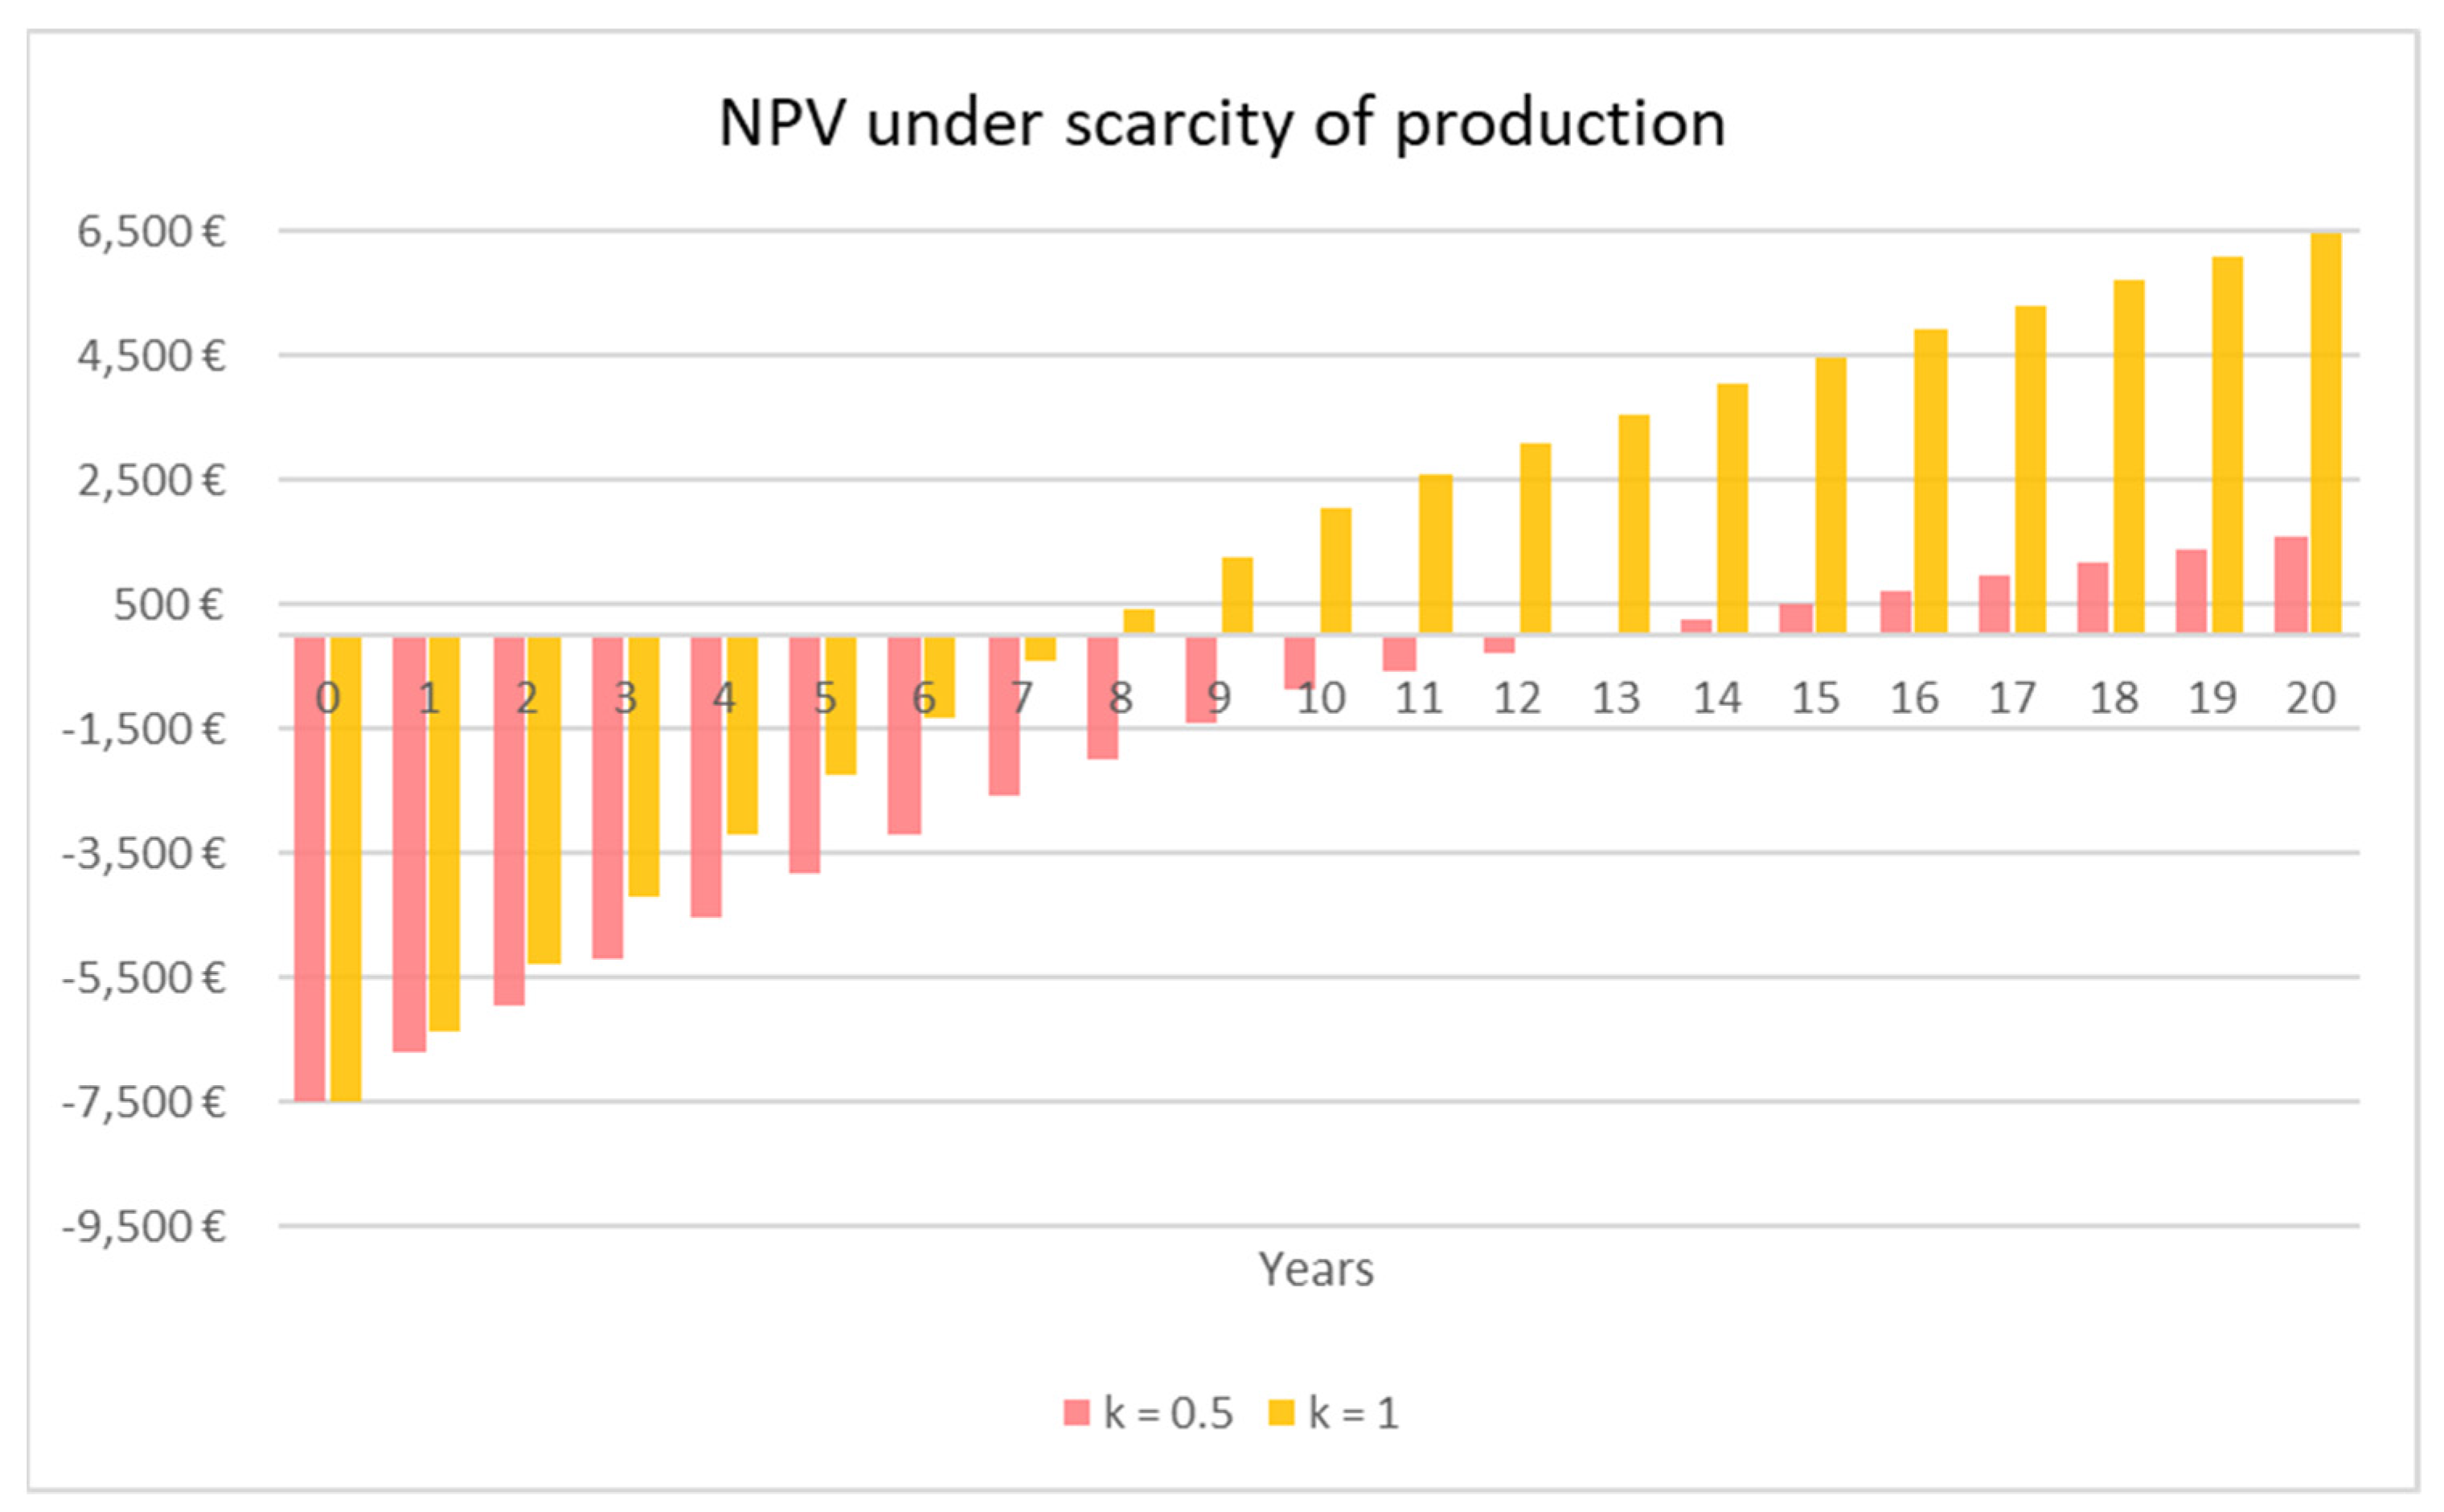
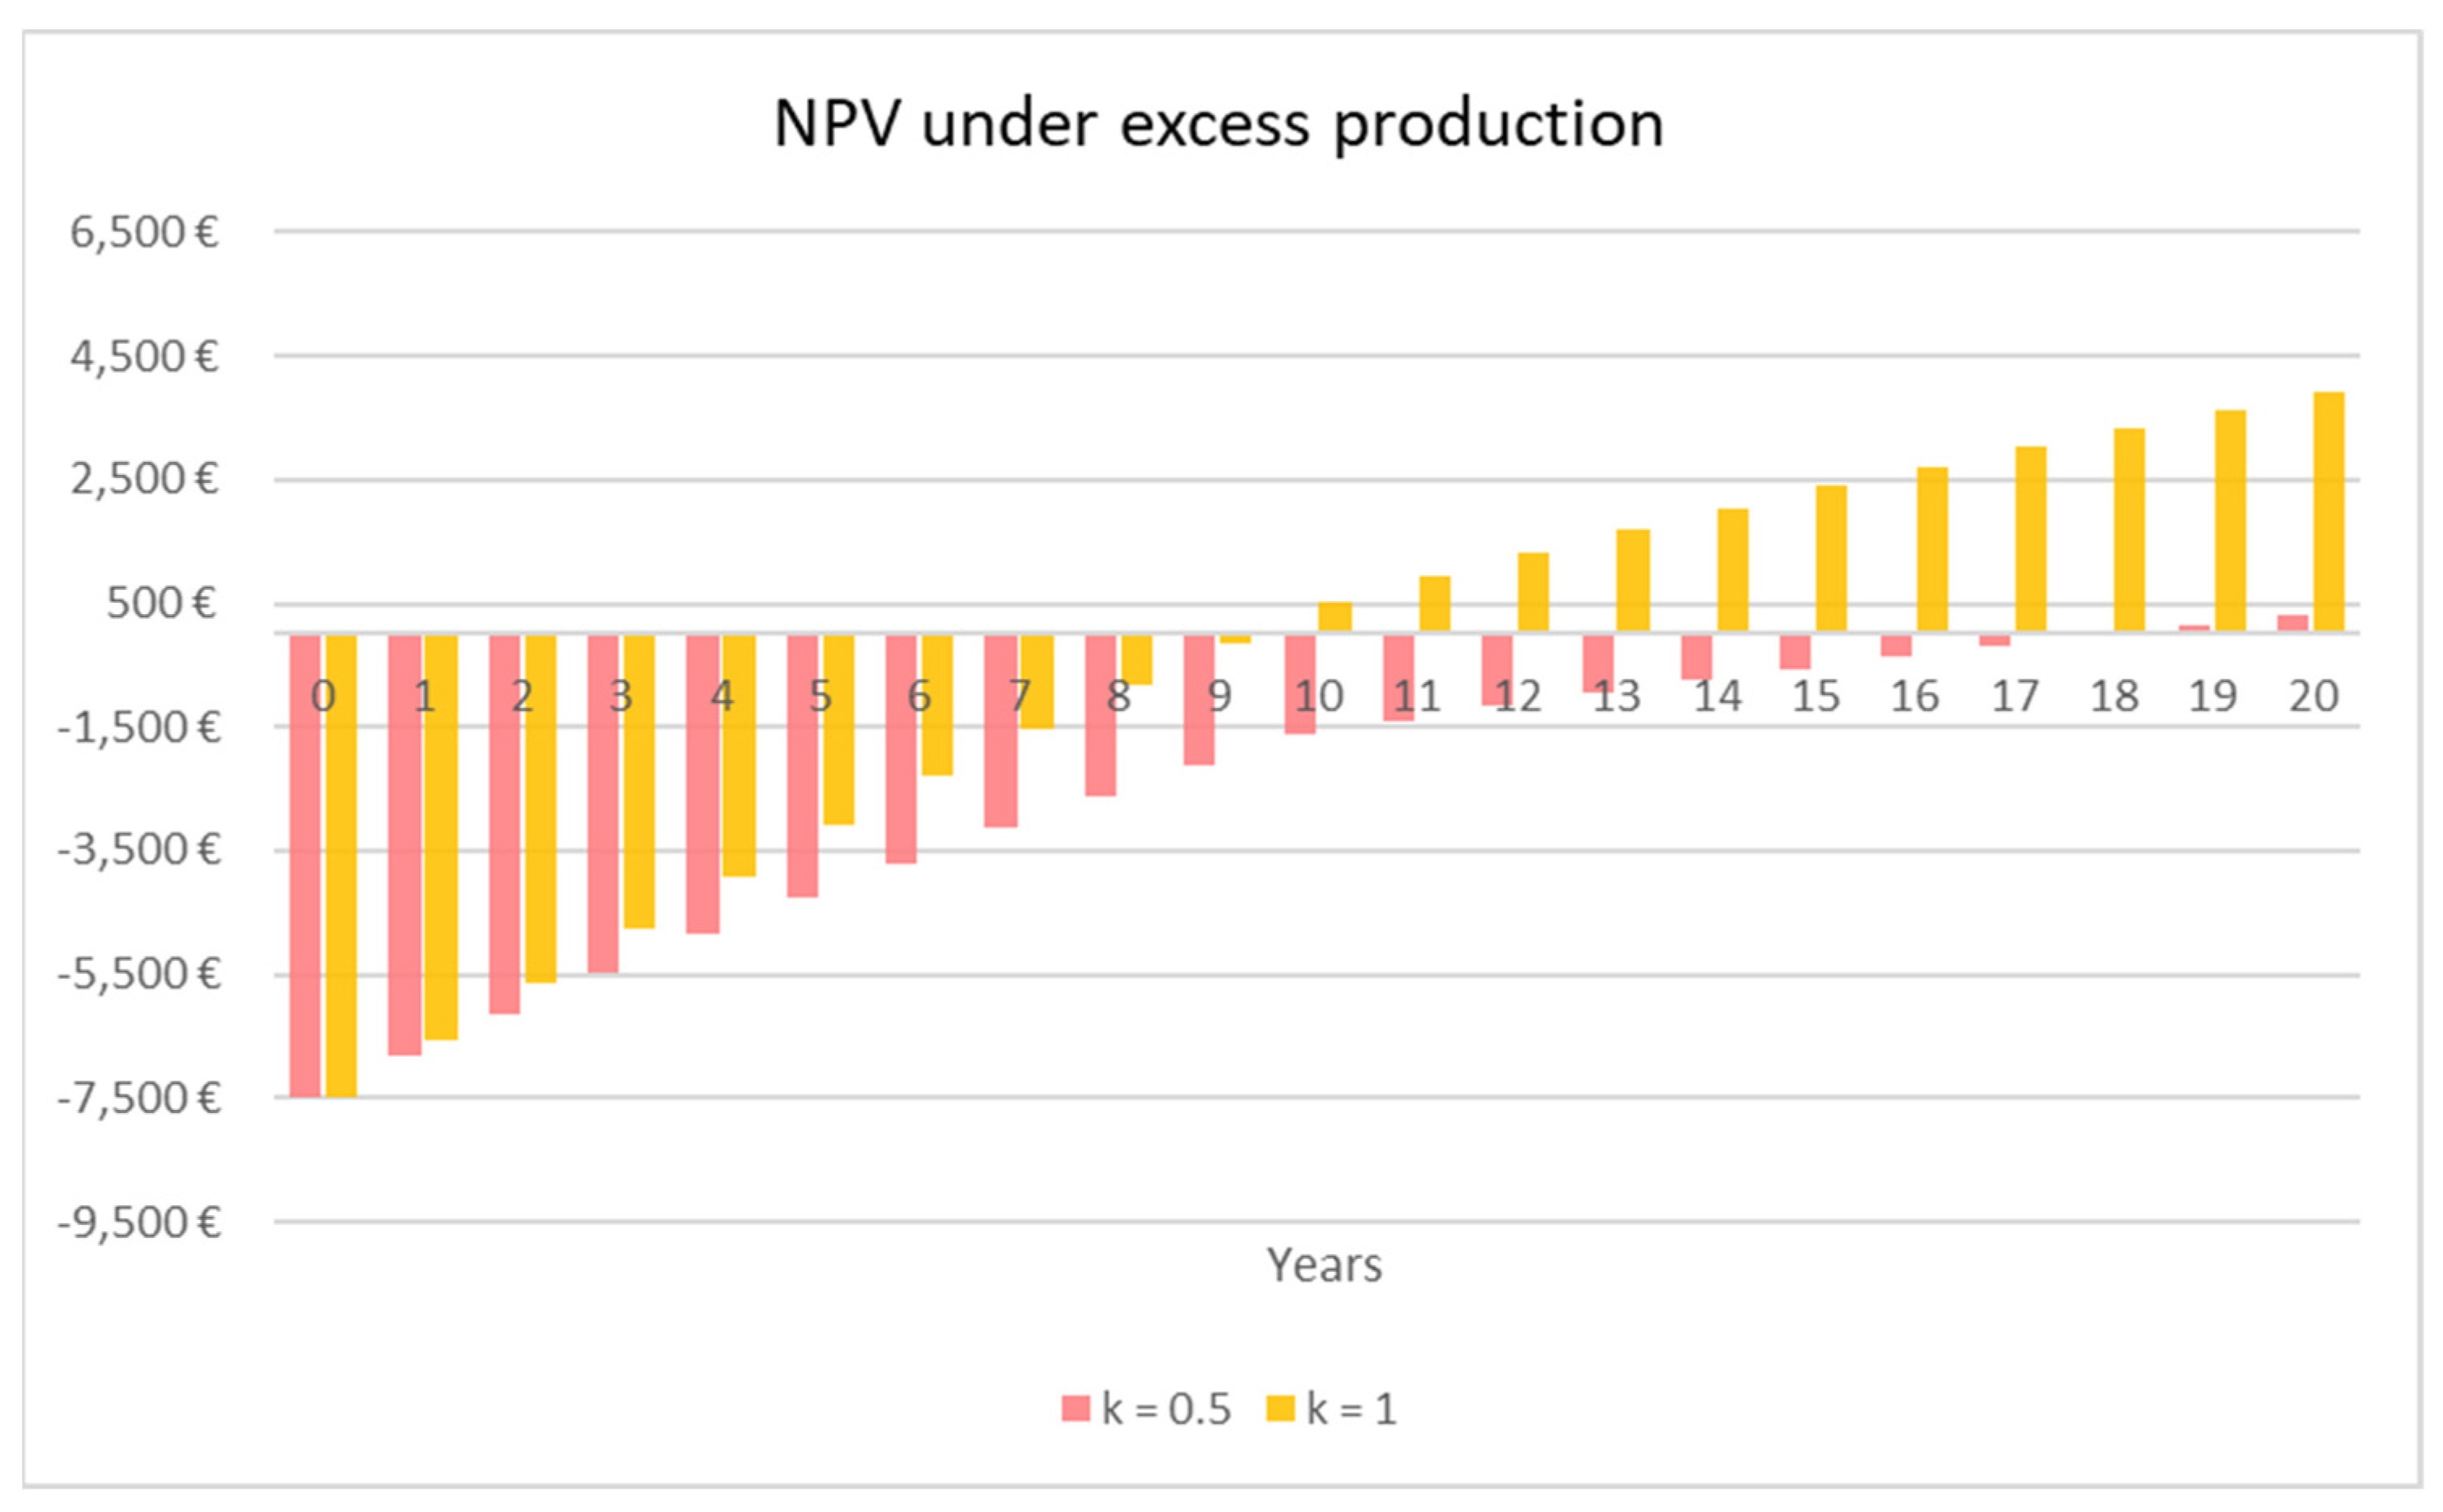
Figure 4 and
Figure 5 show the retrieved NPV of the applicant, where the pink- and yellow-coloured bars indicate the yearly NPV obtained for k = 1 and k = 0.5, respectively: these two values of k have been chosen to introduce an upper and lower limit in which the optimal value of k lies. The results shown in
Figure 4 were obtained under a scarcity of production by the energy community, while
Figure 5 depicts results retrieved under the excess of production condition.
The revenues obtained for k = 1 are used as a theoretical case, representing the situation in which the applicant keeps for themselves the totality of the revenues earned, including those coming from the energy shared and sold to the market. Clearly, the applicant would try to obtain a value of k as close as possible to one. On the contrary, the more k shrinks, the more the REC representative is willing to accept the applicant as a new member. It is worth noting that for k = 0.5, the applicant is always able to recover the cost of investment in both conditions, although under the excess of production condition, the applicant’s investment is paid back very close to the end-of-life of the power plant. Moreover, under excess of production and k = 0.5, the cumulative revenue of the REC from shared and injected energy decreases with respect to the case in which the applicant acts as a passive user. In other words, there is no optimal value of k which can economically satisfy both the REC and the private investor under of excess of production. Instead, for values of k > 0.5, private investors can be incentivised to join the energy community (the NPV obtained for k = 0.5 is similar to the one that an investor would obtain if participating in the SSP scheme). It is then up to the community to decide whether to prioritise the maximisation of profits by choosing a value of k close to 50% or to expand the community membership. In the latter case, the optimal value of k should at least allow the REC to maintain the same level of revenues that were obtained in absence of the new member.
5.4. Sensitivity Analysis Results
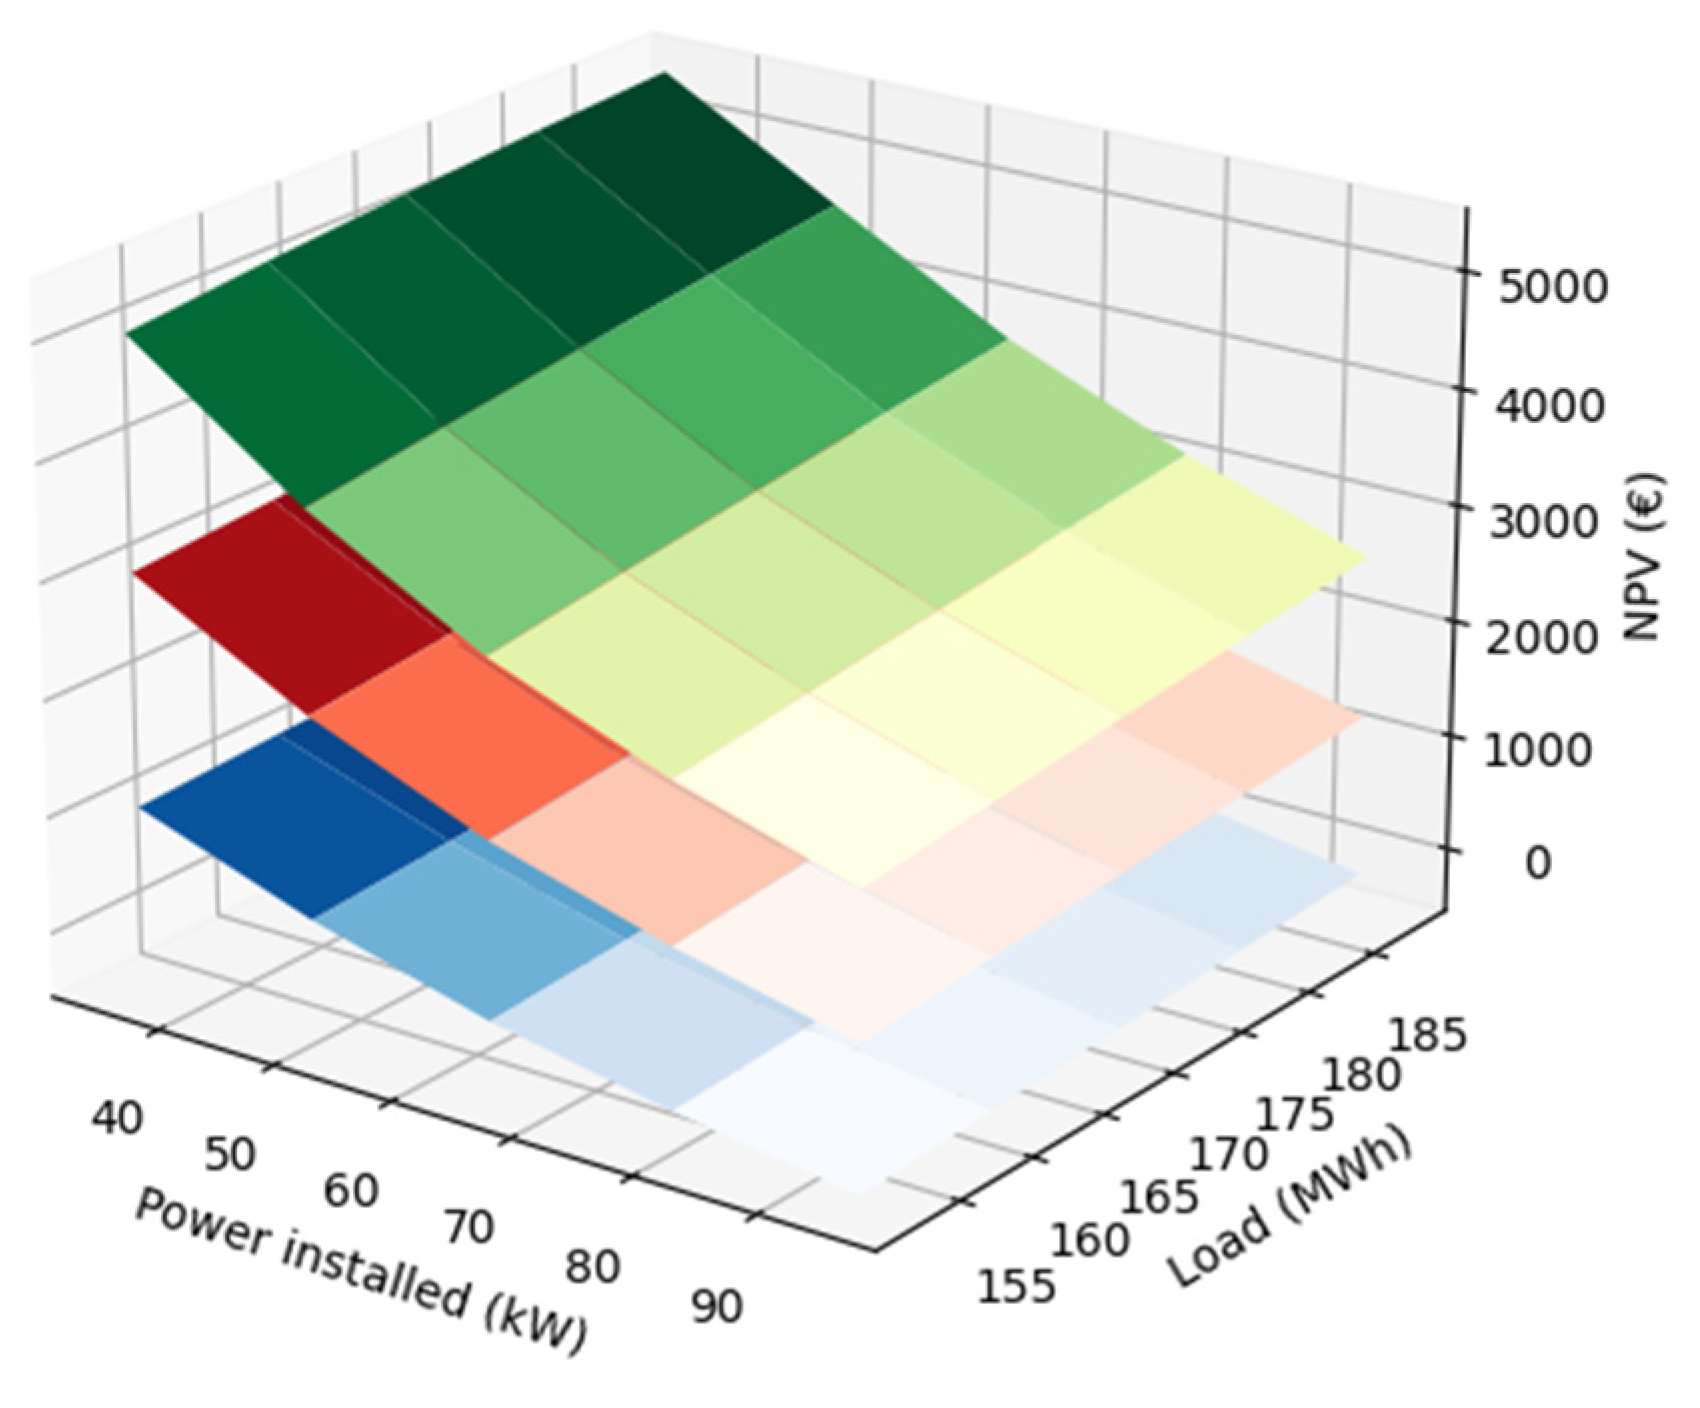
Figure 6 shows the dependency of the NPV on the total power installed in the community (x-axis) and the total number of members, translated in terms of yearly electrical load of the community (y-axis). Each surface was obtained by varying the value of k, that is, the blue, red and green surface were obtained for k = 0.4, k = 0.6 and k = 0.8, respectively. Each point on the plane represents the NPV obtained for a specific combination of load and power. Thus, it can be concluded that:
With the same amount of capacity installed and by only varying the yearly electricity consumption, i.e., changing the number of passive members, the profitability of the investment slightly fluctuates. For instance, by looking at the green surface, for P = 35 kW, the values of the NPV range between 5050 € and 5400 € (which is a 7% variation) despite the 23% change in load consumption;
With the same amount of yearly electricity consumption, the sensitivity to a change in power installed is higher for the NPV, demonstrated by the steeper slope of the green surface along the x-axis;
The value of k still plays a key role for the return of investment. Indeed, for P = 95 kW, the investment NPV is negative if the adopted value of k is equal to 0.4, independently of the consumption of the community.
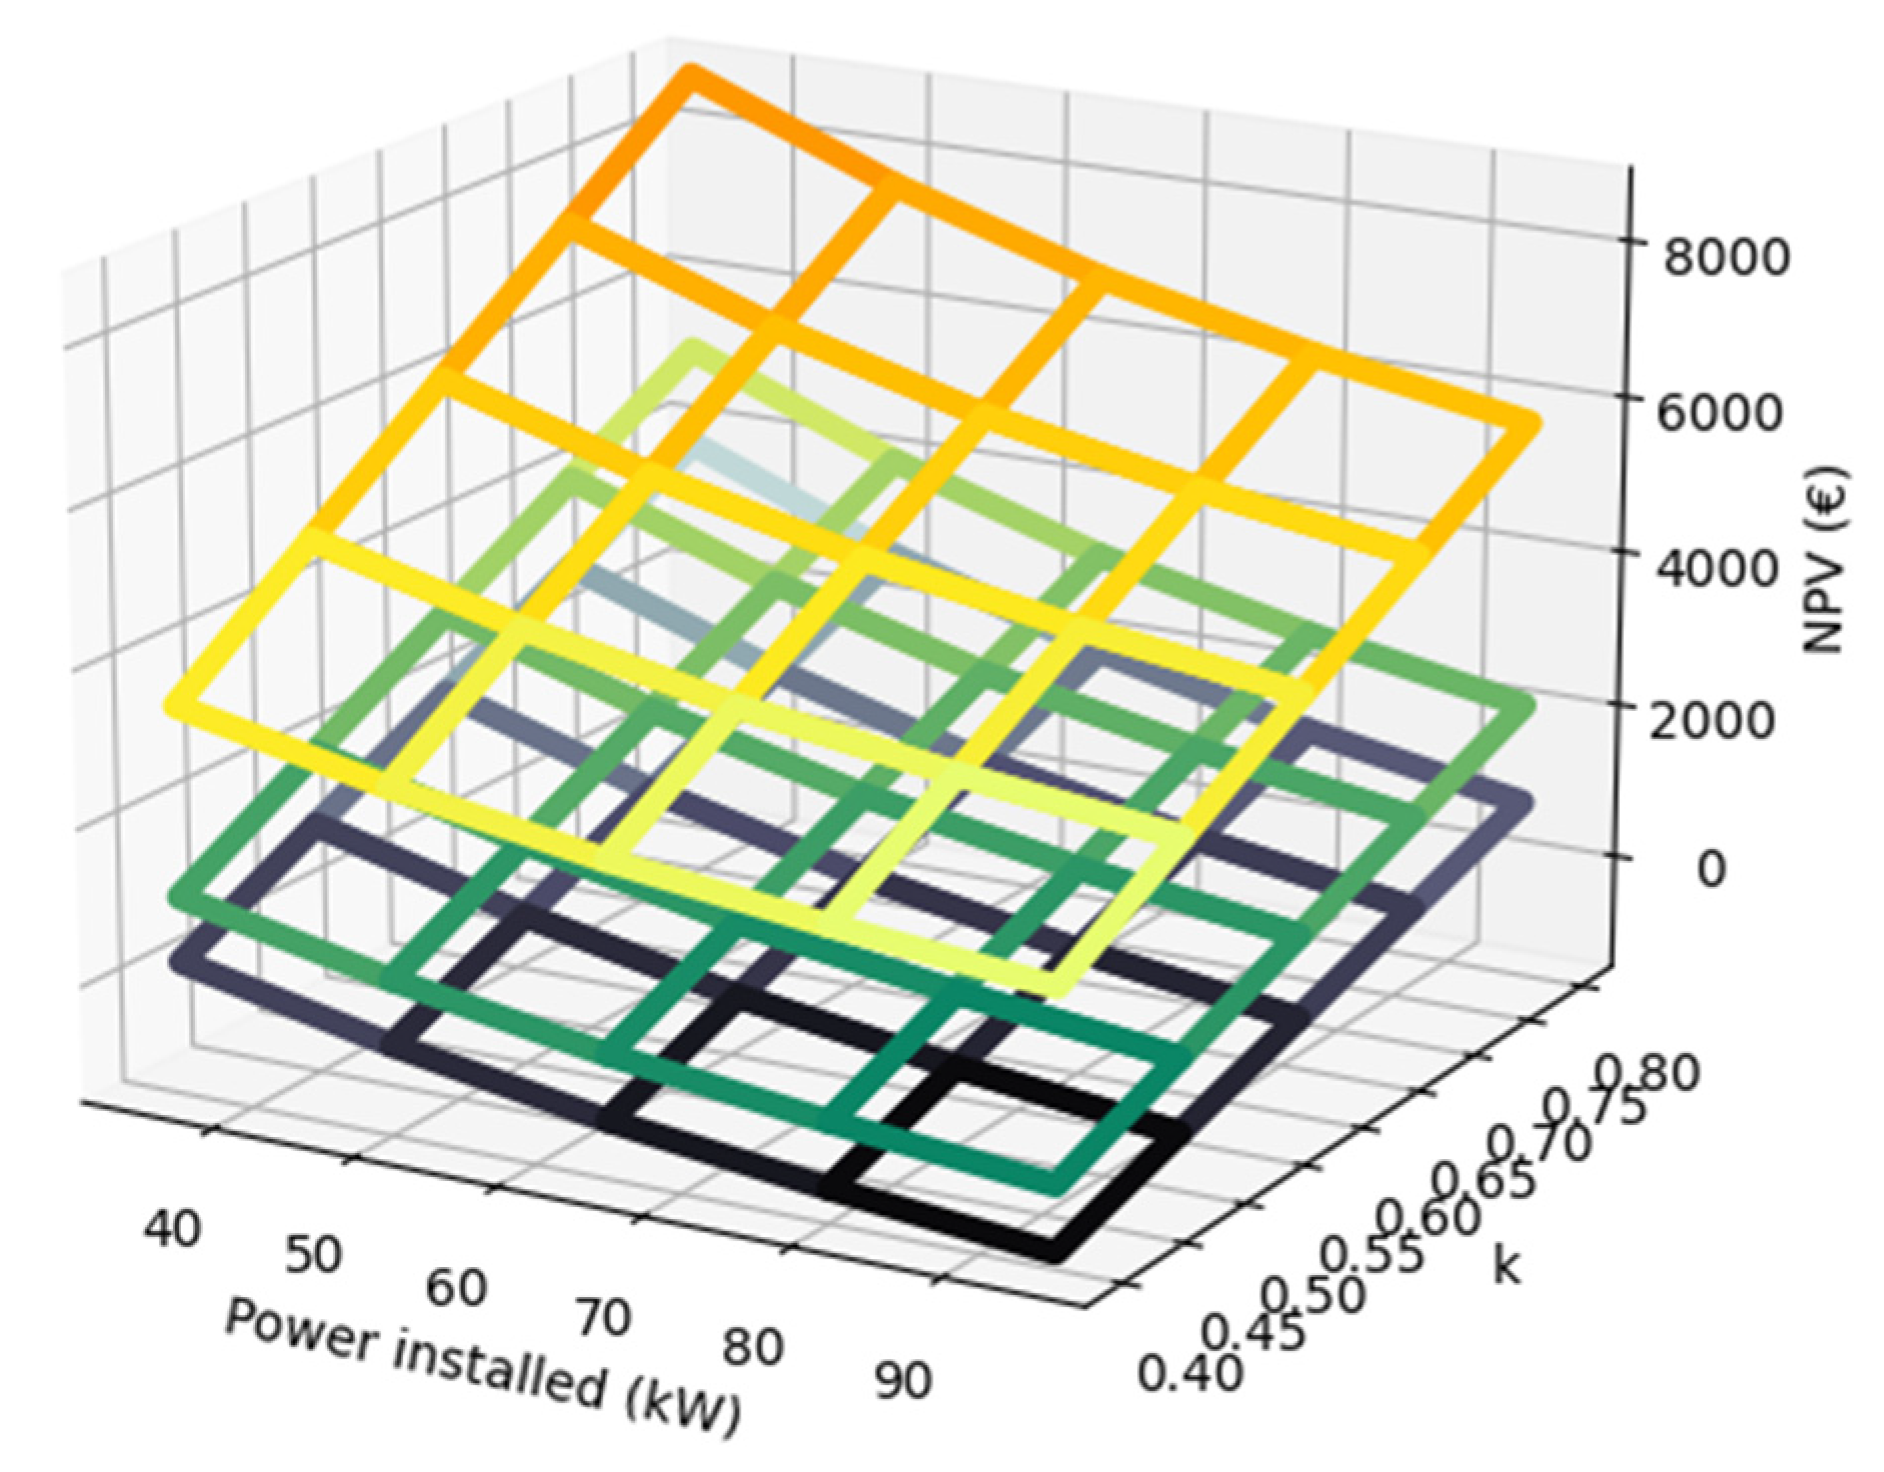
Furthermore,
Figure 7 displays the dependency of the NPV on the total power installed in the community (x-axis) and the value of k (y-axis). Furthermore, each plane was obtained for different wholesale market price reference years. The values obtained in the blue shaded surface were computed using the hourly market prices from 2020. In the same fashion, the green and orange shaded surfaces were obtained using the hourly prices from 2019 and 2021, respectively. Thus, this graph provides an insight of the impact of market prices on the profitability of investment for the applicant. It appears evident the dominant influence of wholesale prices in the investor profits, remarked by the spatial distance between the surfaces. Wholesale electricity prices in Italy saw a relevant decrease in 2020 due to the COVID-19 pandemic crisis, despite soaring back again in 2021 across the EU [
31]. Thus, price fluctuations cannot be exempted from the evaluation of the NPV, even though price trends forecasts are difficult to be assess correctly during the planning stage.
In conclusion, the determination of the optimal value of k strictly depends on the underlying conditions. The more the community produces electricity, the more unlikely it is to accept a new active member, unless the chosen value of k is small enough to guarantee appropriate revenues for the community. On the contrary, high wholesale market prices favour the introduction of new prosumers, even for low values of k. Hence, careful evaluation of the electricity prices trend is crucial for a correct economic agreement between the REC representative and the applicant. The citizen engagement model introduced here successfully managed to propose an approach capable of identifying the optimal range of values of k, for each community configuration, that guarantees economic profitability for both parts.
6. Conclusions
The first part of this work is dedicated to the analysis of the transposition process in the EU, highlighting which different approaches have been adopted by each country concerning the definition of RECs. It emerges that the drivers pushing MSs for the implementation of a specific REC definition with respect to another are not explicitly declared, although some insights can be found in their relative national laws. The most relevant matter of discrepancy, arising from the transposition analysis, regards the proximity requirement to the community renewable energy project. Some countries (e.g., France, Greece) interpret the proximity requirement in terms of geographical distance from the renewable energy project while others, such as Italy, evaluate the latter requirement in terms of electrical distance, i.e., connection to the LV grid under the same MV/LV transformer.
The second part of the research focused on two main aspects: (i) application of a MILP optimization algorithm to find the best generators to be installed in the case study and (ii) the development of a model able to assess the conditions that favour prosumers’ participation in REC. For what concerns the first aspect, it was verified that the new features added to the MILP model successfully allow to optimise the community portfolio by taking into account the pre-existing generators. Results obtained on the Italian case study evidence the possibility to further expand the current installed renewable capacity without undermining the profitability of investment. The algorithm proved to be efficient in the evaluation of the most fit members (from an economic feasibility point of view) to host additional capacity in the community, hence, to become prosumers. Concerning the second aspect of this study, the proposed citizen engagement model demonstrated that choosing the correct value of the redistribution factor k can indeed pave the way for a profitable relationship between the REC and the private investor. The study also revealed that joining an EC becomes less attractive for prosumers, seeking for return of investment on their RES installations, when the energy produced by the community is already sufficient to meet half the electricity demand in a year, regardless of the economic agreement. The results obtained with PV technology-dependent communities suggest that ECs membership becomes limited if no alternative means of sharing electricity during non-daylight hours are considered, such as energy storage systems. However, the sensitivity analysis highlighted that the outcome of the collaboration can be undermined or enhanced by several factors, such as price volatility and community structure changes (i.e., power installed and number of members).


