

Multi-Objective Optimization of Building Environmental Performance: An Integrated Parametric Design Method Based on Machine Learning Approaches


Abstract
:1. Introduction
1.1. Background
1.2. Problem Statement and Objectives
1.3. Literature Review
1.3.1. Design Process
1.3.2. Artificial Intelligence Processes
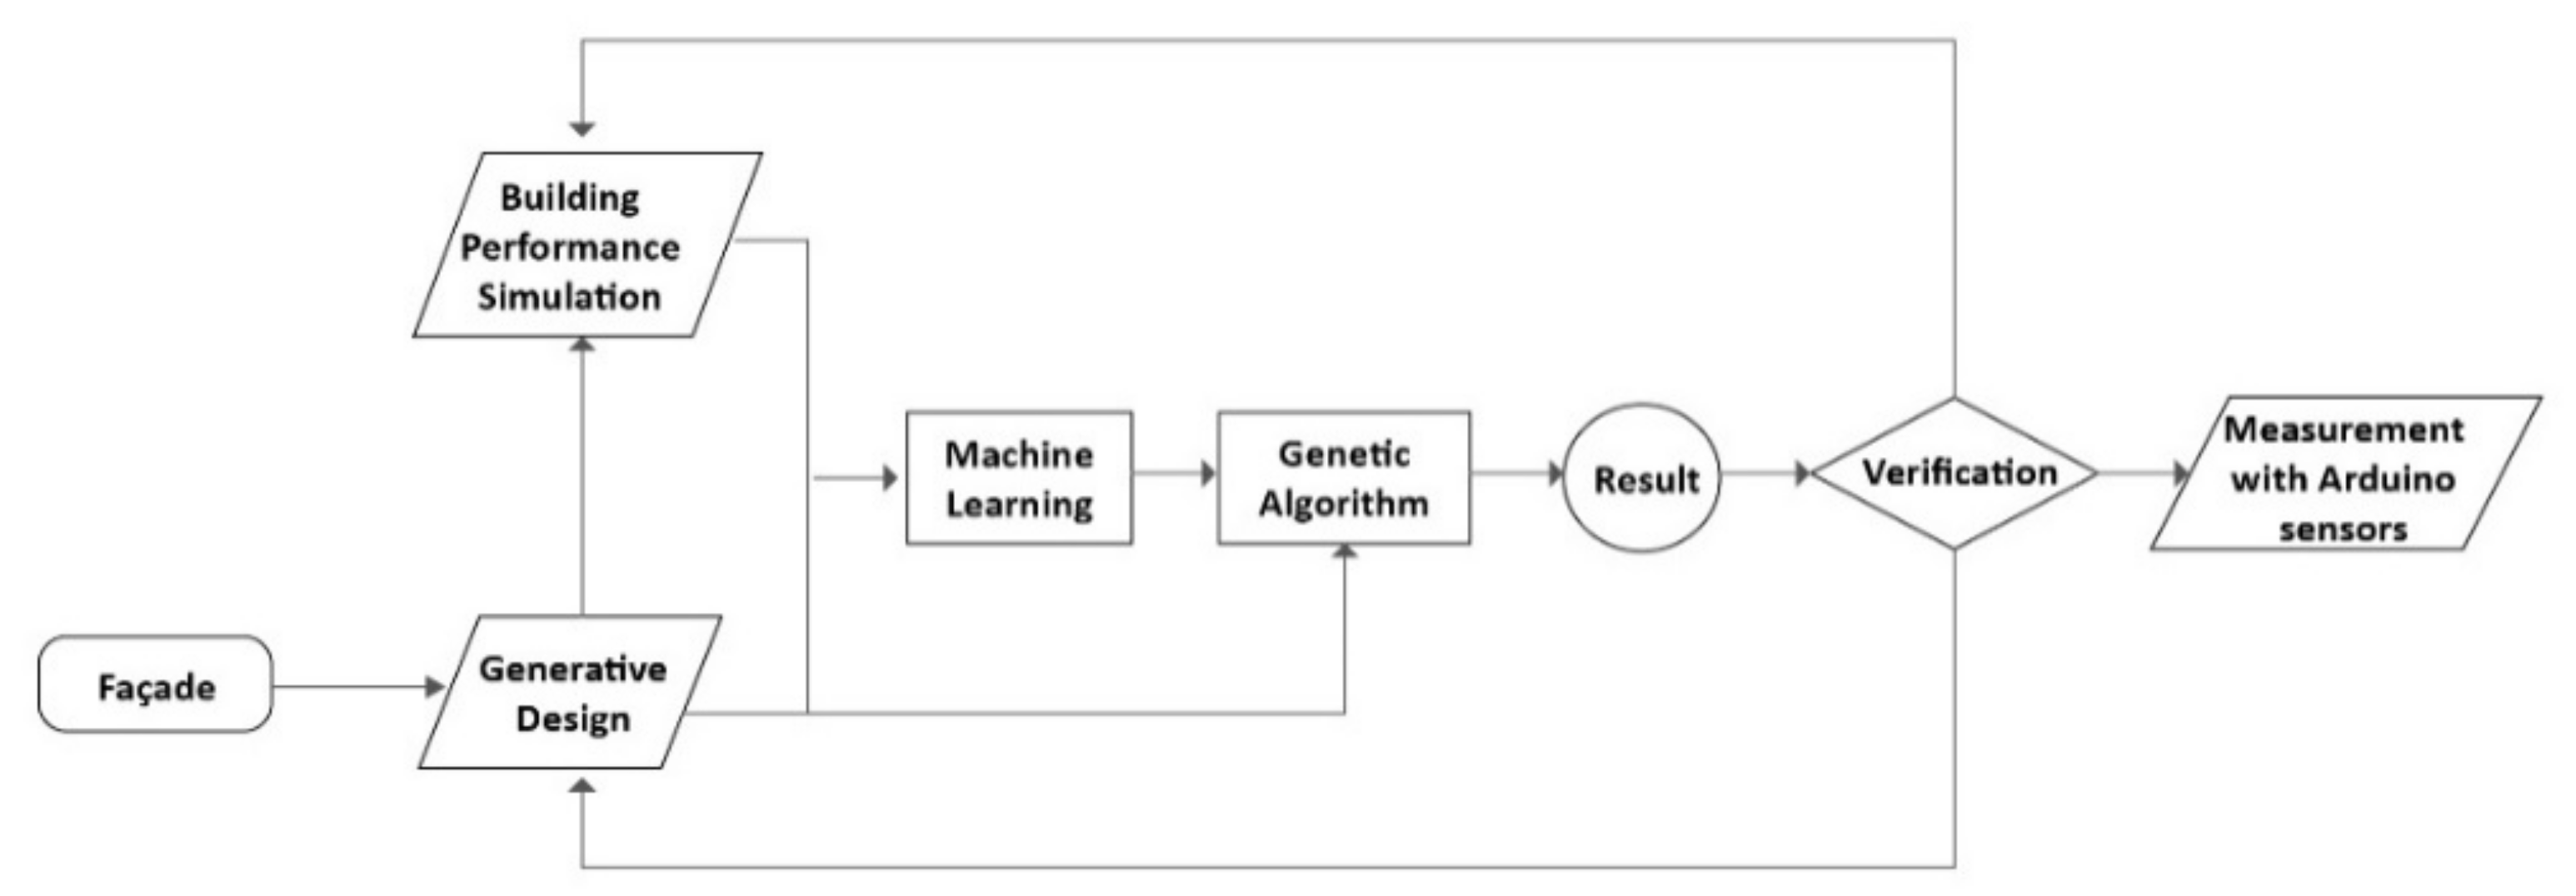
2. Methodology
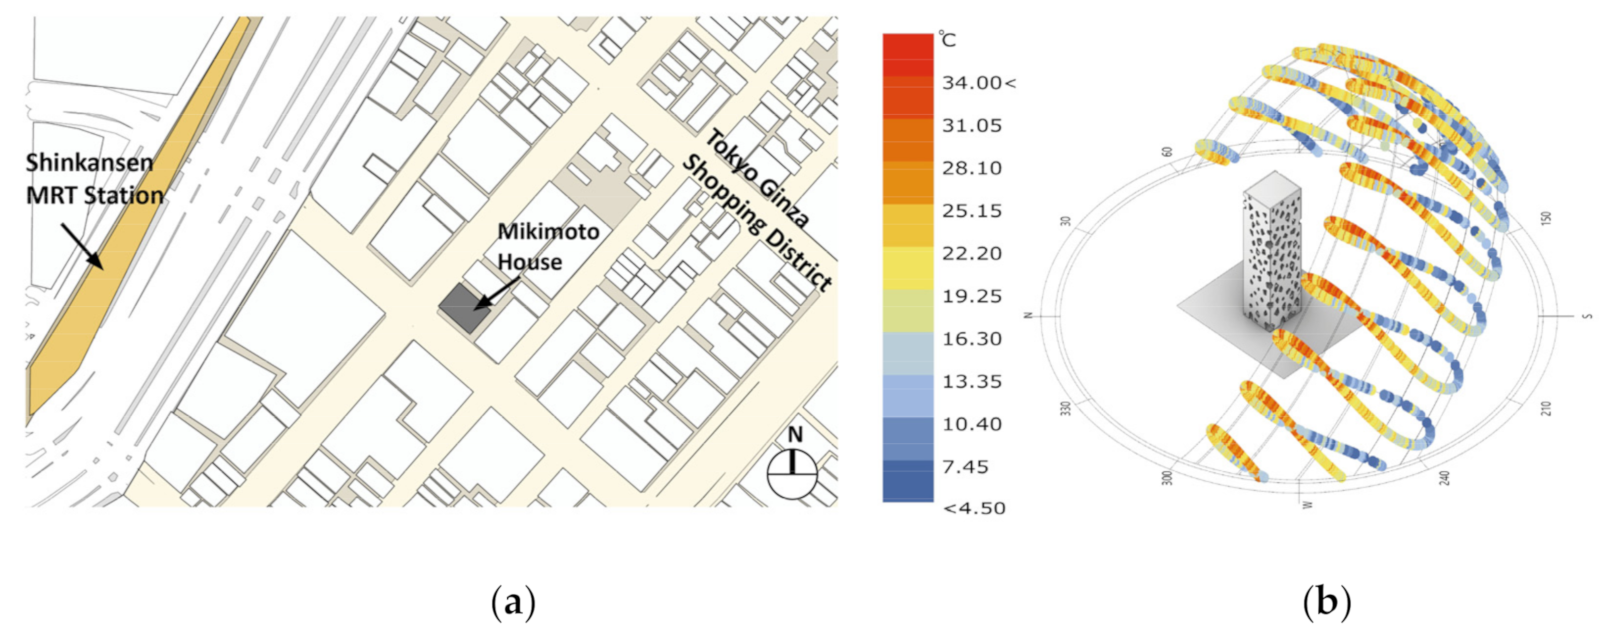
2.1. The Case Study
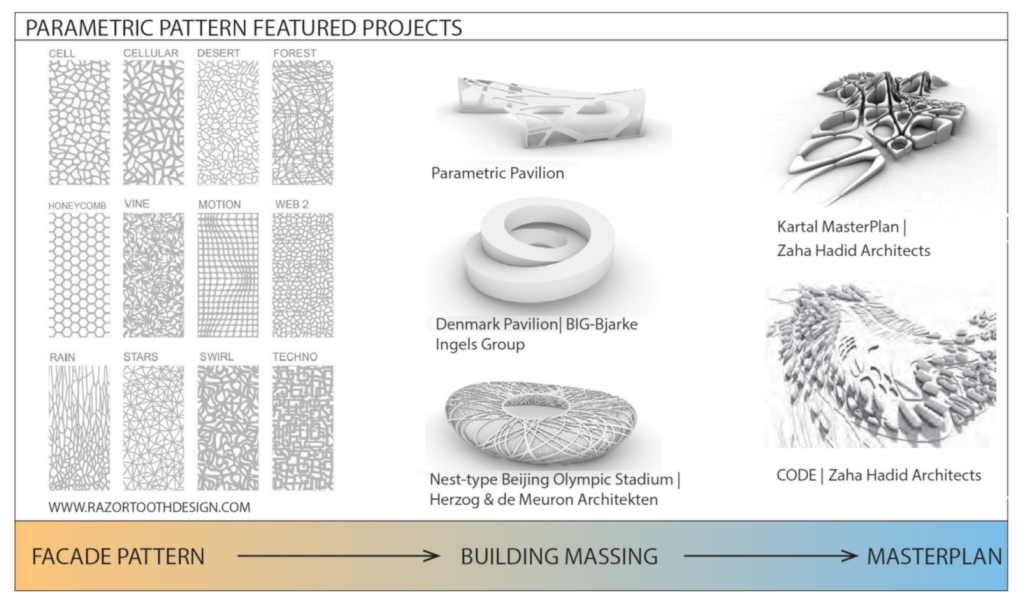
2.2. Parametric Modeling
2.3. Building Performance Simulation
2.3.1. Simulation Settings
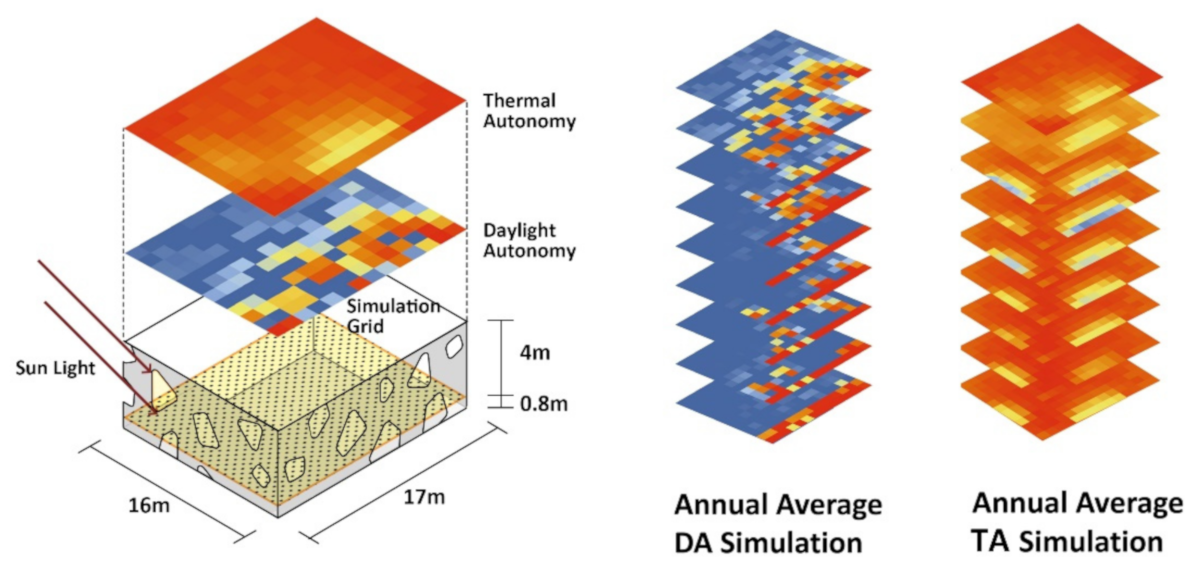
2.3.2. Daylight Simulation
2.3.3. Thermal Comfort Simulation
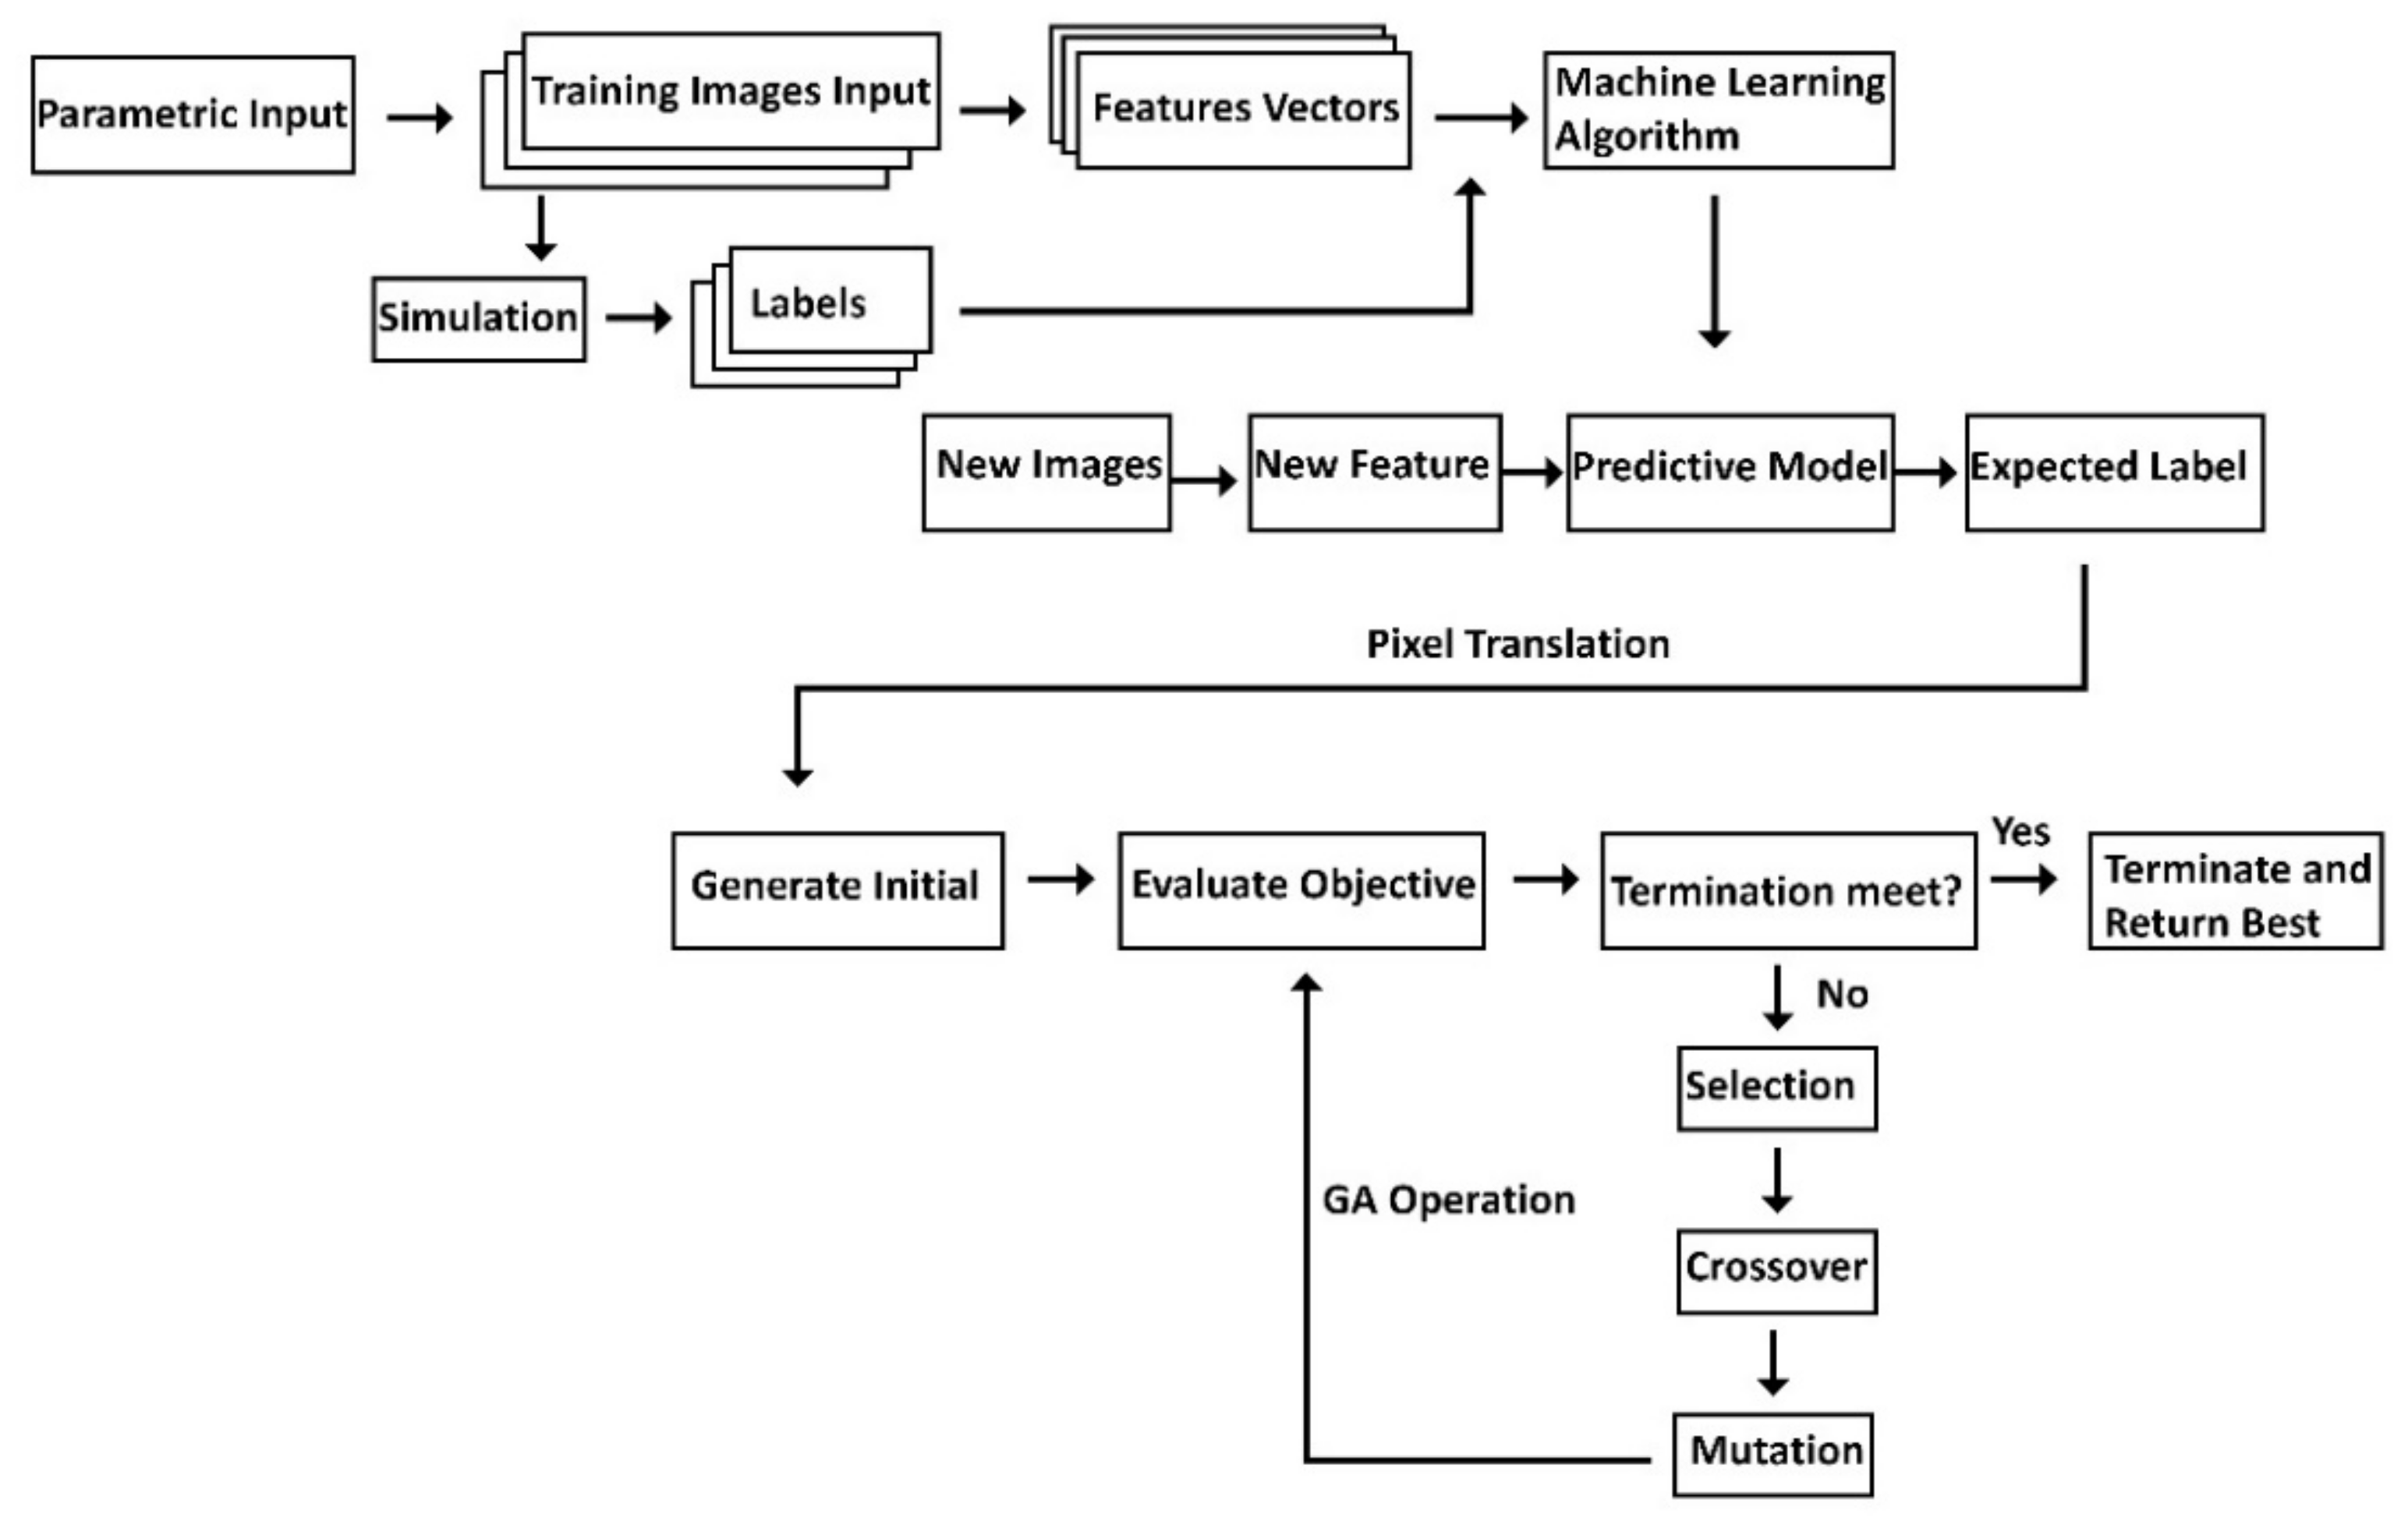
2.4. Machine Learning
2.4.1. The Training and Validation of the Machine Learning Model
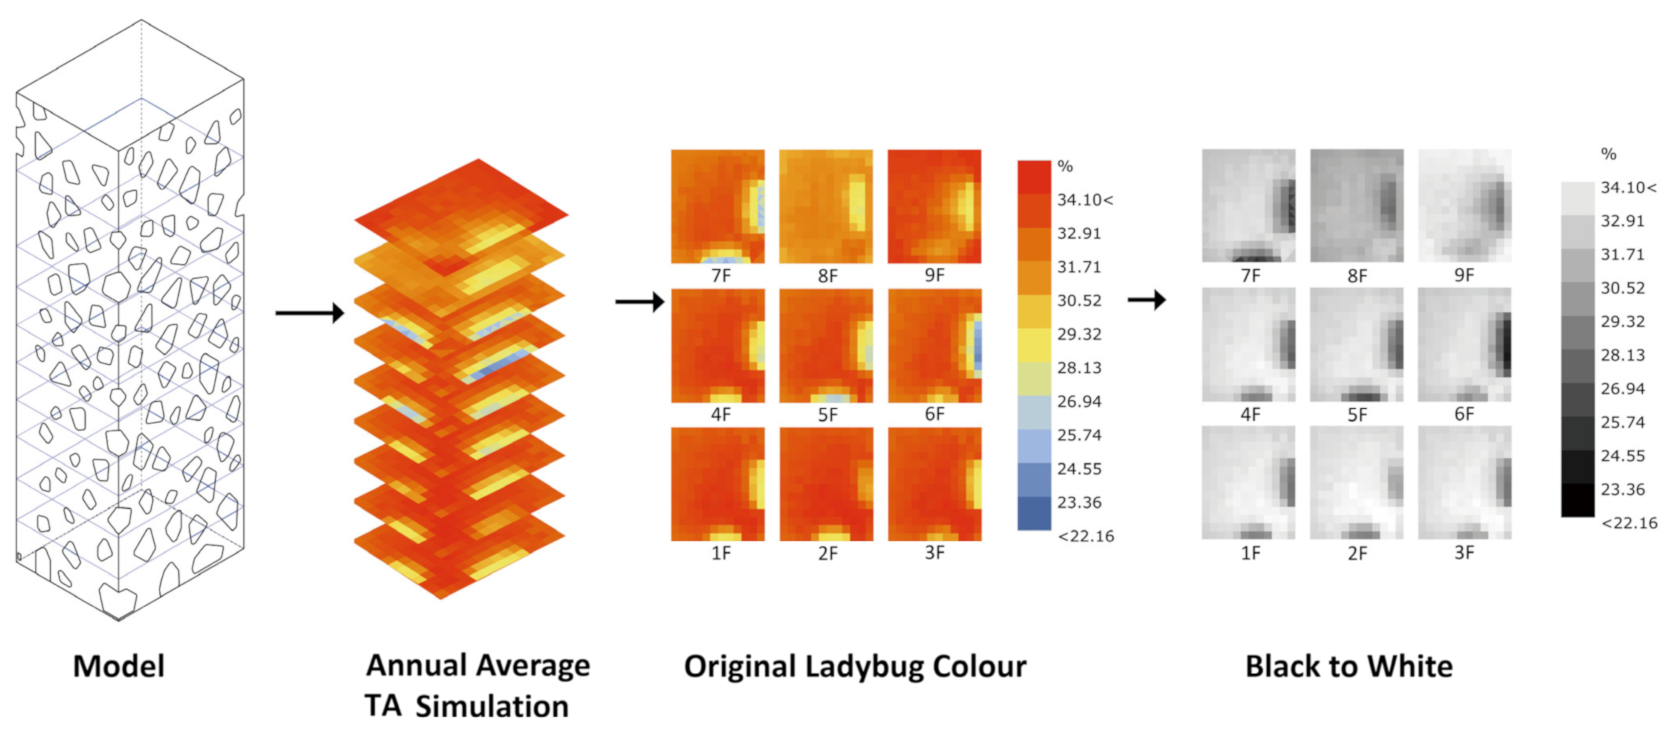
2.4.2. Mapping Grayscale Values
2.5. Optimization Using a Genetic Algorithm
2.6. Validation with Measurements
2.6.1. Physical Model
2.6.2. Sensors
3. Results
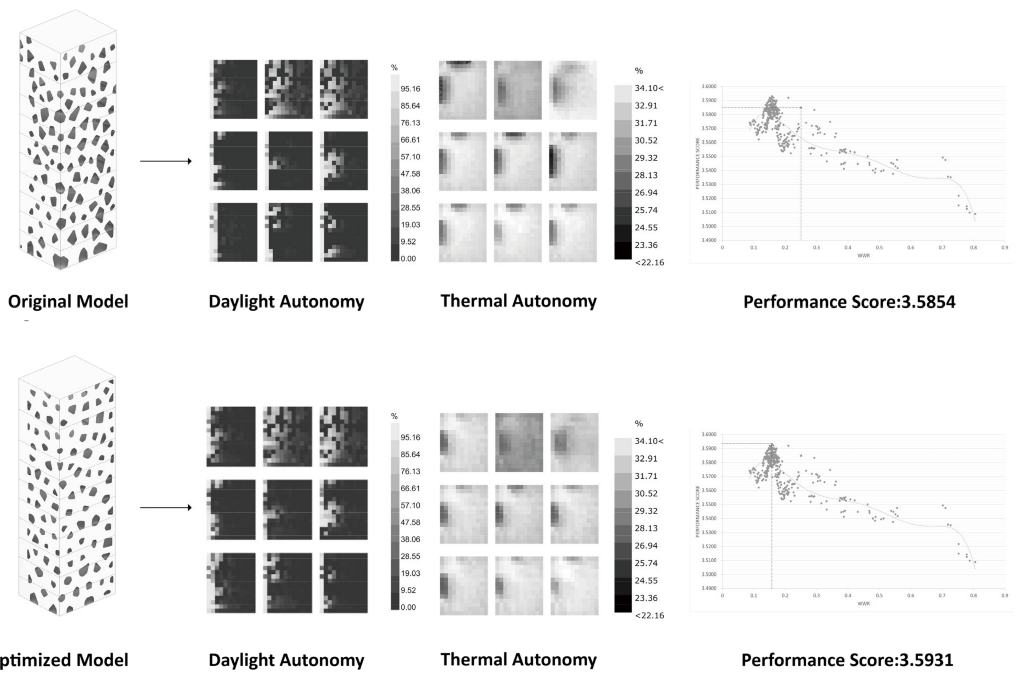
3.1. Optimization Result
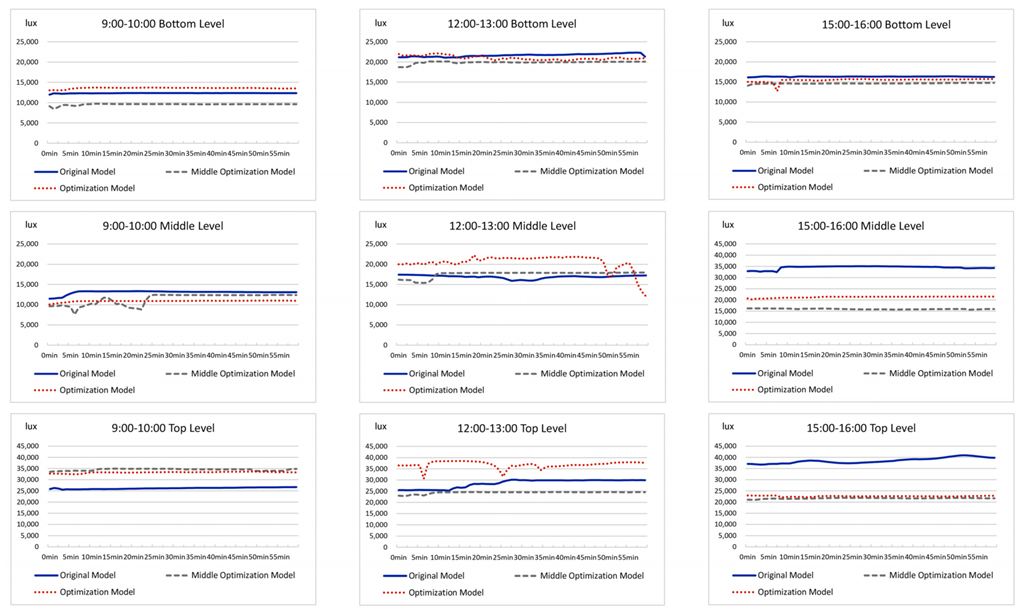
3.2. Physical Model Test Result
4. Conclusions and Discussion
Author Contributions
Funding
Data Availability Statement
Conflicts of Interest
References
- New Report: The Building and Construction Sector Can Reach Net Zero Carbon Emissions by 2050. Available online: https://www.worldgbc.org/news-media/WorldGBC-embodied-carbon-report-published (accessed on 14 September 2022).
- Yang, L.; Yan, H.; Lam, J.C. Thermal Comfort and Building Energy Consumption Implications—A Review. Appl. Energy 2014, 115, 164–173. [Google Scholar] [CrossRef]
- Aksamija, A. Methods for Integrating Parametric Design with Building Performance Analysis. In Proceedings of the EAAE/ARCC International Conference 2018, Philadelphia, PA, USA, 16–19 May 2018. [Google Scholar]
- Hien, W.N.; Poh, L.K.; Feriadi, H. The Use of Performance-Based Simulation Tools for Building Design and Evaluation—A Singapore Perspective. Build. Environ. 2000, 35, 709–736. [Google Scholar] [CrossRef]
- Fathy, F.; Fareed, H.A. Performance-driven Façade Design Using an Evolutionary Multi-Objective Optimization Approach. In Proceedings of the International Conference for Sustainable Design of the Built Environment-SDBE 2017, London, UK, 20–21 December 2017. [Google Scholar]
- Gagne, J.M.; Andersen, M. Multi-objective façade optimization for daylighting design using a genetic algorithm. In Proceedings of the SimBuild 2010-4th National Conference of IBPSA-USA 2010, New York, NY, USA, 11–13 August 2010. [Google Scholar]
- Mitchell, M.; Taylor, C.E. Evolutionary computation: An overview. Annu. Rev. Ecol. Syst. 1999, 30, 593–616. [Google Scholar] [CrossRef]
- Turrin, M.; von Buelow, P.; Stouffs, R. Design Explorations of Performance Driven Geometry in Architectural Design Using Parametric Modeling and Genetic Algorithms. Adv. Eng. Inform. 2011, 25, 656–675. [Google Scholar] [CrossRef]
- Gadelhak, M. Integrating Computational and Building Performance Simulation Techniques for Optimized Facade Designs. In Proceedings of the 31st International Conference on Education and Research in Computer Aided Architectural Design in Europe (eCAADe), Delft, The Netherlands, 18–20 September 2013; Volume 2. [Google Scholar]
- Yi, Y.K. Building Facade Multi-Objective Optimization for Daylight and Aesthetical Perception. Build. Environ. 2019, 156, 178–190. [Google Scholar] [CrossRef]
- Bakmohammadi, P.; Noorzai, E. Optimization of the Design of the Primary School Classrooms in Terms of Energy and Daylight Performance Considering Occupants’ Thermal and Visual Comfort. Energy Rep. 2020, 6, 1590–1607. [Google Scholar] [CrossRef]
- Toutou, A.; Fikry, M.; Mohamed, W. The Parametric Based Optimization Framework Daylighting and Energy Performance in Residential Buildings in Hot Arid Zone. Alex. Eng. J. 2018, 57, 3595–3608. [Google Scholar] [CrossRef]
- Abdel-Rahman, W.S. Thermal Performance Optimization of Parametric Building Envelope Based on Bio-Mimetic Inspiration. Ain Shams Eng. J. 2021, 12, 1133–1142. [Google Scholar] [CrossRef]
- Optimization Plug-In Categories & How to Download. Available online: http://wiki.bk.tudelft.nl/toi-pedia/Optimization_Plug-in_Categories_%26_How_to_download (accessed on 14 September 2022).
- Kim, H.; Clayton, M.J. A Multi-Objective Optimization Approach for Climate-Adaptive Building Envelope Design Using Parametric Behavior Maps. Build. Environ. 2020, 185, 107292. [Google Scholar] [CrossRef]
- Le-Thanh, L.; Le-Duc, T.; Ngo-Minh, H.; Nguyen, Q.-H.; Nguyen-Xuan, H. Optimal Design of an Origami-Inspired Kinetic Façade by Balancing Composite Motion Optimization for Improving Daylight Performance and Energy Efficiency. Energy 2021, 219, 119557. [Google Scholar] [CrossRef]
- Artificial Neural Network. Artificial Neural Network, Convolutional Neural Network, Recurrent neural Network, generative adversarial network, Artificial neural Network—Cloud community—Huawei Cloud. (n.d.). Available online: https://bbs.huaweicloud.com/blogs/259174 (accessed on 14 September 2022).
- Kim, J.S.; Song, J.Y.; Lee, J.K. Approach to the Extraction of Design Features of Interior Design Elements Using Image Recognition Technique. In Proceeding of CAADRIA 2018, Beijing, China, 17–19 May 2018. [Google Scholar]
- Chen, J.; Stouffs, R.; Biljecki, F. Hierarchical (Multi-Label) Architectural Image Recognition and Classification. In Proceedings of the CAADRIA 2021, Hong Kong, China, 29 March–1 April 2021. [Google Scholar]
- Huang, W.; Zheng, H. Architectural Drawings Recognition and Generation through Machine Learning. In Proceedings of the 38th Annual Conference of the Association for Computer Aided Design in Architecture (ACADIA) 2018, Mexico City, Mexico, 18–20 October 2018. [Google Scholar]
- Duering, S.; Chronic, A.; Koenig, R. Optimizing Urban Systems: Integrated optimization of spatial configurations. In Proceedings of the 11th Annual Symposium on Simulation for Architecture and Urban Design 2020, Vienna, Austria, 25–27 May 2020. [Google Scholar]
- Sebestyen, A.; Tyc, J. Machine Learning Methods in Energy Simulations for Architects and Designers—The Implementation of Supervised Machine Learning in the Context of the Computational Design Process. In Proceedings of the eCAADe 2020, Online, 16–17 September 2020. [Google Scholar]
- Mokhtar, S.; Sojka, A.; Davila, C.C. Conditional generative adversarial networks for pedestrian wind flow approximation. In Proceedings of the 11th Annual Symposium on Simulation for Architecture and Urban Design 2020, Vienna, Austria, 25–27 May 2020. [Google Scholar]
- Wahde, M. Biologically Inspired Optimization Methods: An Introduction; WIT Press: Southampton, UK, 2008. [Google Scholar]
- Hamdy, M.; Hasan, A.; Siren, K. A Multi-Stage Optimization Method for Cost-Optimal and Nearly-Zero-Energy Building Solutions in Line with the EPBD-Recast 2010. Energy Build. 2013, 56, 189–203. [Google Scholar] [CrossRef]
- Gou, S.; Nik, V.M.; Scartezzini, J.-L.; Zhao, Q.; Li, Z. Passive Design Optimization of Newly-Built Residential Buildings in Shanghai for Improving Indoor Thermal Comfort While Reducing Building Energy Demand. Energy Build. 2018, 169, 484–506. [Google Scholar] [CrossRef]
- Tuhus-Dubrow, D.; Krarti, M. Genetic-Algorithm Based Approach to Optimize Building Envelope Design for Residential Buildings. Build. Environ. 2010, 45, 1574–1581. [Google Scholar] [CrossRef]
- Ascione, F.; Bianco, N.; Mauro, G.M.; Vanoli, G.P. A New Comprehensive Framework for the Multi-Objective Optimization of Building Energy Design: Harlequin. Appl. Energy 2019, 241, 331–361. [Google Scholar] [CrossRef]
- Jalali, Z.; Noorzai, E.; Heidari, S. Design and Optimization of Form and Facade of an Office Building Using the Genetic Algorithm. Sci. Technol. Built Environ. 2019, 26, 128–140. [Google Scholar] [CrossRef]
- Zou, C. The Optimization of Static Shading Devices for Educational Building Façade in Paris. Available online: https://www.researchgate.net/profile/Congzheng-Zou/project/The-Exploration-of-Parametric-Design-for-Static-Shading-Devices-on-Office-Building-Energy-Performance/attachment/5d068be3cfe4a7968dab51e3/AS:770487693111297@1560709989550/download/The+Optimization+of+Static+Shading+Devices+for+Educational+Building+Facade+in+Paris+-+Edition+1.pdf (accessed on 14 September 2022).
- Ilbeigi, M.; Ghomeishi, M.; Dehghanbanadaki, A. Prediction and Optimization of Energy Consumption in an Office Building Using Artificial Neural Network and a Genetic Algorithm. Sustain. Cities Soc. 2020, 61, 102325. [Google Scholar] [CrossRef]
- Isola, P.; Zhu, J.Y.; Zhou, T.; Efros, A.A. Image-to-image translation with conditional adversarial networks. In Proceedings of the IEEE Conference on Computer Vision and Pattern Recognition 2017, Honolulu, HI, USA, 21–26 July 2017. [Google Scholar]
- Supervised Learning. Available online: https://en.wikipedia.org/wiki/Supervised_learning (accessed on 14 September 2022).
- Chakraborty, D.; Elzarka, H. Advanced Machine Learning Techniques for Building Performance Simulation: A Comparative Analysis. J. Build. Perform. Simul. 2018, 12, 193–207. [Google Scholar] [CrossRef]
- Ito, T. Change the Geometry to Change the Architecture. In Proceedings of the CAADRIA 2006, Kumamoto, Japan, 30 March–2 April 2006. [Google Scholar]
- Japan Climate: Average Weather, Temperature, Precipitation, When to Go. Available online: https://www.climatestotravel.com/climate/japan (accessed on 14 September 2022).
- Ko, W.H.; Schiavon, S.; Brager, G.; Levitt, B. Ventilation, Thermal and Luminous Autonomy Metrics for an Integrated Design Process. Build. Environ. 2018, 145, 153–165. [Google Scholar] [CrossRef]
- Levitt, B.; Ubbelohde, M.; Loisos, G.; Brown, N. Thermal autonomy as metric and design process. In Proceedings of the CaGBC National Conference and Expo: Pushing the Boundary-Net Positive Buildings 2013, Vancouver, BC, Canada, 4–6 June 2013. [Google Scholar]
- Ruiz, A.; Campano, M.Á.; Acosta, I.; Luque, Ó. Partial Daylight Autonomy (DAP): A New Lighting Dynamic Metric to Optimize the Design of Windows for Seasonal Use Spaces. Appl. Sci. 2021, 11, 8228. [Google Scholar] [CrossRef]
- OpenStudio. Available online: https://en.wikipedia.org/wiki/OpenStudio (accessed on 14 September 2022).
- Lagios, K.; Niemasz, J.; Reinhart, C.F. Animated building performance simulation (ABPS)–linking Rhinoceros/Grasshopper with Radiance/Daysim. In Proceedings of the SimBuild 2010-4th National Conference of IBPSA-USA 2010, New York, NY, USA, 11–13 August 2010. [Google Scholar]
- Hiyama, K.; Wen, L. Rapid Response Surface Creation Method to Optimize Window Geometry Using Dynamic Daylighting Simulation and Energy Simulation. Energy Build. 2015, 107, 417–423. [Google Scholar] [CrossRef]
- Kharvari, F. An Empirical Validation of Daylighting Tools: Assessing Radiance Parameters and Simulation Settings in Ladybug and Honeybee against Field Measurements. Sol. Energy 2020, 207, 1021–1036. [Google Scholar] [CrossRef]
- Daylight Autonomy. Available online: https://www.patternguide.advancedbuildings.net/using-this-guide/analysis-methods/daylight-autonomy.html (accessed on 14 September 2022).
- Luminae, D. Daylight Autonomy Extension. Available online: https://deluminaelab.com/dl-light-manual/en/daylightautonomy.html (accessed on 14 September 2022).
- Thermal Autonomy Analysis—Honeybee—Component for Grasshopper. Available online: https://grasshopperdocs.com/components/honeybee/thermalAutonomyAnalysis.html (accessed on 14 September 2022).
- Hee Ko, W.; Schiavon, S. Balancing Thermal and Luminous Autonomy in the Assessment of Building Performance. In Proceedings of the Building Simulation Conference 2017, San Francisco, CA, USA, 7–9 August 2017. [Google Scholar]
- Mean Absolute Error. Available online: https://en.wikipedia.org/wiki/Mean_absolute_error (accessed on 14 September 2022).
- Rutten, D. Galapagos: On the Logic and Limitations of Generic Solvers. Archit. Des. 2013, 83, 132–135. [Google Scholar] [CrossRef]
- Galapagos Optimization. Available online: http://wiki.bk.tudelft.nl/toi-pedia/Galapagos_Optimization (accessed on 14 September 2022).
- Climate. Available online: https://simple.wikipedia.org/wiki/Climate (accessed on 14 September 2022).
- Monsoon Climate of Medium Latitudes_Baidubaike. Baidubaike. (n.d.). Available online: https://baike.baidu.com/item/%E6%B8%A9%E5%B8%A6%E5%AD%A3%E9%A3%8E%E6%B0%94%E5%80%99/1130873 (accessed on 14 September 2022).
- Last Minute Engineers. Interfacing DS18B20 1-Wire Digital Temperature Sensor with Arduino. Available online: https://lastminuteengineers.com/ds18b20-arduino-tutorial/ (accessed on 14 September 2022).
- Akrour, L.; Santos, S.; Mann, R.; V., A. Arduino with BH1750 Ambient Light Sensor. Available online: https://randomnerdtutorials.com/arduino-bh1750-ambient-light-sensor/ (accessed on 14 September 2022).
- Bamodu, O.; Xia, L.; Tang, L. An Indoor Environment Monitoring System Using Low-Cost Sensor Network. Energy Procedia 2017, 141, 660–666. [Google Scholar] [CrossRef]


| Location | Tokyo, Japan (Latitude 35.68° N, longitude 139.65° E) |
| Weather Data | Tokyo annual weather data EPW file from energy plus |
| Analysis Grid | 272 measuring points with the grid’s resolution of 1 m × 1 m at the height of 0.8 m above the floor (nine floors in total) |
| Simulation Indicator | Daylight Autonomy, Thermal Autonomy |
| Wall | A mixed system of metal plates and concrete (Reflectance: 60%; U value: 0.46; R value:2.18) |
| Glass Visible Light Transmittance (VLT) | 90 % |
| Ground Floor | Concrete system (Reflectance: 20%; U value: 0.56; R value:1.80) |
| Floor/Ceiling | Concrete system (Reflectance: 20%; U value: 1.45; R value:0.69) |
| Roof | Concrete system (Reflectance: 20%; U value: 1.45; R value:0.69) |
| Ladybug and Honeybee Simulation Results | GAN Machine Learning Results | Accuracy | Ladybug and Honeybee Simulation Results | GAN Machine Learning Results | Accuracy |
|---|---|---|---|---|---|
 Daylight Autonomy Test 1 |  Daylight Autonomy Test 1 | 99.11% |  Thermal Autonomy Test 1 |  Thermal Autonomy Test 1 | 99.27% |
 Daylight Autonomy Test 2 |  Daylight Autonomy Test 2 | 99.09% |  Thermal Autonomy Test 2 |  Thermal Autonomy Test 2 | 98.57% |
 Daylight Autonomy Test 3 |  Daylight Autonomy Test 3 | 99.06% |  Thermal Autonomy Test 3 |  Thermal Autonomy Test 3 | 98.96% |
| New Methodology with Machine Learning | Traditional Simulation | ||
|---|---|---|---|
| Training Data preparation | Real Simulation | ||
| Training Datasets: 100 | Sets: 1500 | ||
| Simulation Time for Per Pair of DA&TA: 1 h | Simulation Time for Per Pair of DA&TA:1 h | ||
| Total Time for Preparation:100 h | |||
| Machine Learning processing:3 h | |||
| Generate Results | |||
| Sets:1500 | |||
| Generate Time for Per Pair of DA&TA: 5 s | |||
| Total Time for Generation:2 h | |||
| Total Time for Methodology | Total Time | ||
| 105 h | 1500 h | ||
| Sensor or Equipment | Model | Accuracy | Range |
|---|---|---|---|
| Digital Temperature | DS18B20 | ±0.5 °C | −55 to 125 °C |
| Light Intensity | BH1750 | ±20% | 1 to 65535 lx |
| Arduino microcontroller | Mega2560 |
Publisher’s Note: MDPI stays neutral with regard to jurisdictional claims in published maps and institutional affiliations. |
© 2022 by the authors. Licensee MDPI, Basel, Switzerland. This article is an open access article distributed under the terms and conditions of the Creative Commons Attribution (CC BY) license (https://creativecommons.org/licenses/by/4.0/).
Share and Cite
Lu, Y.; Wu, W.; Geng, X.; Liu, Y.; Zheng, H.; Hou, M. Multi-Objective Optimization of Building Environmental Performance: An Integrated Parametric Design Method Based on Machine Learning Approaches. Energies 2022, 15, 7031. https://doi.org/10.3390/en15197031
Lu Y, Wu W, Geng X, Liu Y, Zheng H, Hou M. Multi-Objective Optimization of Building Environmental Performance: An Integrated Parametric Design Method Based on Machine Learning Approaches. Energies. 2022; 15(19):7031. https://doi.org/10.3390/en15197031
Chicago/Turabian StyleLu, Yijun, Wei Wu, Xuechuan Geng, Yanchen Liu, Hao Zheng, and Miaomiao Hou. 2022. "Multi-Objective Optimization of Building Environmental Performance: An Integrated Parametric Design Method Based on Machine Learning Approaches" Energies 15, no. 19: 7031. https://doi.org/10.3390/en15197031
APA StyleLu, Y., Wu, W., Geng, X., Liu, Y., Zheng, H., & Hou, M. (2022). Multi-Objective Optimization of Building Environmental Performance: An Integrated Parametric Design Method Based on Machine Learning Approaches. Energies, 15(19), 7031. https://doi.org/10.3390/en15197031