Article

Mineral Resource Constraints for China’s Clean Energy Development under Carbon Peaking and Carbon Neutrality Targets: Quantitative Evaluation and Scenario Analysis

1
Business School, University of Shanghai for Science and Technology, Jungong Road 516, Yangpu District, Shanghai 200093, China
2
National Energy Conversation Center of China, Beijing 100045, China
*
Author to whom correspondence should be addressed.
Energies 2022, 15(19), 7029; https://doi.org/10.3390/en15197029
Submission received: 6 August 2022 / Revised: 15 September 2022 / Accepted: 16 September 2022 / Published: 24 September 2022

Abstract

:
With concerns about global warming and energy security, people are reducing fossil fuel use and turning to clean energy technologies. Mineral resources are used as materials for various energy technologies, and with the development of clean energy technologies, the demand for mineral resources will increase. China is a large country with various mineral resources, but its structural supply problem is severe. For China to reach the targets of carbon peaking before 2030 and carbon neutrality before 2060, they have set specific milestones for developing each clean energy industry; thus, the demand for mineral resources in clean energy will increase. We first summarise the mineral resources supply for China’s development of clean energy technologies. We analyse the demand for various mineral resources in specific clean energy technology sectors under the stated policies scenario and sustainable development scenario through scenario setting. Finally, we combine current domestic mineral resource reserves and overseas import channels to analyse China’s mineral resource supply and demand for developing the clean energy industry. Our results show that the surge in clean energy generation and electric vehicle ownership in China between 2020 and 2050 will lead to a significant increase in demand for mineral resources for these technologies and a shortage in the supply of some mineral resources. In particular, the supply of copper, nickel, cobalt, and lithium will be a severe constraint for clean energy development. We also find that secondary recycling of power battery materials in the electric vehicle sector could alleviate China’s resource constraints. The findings of our study provide a better understanding of the kinds of mineral elements that are in short supply on the path of clean energy development in China under carbon peaking and carbon neutrality targets and the future channels that can be used to increase the supply of minerals.

1. Introduction

1.1. Background

For the world to reach the Paris Agreement’s goal of limiting global average temperature increases to 2 °C compared to pre-industrial times, its energy systems are transitioning to cleaner and lower carbon energy technologies. Many countries around the world have set their carbon peaking and carbon neutrality targets. To achieve their reduction targets, countries are taking multiple pathways to reduce global carbon dioxide (CO2) emissions. At present, the world mainly uses six routes to reduce carbon emissions: controlling emissions at source, energy saving and efficiency improvement, process transformation, recycling, carbon capture, utilization and storage (CCUS), and developing clean energy. Recycling resources can effectively reduce carbon emissions in the initial production process, such as steel scrap, battery recycling, waste separation, and solid waste disposal. CCUS is considered as a promising approach for addressing climate change by gathering CO2 from industrial sources and injecting it into underground formation for permanent storage [1]. Injecting CO2 into the atmosphere is recognised as a promising solution for alleviating anthropogenic CO2 emission [2,3]. Among the ways to reduce emissions, the substitution of fossil energy with clean energy is widely used and recognised in countries around the world.
In the near future, clean energy will be the primary energy supplier globally; however, clean energy technologies are more material-intensive than traditional energy sources. As the energy transition progresses, the world will gradually shift from fuel-intensive to material-intensive energy systems (Figure 1). Many studies have been conducted on primary metals used in specific energy technologies, such as wind power, automotive (rare earth elements (REE) for magnets and generators), fuel cells (platinum group metals (PGMs)), thin-film photovoltaics (PV) using elements such as gallium and indium), lithium-ion elements (lithium, cobalt), and other applications [4].
Different clean energy technologies require different mineral resource types and quantities, and different mineral resources play various roles in clean energy technologies (Table 1).
Copper and aluminium are the primary materials for cables. Clean energy generation, power grids, other clean energy technologies, electric vehicle motors, wires, and charging piles all require copper, affecting the future demand trend of copper mines [6]. Wind power, solar cells, and fuel cells as material-intensive clean energy technologies depend on metals, such as cobalt, lithium, and REEs [7]. Hydrogen electrolysers and fuel cells may use PGMs depending on specific technology types, and lithium is the best energy source to achieve zero emissions [8]. The cell in the battery module is a lithium battery component, and the battery cell typically accounts for 70–85% of the battery’s cons weight [9]. Cobalt is an essential component of lithium batteries in electric vehicles and a vital strategic resource. Manganese and graphite are crucial mineral resources for battery technology, and nickel is an essential element in electric lithium batteries. However, hydrogen energy development will also significantly increase the demand for nickel for electrolytic and fuel cells. According to McKinsey [10], new vehicle technology development could drive the demand for neodymium and lithium by 120–200 times [10]. REEs are the primary elements for permanent magnets in wind turbines and electric vehicle engines, of which neodymium, praseodymium, and dysprosium are used in large quantities in constructing wind turbine generators [11].

1.2. Literature Review

The current application of clean energy technologies globally is still in its infancy. With the continuous development of clean energy technology, primary mineral resources will play a more significant role in clean energy technology in the future. With the pace of energy technology progress, the supply of mineral materials and critical metals for the transition of global energy system is a growing concern. Studies on mineral resources and energy development in the early literature were primarily regulated in reporting the lifecycle and investment of energy. Sherwani et al. [12] reviewed solar PV power systems’ lifecycle assessment. In 2011, Graedel [13] discussed the availability of energy-related metals and clarified that the application of advanced energy technology will require some critical materials and these materials often lack efficient substitutes. Valero et al. [14] summarized data regarding which elements are used in each clean technology under a top-down approach and in what amounts. In recent years, some researchers have reviewed the resource requirements of specific low-carbon technologies such as wind power [15] and solar PV [16]. Darina et al. [17] gave a quantitative indication of the EU’s resilience regarding the supply of materials relevant for the deployment of low-carbon energy and transport technologies.
Many scholars have assessed the supply risk of mineral resources in clean energy development globally and nationally. Nuss et al. [18,19,20] assessed the supply risk of metals in clean energy technologies at the global-, country-, and corporate- levels, including three types of supply risk: (1) geological, economic, and technological factors (2) social and regulatory factors, and (3) geopolitical factors. Tokimastu et al. [21] used a global energy mineral relationship model to set two energy and climate scenarios to estimate the metal demand for various power generation technology portfolios. Zhou et al. [4] used nine indicators to analyse the risk of China’s mineral resource supply under the supply chain approach. With the introduction of China’s carbon peaking and carbon neutrality targets, scholars have been increasingly discussing the peaking pathway [22] and energy transition [23] under the targets.
Many previous studies have discussed the demand and supply between mineral resources and clean energy technologies. However, there are still some issues that are worth further discussion. First, most papers conducted country- or global-level analyses and did not account for sectors’ contribution to mineral resources. Second, the existing literature has not quantitatively analysed various mineral resource supplies in developing the clean energy industry. Third, the political, resource endowment, and social contexts of China are different from western countries. The differences will impact mineral supply-demand match, which is not fully discussed. At the same time, carbon peaking and carbon neutrality targets in China have progressively received more attention over the past decade, but the scientific research remains at an initial stage due to the relatively short launch time. Relevant studies in China regarding energy under carbon peaking and carbon neutrality targets predominantly focus on developing clean energy technologies for reducing carbon emissions and controlling energy consumption. In summary, the existing studies lay the foundation and offer some inspiration for energy transition but have certain limitations.

1.3. Contribution of This Study

In this study, we use sector-level data and provide a new perspective focusing on developing countries (Figure 2). We also analyse the stability of import patterns both domestically and overseas. In addition, we specify the types of minerals that are likely to be in short supply in the clean energy sector with the development of clean energy technologies. We focus on projecting the future supply of specific mineral resources in each clean energy technology. We use scenario analysis to imitate the mineral resource supply and demand relationship for clean energy under possible future policy scenarios.
First, we analyse the current status of China’s domestic mineral resource supply and the security of overseas imports. We provide a brief overview of the current situation of irrational domestic mineral exploitation and insufficient resource endowment. We also provide a brief assessment of China’s overseas mineral import patterns through import concentration, import region stability, and import channel security. Through the above analysis, we conclude the current deficiencies of China’s mineral supply.
Second, we hypothesise the mineral demand and estimation under the sustainable development scenario (SDS) and the stated scenario (STEPS) to examine the demand for mineral resources under different scenarios for clean power generation technologies and electric vehicles. We find that the choice of different power generation technologies has an impact on the future demand for mineral resources, although the demand for each technology is similar in terms of mineral types. Our comparison of the mineral resource demand for clean energy technologies in 2020–2030 and 2020–2050 with the reserves in 2020 (we find that domestic reserves data have been relatively stable in recent years) also shows that, although the demand for some types of mineral resources for these clean energy technologies is large, their reserves and supply are relatively stable and do not cause shortages in the short term. However, some types of minerals, such as cobalt, although the amounts used to build each unit of clean energy facilities are not large, will instead face a relatively large shortage or even limit the development of clean energy due to its scarcity in China.
Third, we also analyse the recent overseas import data of the four minerals we predict to be in shortage for future clean energy technologies—copper, nickel, cobalt, and lithium—and we find that, although the overseas imports of these four minerals are relatively stable, they have not been overly affected by the COVID-19.
Finally, we also present the potential of mineral recycling to alleviate China’s mineral shortage. Using the example of power batteries for electric vehicles and referring to data from developed countries, we show that, although the mineral recycling context may seem challenging at present, the share of recycling will grow significantly in the next 30 years, even to about 50% for cobalt and nickel. This study has far-reaching significance to the stable development of the clean energy industry under the goals of peak CO2 emissions and carbon neutrality.

2. The Current Situation of Supply and Demand of Mineral Resources Required by China’s Clean Energy Industry

2.1. Domestic Supply of Mineral Resources

China is the world’s largest mineral producer, and its mineral resources are abundant, including coal, iron, tungsten, molybdenum, tin, antimony, REEs, and other vital mineral reserves, and ranks among the world’s top (Table 2) [24]. China’s REE resources are abundant, with complete types, wide and concentrated distribution, and the resource reserves and annual production have long occupied first place globally. China’s tungsten and antimony supplies exceed 80% of the global market.
However, some mineral enterprises have indiscriminate and excessive mining, causing environmental damage, and numerous heavy metals and radioactive elements enter the environment to pollute the soil and water. Consequently, China’s mineral resources with resource endowment advantages are gradually losing their quantitative benefits in the world market. In the example of REE, recoverable reserves are growing slowly, but the consumption is too fast—mineral exports are high, but the price is low [25]. Simultaneously, China lacks mineral product development and use, and the high-tech content of products is low. In the entire industry chain of raw ore → concentrate → smelting products → functional materials → devices → end products, China has advantages in the upstream part of the industry chain (mining, smelting, separation) but lacks core technologies downstream of the industry chain [26]. Compared with the enterprises in developed countries, there is still much room for improvement regarding technology level, industrial structure, and added value of products in China’s in-depth processing enterprises.

2.2. Security of Overseas Supply of Mineral Resources

China is the world’s largest mineral resource producer, consumer, and overseas resource importer [24]. The China Mineral Resources Report (2021) highlighted that China’s resource endowment and mineral resource consumptions are mismatched, and most minerals can only rely on imports to meet domestic demand. China’s mineral resource supply has been facing shortages. Specifically, the manufacture of clean energy vehicles consumes lithium, nickel, cobalt, and other minerals, placing China in a disadvantageous global position, with long-term dependence on overseas imports. The import dependence of the aforementioned minerals is high, reaching 79%, 92%, and 97%, respectively, in 2020 [28].

2.2.1. Concentration of Import Sources

Because the geographical distribution of mineral resources required by most clean energy industries is extremely uneven and highly concentrated, a specific mineral resource could primarily be distributed in a few countries. Therefore, most mineral import sources are concentrated. Table 3 shows that China’s imports of phosphate rock, cobalt, and the other four minerals from first-source countries exceeded 60%. The total import volume of iron ore, manganese, chromium, nickel, and other mineral imports from the first and second import source countries exceeds 60%. Among these importing countries, some are pro-US. In addition to the current global pandemic outbreak and the emergence of trade protectionism, China’s mineral resource supply chain is vulnerable to trade policy restrictions in producing countries, geopolitics, coups, and other factors.

2.2.2. Regional Security of Imported Mineral Resources

According to the regional division of China’s mineral resource import sources, the top three mineral resource import values are from the Middle East, Oceania, and Africa [24]. Africa and the Middle East are vital importers of mineral resources for China, but the security of mineral resource supply in these regions is vulnerable to sudden public events. For instance, the Democratic Republic of the Congo (DRC) is the world’s largest producer of cobalt; however, its medical public healthcare conditions are poor, and its ability to cope with public health is weak in pandemics, such as COVID-19 and Ebola. Coupled with the civil war unrest, the stable and safe supply of global cobalt faces many challenges. The stable and secure supply of mineral resources directly affects the price of mineral products. Russia is a crucial supplier of copper, nickel, PGMs, and other mineral resources vital to clean energy source demand. Nickel prices skyrocketed after the Russia–Ukraine war outbreak on 24 February 2022. The security of the import regions is increasingly becoming a problem for the overseas supply of our mineral resources.

2.2.3. Mineral Resource Transportation Channel Security

China’s mineral resource imports are primarily transported by sea, of which 99% of clean energy mineral transportation must go through the Malacca Strait, the Sunda Strait, and the South China Sea transport channel to reach the country. China’s overseas resource supply transport chain relies on the South China Sea, the Pacific, and land routes, of which the value of imports through the South China Sea route accounts for 68% [24]. The Malacca Strait and the South China Sea are the choking points for China’s mineral resource import chain. A single transportation channel will lead to a high degree of channel dependence and high-security risks. If war or other unexpected factors, such as natural disasters, block the transportation channel, more than half of the mineral imports will be blocked, and their supply will be interrupted.
According to data from recent years, the domestic and foreign supply of mineral resources involved in China’s clean energy industry is steadily increasing. However, China’s current supply of mineral resources has a backward domestic development and high overseas dependence. From a domestic supply perspective, China’s mineral resources have unscientific mining and severe environmental pollution problems and lack core competitiveness in end-products. From an overseas supply channel perspective, the concentration of imports of phosphate rock, cobalt, lithium, chromium, and other minerals is high. The import regions are vulnerable to pandemics and war, the security is poor, and the import transportation channel is simple, with high channel dependence and susceptible to unexpected interruptions.

3. Scenario Analysis Method and Parameter Setting

Echoing the Paris Agreement’s 1.5 °C temperature control target in September 2020, President Xi Jinping announced that China will aim for carbon peaking by 2030 and to achieve carbon neutrality by 2060. Under these two goals, China will further accelerate its energy transition and adhere to green and low-carbon development. Clean energy sources, such as wind power and solar PV power generation, will develop by leaps and bounds [30] to accelerate achieving the carbon peaking and carbon neutrality goals and promote the rapid development of China’s economy and society. The National Energy Administration has set a target of 25% of national non-fossil energy consumption and over 1.2 billion KW of installed wind power and solar PV capacity by 2030. Therefore, between 2021 and 2030, China will install more than 666 million KW of wind power and solar PV. According to the Clean Energy Vehicle Industry Development Plan (2021–2035) [31] published by the Ministry of Industry and Information Technology [31], by 2025, China’s clean energy vehicle sales will account for 20% of new vehicle sales, up from 5.4% in 2020. Therefore, the demand for mineral resources in China will further increase.
How to have enough stable and sustainable supply of mineral resources for developing the clean energy industry has become a pressing problem in China. The scenario analysis method projects the possible situations of the predicted object, assuming that a specific phenomenon or trend will continue. It is widely used in energy and economic research to reference industry development and regional policy formulation. Valero et al. [14] used scenario analysis to study changes in the global consumption demand in different energy sectors from 2025 to 2050 under a 2 °C target scenario. Månberger et al. [32] studied the impact of technology improvements and technology mix on metal demand under a climate mitigation scenario. Tokimastu [21] studied the global energy mineral relationship by projecting metal demand under three technology pathways: 100% renewables, coal plus nuclear, and natural gas plus renewables in two scenarios satisfying net-zero emissions below the 2 °C target and no coal constraints. We quantitatively project and discuss the mineral resource supply and demand in the clean energy sector under different scenarios concerning the International Energy Agency (IEA) projections on China’s energy transition path.

Scenario Design

The role of critical minerals in clean energy transition [5], published by the IEA in 2021, analysed the essential role of mineral resources in energy transition based on the two main scenarios described by the IEA in the World Energy Outlook 2020 [33], namely, the sustainable development scenario (SDS) and the stated policy scenario (STEPS). The SDS charts a pathway to fully achieve the world’s energy goals of reaching the Paris Agreement’s target-setting pathway on climate change, improving air quality, and building a sustainable modern energy system. The SDS is a scenario set by governments and companies to achieve their declared net-zero emissions targets on time. The STEPS reflects specific policies and scenarios set by governments globally regarding announced policy goals, providing a benchmark to assess what current policy measures and programmes could bring to the energy sector. China’s projected demand for mineral resources highly depends on the strict implementation of energy policies and technology development. Driven by the goals of carbon peaking and carbon neutrality, China’s clean energy industry is growing rapidly. By 2021, the offshore wind power and many other projects will account for the largest number of additions in the world. Some provinces and cities currently propose an advanced carbon peaking target. Therefore, in our projections of mineral resource demand, we will use the data of mineral resource demand under the STEPS as the basic reference and use the SDS data as the primary basis to project the demand for mineral resources in China’s clean energy industry.
According to the IEA report, electric vehicles and clean energy generation are the two primary drivers of the future demand surge for clean energy technology minerals, with a renewable energy-led power sector laying the foundation for China’s energy transition. The demand for renewable energy-based power generation focuses on wind and solar PV. However, the demand for minerals from electric vehicles and battery storage will account for approximately half of the global clean energy mineral demand additions over the next 20 years. We assume that (1) the average annual growth rate of electric vehicle stock from 2030 to 2050 is the average annual growth rate of the electric vehicle stock from 2020 to 2030. Table 4 shows the projection for electric vehicle stock in China in 2030 and 2050.
(2) As the system constructions of different electric vehicles are similar, we assume that the average consumption of various mineral resources is the same for several electric vehicles (Table 5).
(3) The installed wind and solar PV capacities for 2020–2030 and 2020–2050 are projected based on the projections of wind and solar PV generation capacities in the World Energy Outlook (WEO) 2021 (Table 6). The average use hours of the installed capacity are assumed to be 1.15 and 1.4 times the average use hours of the total installed capacity in their respective 2020s. In 2020–2030, the assumptions of installed capacity are the results obtained from the backward projections based on the total installed capacity target and total power generation in each province and city in China. Furthermore, we assume that the average use hours of installed power generation technologies in 2020–2050 can reach the highest value that the annual use hours can reach in 2020. Therefore, the yearly annual use hours of clean energy power generation technology in 2050 is 1.4 times that in 2020.
(4) Although offshore wind power started more recently, the rapid development in the future will become the primary market segment. Therefore, we assume that the new installations of onshore wind power in 2020–2030 will be twice the offshore wind power, and the new installations of offshore and onshore wind power will be equal in 2020–2050 (Table 7).
(5) The complete lifecycle of wind power and solar PV projection is 20–30 years; therefore, the number of new wind power and solar PV installations from 2020 to 2030 does not consider the newly installed capacity due to its lifecycle, and the wind power and solar PV installations in 2020 and before will be renewed between 2030 and 2050.
(6) Only the consumption of mineral resources for the installed clean energy generation technology is considered, excluding the mineral resources required during operation. The amount of mineral resources consumed per unit for specific clean energy technology (Table 8) remains unchanged.
(7) Only the consumption of mineral resources under domestic demand is considered, and the consumption of mineral resources for exporting various technologies is excluded.
We combined the WEO 2020 policy and the above assumptions by designing mineral resource consumption scenarios for China’s clean energy industry in 2030 and 2050 under the stated policy scenario (STEPS) and the sustainable development scenario (SDS). Clean energy generation technologies primarily include offshore wind power, onshore wind power, and solar PV power, and the demand for mineral resources varies significantly among the different generation technologies. We calculated the mineral resource demand for each technology under different scenario goals by multiplying each technology’s cumulative new quantities under different scenarios and different stages in Table 7 and the mineral resource consumption of electricity technologies in Table 4 and Table 7 (Equation (1)).
Vijn = Nijm × Qmn
where Vijn: cumulative new demand for the n types of mineral resources between years 2020–j under scenario i;
Nijm: the cumulative new quantity of the m types of clean energy technologies during the years 2020–j under the ith scenario;
Qmn: the quantity of n types of mineral resources consumed by the m types of clean energy technologies under each unit.
Based on the above methods and data, the demand for mineral resources in China’s clean energy sector in 2030 and 2050 can be quantitatively projected and analysed.

4. Scenario Analysis Results and Discussion

Figure 3 and Figure 4 show the mineral resource requirements of the clean energy sector under different scenarios for 2020–2030 and 2020–2050. Table 9 shows the cumulative installed capacity of clean energy generation technologies and electric vehicle stock in China for 2020, 2030, and 2050. Each clean energy technology is included in two scenarios for 2030 and 2050 under the SDS and STEPS, respectively. From the two figures, different clean energy technologies have different demands on various minerals, and the demand for mineral resources of clean energy technologies varies significantly under varying scenarios.

4.1. Demand for Mineral Resources in the Clean Energy Generation Industry

Table 8 shows that offshore power generation technologies have a high demand for copper and zinc. Each megawatt of installed offshore wind power requires 8000 tonnes of copper and 5500 tonnes of zinc resources. Table 6 shows that under the SDS, China has a higher demand for clean energy generation capacity; therefore, more mineral resources will be used for clean energy technologies. Table 9 shows that the cumulative installed capacity of offshore wind power in China was 9 GW by 2020. In the SDS, the cumulative installed capacity of offshore wind power in 2030 is 34 times that of 2020 and 101 times by 2050. Under the STEPS, the total mineral resource demand for offshore wind power in 2020–2030 is 27 times the demand by 2020 and 63.1 times in 2020–2050. Therefore, in 2020–2050, offshore wind power technology will reach a high development stage, and its demand for mineral resources will increase to an unprecedented level.
Comparing the future mineral resource consumption between the two scenarios (Figure 3 and 
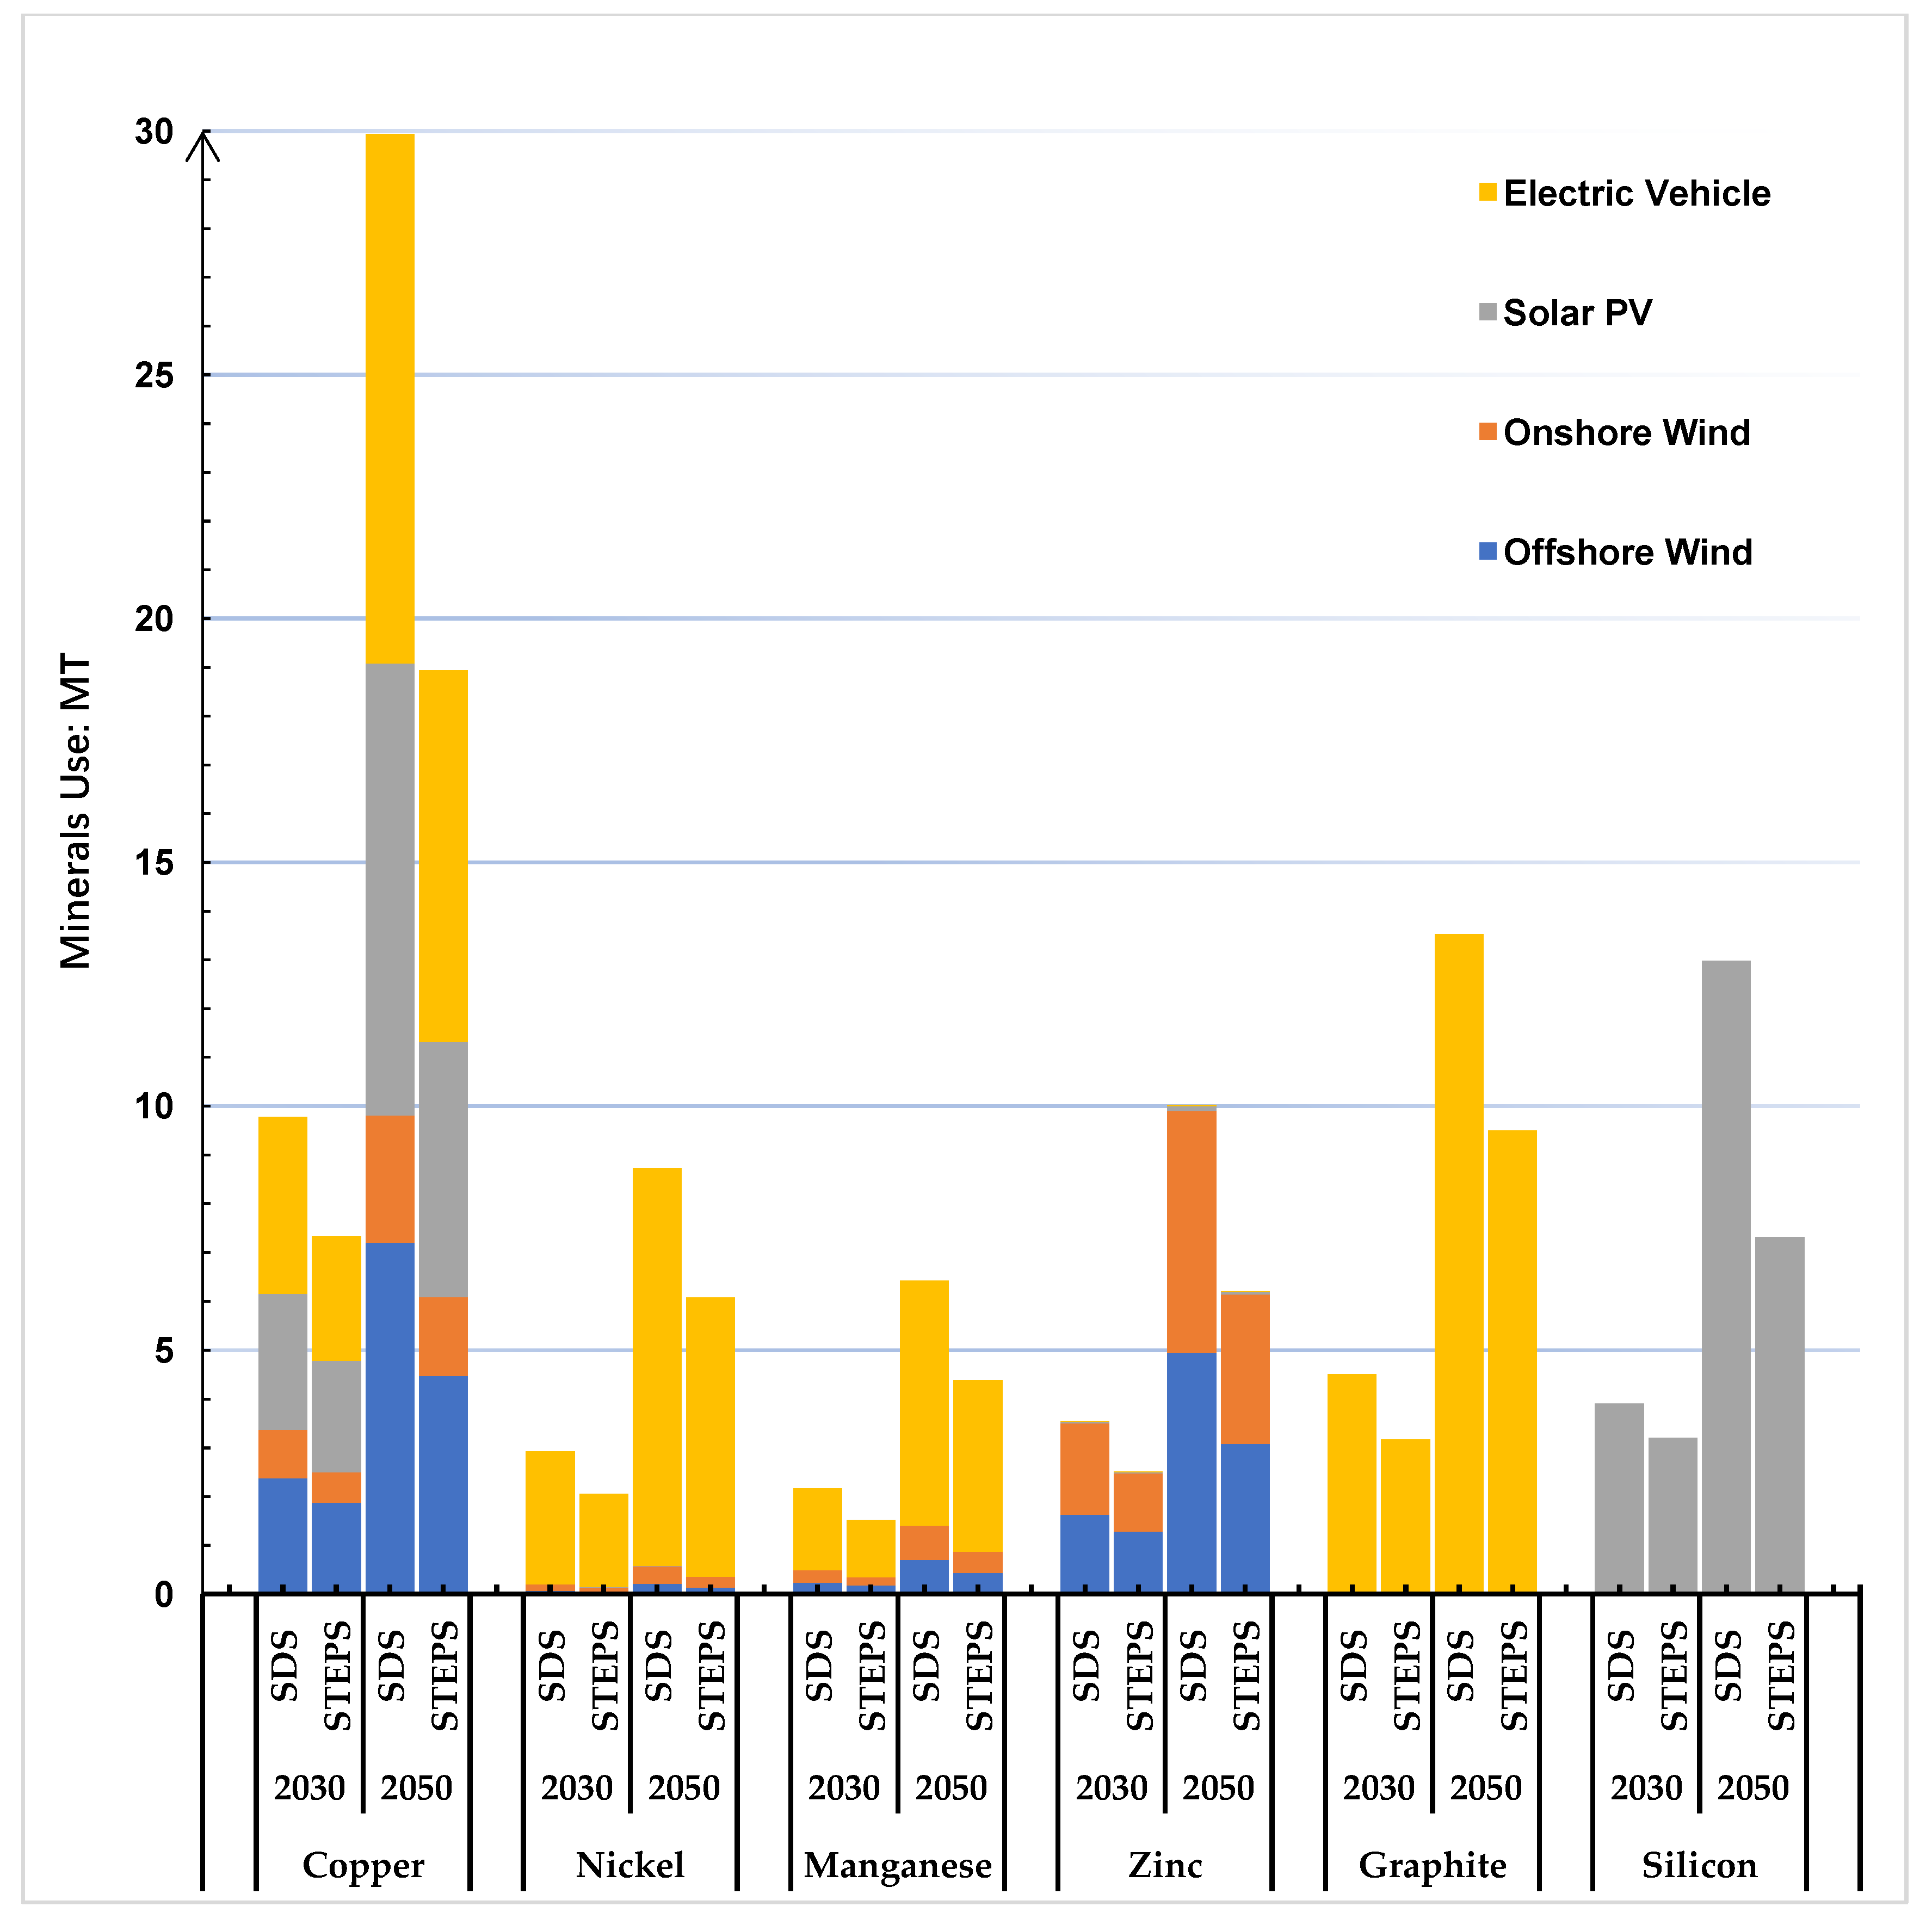
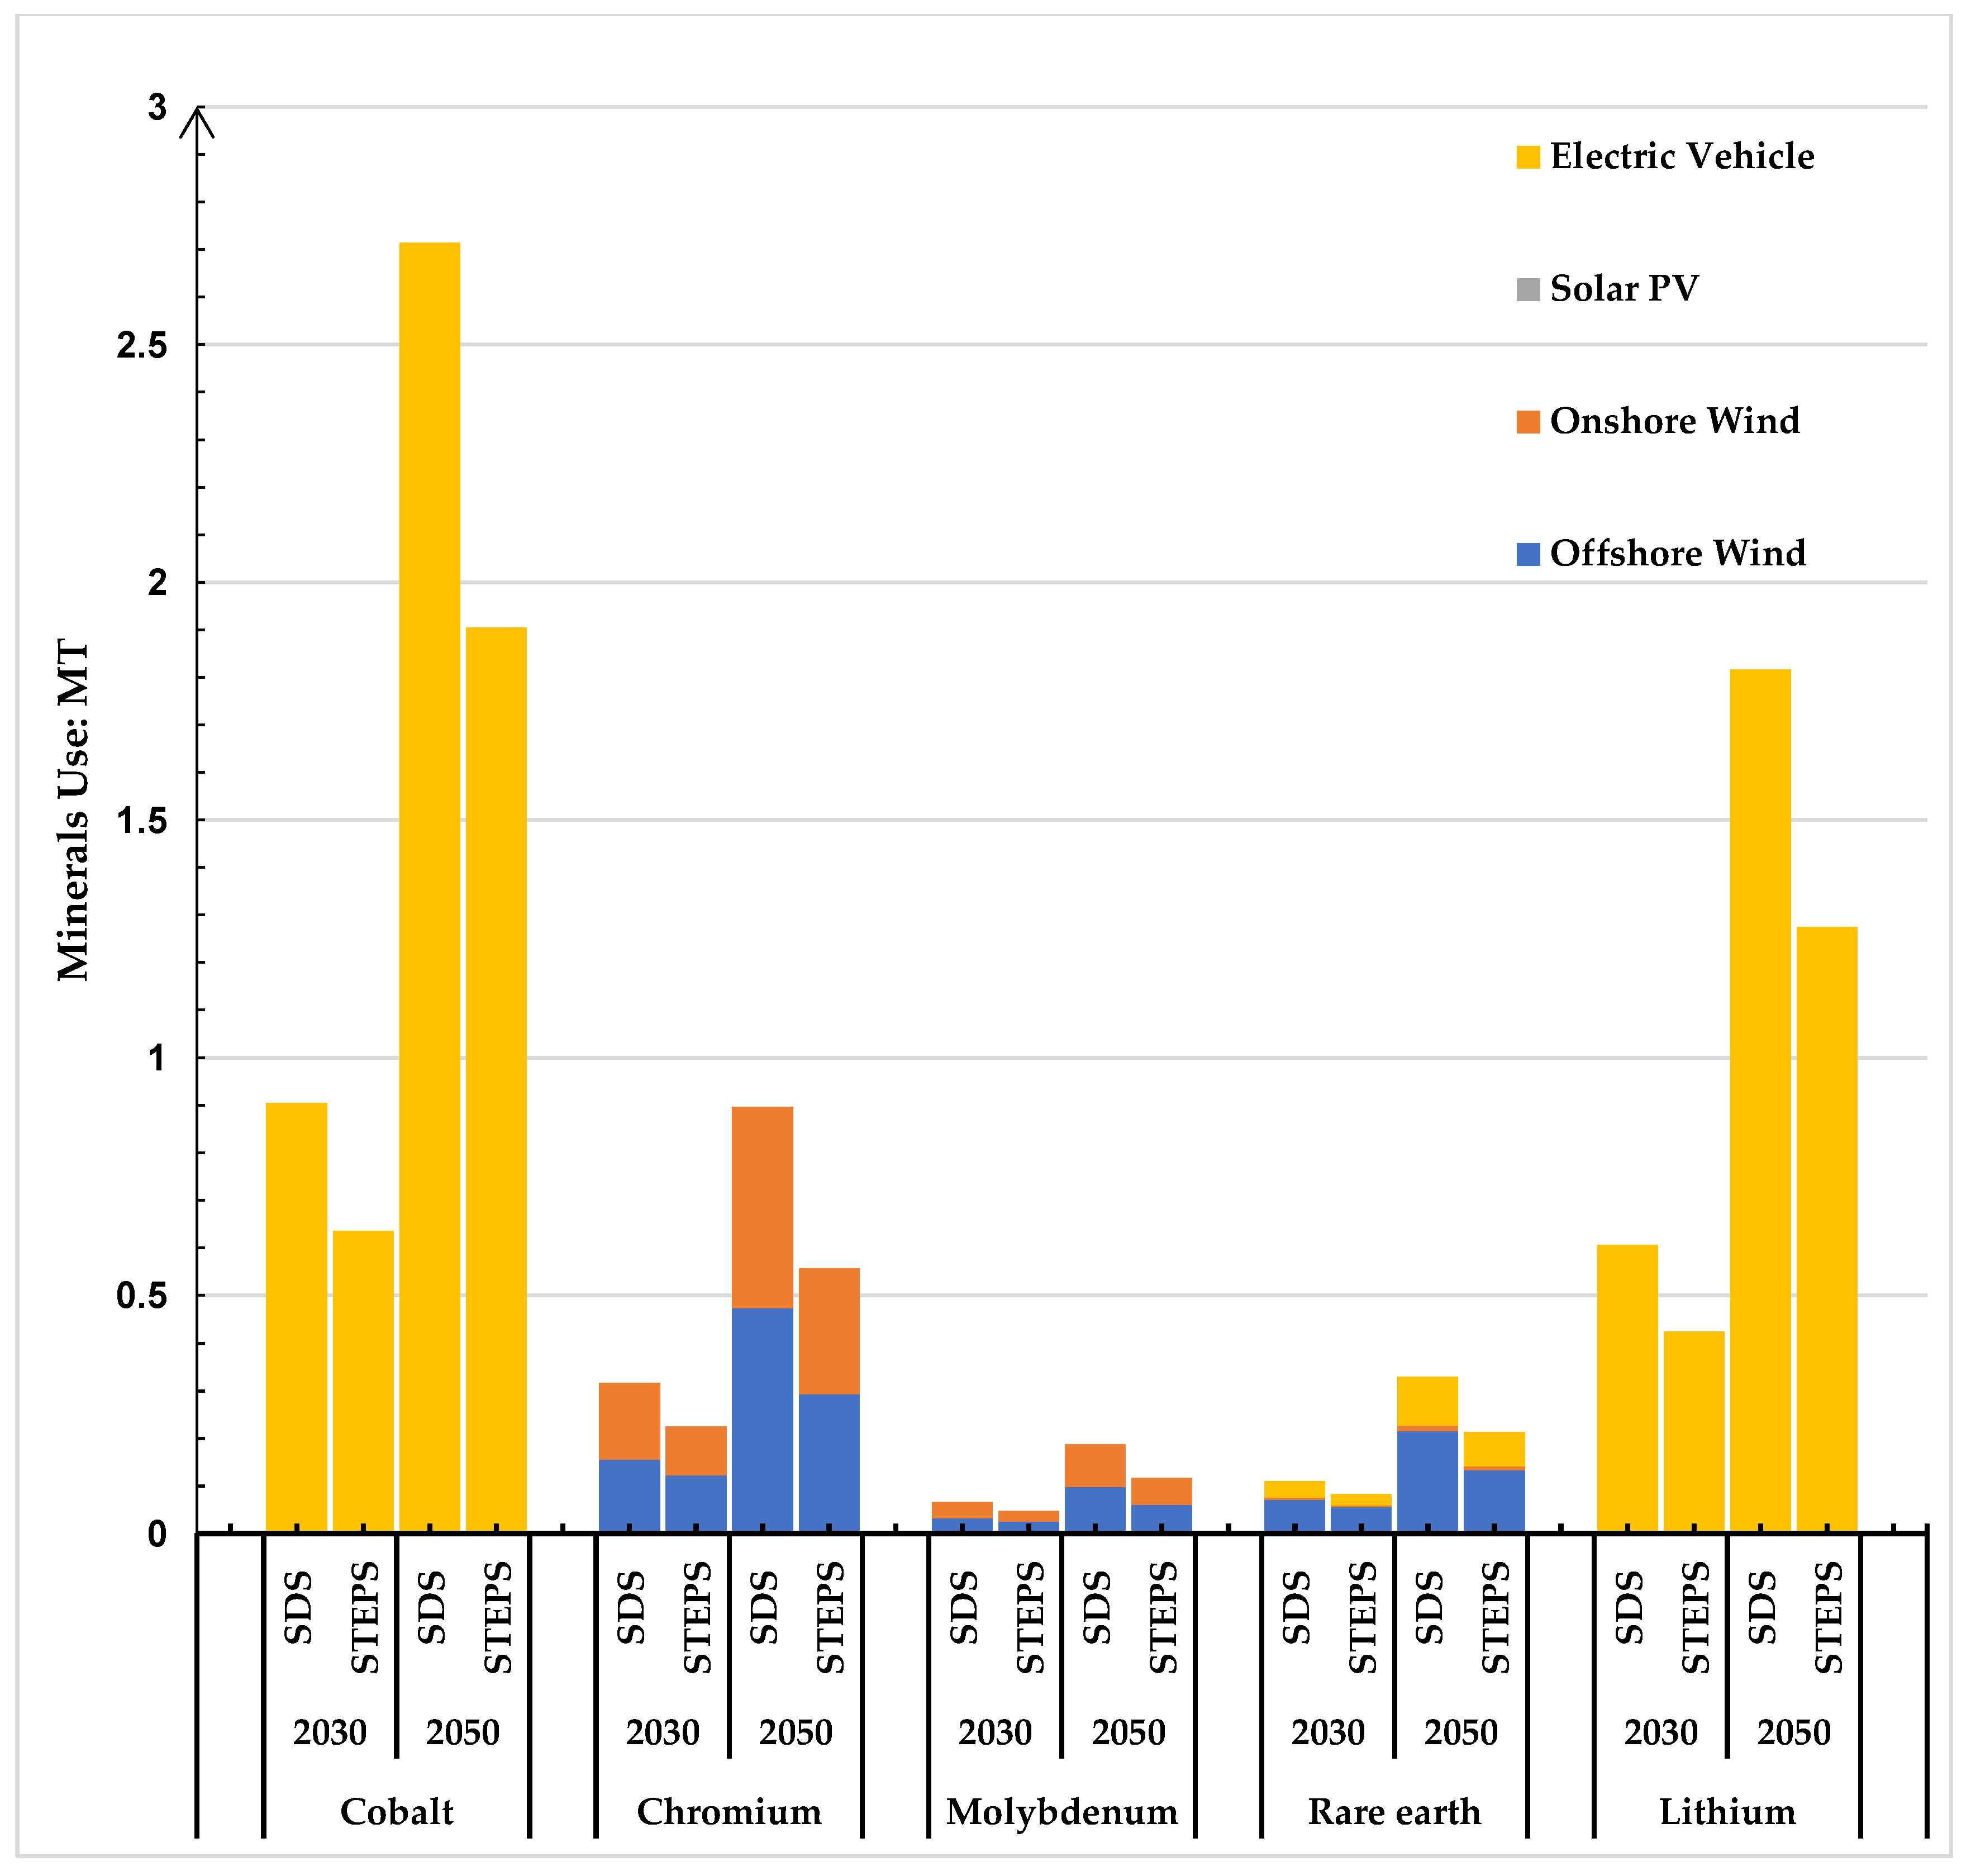
Figure 4), the mineral resources consumed by offshore wind technologies from 2020 to 2030 are 1.27 times higher than in the STEPS. Over the next 30 years (2020–2050), the SDS scenario consumes 1.61 times more mineral resources than the STEPS. The offshore wind power construction process consumes copper, zinc, manganese, and chromium, most notably copper and zinc (Figure 4). As shown in Figure 3, copper reaches 1.87 MT under the STEPS and 2.78 MT under the SDS scenario. In 2020–2030, the demand for copper for offshore wind technology in the SDS will be 7.2 MT. The SDS zinc consumption will be 1.63 MT over the next decade (2020–2030) and reach nearly 5 MT over the next 30 years (2020–2030). The consumption decreases in the STEPS, with 1.29 MT and 3.07 MT, respectively. From different time perspectives, the zinc consumption in offshore wind technology is 3.03 times higher in the SDS in 2020–2030 than the 2.39 times in the STEPS.
Table 8 shows that onshore and offshore wind power technologies require the same mineral resources, and the two minerals with the highest demand are copper and zinc. Offshore wind power requires the most copper, and onshore wind power requires the most zinc. However, compared to offshore wind power, onshore wind power requires less of all mineral resources. In the STEPS, 1.188 MT zinc and 0.63 MT copper and 1.63 MT zinc and 0.99 MT copper in the SDS will be consumed from 2020 to 2030—1.38 times more than in the STEPS. Onshore wind power will consume 1.61 times more minerals in the SDS than in STEPS from 2020 to 2050.
From the different time points, the new consumption of mineral resources for onshore wind power from 2020 to 2050 will be 2.64 times higher in the SDS than from 2020 to 2030, whereas this indicator is 2.59 times higher in the STEPS. Therefore, there is a significant difference in the number of mineral resources consumed in the two scenarios with the same time nodes. However, if we consider the same scenario, the ratio of the number of mineral resources consumed in the two time periods (2020–2030 and 2020–2050) is similar. The primary reason is that onshore wind power technology is mature and has a sizeable development, whereas there is a limit to the amount of wind energy resources that can be developed onshore. Therefore, compared with offshore wind power, the growth rate of the number of installed onshore wind power will gradually slow down, and the change in the demand for onshore wind power mineral resources will be smaller.
In the SDS, the cumulative mineral resource demand for onshore wind technology in 2030 and 2050 will be 2.26 and 4.3 times the cumulative demand in 2020, respectively. In the STEPS, the total installed mineral resource demand for onshore wind in 2030 and 2050 will be 1.8 and 3 times the demand in 2020, respectively. According to our assumptions, the mineral resource consumption for onshore wind power in the later stages is primarily used for replacing installed wind turbines due to lifecycle constraints. The technology development in the future sustainability scenario will be limited if more available resources are not developed or their use is not improved.
Compared with the wind energy system, the mineral resources consumed in the installed solar PV power generation system are primarily concentrated on copper and silicon and some nickel and zinc (Table 8). However, Table 5 and Table 8 show that China’s PV power generation technology has a specific scale. Because the solar resources that can be developed are more abundant than wind resources, in the future construction of clean energy generation technology, the power generation and installed capacity of solar PV systems in China will far exceed those of offshore and onshore wind power.
In terms of the growth rate of mineral resource demand, under the SDS, China’s cumulative solar PV mineral resource consumption in 2020–2030 and 2020–2050 is 5 and 15 times that of 2020, respectively. Under the STEPS, the cumulative solar PV mineral consumption in 2020–2030 and 2020–2050 is 4.2 and 8.3 times that of 2020, respectively. In the STEPS scenario, the demand for copper and silicon for installed solar PV power generation reaches 2.29 and 3.21 MT from 2020 to 2030, respectively, and the demand in 2020–2050 is 2.3 times higher than in 2020–2030. The demand for copper and silicon for solar PV power generation in 2050 will reach over 5 and 7 MT, respectively. In the SDS, the demand for copper and silicon will further increase. In 2020–2030, the demand for copper is 2.8 MT and silicon is 3.91 MT, and in 2020–2050, the demand for these two minerals will reach 9.28 and 12.98 MT, respectively, 3.3 times the demand in 2020–2030.
Comparing the two scenarios, the consumption of mineral resources required for solar PV in the SDS is 1.22 times higher than that in the STEPS in the next decade (2020–2030), and this value will be 1.77 times higher in the next 30 years (2020–2050). Therefore, solar PV is a crucial clean energy generation technology for 2030–2050 and has excellent potential for development under the SDS. Under the current policy scenario, the solar PV industry’s growth rate is slow and insufficient to achieve the future energy transformation needs under peaking CO2 emissions and carbon neutrality.
Different clean energy generation technologies have different demands on mineral resources and will impact future mineral resource supplies differently. The mineral demand for offshore wind power focuses on copper, zinc, manganese, and chromium. Although the same minerals are used in offshore and onshore wind power, the two power generation technologies have different demands for the same mineral resources. Solar PV generation systems require fewer mineral resource types, and the future demand for silicon in the clean energy industry is concentrated in solar PV generation technology.

4.2. Mineral Resource Requirements for Electric Vehicles

Developing clean energy vehicles is a mandatory path for China to become a strong automotive country and is a strategic initiative to address climate change and promote green development [31]. Table 4 shows a considerable increase in electric vehicle stock in China in 2030 and 2050 compared with that in 2020. With the pace of energy transition, electric vehicles are gradually replacing fuel vehicles. The three most used mineral resources in manufacturing electric vehicles are graphite, copper, and nickel. According to the data shown in Table 9, China’s vehicle stock will reach 52.25 million units in 2030 under the STEPS and 72.53 million units under the SDS. Figure 3 and Figure 4 show that graphite, copper, and nickel mineral resource consumption for electric vehicle manufacturing will reach 3.17 MT, 2.54 MT, and 1.9 MT in 2020–2030 under the STEPS. In the SDS, the consumption of these three mineral resources from 2020 to 2030 is 1.42 times higher than that in the STEPS, at 4.60 MT, 3.62 MT, and 2.17 MT, respectively.
In our assumptions, the electric vehicle stock from 2020 to 2050 is due to a linear extrapolation of the data from 2020 to 2030. We predict that with the developing public transportation network and the decreasing birth rate, the growth rate of electric vehicle stock in 2030–2050 will not vary much from that in 2020–2030; therefore, the multiplier value of the mineral resource consumption of the electric vehicle industry in the SDS compared to the STEPS over the next three decades (2020–2050) is the same as the next decade (2020–2030). However, driven by the energy transition and the general background of reducing carbon emissions, the future of China’s electric vehicle stock will double, and its demand for mineral resources will increase. Compared with the electric vehicle stock in 2020, China’s electric vehicle stock in 2050 will be 32.8 times higher than that in 2020 in the STEPS scenario. The demand for graphite, copper, and nickel mineral resources will reach 9.5, 7.62, and 5.71 MT, respectively, and the total demand for mineral resources in the electric vehicle industry in 2020–2050 will be 32.8 times higher than that of 2020. In SDS, the cumulative mineral resource demand in 2020–2050 will be 46 times that of 2020, and the mineral resource demand for electric vehicles in 2020–2050 will be three times that in 2020–2030. Therefore, the demand for mineral resources in electric vehicle manufacturing will be one of the primary reasons for the future growth of the clean energy mineral demand in China.

4.3. Analysis of the Gap between Supply and Demand of Mineral Resources in the Clean Energy Industry

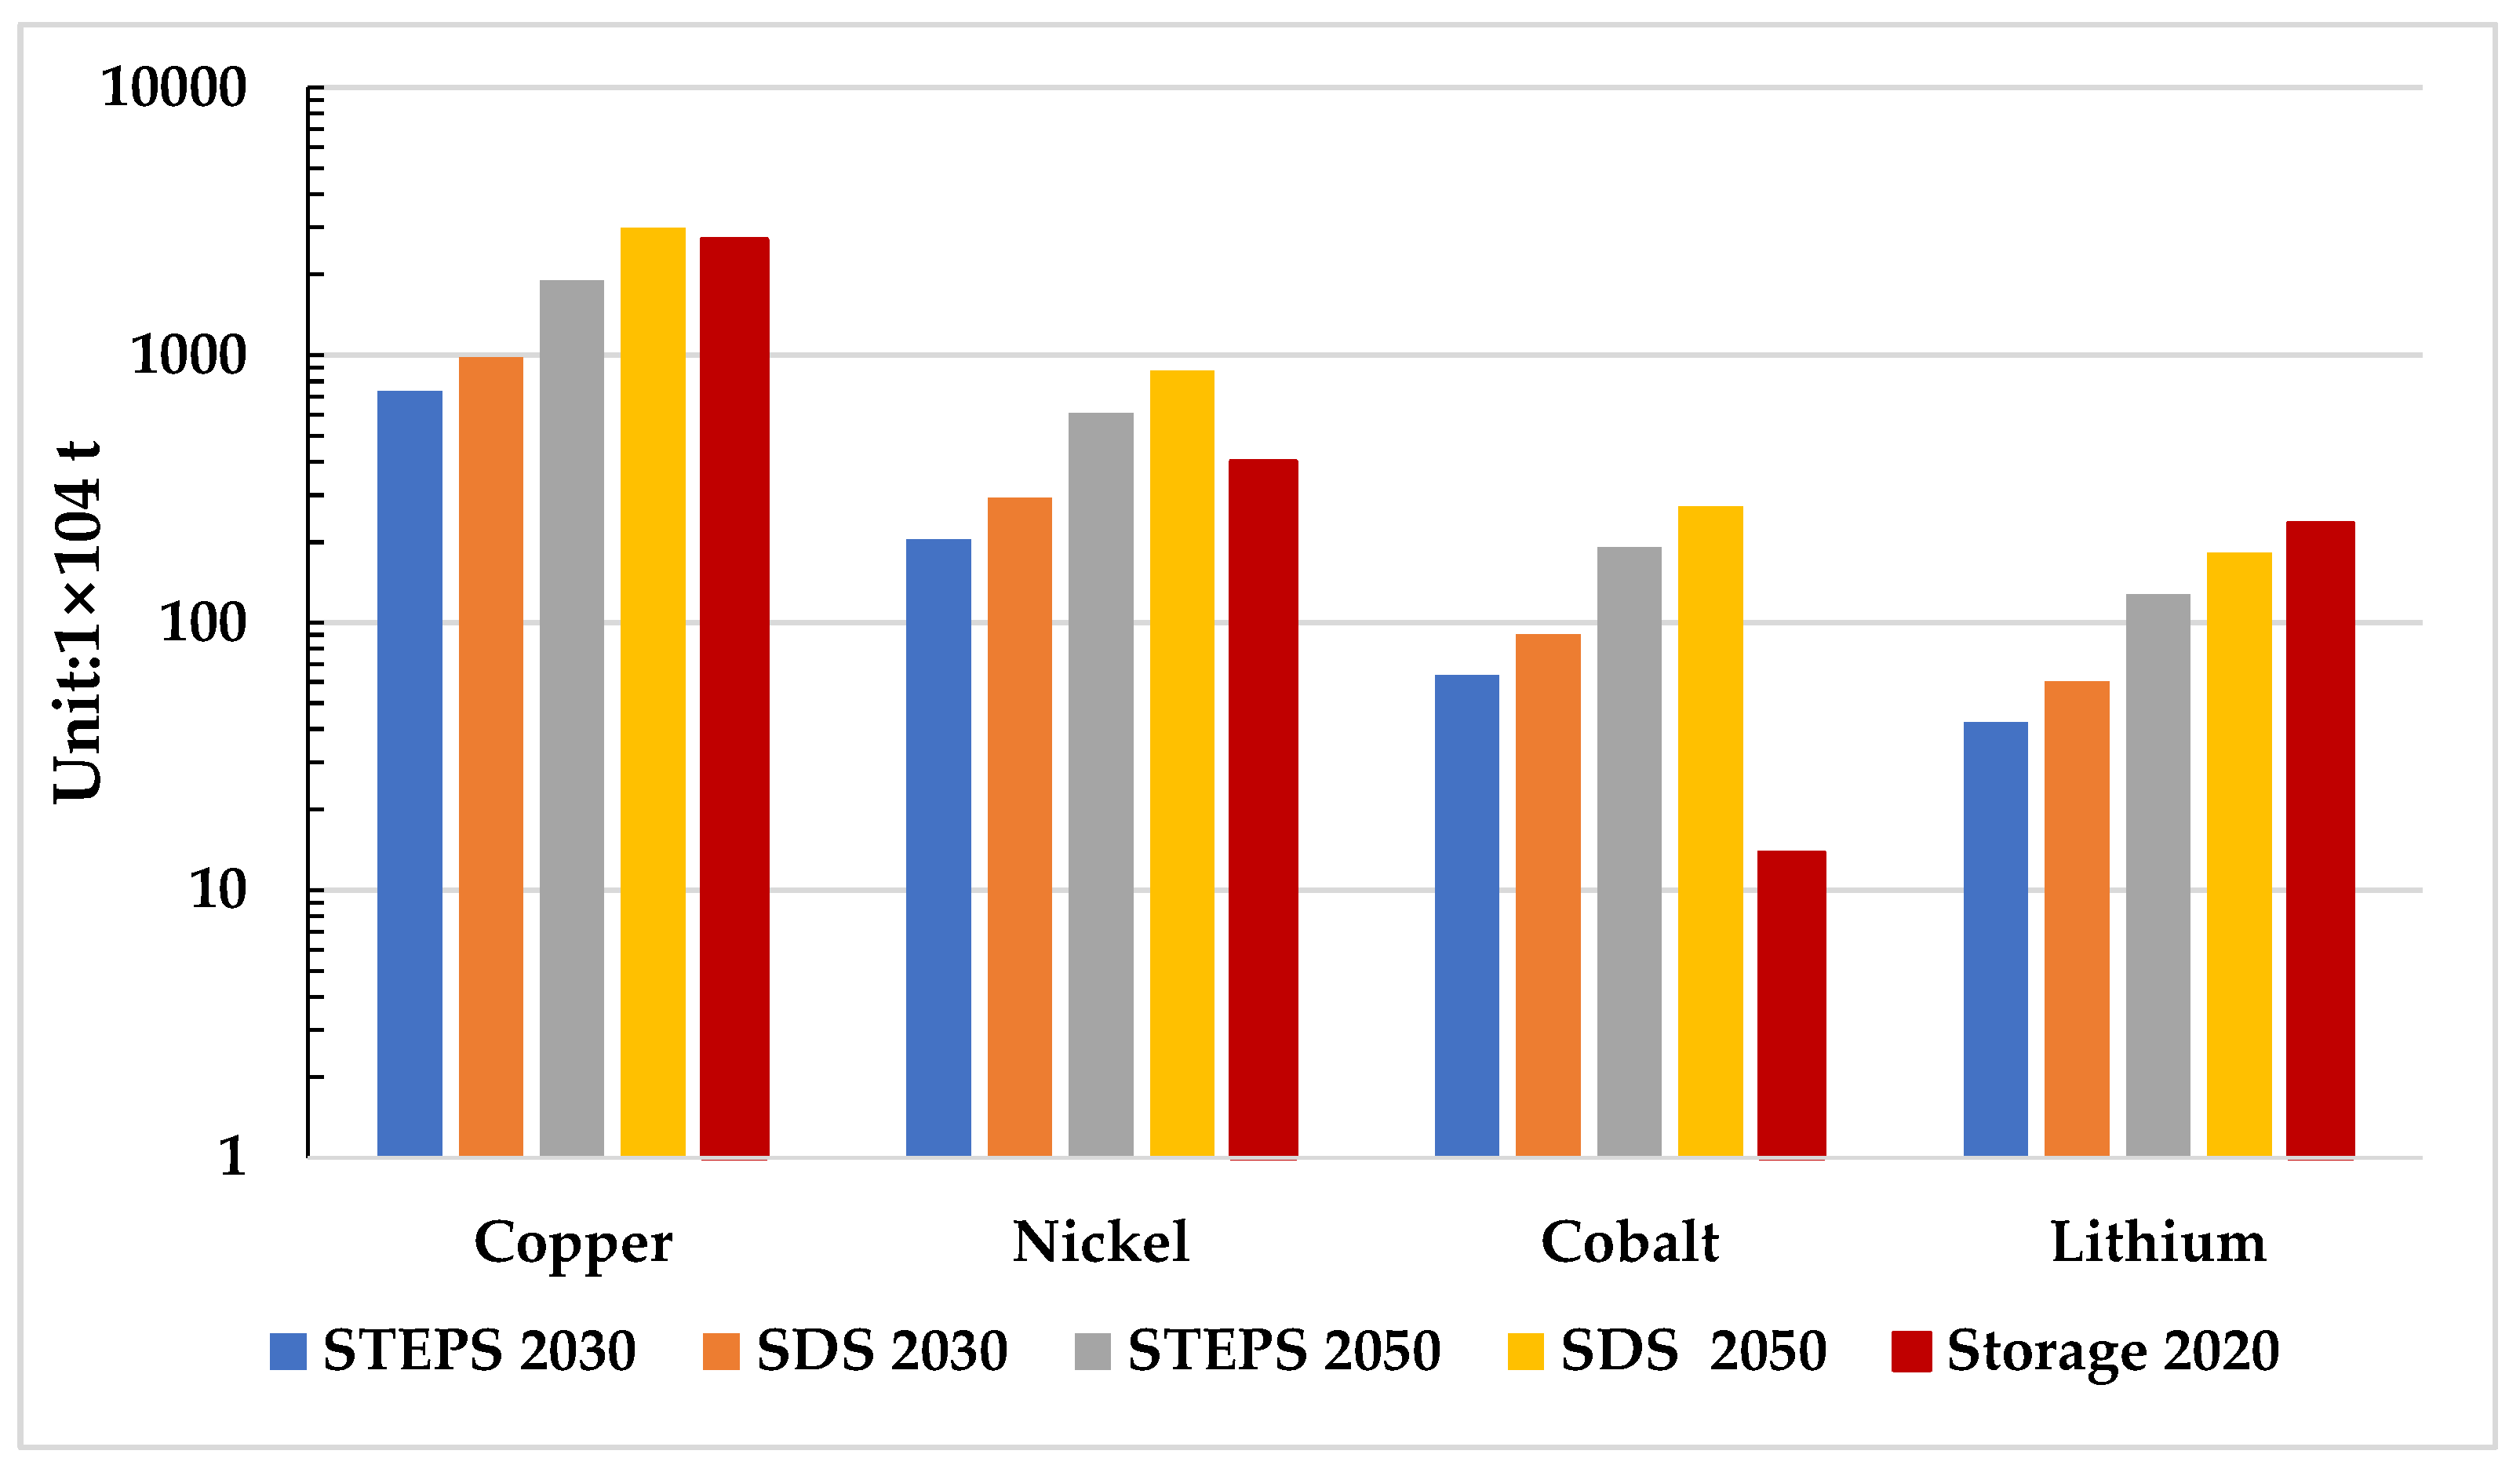
Figure 5 shows China’s mineral resource demand for clean energy technologies and the mineral resource reserves in 2020, calculated by combining the mineral resource consumption under different scenarios for each industry noted above. Without considering the mineral resource consumption for technology improvement and export, the mineral resource demand in the SDS is higher than in the STEPS. The primary reason for this is that under the SDS, China has stricter requirements for carbon emissions from energy projects and must accelerate the construction of clean energy projects to achieve the desired goals. According to Figure 5, we predict a shortage of and a gap in mineral resources in the future clean energy development process by comparing the mineral resource demand of clean energy projects in 2020–2030 and 2020–2050 with China’s current mineral resource reserves.
By comparing the gap between China’s demand for mineral resources for clean energy technologies in 2020–2030 and 2020–2050 in different scenarios and mineral resource reserves in 2020, we find that the future expectations of the demand for some mineral resources are close to or exceed current domestic reserves (Figure 5). Figure 3 and Figure 4 show that the lithium demand by 2050 exceeds 50% of the current reserves in both scenarios due to its use in electric vehicles, with 77.5% in the SDS. Clean energy technology consumption by 2050 for copper in the SDS exceeds the current mineral reserves and nickel consumption exceeds current reserves in both scenarios. The demand for nickel by 2050 is 1.52 times the current reserves in the STEPS and 2.18 times in the SDS. Furthermore, although the consumption of individual minerals is low in terms of quantity, such minerals are scarce resources in China because of the geographical distribution and other reasons; therefore, the security of supplying these minerals should be emphasised. China’s demand for cobalt ore in 2020–2030 already far exceeds the current reserves in both scenarios, whereas, by 2050, the STEPS and the SDS will reach a staggering 14 times and 20 times of reserves in 2020, respectively.
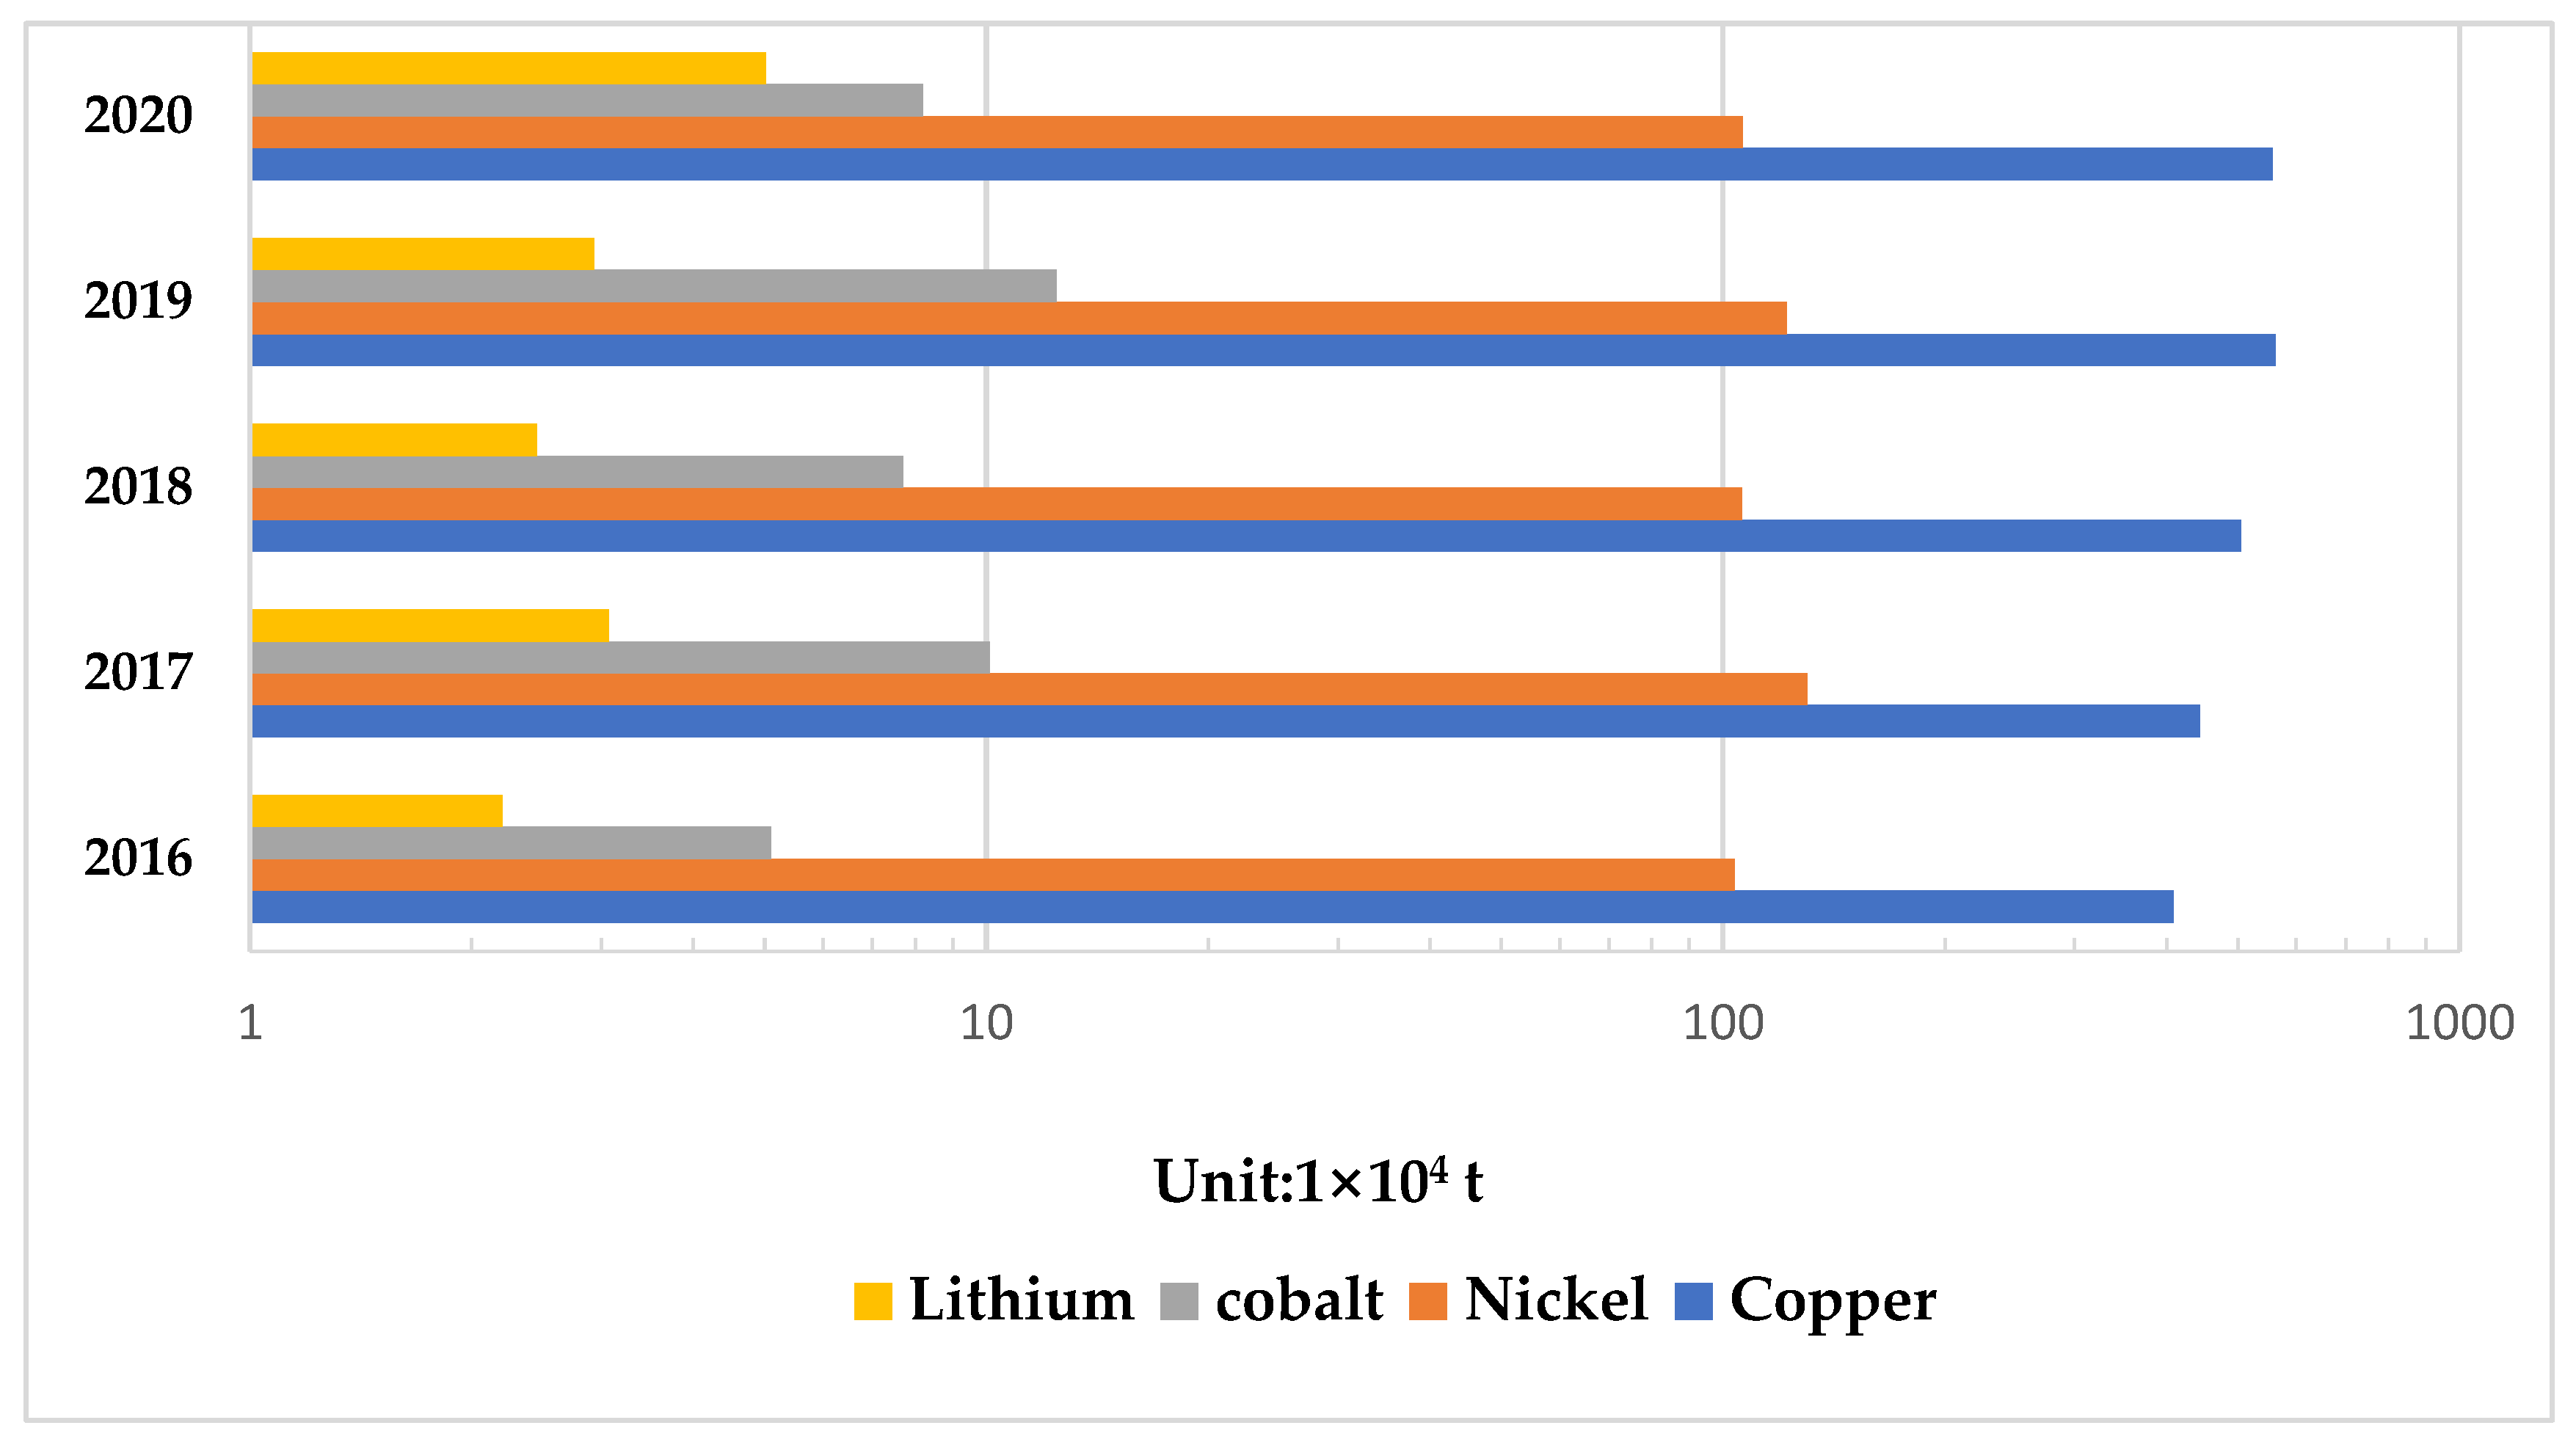
In the previous section, we highlighted that China’s overseas import demand for some rare local minerals would increase with the promotion of energy transition. The overseas supply security of mineral resources will become crucial in developing clean energy in the future. By comparing the overseas imports of these four minerals over 2016–2020 (Figure 6), we find that with the development of clean energy technology, the annual overseas imports of copper, nickel, cobalt, and lithium are not enough for domestic supply in clean energy technology in the future but show a stable upward trend. According to China’s customs data, China’s overseas import sources of mineral resources are relatively stable. The overseas dependence on copper is approximately 78%, primarily imported from Chile, Peru, and Mexico, and the import volume of these three countries accounts for approximately 68% of the total import volume. The overseas dependence on nickel is 92%, of which more than 90% of imports come from the Philippines and Indonesia in Southeast Asia.
China’s cobalt resources are scarce, and the overseas dependence on cobalt has been high. Furthermore, 97% of cobalt consumption relies on imports, and the import sources are highly concentrated, with 99% coming from the DRC. China primarily imports lithium concentrates from Australia (95%). Regardless of the impact of the global pandemic in 2020, the security of the import source countries of various minerals and the import channels are unstable. However, the mineral import volume in 2020 was not heavily affected and is at the same level as in 2019. It is expected that under the impetus of carbon peaking and the carbon neutrality target, the overseas import volume of China’s mineral resources will increase steadily in the future as the new crown pandemic stabilises and the import routes gradually resume smoothly.
All this time, China has been developing and using existing minerals while also actively exploring new mining sites. From China’s proven resource reserves in 2016–2020 (Table 10), the overall trend of copper, nickel, cobalt, and lithium is stable and slightly increasing. From the current data, China’s overseas imports of mineral resources and the current domestic identified mineral reserves are stable. However, due to mineral resources’ non-renewable characteristics and the urgent need for energy transformation, the gradual depletion of mineral resources is still an irreversible trend.

4.4. Mineral Material Recycling Technology

In the face of growing resource supply problems and long-term dependence on overseas imports, mineral recycling has aroused the attention of governments and manufacturers worldwide as a technology that can reduce resource consumption and improve the environment. Recycling is a way to reduce the demand for primary raw materials by generating the so-called secondary materials flows [17]. The development of clean energy technologies in China is still in its infancy, and China started to build clean energy generation facilities on a large scale only within the last decade. As a result, research and technology for mineral recycling in the power sector are quite limited. It is worth noting that China is currently the only market with significant power battery recycling infrastructure [38]. The average lifespan for light-duty vehicles is 15 years, whereas the average lifespan used for medium- and heavy-duty vehicles is 10 years [39,40]. The supply of recycled materials only represents a small portion of total battery material demand in the short term, but has the potential to represent over 50% of future cobalt [41]. As a major automobile manufacturing country, China has been committed to the development of electric vehicles. The future in power battery recycling standards will also be at a high world level. Retired power batteries usually have a residual capacity of more than 70% of the initial capacity and a set lifetime [
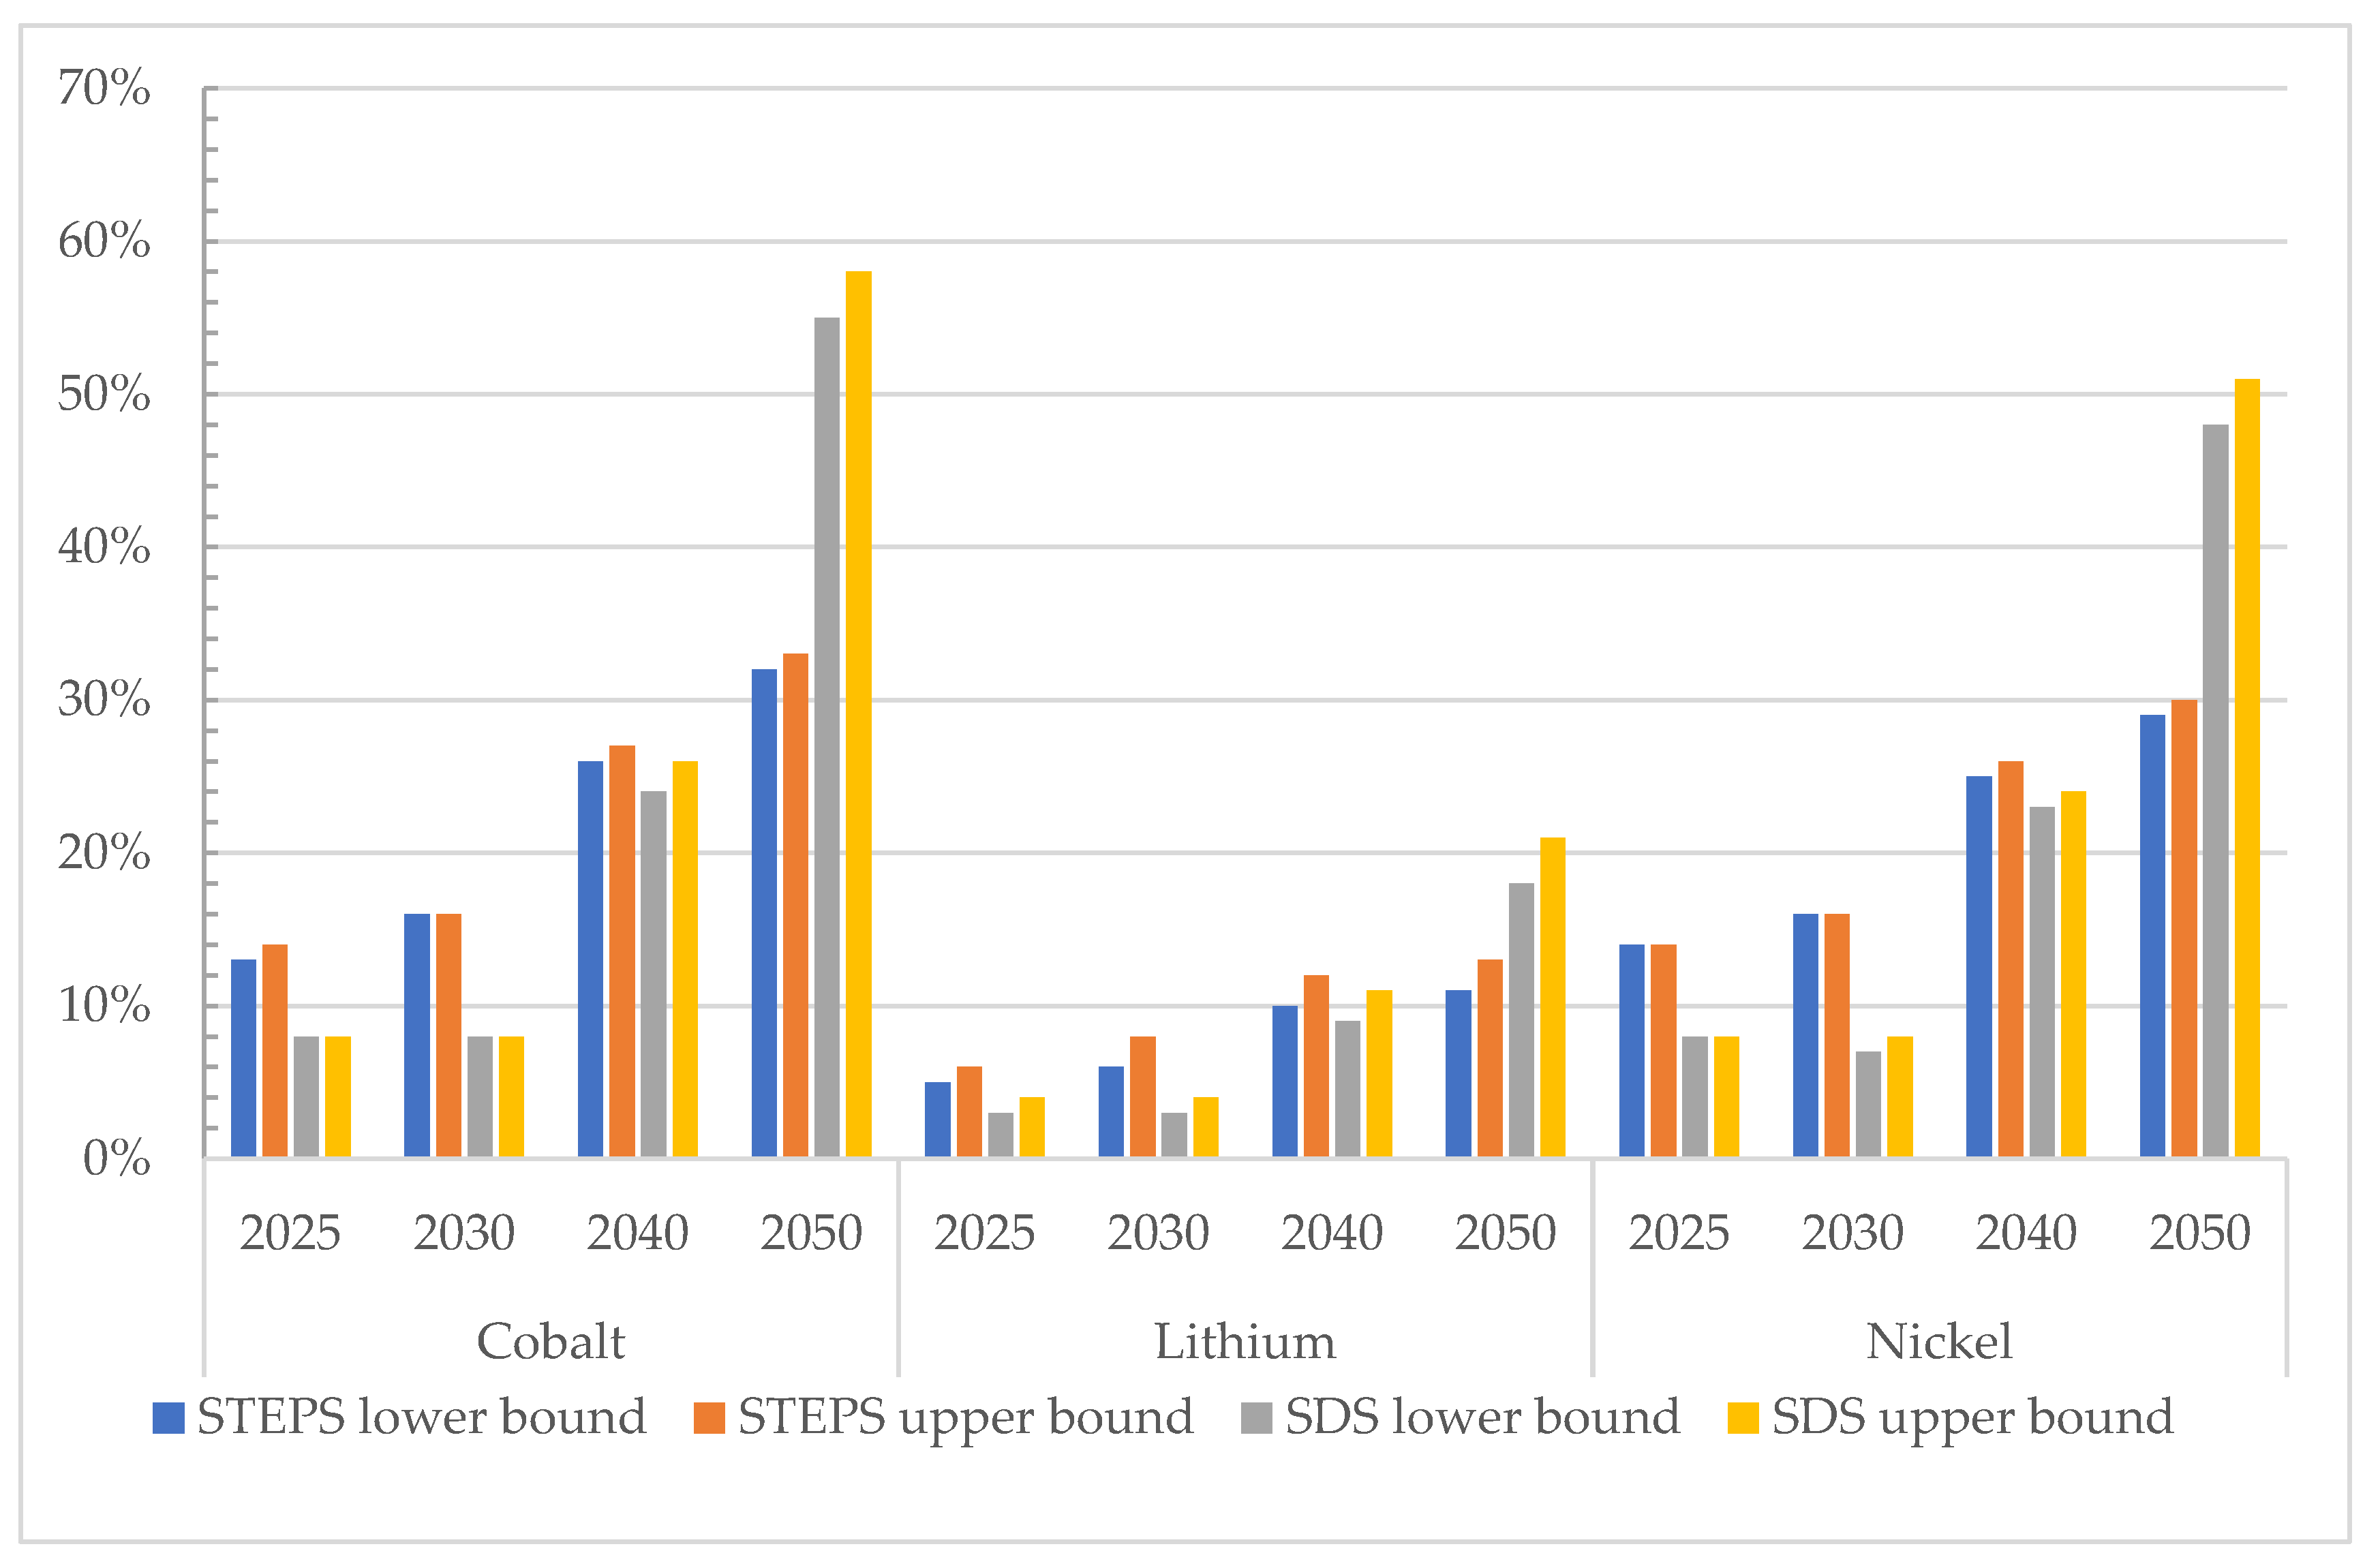
42]. Referring to the recycling content of the United States under two scenarios, the recycled content of power batteries in China from 2020 to 2050 is shown in Figure 7. A lower future mineral demand for the SDS will result in a higher recycling content than in the STEPS. In 2050, the recycling content for cobalt will be increased to 55%−58% and for nickel increased to 48−51%, which means about half of the materials used in power battery production will come from secondary materials. However, due to the current industry recovery analysis, the power battery recovery industry is not optimistic [42]. Globally, the recycling rates of lithium are close to zero due to its abundancy and low cost. Although lithium is highly recyclable, there is currently no economic driver for this. As of now, the government and manufacturers are not paying full attention to this emerging technology. Information barriers between government, manufacturers, and consumers regarding recycling technology and willingness to recycle are also affecting the implementation of recycling technology [42]. In the longer term, it is expected that recycling will become the major source of mineral supplies, assuring supply stability and preventing price fluctuations due to geopolitical or other factors, which will affect the supply of clean energy technology facilities [17].

4.5. Disadvantages and Limitations of the Study

In this study, we make an average assumption about the composition of different types of facilities for various technologies, and differences in the composition of materials in different types of facilities are not taken into consideration. Referring to the methodology in this paper, the biggest obstacle we have encountered is the dynamic nature of data. Within the policies introduced by the government regarding the clean energy sector, the extraction and import of minerals are constantly being updated and changed, which may lead to some deviation from the future supply situation.
The impacts of emerging technologies such as solid-state and increased nuclear power generation are not included in this analysis. We are conducting an analysis of future demand for clean energy based on technological developments and energy targets in the current scenario, and this supply and demand situation will need to be reconsidered if there are significant policy changes or major technological advances in the future. Therefore, the demand for mineral resources from clean energy technologies will alleviate in the future. For example, solid-state batteries that are currently under development would drastically decrease the demand for mineral materials, therefore the current demand would decrease [43]. Additionally, the supply of mineral resources is a dynamic concept that will fluctuate with the discovery of new mineral deposits and the growth of future demand. Over time, more accurate data and improvements in methodology may therefore improve the accuracy of the results.

5. Summary and Conclusions

Mineral resources are crucial to clean energy development, and each clean energy technology requires numerous mineral resources. In the current situation of unstable overseas supply security and limited domestic supply development and utilization, obtaining a stable and sufficient mineral resource supply chain to sustain the development of clean energy technology and not letting mineral resources become a constraint to energy transition is a critical energy problem for China. Therefore, we used scenario analyses to study the demand for mineral resources in the clean energy sector over the next three decades (2020–2050) in the SDS and STEPS. Furthermore, we analysed the supply and demand gap in the clean energy sector’s future demand for mineral resources.
This study showed that China’s future supply of mineral resources would severely constrain clean energy development due to the close relationship between mineral resources and clean energy technologies. We have come to the following conclusions based on the above analysis of mineral resource supply and future mineral resource demand projections.
(1)
China has more demand for clean energy technologies in the SDS, and its corresponding demand for mineral resources would be greater than in the STEPS.
(2)
In the next 30 years (2020–2050), the clean energy industry’s rapid development will cause the supply of copper, nickel, cobalt, and lithium minerals to fall into crisis.
(3)
In the future, the overseas dependence on China’s mineral resources and overseas imports will increase.
(4)
Mineral materials recycling will contribute to reducing mineral resources demand and overseas dependence on clean energy technologies.
In response to the above findings, we propose the following to optimise the mineral resource supply in energy development.
1. With the development of clean energy technologies, the demand for mineral resources has surged. As a major consumer of mineral resources with a high dependence on mineral resources overseas, China should invest overseas in crucial minerals, such as lithium, nickel, and copper, which are scarce and will increase in demand in the future, to ensure stability and security of overseas resource supplies.
2. China should widen import channels and establish mineral import cooperation with different countries. China’s mineral resource import sources are concentrated. The global pandemic intensified geopolitical conflicts, and simple import channels could cause a significant gap in China’s mineral resource supplies. Simultaneously, a simple import channel will provide more convenience for the importing source countries in the pricing of the mineral resource import and export trade, which is negative for the stability of mineral resource prices and will affect the clean energy industry’s cost price and the realisation of China’s social development goals.
3. Because China is a large consumer and producer of mineral resources, it should optimise its mineral industry’s structure and improve the quality of mineral products. China has a significant advantage in the endowment of REEs and other mineral resources, but there is still a large gap between China and developed countries regarding mineral product exploitation and use. Methods to optimise the country’s mineral industry’s structure, improve the quality of minerals, and enhance the use of mineral resources are worth further exploration and development.
4. Facing the surge in demand for mineral resources from energy transition, increasing its overseas investments, and stabilising import channels, China should increase its mineral resource exploration to elevate its mineral resource guarantee capacity.
5. China should seek recovery and replacement channels for critical minerals. Mineral resources are non-renewable, and excessive demand and dependence on a specific mineral product will accelerate resource depletion and destroy the energy environment. Encouraging the effective recycling of critical mineral resources after the product ends its service life can improve the secondary use of mineral resources and ease the supply pressure. Therefore, China should actively seek resources that can be substituted for each other in the consumables of mineral resources in the clean energy industry to spread the demand for mineral resources and avoid the rapid depletion of mineral resources.

Author Contributions

Conceptualisation, X.L., L.P. and J.Y.; data cleaning, X.L.; investigation, X.L. and J.Y.; methodology, X.L. and L.P.; software, X.L.; validation, X.L. and L.P.; writing—original draft preparation, X.L.; writing—review and editing, X.L. and L.P.; supervision, L.P.; funding acquisition, L.P. All authors have read and agreed to the published version of the manuscript.

Funding

This research was funded by the Science and Technology Commission of Shanghai Municipality (Grant No. 21692105000) and National Natural Science Foundation of China (Program No. 71704110).

Institutional Review Board Statement

Not applicable.

Informed Consent Statement

Not applicable.

Data Availability Statement

The data presented in this study are available upon request from the authors.

Conflicts of Interest

The authors declare no conflict of interest.

Abbreviations

Carbon capture, utilization and storageCCUS
carbon dioxideCO2
coronavirus disease 2019COVID-19
concentrating solar powerCSP
the Democratic Republic of the CongoDRC
GigawattGW
International Energy AgencyIEA
carbon dioxideCO2
carbon dioxideCO2
kilo wattKW
million tonsMT
platinum group metalsPGMs
PhotovoltaicsPV
rare earth elementsREE
the sustainable development scenario SDS
the stated policy scenarioSTEPS
United StateUS
World Energy OutlookWEO

References

  1. Thanh, H.V.; Lee, K. Application of Machine Learning to Predict CO2 Trapping Performance in Deep Saline Aquifers. Energy 2022, 239, 122457. [Google Scholar] [CrossRef]
  2. AlRassas, A.M.; Thanh, H.V.; Ren, S.; Sun, R.; Hai, N.L.N.; Kang-Kun, L. Integrated Static Modeling and Dynamic Simulation Framework for CO2 Storage Capacity in Upper Qishn Clastics, S1A Reservoir, Yemen. Geomech. Geophys. GeoEnerg. GeoResour. 2022, 8, 2. [Google Scholar] [CrossRef]
  3. Alalimi, A.; AlRassas, A.M.; Thanh, H.V.; Al-qaness, M.A.A.; Pan, L.; Ashraf, U.; AL-Alimi, D.; Moharam, S. Developing the Efficiency-modeling Framework to Explore the Potential of CO2 Storage Capacity of S3 Reservoir, Tahe Oilfeld, China. Geomech. Geophys. GeoEnerg. GeoResour. 2022, 8, 128. [Google Scholar] [CrossRef]
  4. Zhou, Y.; Li, J.; Wang, G.; Chen, S.; Xing, W.; Li, T. Assessing the Short-to Medium-Term Supply Risks of Clean Energy Minerals for China. J. Clean. Prod. 2019, 215, 217–225. [Google Scholar] [CrossRef]
  5. IEA. The Role of Critical World Energy Outlook Special Report Minerals in Clean Energy Transitions; IEA: Paris, France, 2021. [Google Scholar]
  6. Xing, J.; Chen, Q.; Zhang, Y.; Long, T.; Zheng, G.; Wang, K. Outlook for Demand for Lithium, Cobalt, Nickel and Other Mineral Resources under the Development of Clean Energy Vehicles. China Min. 2019, 12, 67–71. [Google Scholar]
  7. Vikström, H. Risk or Opportunity? The Extractive Industries’ Response to Critical Metals in Renewable Energy Technologies, 1980–2014. Extr. Ind. Soc. 2020, 7, 20–28. [Google Scholar] [CrossRef]
  8. Liu, S. Lithium Resources Supply, Demand and Future Trends in 2018. Geol. China 2019, 46, 1580–1582. [Google Scholar]
  9. Wang, H.; Ma, B.; Jia, L.; Yu, Y.; Hu, J.; Wang, W. The Role, Supply and Demand of Critical Minerals in the Clean Energy Transition under Carbon Neutrality Targets and Their Recommendations. Geol. China 2021, 48, 1720–1733. [Google Scholar] [CrossRef]
  10. MJ. Miner’s Right: The Supercycle Isn’t Dead; MJ: New York, NY, USA, 2013. [Google Scholar]
  11. Calvo, G.; Valero, A. Strategic Mineral Resources: Availability and Future Estimations for the Renewable Energy Sector. Environ. Dev. 2022, 41, 100640. [Google Scholar] [CrossRef]
  12. Sherwani, A.F.; Usmani, J.A. Varun Life Cycle Assessment of Solar PV Based Electricity Generation Systems: A Review. Renew. Sustain. Energy Rev. 2010, 14, 540–544. [Google Scholar] [CrossRef]
  13. Graedel, T.E. On the Future Availability of the Energy Metals. Annu. Rev. Mater. Res. 2011, 41, 323–335. [Google Scholar] [CrossRef]
  14. Valero, A.; Valero, A.; Calvo, G.; Ortego, A.; Ascaso, S.; Palacios, J. Global Material Requirements for the Energy Transition. An Exergy Flow Analysis of Decarbonisation Pathways. Energy 2018, 159, 1175–1184. [Google Scholar] [CrossRef]
  15. Habib, K.; Wenzel, H. Reviewing Resource Criticality Assessment from a Dynamic and Technology Specific Perspective—Using the Case of Direct-Drive Wind Turbines. J. Clean. Prod. 2016, 112, 3852–3863. [Google Scholar] [CrossRef]
  16. Candelise, C.; Spiers, J.F.; Gross, R.J.K. Materials Availability for Thin Film (TF) PV Technologies Development: A Real Concern? Renew. Sustain. Energy Rev. 2011, 15, 4972–4981. [Google Scholar] [CrossRef]
  17. Darina, B.; Patrícia, A.D.; Alain, M.; Claudiu, P. Assessment of Potential Bottlenecks along the Materials Supply Chain for the Future Deployment of Low-Carbon Energy and Transport Technologies in the EU Wind Power, Photovoltaic and Electric Vehicles Technologies, Time Frame: 2015–2030; European Commission: Nyon, Switzerland, 2016; Available online: https://setis.ec.europa.eu/assessment-potenial-bottlenecks-along-materials-supply-chain-future-deployment-low-carbon-energy_en (accessed on 1 September 2022).
  18. Nuss, P.; Ohno, H.; Chen, W.; Graedel, T.E. Comparative Analysis of Metals Use in the United States Economy. Resour. Conserv. Recycl. 2019, 145, 448–456. [Google Scholar] [CrossRef]
  19. Nguyen, R.T.; Fishman, T.; Zhao, F.; Imholte, D.D.; Graedel, T.E. Analyzing Critical Material Demand: A Revised Approach. Sci. Total Environ. 2018, 630, 1143–1148. [Google Scholar] [CrossRef]
  20. Harper, E.M.; Kavlak, G.; Burmeister, L.; Eckelman, M.J. Criticality of the Geological Zinc, Tin, and Lead Family. J. Ind. Ecol. 2015, 19, 628–644. [Google Scholar] [CrossRef]
  21. Tokimatsu, K.; Höök, M.; McLellan, B.; Wachtmeister, H.; Murakami, S.; Yasuoka, R.; Nishio, M. Energy Modeling Approach to the Global Energy-Mineral Nexus: Exploring Metal Requirements and the Well-below 2 °C Target with 100 Percent Renewable Energy. Appl. Energy 2018, 225, 1158–1175. [Google Scholar] [CrossRef]
  22. Hu, A. China’s Target to Reach the Peak Carbon Dioxide Emissions by 2030 and the Main Ways to Achieve It. J. Beijing Univ. Technol. 2021, 21, 1–15. [Google Scholar]
  23. Su, J.; Liang, N.; Ding, L.; Zhang, G.; Liu, H. Review of China’s Energy Development Strategy Under the Carbon Neutrality. Bull. Chin. Acad. Sci. 2021, 36, 1001–1009. [Google Scholar] [CrossRef]
  24. Wu, Y.; Li, Y.; Chen, Q.; Zhang, Y. An Analysis of the Security Situation of China’s Overseas Mineral Resources Supply. China Min. 2016, 25, 6-9+25. [Google Scholar]
  25. Ji, G.; Zhang, H.; Li, Q.; Xia, H. Current Status of Rare Earth Mineral Resources in China and Its Countermeasures for Sustainable Development. China Min. 2018, 27, 9–16. [Google Scholar]
  26. Xu, D.; Zhu, Y. Review and Outlook on the Security of Key Mineral Resources in the Process of Energy Transition. Resour. Ind. 2020, 22, 1–11. [Google Scholar] [CrossRef]
  27. Ministry of Natural Resources. China Mineral Resources 2021; Ministry of Natural Resources: Beijing, China, 2021. Available online: http://www.mnr.gov.cn/sj/sjfw/kc_19263/zgkcybg/202111/t20211105_2701985.html (accessed on 12 March 2022).
  28. Liu, M. The Revelation of Soaring Nickel Prices: New Energy Mineral Prices and Supply Risks Must Be Guarded Against; China Energy news: Beijing, China, 2022; Available online: http://www.cnenergynews.cn/guonei/2022/03/12/detail_20220312119322.html (accessed on 13 March 2022).
  29. Chinese General Administration of Customs Online Query of Customs Statistics. Available online: tjs.customs.gov.cn (accessed on 15 April 2022).
  30. Qiang, H.; Gao, B.; Guo, D.; Wang, X. Special Design Options for Sustainable Development of Mining Industry under the Background of Carbon Neutrality. Nat. Resour. Econ. China 2021, 4–11. [Google Scholar] [CrossRef]
  31. Ministry of Industry and Information Technology. Clean Energy Vehicle Industry Development Plan (2021–2035); Ministry of Industry and Information Technology: Beijing, China, 2020. Available online: https://www.miit.gov.cn/jgsj/yhs/zlygh/art/2022/art_158cc63ebe76470cbff2458c4328ea22.html (accessed on 13 March 2022).
  32. Månberger, A.; Stenqvist, B. Global Metal Flows in the Renewable Energy Transition: Exploring the Effects of Substitutes, Technological Mix and Development. Energy Policy 2018, 119, 226–241. [Google Scholar] [CrossRef]
  33. IEA. World Energy Outlook 2020; IEA: Paris, France, 2020; Available online: http://www.iea.org /reports/world-energy-outlook2020 (accessed on 1 February 2022).
  34. IEA. Global EV Data Explorer. Available online: http://www.iea.org/articles/global-ev-data-explorer (accessed on 1 February 2022).
  35. IEA. Minerals Used in Electric Cars Compared to Conventional Cars; IEA: Paris, France; Available online: https://www.iea.org/data-and-statistic/charts/mineral-used-in-electric-cars-compared-to-conventional-cars (accessed on 1 February 2022).
  36. IEA. World Energy Outlook 2021; IEA: Paris, France, 2021; Available online: http://www.iea.org /reports/world-energy-outlook2021 (accessed on 1 February 2022).
  37. IEA. Minerals Used in Clean Energy Technologies Compared to Other Power Generation Sources; IEA: Paris, France; Available online: https://www.iea.org/data-and-statistics/charts/minerals-used-in-clean-energy-technologies-compared-to-the-other-power-generation-sources (accessed on 1 February 2022).
  38. Dunn, J.; Kendall, A.; Slattery, M. Electric Vehicle Lithium-Ion Battery Recycled Content Standards for the US—Targets, Costs, and Environmental Impacts. Resour. Conserv. Recycl. 2022, 185, 106488. [Google Scholar] [CrossRef]
  39. Statista Average Age of U.S. Light and Heavy Trucks in Operation in 2015. Available online: https://www.statista.com/statistics/185216/age-of-us-light-trucks (accessed on 1 September 2022).
  40. Staff, B. Average Lifespan for U.S. Vehicles. Available online: https://berla.co/average-us-vehicle-lifespan (accessed on 1 September 2022).
  41. Dunn, J.; Slattery, M.; Kendall, A.; Ambrose, H.; Shen, S. Circularity of Lithium-ion Battery Materials in Electric Vehicles. Environ. Sci. Technol. 2021, 55, 5189–5198. [Google Scholar] [CrossRef]
  42. Gao, Y.; Liu, Y.; Tan, Z.; Li, Z. Analysis of Cooperation Equilibrium of Participants in Power Battery Recycling Chains Considering Information Barrier. Chin. J. Popul. Resour. Environ. 2022, 20, 159–167. [Google Scholar] [CrossRef]
  43. Watanabe, T.; Inafune, Y.; Tanaka, M.; Mochizuki, Y.; Matsumoto, F. Development of All-Solid-State Battery Based on Lithium-ion Conductive Polymer Nanofiber Framework. Power Sources 2019, 423, 255–262. [Google Scholar] [CrossRef]
Figure 1. Potential constraints in the development of clean energy.
Energies 15 07029 g001
Figure 2. Research framework.
Energies 15 07029 g002
Figure 3. Clean energy technology mineral resource demand under different scenarios (1).
Energies 15 07029 g003
Figure 4. Clean energy technology mineral resource demand under different scenarios (2).
Energies 15 07029 g004
Figure 5. Total mineral resource demand and currency reserves in the clean energy sector under different scenarios (Data Source: [27]).
Energies 15 07029 g005
Figure 6. China’s overseas imports of mineral resources in 2016–2020 (Data Source: [29]).
Energies 15 07029 g006
Figure 7. Recycled context projections under the SDS scenario and the STEPS scenario (Data Source: [38]).
Energies 15 07029 g007
Table 1. The role of primary minerals in clean energy (Data Source: [5]).
High ImportanceModerate ImportanceLow Importance
Solar PVCopper, AluminiumNoneCobalt, Nickel, Lithium, REEs, Chromium, Zinc, PGMs
WindCopper, Nickel, REEs, ZincChromium, AluminiumCobalt, Lithium, PGMs
HydroNickelCopper, Chromium, Zinc, AluminiumCobalt, Lithium, REEs, PGMs
CSPNickel, Chromium, AluminiumCopper, ZincCobalt, Lithium, REEs, PGMs
BioenergyCopper, NickelZinc, PGMs, AluminiumCobalt, Lithium, REEs, Chromium,
GeothermalNickel, Chromium, Zinc, AluminiumNoneCopper, Cobalt, Lithium, REEs, PGMs
NuclearZinc, AluminiumCopper, Nickel, Chromium,Cobalt, Lithium, REEs, PGMs
Electricity networksCopper, Chromium, Zinc, AluminiumNoneCobalt, Nickel, Lithium, REEs, PGMs
EVs and battery storageCopper, Cobalt, Nickel, Lithium, REEs, Chromium, Zinc, AluminiumNonePGMs
HydrogenNickel, Chromium, Zinc, PGMsREEs, AluminiumCopper, Cobalt, Lithium
Notes: The relative importance of minerals for specific clean energy technologies. CSP = concentrating solar power; PGMs = platinum group metals.
Table 2. Selected mineral reserves in China in 2020 (unit: MT) (Data Source: [27]).
MineralsStorageProportion of Global Reserves
Copper27.013%
Nickel4.003.15%
Manganese212.967%
Cobalt0.141.95%
Chromium2.770.5%
Zinc30.9517.6%
Rare earth44.0038%
Silica limestone51.4910%
Graphite52.3216.7%
Lithium2.342.7%
Table 3. Proportion of China’s primary mineral resource import sources in 2020 (Data Source: [29]).
Primary Importing CountrySecondary Importing CountryThird Importing Country
Phosphate rockMorocco (99%)Not statistically availableNot statistically available
Cobalt MineCongo (99%)Not statistically availableNot statistically available
Lithium ConcentrateAustralia (95%)Not statistically availableNot statistically available
Chrome MineSouth Africa (82%)Turkey (4%)Zimbabwe (4%)
Nickel MinePhilippines (82%)Indonesia (9%)New Caledonia (7%)
Iron MineAustralia (63%)Brazil (20%)South Africa (4%)
Aluminium MineGuinea (47%)Australia (20%)Indonesia (17%)
Manganese MineSouth Africa (44%)Australia (33%)Gabon (15%)
Silica sandMalaysia (42%)Australia (17%)Indonesia (19%)
Tungstem MineVietnam (36%)North Korea (26%)Myanmar (14%)
Copper MineChile (35%)Peru (22%)Mexico (8%)
GraphiteMadagascar (30%)America (14%)Not statistically available
Lead MineRussia (22%)Peru (17%)America (11%)
Table 4. Electric vehicle stock projection for 2020–2050 under different scenarios (Unit:1 × 10⁴) (Data Source: [34]).
ScenarioSTEPSSDS
TypeBEVPHEVFCEVBEVPHEVFCEV
2020351.299.60.5351.299.60.5
20251516.1520.52.72101.9726.21.2
20303857.11348.319.75435.51744.772.6
205010868.93845.758.115604.15034.9216.8
Table 5. Mineral resource consumption in the electric vehicle industry (Unit: kg/vehicle) (Data Source: [35]).
CopperLithiumNickelManganeseCobaltGraphiteZincRare Earth
53.28.939.924.513.366.30.10.5
Table 6. Electricity generation from clean energy technologies in China under different scenarios (Data Source: [36]).
Scenario Stated Policy ScenarioSustainable Development Scenario
Year 20202030205020302050
Offshore WindTWh1547113165922118
Onshore WindTWh456942131611842118
Solar PVTWh2701304314015235286
Table 7. New installed capacity of clean energy power generation technology and electric vehicle stock in China (Data Source: [34]).
Scenario Stated Policy ScenarioSustainable Development Scenario
Year 20202030205020302050
Offshore WindGW9234559297900
Onshore WindGW271216559341900
Solar PVGW25181218519903538
Electric VehicleMillion4.5147.7414.3268.0220.41
Table 8. Clean energy generation technology mineral resource consumption (Unit: t/GW) (Data Source: [37]).
TechnologiesCopperNickelManganeseChromiumMolybdenumZincRare EarthSilicon
Offshore wind800024079052510955002390
Onshore wind2900404780470995500140
Solar PV282210003003948
Table 9. Cumulative installed capacity of clean energy generation technologies and electric vehicle stock (Data Source: [34]).
Scenario Stated Policy ScenarioSustainable Development Scenario
Year 20202030205020302050
Offshore WindGW9234559297900
Onshore WindGW271216559341900
Solar PVGW25181218519903538
Electric Vehicle1 × 104451477414,322680220,406
Table 10. Proven resource reserves of China’s mineral resources in 2016–2020 (Unit: MT) (Data Source: [27]).
YearCopperNickelCobaltLithium
2016101.1111.180.679.61
2017106.0811.180.699.67
2018114.4311.880.7010.92
2019111.6510.760.7111.66
2020112.5111.250.7212.44
Publisher’s Note: MDPI stays neutral with regard to jurisdictional claims in published maps and institutional affiliations.

