Abstract
The current work aims to study the thermal degradation of the flame retardant polyurethane aerogel (FR_PU_aerogel) through multiple milligram-scale experimental methods. A systemic methodology for measuring the reaction kinetics and thermodynamics of the thermal degradation of FR_PU_aerogel is detailed. Specifically, the thermogravimetric analysis (TGA) and differential scanning calorimetry (DSC) were performed simultaneously in inert atmosphere to measure the mass loss and heat flow data, and a numerical framework called ThermaKin2Ds was used to inversely model these experimental data. First, a reaction mechanism with six first-order consecutive reactions was developed based on the inverse analysis of the TGA data. The corresponding reaction kinetics were optimized using the hill climbing optimization algorithm. Subsequently, the heat capacities of each condensed phase component and the heat of the reactions were obtained through inversely modeling the heat flow data. Furthermore, the heat of the complete combustion of each gaseous component were derived based on the heat release rates measured in the milligram-scale combustion calorimeter (MCC) experiments. It is noted that the developed reaction mechanism was further validated against the mass loss data obtained at different heating rates. The parameters determined in this work serve as a core subset of inputs for the pyrolysis model development, which is essential for the quantitative understanding of the ignition and the combustion behavior of solid materials.
1. Introduction
The energy crisis is a global issue and carbon neutrality would be the ultimate solution to this crisis [1,2]. It was reported that the energy consumption of buildings accounts for 38% of the total global energy related CO2 emissions in 2019 [3,4]. The insulation materials applied in buildings improve the energy efficiency and thus greatly contribute to energy conservation. Polyurethane and polystyrene foams [5,6,7] are the typical insulation materials in buildings due to their excellent thermal performance (low thermal conductivity). Recently, aerogel, a highly dispersed solid material with a nanoporous network structure, has gained increasing attention as an effective building insulation material [8] due to its extremely low thermal conductivity and light weight [9]. Compared to the inorganic aerogels, the polymer-based organic aerogels have an advantage of a high mechanical strength [10,11]. However, due to the inherent flammability of polymers, it is critical to investigate the fire hazard of polymer-based organic aerogels.
Chang et al. [12] prepared silica aerogel/polyurethane (PU) composites using the co-precursor method, and characterized its thermal and combustion properties. It found that the composites demonstrated a higher thermal stability, greater residual yields, lower total heat, and lower smoke release than the pure flexible PU foam. Nazeran et al. [13] synthesized silica aerogel/RPU nano insulation materials which had extremely low thermal conductivity and good hydrophobicity. Guo et al. [14] fabricated polyvinyl alcohol (PVA) composite aerogels with hydroxyapatite (HAP) through the freeze-drying method based on the organic-inorganic composite technology, and the mechanism property, thermal property, and fire resistance of the composite aerogels were investigated. Nabipour et al. [15] aimed to improve the flame retardancy of PVA hybrid aerogels by adding zeolitic imidazolate framework-8 into the PVA aerogels. The synthesized composite aerogels had an increased limiting oxygen index (LOI) of 4.5% and achieved a V-0 rating in the UL-94 vertical burning test. It was found that its limiting oxygen index (LOI) increased to 24% and the self-extinguishing behavior was observed in the UL-94 vertical burning test. Huang et al. [16] synthesized a cellulose composite aerogel by incorporating a phosphorus-containing flame retardant modifying additive into the aerogel substrate, and concluded that the thermal stability and flame retardant performance of the composite aerogels were enhanced significantly.
As we can see, the various polymer-based aerogels have been developed and their corresponding thermal performance, mechanical behavior, and flame retardancy have been investigated experimentally. To the author’s knowledge, very limited work has been conducted on modeling the thermal decomposition and fire behavior of these materials. It is known that such models are able to effectively quantify the fire hazard of solids. The kinetics and thermodynamics of the condensed phase thermal decomposition processes are the key inputs of these models that enable the quantification of material flammability.
The characterization of material flammability frequently relied on a thermogravimetric analysis (TGA) experiment [17,18,19] and these are the most common technique used in such measurements. A milligram-size sample and relatively slow heating rates were adopted in these experiments, and thus the heat and mass transport inside the sample was assumed to be negligible. Our [20,21,22,23,24] group has developed a methodology that added differential scanning calorimetry (DSC) and a microscale combustion calorimeter (MCC) to better quantify the thermal decomposition behavior of solids. This approach was able to yield not only the reaction rates describing the solid gasification, but also the heat capacity of each condensed phase component, the heat of each reaction, and the heat of combustion of each gasified product through inverse modeling. These parameters determined from the inverse modeling of TGA/DSC/MCC provide the foundation for quantifying the flame resistance of a material.
In this study, this methodology was applied to characterize the thermal decomposition of the flame retardant polyurethane aerogel (FR_PU_aerogel, SLENTITE®, Osnabrück, Germany), a newly-developed high-performance insulating material by BASF (Aerogel-it) [25,26]. To the best of our knowledge, the thermal degradation for the FR_PU_aerogel has not been studied yet. First, a milligram-scale TGA and DSC experiments were conducted, and a numerical framework, ThermaKin2Ds [17,21,27], was adopted to inversely analyze these experimental results to obtain the reaction mechanism along with the reaction kinetics and thermodynamics (i.e., activation energy, Arrhenius parameter, heat capacity, and heat of reaction). Second, the HRR and total heat release (THR) of the FR_PU_aerogel in a gas phase were obtained by the MCC experiments to determine the heat of combustion of the gaseous decomposition products. The TGA experiments at different heating rates were also performed to validate the accuracy of the developed reaction mechanism.
2. Materials and Experimental Methods
2.1. Materials and the Sample Preparation
The commercial name of the FR_PU_aerogel is SLENTITE® (a polyurethane aerogel insulating panel) [25]. It was provided by Aerogel-it, originally developed by the Aerogel-it founders at BASF. It was typically produced as 550 mm × 360 mm × 15 mm sized panels. The thermal conductivity of SLENTITE® is 0.018 W m−1 K−1. Prior to its use, the sample was cut, the mass of the rectangular sample was weighed by the SARTORIUS analytical balance six times, and the density of the FR_PU_aerogel was calculated as 109.2 kg m−3. Subsequently, the FR_PU_aerogel was scraped into thin pieces with a pen knife to ensure no significant temperature gradient within the sample during the milligram-scale experiments. The processed samples are dried under drierite in an airtight chamber for at least 48 h.
2.2. Simultaneous Thermal Analysis Experiments (STA)
We used a Netzsch 449 F5 Jupiter STA for the thermal analysis in this study. A platinum rhodium crucible was selected to ensure a high sensitivity of the heat flow data. The crucible close to the operator is the sample crucible, and the one far away is the reference crucible (always empty). The temperature and sensitivity calibrations of the STA instrument were carried out every six months. The melting temperature of the standard samples were tested and compared with known values provided by Netzsch to complete the temperature calibration of the STA instrument. Similarly, the melting enthalpy of the standard samples were tested and compared with known values provided by Netzsch to complete the sensitivity calibration.
Purging nitrogen at a rate of 70 mL min−1 ensures an anaerobic environment of the thermal degradation for the FR_PU_aerogel. The TGA and DSC experiments were conducted simultaneously using the following heat program. The sample was heated from 323 K to 1073 K at a prescribed heating rate. The mass and heat flow data were collected during the line heating phase of the test. The 5–10 mg samples were initially weighed and placed into the crucible, which was then placed into the sample holder to obtain more accurate mass values by the balance of the STA instrument. A micro-size sample was taken to keep the overall temperature of the sample as consistent as possible during the experiment, and to follow the prescribed heating program instantaneously. It is worth mentioning that the sample crucible and the reference crucible on the sample holder should be placed in the same place as possible.
The STA tests of the FR_PU_aerogel were performed at 10 K min−1 in nitrogen and were repeated five times to ensure reproducibility [28]. Additional TGA experiments were carried out and repeated three times at a heating rate of 5 K min−1 and 20 K min−1 in nitrogen were used to verify that the developed ThermaKin2Ds model correctly predicts the behavior of the FR_PU_aerogel at different thermal conditions. Each material experiment was preceded by a baseline test. The baseline mass (in the case of the TGA) or heat flow history (in the case of DSC) was subtracted from the corresponding data obtained from the sample test, so as to minimize the surroundings disturbance. All of the TGA and DSC data presented in this work have been baseline corrected. The FR_PU_aerogel has a very low density. To ensure that the sample stayed inside the crucible, a platinum-rhodium lid was used in the TGA and DSC tests. The lid had a small orifice (0.25 mm in diameter) for ventilation. The DSC data with a lid were found to be more reproducible than using an open crucible.
Taking a data point every 1 K to obtain the data of each of the TGA and DSC tests. The final experimental data represent the average experimental data of the repeated experiments, and the average of every five adjacent data is taken to reduce the volatility of the overall data. The normalized mass and mass loss rate (MLR) curves as a function of the sample temperature were obtained from the TGA tests. The normalized heat flow and integral heat flow curves as a function of the sample temperature were obtained from the DSC tests.
2.3. Microscale Combustion Calorimeter Experiments (MCC)
The MCC that measures the heat release rates (HRR) from the complete combustion of the gasified products is shown in Figure 1. The MCC mainly consisted of a pyrolyzer and a gas phase combustor. Eighty mL min−1 nitrogen was purged to create an inert atmosphere in the pyrolysis chamber. Twenty mL min−1 oxygen was purged into the high temperature combustor. Approximately 5 mg of the FR_PU_aerogel was taken for all of the MCC tests at the set heating rate of 1 K s−1.
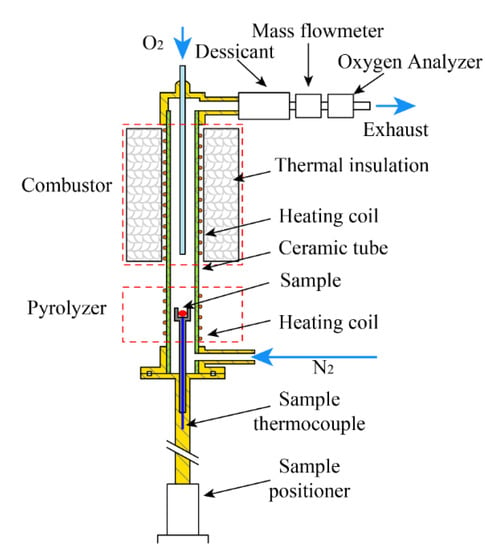
Figure 1.
Schematic of the apparatus of the Microscale Combustion Calorimeter [30].
With the rise of temperature, the FR_PU_aerogel was gradually pyrolyzed in the pyrolysis chamber to produce combustible gases. The gases were passed into the combustor to react with the excess oxygen to ensure a complete combustion. The combustor was heated to a constant temperature of 1173 K, which ensured the complete oxidation of the pyrolyzates. Finally, the HRR data of the FR_PU_aerogel could be calculated based on the oxgen consumption theory. The HRR was reported as a function of the solid sample temperature and time. In this study, the MCC experiments were repeated twice. Additional details of this instrument can be found in earlier pubilications [29].
3. Modeling
3.1. Numerical Framework
A comprehensive pyrolysis solver, ThermaKin2Ds [23,31], was employed to inversely analyze the TGA and DSC experiments and make predictions to obtain a parametric description of the kinetics and the thermodynamics of the polymer degradation. The ThermaKin2Ds solves mass and energy conservation equations describing a one-dimensional object subjected to external (convective and radiative) heat. The material of the object is represented by a mixture of components, which may interact chemically and physically. The components are assigned individual temperature-dependent properties and categorized as solids or gases. The key governing equations are given as Equations (1)–(7).
Equation (1) denotes the mass conservation for the j-th component in terms of the mass concentration of the component, (kg m−3). Equation (3) is the mass conservation account for the consumption or production of the j-th component due to the reactions occurring at a rate (in the absence of the second reactant, is set to 1), mass transport of the gaseous components (labeled with subscript g) defined by Equation (4) and the mass transport associated with the expansion and contraction of the material. The energy conservation in terms of temperature, T (K), defined by Equation (2). The conservation of the energy accounts for the heat flow due to the chemical reactions and the phase transitions (the rate given by Equation (3)) and the heat conduction within the condensed phase given by Equation (5). Equation (6) denotes that the conservation of energy also accounts for the absorption of the radiant energy from the external sources, and Equation (7) represents radiant heat losses from the sample to the environment. The convective heat transfer due to the gas transport and energy flow associated with the expansion and contraction of the decomposing sample. The sample expansion and contraction is only permitted in the x (axial) direction.
The symbols in Equations (1)–(7) are defined as follows: represents time, (kg m−3) is density, (J kg−1 K−1) denotes the heat capacity, (W m−1 K−1) denotes the thermal conductivity, (m2 kg−1) represents the absorption coefficient, represents the emissivity and (m2 s−1) is the gas transfer coefficient. Those thermo-physical properties without subscripts correspond to the property of a mixture and are calculated by taking into account either mass or volume fraction, of the individual components. denotes a stoichiometric coefficient, which is negative when component represents i-th reaction reactant and positive when it denotes this reaction’s product. (J kg−1) denotes the heat released or absorbed in each chemical reaction or phase transition. (s−1 for first order and m3 kg−1 s−1 for second order reactions) represents the Arrhenius pre-exponential factor for reaction , (J mol−1) denotes the activation energy for reaction and (J mol−1 K−1) represents the universal gas constant. (Kg m−2 s−1) and (Kg m−2 s−1) is the rate of mass transport of the gaseous products in the and directions, respectively. (W m−2) and (W m−2) is the heat conduction in the and directions, respectively. (W m−2) denotes the radiation flux from the external sources being absorbed by the sample and (W m−2) represents the radiant heat loss from the material to the environment. The superscript 0 in Equation (7) is the net external radiation flux through the material boundary; (W m−2 K−4) denotes the Stefan–Boltzmann constant. A more detailed explanation of the governing equations, as well as the methodology of numerical calculations, can be found in earlier publications [32,33].
3.2. Modeling Setup
The ThermaKin2Ds [32,33] is a numerical framework that was developed to compute the transient rate of the gaseous fuel production by a pyrolyzing solid. In the ThermaKin2Ds, each component used in this pyrolysis model is characterized by the density (), heat capacity (), gas transfer coefficient (), thermal conductivity (), emissivity () and absorption coefficient (). The properties of , , , and are defined by a polynomial of the temperature shown in Equation (8).
where , , , and are constant, and is a generic temperature-dependent property. The emissivity and absorption coefficients are defined by constants. The models were constructed assuming that the sample was thermally thin, because the TGA and DSC are milligram-scale tests. Under this assumption, the model does not need to take into account the thermal transport inside the sample. All of the components assumed in the model may react to produce some products. Generally, each reaction may have one or two reactants and 0–2 products, such as Equation (9).
where, is the stoichiometric number of the reaction and is the heat of reaction. The rate of reaction () taking place in a unit volume of material is defined by Equation (3). The Arrhenius pre-exponential factor and activation energy of each reaction are defined by Equations (10) and (11) [34,35].
where, is the peak value of mass loss rate, is the temperature at which the maximum of MLR, is the initial mass of the FR_PU_aerogel, is the gas constant, is the instantaneous heating rate. The ThermaKin2Ds was employed in this study to inversely analyze the milligram-scale experimental data (TGA, DSC, and MCC). The reaction kinetics and the thermodynamics of the thermal degradation were determined through this inverse analysis, as well as the heat of combustion of each gaseous decomposition product [28].
The object structure settings during the running of the ThermaKin2Ds simulation are as follows. The initial temperature of the ThermaKin2Ds model is the same as the initial temperature of the experiments, set as 323 K. The heating rate in the model is fitted by an exponentially decaying trigonometric function, as described in Section 4.2. The convective heat transfer coefficients at the element boundary was defined as sufficiently high (1 105 W m−2 K−1) in the ThermaKin2Ds model to ensure that the temperature of the element follows the corresponding mean experimental temperature profile. The mass flow boundary condition was defined such that all gaseous decomposition products escaped the element instantaneously. The flame and external radiation in the model are set to zero.
4. Results and Discussion
4.1. Inverse Modeling of the TGA Data for the FR_PU_aerogel
Figure 2 presents the mean mass data and the MLR data collected in the TGA tests conducted at a heating rate of 10 K min−1. These data were normalized by the initial mass of the sample. The error bars were calculated as two standard deviations of the mean, were also shown in the figure to demonstrate the uncertainties of the experimental data. The error bars in the mass loss data are difficult to discern because they are comparable in size to the data symbols.
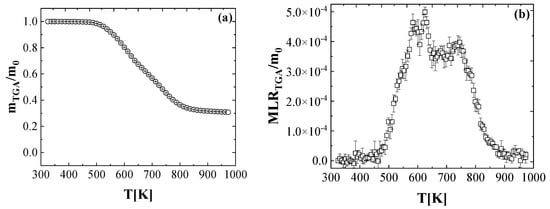
Figure 2.
Experimental (a) normalized total mass and (b) normalized mass loss rate as a function of the temperature, obtained at a heating rate of 10 K min−1 in nitrogen.
The TGA normalized mass data profile shows two main degradation stages. The first is from 533 K to 829 K, and the other is from 829 K to 924 K. The decomposition onset, defined as the temperature when 5 wt.% mass loss was consumed, was determined to be 533 K. Following 829 K, the MLR gradually decreased to 0. At the end of experiment, the residual yield was measured to be 29.8%.
Six consecutive first-order reactions (reaction 1: 460–511 K; reaction 2: 511–553 K; reaction 3: 553–605 K; reaction 4: 605–657 K, reaction 5: 657–701 K, reaction 6: 701–924 K) were required to fully capture the MLR curve. They are also shown as Equations (12)–(17). It is noted that reaction 1 was also included to allow the sufficient flexibility when modeling the DSC data. The additional details on this can be found in Section 4.2. The normalized mass loss curve was used to calculate the roughly stoichiometric coefficients (the yield of the condensed-phase intermediate, ) for the input parameters of the six consecutive first-order reactions in the ThermaKin2Ds model.
FR_PU_aerogel_int1 to int5 represented five intermediates in the composition process. The FR_PU_aerogel gas1 to the FR_PU_aerogel gas6 represented six gaseous products. The FR_PU_aerogel res represented the residual char produced. It is noted that the mass data shown in Figure 2a was used to provide the initial values of the stochiometric coefficients of each reaction. The Arrhenius pre-exponential factor and the activation energy for each reaction was calculated approximately, as shown in the Equations (10) and (11). The determined reaction kinetics were added as the input parameters of the model, and were continuously changed in small increments to achieve a better agreement between the experimental and modeling results. Here, the hill climbing optimization algorithm [36] was used for this optimization process. Equations (12)–(17) and Table 1 display the resulting reaction mechanism and the reaction kinetics. Note that the heat of the reactions are also shown in Table 1, which will be detailed in Section 4.2. The reaction mechanism was developed to mathematically capture the mass loss information using the minimum number of reactions. The key purpose was not to determine the actual chemical species generated during the FR_PU_aerogel degradation.

Table 1.
Reaction kinetic parameters of the FR_PU_aerogel thermal degradation. Here, a negative value in the heat of reaction (h) represents an endothermic process.
Figure 3 shows the comparison between the experimental and predicted TGA curves. It also includes the contributions of the individual reactions to the total MLR. As we can see, the overall mass loss profile was well captured. Additionally, the temperature and magnitudes of the MLR peaks were predicted reasonably well, within the experimental uncertainties.
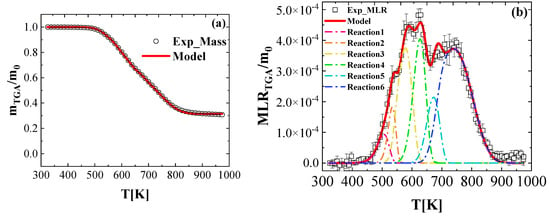
Figure 3.
Experimental and simulated (a) normalized total mass and (b) normalized mass loss rate as a function of temperature, obtained at a heating rate of 10 K min−1 in nitrogen.
4.2. Inverse Modeling of the DSC Data for the FR_PU_aerogel
Figure 4 shows the mean normalized heat flow and the integral heat flow data of five DSC experiments for the FR_PU_aerogel at a heating rate of 10 K min−1. The error bar calculation method is the same with the experiment. In this study, the positive values of the heat flow data represent the endothermic process. Within 373–481 K, the initial rise of the heat flow was caused by the heating rate not reaching the set value of the STA instantaneously, as discussed in this section. There are four distinct heat flow peaks in this curve (first: 481–553 K; second: 553–608 K; third: 608–664 K; fourth: 664–873 K). The two MLR peaks are included in the first and last heat flow peaks, respectively. The other two heat flow peaks correspond to one mass loss rate peak, respectively. All of the heat flow peaks are related to the thermal decomposition of the FR_PU_aerogel and its intermediate condensed-phase products.
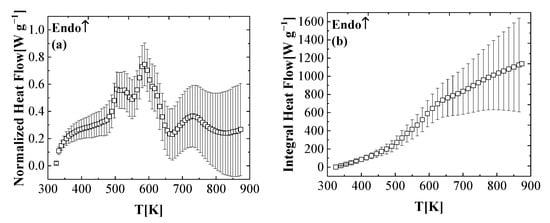
Figure 4.
Experimental DSC data collected in nitrogen at a heating rate of 10 K min−1 presented as (a) normalized heat flow and (b) integral heat flow.
The average normalized heat flow shown in Figure 4a can be represented using Equation (18). It consisted of two parts, the sensible heat of the component and the heat of the reaction. in the equation represents the instantaneous heating rate of the sample. Therefore, in order to reasonably reproduce the heat flow, itis important to fit the heating rate of the actual heating rate of the DSC tests [28,37,38].
The actual heating program in the test cannot reach the set heating rate immediately [37]. The heating rate increases to a higher rate and then gradually decreases to the set heating rate, so an exponential decaying trigonometric function (shown in Equation (19)) was used to fit the experimental heating program. First, the actual heating rate curve at 10 K min−1 was fitted using Equation (19). The same fitting exercise was performed for the data obtained at heating rates of 5 K min−1 and 20 K min−1. The fitting curves for each heating rate case (5 K min−1, 10 K min−1, and 20 K min−1) are shown in Figure 5. As we can see, the R-squared values of all three cases are above 0.97, which indicates a good agreement between the experimental and fitted curves. Parameters to are shown in Table 2. Note that the data at 60 K min−1 in Table 2 represent the fitting results for the actual MCC tests.
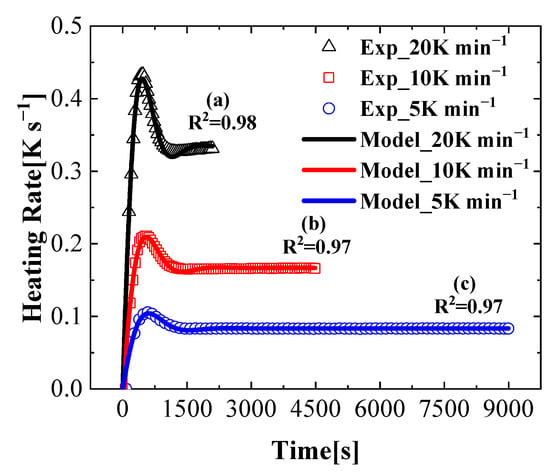
Figure 5.
Heating rate curve and fitting curve (a) (R2 = 0.98, 20 K min−1), (b) (R2 = 0.97, 10 K min−1) and (c) (R2 = 0.97, 5 K min−1).

Table 2.
Parameters of the exponentially decaying trig function.
The heat capacity of each condensed phase component in the model was obtained through the inverse modeling the DSC data. In detail, the DSC curve was normalized by the instantaneous heating rate in order to obtain the capacity of the FR_PU_aerogel as a function of sample temperature in the decomposition process. A linear fit is used for processes (325–440 K) without the thermal decomposition to obtain the capacity of the FR_PU_aerogel (= −529 + 4.6 T). The heat capacity of the final residue was assumed to be the same as the average heat capacity of the residues produced by the thermal decomposition of the multiple common polymers, 1700 J kg−1 K−1 [17]. The heat capacities of the intermediate condensed phase components (FR_PU_aerogel int3 to FR_PU_aerogel int5) were assumed to be equal to the averaged heat capacity of the molten FR_PU_aerogel and the final residue. The heat capacities of the first two intermediates (FR_PU_aerogel int1 and FR_PU_aerogel int2) were assumed to be equal to those fitted by the FR_PU_aerogel. All of the heat capacities of the condensed phase components are listed in Table 3.

Table 3.
Heat capacities of the condensed phase components.
These capacities are used to compute a sensible heat flow baseline, HFbase. In the calculation process, the (heat of the reactions) of six reactions of the ThermaKin2Ds are set to zero to ensure that the baseline results from the heat capacity of the material itself. This baseline is calculated as a function of the sample temperature, as shown in Equation (20).
is the initial mass of the sample, and is the mass of j-th component as a function of the sample temperature. represents the heat capacity of j-th component as a function of the solid sample temperature. This baseline is plotted together with the experimental normalized heat flow of the DSC tests in Figure 6.
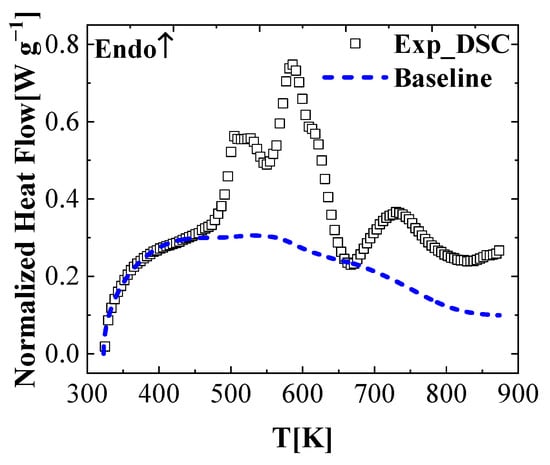
Figure 6.
Heat flow baseline calculated for the FR_PU_aerogel using Equation (20).
Subsequently, the heat of the reaction of each first-order reaction in the model was initially set to zero, and the heat flow baseline was obtained in the ThermaKin2Ds model. The heat of the reaction of each first-order reaction in the model was obtained by integrating the difference between the normalized heat flow curve of the DSC tests and the baseline curve. The total heat flow is subtracted from the heat flow baseline, and the subsequent integration of the difference in the thermal decomposition region to obtain the heat of the reaction for the six reactions in the ThermaKin2Ds model, respectively. Note that, the heat of the reaction was manually and repeatedly estimated due to the overlapping heat flow peaks.
Using all of the reaction mechanisms, kinetics, heat capacities of the condensed phase components, and the heat of the reactions, the experimental DSC data can be reproduced. A comparison of the experimental normalized heat flow history and modeling results obtained from the ThermaKin2Ds simulations is shown in Figure 7a. Overall, a good agreement was achieved except for the underestimation of the final part (larger than 790 K). It is noted that at a high temperature, the heat flow sensitivity of the instrument is not very high, which can be seen from the large fluctuations of the experimental data in Figure 7. The parameterized reaction mechanism was further verified by comparing the ThermaKin2Ds calculated heat flow with the heat flow data of the DSC experiments. The experimental DSC data and the simulated data are integrated by time, and plotted as a function of the sample temperature in Figure 7b. The experimental and simulated heat flow integrals match very well.
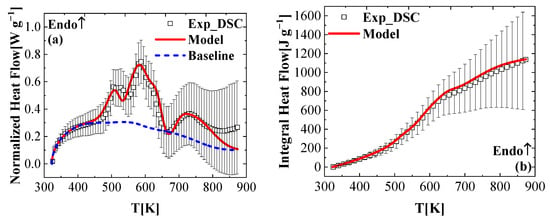
Figure 7.
Experimental and simulated (a) normalized heat flows and (b) integral heat flow as a function of the temperature, obtained at a heating rate of 10 K min−1 in nitrogen.
4.3. Inverse Modeling of the MCC Data for the FR_PU_aerogel
The mean experimental normalized heat release rate (HRR) and the total heat release (THR) data obtained for the FR_PU_aerogel are presented as a function of the sample temperature in Figure 8. The heat of the complete combustion, , of the gaseous components defined in the reaction mechanism (summarized in Table 4) were determined through the inverse analysis of the HRR and THR data. Specifically, the MLR data can be obtained by the TGA tests, so the heat of the combustion of the FR_PU_aerogel was calculated by the relationship between the MLR and HRR by Equation (21).
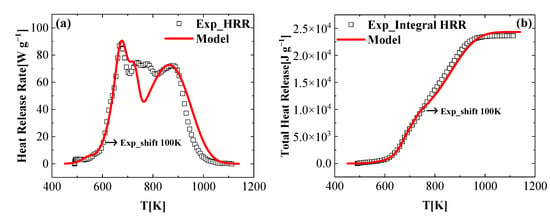
Figure 8.
Experimental and simulated (a) heat release rate and (b) total heat release as a function of the temperature, obtained at a heating rate of 60 K min−1.

Table 4.
Heat of the combustion of the gaseous decomposition products.
Note that due to the sample temperature deviations from that measured by the MCC sensor, the MCC experimental curves were corrected and shifted to a higher temperature region (completely moved 100 K, to the right) to match the simulation results using the developed reaction mechanism in Section 4.1, as shown in Figure 8. Initially, the same was applied to each gaseous product to generate the HRR curve. Subsequently, of each gaseous product was adjusted to better capture the experimental HRR profile. This iterative process continued until the differences between the modeled and experimental data satisfied the specific criteria. The criteria [38] was defined as the HRR maxima were predicted within 10% accuracy, the temperatures of the HRR maxima were predicted within 10 K, and the final integral HRR values were predicted within 10%. The modeling results captured the initial rise and peaks of the HRR profile. The experimental final THR was also well reproduced by the simulation. Note that there was a discrepancy of the HRR profile at a temperature range of 726 K to 813 K. Considering the relatively complex reaction mechanism and the relatively high heating rates used in the MCC tests, the simulated results agreed with the experimental data, reasonably. The result of the heat of the combustion that satisfy these criteria are given in Table 4. The final simulated MCC results are shown in Figure 8.
4.4. Model Performance at the Different Heating Rates
The reaction mechanism shown in Equations (12)–(17) and the corresponding parameters reported in Table 3 was developed using the TGA data collected at the nominal heating rate of 10 K min−1. To further quantify the generality of the developed reaction model and the reaction kinetic parameters, they were used to simulate the TGA experiments conducted at a lower heating rate of 5 K min−1 and at a higher heating rate of 20 K min−1.
Figure 9a shows the mean mass loss data of the FR_PU_aerogel obtained at a heating rate of 5 K min−1. The residue yield of the TGA test at 5 K min−1 was 30.6%. The highest MLR normalized by the initial mass reached at 612 K with a value of 0.000286 s−1. The comparison of the modeling and experimental results found that the thermal decomposition onset and the residue yield were predicted as well. It is noted that the simulated results between 750–850 K were slightly shifted to the lower temperature region, compared to the experimental data. This may be explained by the fact that the reaction mechanism is relatively complex and there is some overlap between these six reactions.
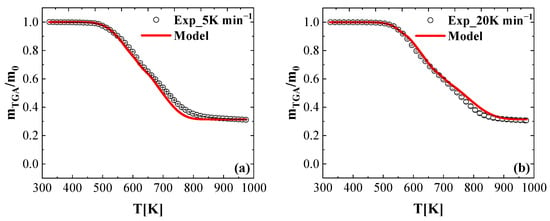
Figure 9.
Experimental and simulated TGA data collected in nitrogen at a heating rate of (a) 5 K min−1 and (b) 20 K min−1 presented as normalized total mass.
Figure 9b shows the mean mass loss data of the FR_PU_aerogel obtained at a heating rate of 20 K min−1. The yield of the residual char is stable at 30.2%. The TGA test was simulated by changing the heating rate in the ThermaKin2Ds model, and the resulting normalized mass curve is shown in Figure 9b. The comparison of the modeling and experimental results found that the thermal decomposition onset and the residue yield are in good agreement with the experimental data. It is noted that the simulated results between 750–850 K were slightly shifted to the higher temperature region compared to the experimental data. This may be explained by the fact that the reaction mechanism is relatively complex and there is some overlap between these six reactions.
5. Conclusions
A methodology for the measurement of the reaction kinetics and thermodynamics of thermal decomposition was applied to the FR_PU_aerogel. This methodology utilizes the TGA, DSC, and MCC, and inversely analyzes the corresponding results. The reaction kinetics and thermodynamics were determined and a six consecutive first-order reaction mechanism was developed to capture the TGA and DSC data of the FR_PU_aerogel. It is noted that the actual experimental heating rates were adopted in the model to better resolve the heat capacities of the condensed-phase components. The developed model was able to reproduce the mass loss data at different heating rates with a high degree of accuracy. It is noted that while the individual chemical species were not explicitly resolved in the model, this model did quantify the key aspects of the thermal degradation process that was related to the combustion behavior of the studied materials.
Additionally, based on the established reaction mechanism, the heat of the complete combustion of each gaseous product was determined by the inverse modeling of the HRR and THR results. The overall HRR and THR profiles were well captured except for a discrepancy in the HRR data at 726 K to 813 K. This work provides a core sub-set of parameters that are essential for the pyrolysis model development. Future work will fucus on gram-scale experiments, such as the experimental platform building of CAPA-Ⅱ [39,40,41,42], to further calculate the thermal transport properties, and to develop the condensed phase pyrolysis model.
Author Contributions
Conceptualization, X.W., Y.D., Z.C., C.T., X.R., H.H. and Q.F.; Data curation, X.W. and C.T.; Funding acquisition, H.H. and Q.F.; Investigation, Z.C. and C.T.; Methodology, Y.D., Z.C., X.R. and H.H.; Software, X.W., Y.D., Z.C., C.T. and X.R.; Supervision, X.R., H.H. and Q.F.; Writing – original draft, X.W.; Writing – review & editing, Y.D. and Q.F. All authors have read and agreed to the published version of the manuscript.
Funding
This research was supported by the Opening Fund of State Key Laboratory of Coal Combustion (No. FSKLCCA2207), and the “CUG Scholar” scientific Research Funds at China University of Geosciences (Wuhan) (Project No. 2020088).
Data Availability Statement
Data available on request due to restrictions eg privacy or ethical.
Conflicts of Interest
The authors declare no conflict of interest.
Nomenclature
| Symbols | |
| Time [s] | |
| Heat capacity [J kg−1 K−1] | |
| heat of combustion | |
| Thermal conductivity [W m−1 K−1] | |
| Mass [kg] (m0 is the initial sample mass) | |
| Arbitrary property (see Equation (8)) | |
| Heat flux due to radiation, thermal conduction or convection [W m−2] | |
| Reaction rate [kg m−3 s−1] | |
| Axial direction [m] | |
| Radial direction [m] | |
| Arrhenius pre-exponential factor [s−1] | |
| Activation energy [J mol−1] | |
| Radiant flux [W m−2] | |
| Mass flux [kg m−2 s−1] | |
| Number of components | |
| Number of reactions | |
| Universal gas constant [J mol−1 K−1] | |
| Temperature [K] | |
| Stoichiometric mass coefficient | |
| Mass concentration [kg m−3] | |
| Mass transport coefficient [m2 s−1] | |
| Absorption coefficient [m2 kg−1] | |
| Emissivity | |
| Density [kg m−3] | |
| Stefan-Boltzmann constant [W m−2 K−4] | |
| Subscripts | |
| Radiation from external sources | |
| Maximum mass loss rate or temperature at which the maximum occurs | |
| Re-radiation from sample material | |
| Radial direction | |
| Superscripts | |
| Net radiation | |
| Exponent for last term in Equation (8) | |
References
- Yang, S.; Yang, D.; Shi, W.; Deng, C.; Chen, C.; Feng, S. Global evaluation of carbon neutrality and peak carbon dioxide emissions: Current challenges and future outlook. Environ. Sci. Pollut. Res. 2022, 1–20. [Google Scholar] [CrossRef] [PubMed]
- Wang, Y.; Guo, C.; Chen, X.; Jia, L.; Guo, X.; Chen, R.; Zhang, M.; Chen, Z.; Wang, H. Carbon peak and carbon neutrality in China: Goals, implementation path and prospects. China Geol. 2021, 4, 720–746. [Google Scholar] [CrossRef]
- Hamilton, I.; Rapf, O.E. 2020 Global Status Report for Buildings and Construction: Towards a Zero-Emissions, Efficient and Resilient Buildings and Contruction Sector; The Global Alliance for Buildings and Construction: Nairobi, Kenya, 2020; pp. 1–7. [Google Scholar]
- Schiavoni, S.; D’Alessandro, F.; Bianchi, F.; Asdrubali, F. Insulation materials for the building sector: A review and comparative analysis. Renew. Sustain. Energy Rev. 2016, 62, 988–1011. [Google Scholar] [CrossRef]
- Datsyuk, V.; Trotsenko, S.; Peikert, K.; Höflich, K.; Wedel, N.; Allar, C.; Sick, T.; Deinhart, V.; Reich, S.; Krcmar, W. Polystyrene nanofibers for nonwoven porous building insulation materials. Eng. Rep. 2019, 1, e12037. [Google Scholar] [CrossRef]
- Yu, J.; Yang, C.; Tian, L.; Liao, D. A study on optimum insulation thicknesses of external walls in hot summer and cold winter zone of China. Appl. Energy 2009, 86, 2520–2529. [Google Scholar] [CrossRef]
- Lefebvre, J.; Bastin, B.; le Bras, M.; Duquesne, S.; Ritter, C.; Paleja, R.; Poutch, F. Flame spread of flexible polyurethane foam: Comprehensive study. Polym. Test. 2004, 23, 281–290. [Google Scholar] [CrossRef]
- Baetens, R.; Jelle, B.P.; Gustavsen, A. Aerogel insulation for building applications: A state-of-the-art review. Energy Build. 2011, 43, 761–769. [Google Scholar] [CrossRef]
- Liu, Z.H.; Ding, Y.D.; Wang, F.; Deng, Z.P. Thermal insulation material based on SiO2 aerogel. Constr. Build. Mater. 2016, 122, 548–555. [Google Scholar] [CrossRef]
- Jia, G.; Li, Z.; Liu, P.; Jing, Q. Preparation and characterization of aerogel/expanded perlite composite as building thermal insulation material. J. Non. Cryst. Solids 2018, 482, 192–202. [Google Scholar] [CrossRef]
- Maleki, H.; Durães, L.; Portugal, A. An overview on silica aerogels synthesis and different mechanical reinforcing strategies. J. Non. Cryst. Solids 2014, 385, 55–74. [Google Scholar] [CrossRef]
- Chang, K.J.; Wang, Y.Z.; Peng, K.C.; Tsai, H.S.; Chen, J.R.; Huang, C.T.; Ho, K.S.; Lien, W.F. Preparation of silica aerogel/polyurethane composites for the application of thermal insulation. J. Polym. Res. 2014, 21, 338. [Google Scholar] [CrossRef]
- Nazeran, N.; Moghaddas, J. Synthesis and characterization of silica aerogel reinforced rigid polyurethane foam for thermal insulation application. J. Non. Cryst. Solids 2017, 461, 1–11. [Google Scholar] [CrossRef]
- Guo, W.; Liu, J.; Zhang, P.; Song, L.; Wang, X.; Hu, Y. Multi-functional hydroxyapatite/polyvinyl alcohol composite aerogels with self-cleaning, superior fire resistance and low thermal conductivity. Compos. Sci. Technol. 2018, 158, 128–136. [Google Scholar] [CrossRef]
- Nabipour, H.; Nie, S.; Wang, X.; Song, L.; Hu, Y. Zeolitic imidazolate framework-8/polyvinyl alcohol hybrid aerogels with excellent flame retardancy. Compos. Part A Appl. Sci. Manuf. 2020, 129, 105720. [Google Scholar] [CrossRef]
- Huang, J.; Wang, X.; Guo, W.; Niu, H.; Song, L.; Hu, Y. Eco-friendly thermally insulating cellulose aerogels with exceptional flame retardancy, mechanical property and thermal stability. J. Taiwan Inst. Chem. Eng. 2022, 131, 104159. [Google Scholar] [CrossRef]
- Li, J.; Stoliarov, S.I. Measurement of kinetics and thermodynamics of the thermal degradation for non-charring polymers. Combust. Flame 2013, 160, 1287–1297. [Google Scholar] [CrossRef]
- Xu, X.; Pan, R.; Chen, R. Combustion Characteristics, Kinetics, and Thermodynamics of Pine Wood Through Thermogravimetric Analysis. Appl. Biochem. Biotechnol. 2021, 193, 1427–1446. [Google Scholar] [CrossRef]
- Xu, X.; Pan, R.; Chen, R. Comparative thermal degradation behaviors and kinetic mechanisms of typical hardwood and softwood in oxygenous atmosphere. Processes 2021, 9, 1598. [Google Scholar] [CrossRef]
- McKinnon, M.B.; Stoliarov, S.I. Pyrolysis model development for a multilayer floor covering. Materials 2015, 8, 6117–6153. [Google Scholar] [CrossRef]
- McKinnon, M.B.; Ding, Y.; Stoliarov, S.I.; Crowley, S.; Lyon, R.E. Pyrolysis model for a carbon fiber/epoxy structural aerospace composite. J. Fire Sci. 2017, 35, 36–61. [Google Scholar] [CrossRef]
- Swann, J.D.; Ding, Y.; Stoliarov, S.I. A quantitative comparison of the pyrolysis and combustion behavior of plasticized and rigid poly(vinyl chloride) using two-dimensional modeling. Fire Saf. J. 2020, 111, 102910. [Google Scholar] [CrossRef]
- Swann, J.D.; Ding, Y.; Stoliarov, S.I. Characterization of pyrolysis and combustion of rigid poly(vinyl chloride) using two-dimensional modeling. Int. J. Heat Mass Transf. 2019, 132, 347–361. [Google Scholar] [CrossRef]
- Swann, J.D.; Ding, Y.; Stoliarov, S.I. Comparative analysis of pyrolysis and combustion of bisphenol A polycarbonate and poly(ether ether ketone) using two-dimensional modeling: A relation between thermal transport and the physical structure of the intumescent char. Combust. Flame 2020, 212, 469–485. [Google Scholar] [CrossRef]
- Günther, E.; Fricke, M.; Lölsberg, W.; Klinkebiel, A.; Weinrich, D. New Aerogel Products for Construction Use: Product Specifications, Application Examples, Practical Aspects. E3S Web Conf. 2020, 172, 1–6. [Google Scholar] [CrossRef]
- Günther, E.; Bichlmair, S.; Latz, S.; Fricke, M. Internal wall insulation with a new aerogel panel: SLENTITE® for energetic retrofit in historic buildings. E3S Web Conf. 2020, 172, 4–9. [Google Scholar] [CrossRef]
- Li, J.; Stoliarov, S.I. Measurement of kinetics and thermodynamics of the thermal degradation for charring polymers. Polym. Degrad. Stab. 2014, 106, 2–15. [Google Scholar] [CrossRef]
- Ding, Y.; Stoliarov, S.I.; Kraemer, R.H. Development of a semiglobal reaction mechanism for the thermal decomposition of a polymer containing reactive flame retardants: Application to glass-fiber-reinforced polybutylene terephthalate blended with aluminum diethyl phosphinate and melamine polypho. Polymers 2018, 10, 1137. [Google Scholar] [CrossRef]
- Lyon, R.E.; Walters, R.N.; Stoliarov, S.I.; Safronava, N. Principles and Practice of Microscale Combustion Calorimetry; Federal Aviation Administration: Atlantic City International Airport, NJ, USA, 2013; pp. 1–80.
- Ding, Y. A Generalized Methodology to Develop Pyrolysis Models for Polymeric Materials Containing Reactive Flame Retardants: Relationship between Material Composition and Flammability Behavior. Ph.D. Thesis, University of Maryland, College Park, MD, USA, 2019. [Google Scholar]
- Stoliarov, S.I.; Crowley, S.; Lyon, R.E.; Linteris, G.T. Prediction of the burning rates of non-charring polymers. Combust. Flame 2009, 156, 1068–1083. [Google Scholar] [CrossRef]
- Stoliarov, S.I.; Lyon, R.E. Thermo-kinetic model of burning for pyrolyzing materials. Fire Saf. Sci. 2008, 9, 1141–1152. [Google Scholar] [CrossRef]
- Stoliarov, S.I.; Leventon, I.T.; Lyon, R.E. Two-dimensional model of burning for pyrolyzable solids. Fire Mater. 2014, 38, 391–408. [Google Scholar] [CrossRef]
- Lyon, R.E.; Walters, R.N.; Stoliarov, S.I. A thermal analysis method for measuring polymer flammability. In Techniques in Thermal Analysis: Hyphenated Techniques, Thermal Analysis of the Surface, and Fast Rate Analysis; Conference Proceedings Citation Index-Science (CPCI-S); ASTM International: West Conshohocken, PA, USA, 2007. [Google Scholar] [CrossRef]
- Lyon, R.E.; Safronava, N. A comparison of direct methods to determine n-th order kinetic parameters of solid thermal decomposition for use in fire models. J. Therm. Anal. Calorim. 2013, 114, 213–227. [Google Scholar] [CrossRef]
- Fiola, G.J.; Chaudhari, D.M.; Stoliarov, S.I. Comparison of Pyrolysis Properties of Extruded and Cast Poly(methyl methacrylate). Fire Saf. J. 2021, 120, 103083. [Google Scholar] [CrossRef]
- Ding, Y.; McKinnon, M.B.; Stoliarov, S.I.; Fontaine, G.; Bourbigot, S. Determination of kinetics and thermodynamics of thermal decomposition for polymers containing reactive flame retardants: Application to poly(lactic acid) blended with melamine and ammonium polyphosphate. Polym. Degrad. Stab. 2016, 129, 347–362. [Google Scholar] [CrossRef]
- Ding, Y.; Kwon, K.; Stoliarov, S.I.; Kraemer, R.H. Development of a semi-global reaction mechanism for thermal decomposition of a polymer containing reactive flame retardant. Proc. Combust. Inst. 2019, 37, 4247–4255. [Google Scholar] [CrossRef]
- Ding, Y.; Swann, J.D.; Sun, Q.; Stoliarov, S.I.; Kraemer, R.H. Development of a pyrolysis model for glass fiber reinforced polyamide 66 blended with red phosphorus: Relationship between flammability behavior and material composition. Compos. Part B Eng. 2019, 176, 107263. [Google Scholar] [CrossRef]
- Swann, J.D.; Ding, Y.; McKinnon, M.B.; Stoliarov, S.I. Controlled atmosphere pyrolysis apparatus II (CAPA II): A new tool for analysis of pyrolysis of charring and intumescent polymers. Fire Saf. J. 2017, 91, 130–139. [Google Scholar] [CrossRef]
- Sun, Q.; Ding, Y.; Stoliarov, S.I.; Sun, J.; Fontaine, G.; Bourbigot, S. Development of a pyrolysis model for an intumescent flame retardant system: Poly(lactic acid) blended with melamine and ammonium polyphosphate. Compos. Part B Eng. 2020, 194, 108055. [Google Scholar] [CrossRef]
- Ding, Y.; Stoliarov, S.I.; Kraemer, R.H. Pyrolysis model development for a polymeric material containing multiple flame retardants: Relationship between heat release rate and material composition. Combust. Flame 2019, 202, 43–57. [Google Scholar] [CrossRef]
Publisher’s Note: MDPI stays neutral with regard to jurisdictional claims in published maps and institutional affiliations. |
© 2022 by the authors. Licensee MDPI, Basel, Switzerland. This article is an open access article distributed under the terms and conditions of the Creative Commons Attribution (CC BY) license (https://creativecommons.org/licenses/by/4.0/).