Article

Depositional and Diagenetic Controls on Reservoir Quality of Callovian-Oxfordian Stage on the Right Bank of Amu Darya

1
Research Institute of Petroleum Exploration & Development, PetroChina, Beijing 100083, China
2
International Corporation (Turkmenistan), CNPC, Beijing 100080, China
3
SimTech LLC, Katy, TX 77494, USA
*
Author to whom correspondence should be addressed.
Energies 2022, 15(19), 6923; https://doi.org/10.3390/en15196923
Submission received: 30 August 2022 / Revised: 18 September 2022 / Accepted: 19 September 2022 / Published: 21 September 2022

Abstract

:
Based on the detailed analysis of sedimentology, diagenesis, and petrophysics, this study characterized the Middle-Lower Jurassic Callovian-Oxfordian carbonate reservoirs of 68 key wells in the Amu Darya Basin and assessed the controlling factors on the quality of the target intervals. We identified 15 types of sedimentary facies developed in seven sedimentary environments using sedimentary facies analysis, such as evaporative platform, restricted platform, open platform, platform margin, platform fore-edge upslope, platform fore-edge downslope, and basin facies. The target intervals went through multiple diagenetic stages, including the syndiagenetic stage, early diagenetic stage, and middle diagenetic stage, all of which had a significant impact on the reservoir quality. Main diagenetic processes include dissolution and fracturing which improve the reservoir quality as well as cementation, compaction, and pressure solution that reduce the reservoir quality. By analyzing the reservoir quality, we identified nine fluid flow units and five types of reservoir facies. Among them, the dissolved grain-dominated reservoir facies is of the highest quality and is the best storage and flow body, while the microporous mud-dominated reservoir facies of platform fore-edge downslope and open marine facies is of the lowest quality and could not become the flow unit unless it was developed by fracturing.

1. Introduction

As the largest sedimentary basin in Central Asia [1], the Amu Darya Basin is rich in oil and natural gas resources [2], thanks to its superior source-reservoir-cap assemblages and reservoir forming conditions. Recently, many petroleum geologists have conducted detailed research on the sedimentary facies and reservoir characters [3,4,5,6,7] of Callovian-Oxfordian carbonate sedimentation, the identification of reservoirs of reefs and shoal facies, and the evolution and distribution patterns [8,9,10,11,12] of pores and fractures using coring, well logging, seismic data, and geological modeling.
Most of these studies focus on describing and identifying a certain aspect of sedimentary facies or reservoir characteristics; the main factor affecting reservoir quality have not yet been comprehensively investigated. As the reservoir quality in carbonate formation is mainly controlled by comprehensive factors such as sedimentary facies characteristics (e.g., rock structure, textures, and mineral composition), and various post-depositional diagenesis and fracturing [13,14], the inherent geological properties of the rocks result in the static and dynamic heterogeneity of the reservoir [15,16]. Therefore, studying the controlling factors of sedimentation and diagenesis on reservoir quality is a substantial step for hydrocarbon exploration and production in carbonate reservoirs.
This study is the first to analyze the factors affecting the reservoir quality and establish the quantitative standards of different reservoir facies based on the study of the sedimentology and diagenesis of the Callovian-Oxfordian carbonate formation in the Amu Darya Basin. The main purpose was to determine the various characteristics and controlling factors of the Callovian-Oxfordian reservoir quality by establishing a sedimentary model and a diagenesis model for the target area. The research results can be used to guide the fine geological modeling, the preparation of oil and gas reservoir development plans, and the well placement.

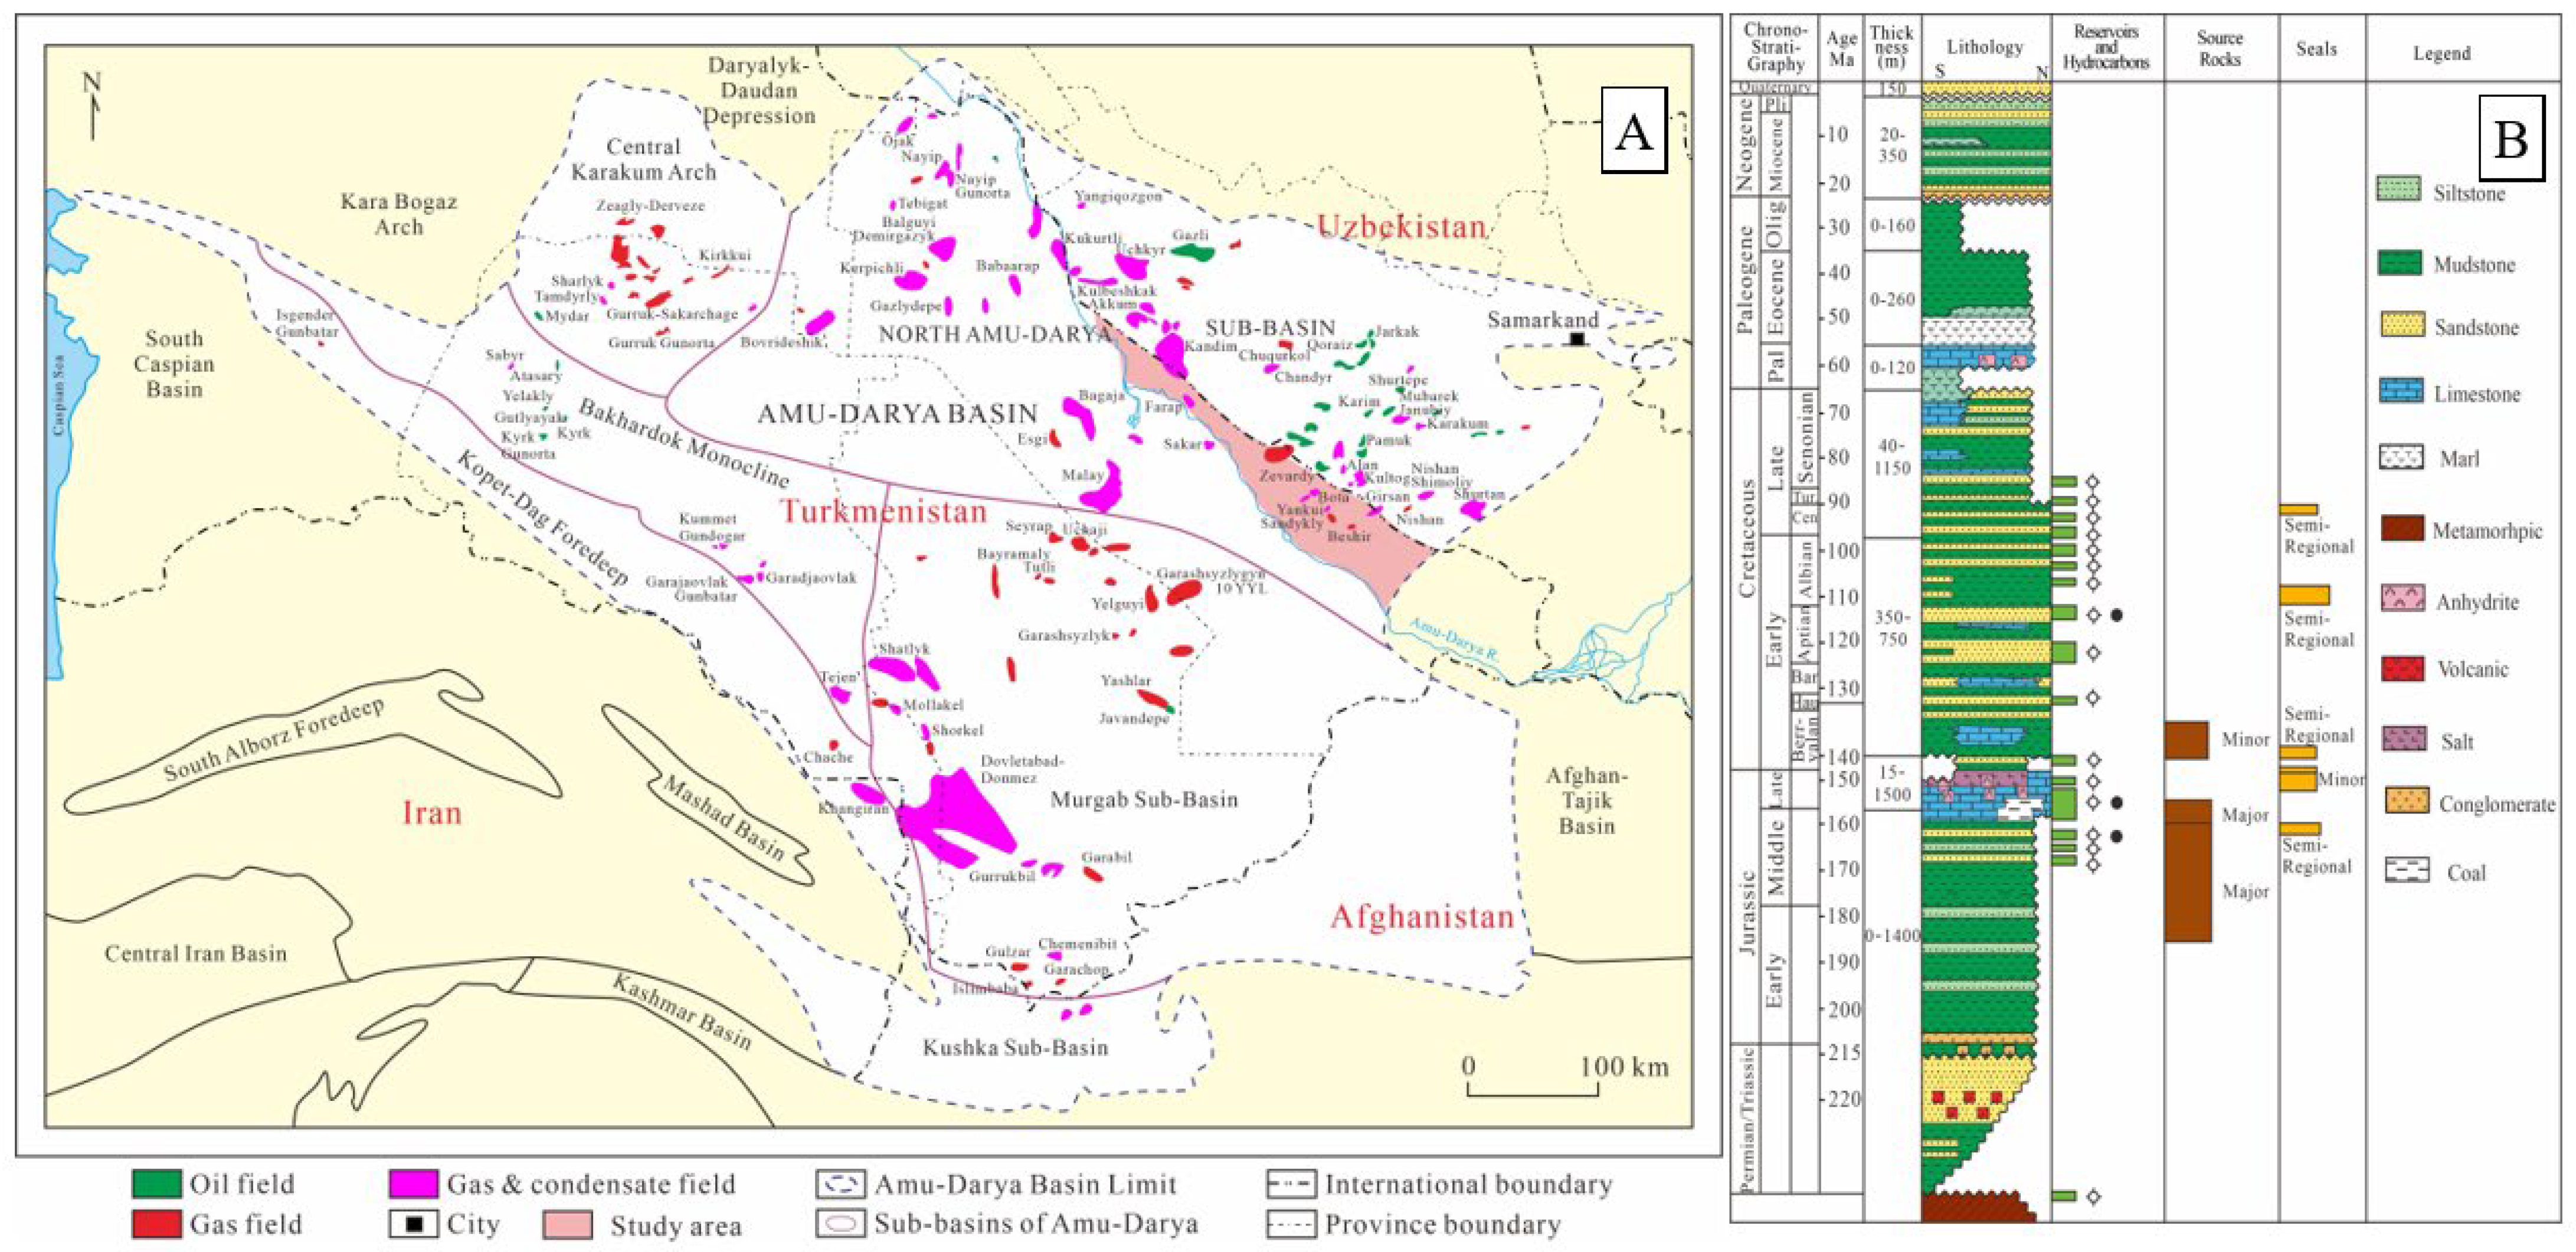
2. Geological Setting

2.1. Geographical Information and History of Petroleum Exploration and Production

The Amu Darya basin is located in southern Turan plate, occupying the western part of Uzbekistan, eastern and central parts of Turkmenistan, north Afghanistan, and north-eastern part of Iran; the total area of the basin is 437,319 km2.
The basin’s main tectonic elements include: Central Karakum arch, North Amu Darya Sub-basin, Bahardok monocline, Kopet Dag Foredeep, and Murgab Sub-basin (Figure 1A). The basin’s structural style was finally shaped during the Miocene-Quaternary period. The Alpine compression led to a reactivation of existing and formation of new regional faults. At the post-rift stage, the basin was steadily subsiding during a very long period of time and a thick sedimentary sequence was deposited. The most important hydrocarbon traps formed during the period were the Callovian-Oxfordian reefs [17].
The basement of the Amu Darya Basin is composed of Paleozoic igneous rocks and metamorphic rocks with widely varying burial depths. The Permian, Triassic continental facies, and Lower Jurassic marine-continental alternating facies coal-bearing clastic rock formation is well developed above the basement. The middle-upper Jurassic and Cretaceous formations are marine carbonate rock and evaporite formations, with highly favorable source-reservoir-cap assemblages and hydrocarbon migration or accumulation conditions (Figure 1B).
Sedimentary cover overlying the “Hercynian” basement of the Turan plate comprises three major mega sequences: the Permian-Lower Triassic “Transitional Complex” probably deposited in a back arc environment during the closure of the Paleotethys ocean; the Upper Triassic-Oligocene “Platform Complex” formed on a Tethyan passive margin; the uppermost Oligocene-Quaternary molasse deposited during the Alpine compressional phase caused by the collision of the Arabian and Indian plates with the Eurasian continent (“the Himalayan Orogeny”). The Himalayan Orogeny is responsible for the formation of the majority of structures in which the present-day hydrocarbon accumulations are trapped.
The exploration and development of the Amu Darya Basin has gone through three stages: ① Regional reconnaissance and pre-exploration stage (1929–1964): two sets of main gas-bearing strata, namely, the post-salt Cretaceous sandstone and the sub-salt lower Jurassic carbonate rock, were determined; ② Shallow exploration and development stage (1965–1996): the main discovered gas reservoirs were in the post-salt Cretaceous and the shallow sub-salt Jurassic structural traps; ③ Deep exploration and development stage (1997–present): the main discovered gas reservoirs were in the deep sub-salt carbonate rocks.

2.2. Major Geological Characteristics of Petroleum System

The basin’s two main source rocks are Lower-Middle Jurassic shales and coals with humic organic matter, and Callovian-Oxfordian deep-water marine black shales with sapropelic kerogen. Both source rocks are in the gas-generation window over much of the Amu Darya Basin [1].
Proven hydrocarbon reservoirs occur in the Lower-Middle Jurassic (clastics), Upper Jurassic (mainly carbonates), Cretaceous (mainly clastics), and Paleocene (carbonates). Callovian-Oxfordian carbonates including reefal ones, and the Hauterivian Shatlyk sandstones are the most important reservoirs in the basin.
The Gaurdak salt (Kimmeridgian-Tithonian) is the most important regional seal, providing a caprock for Callovian-Oxfordian carbonates.

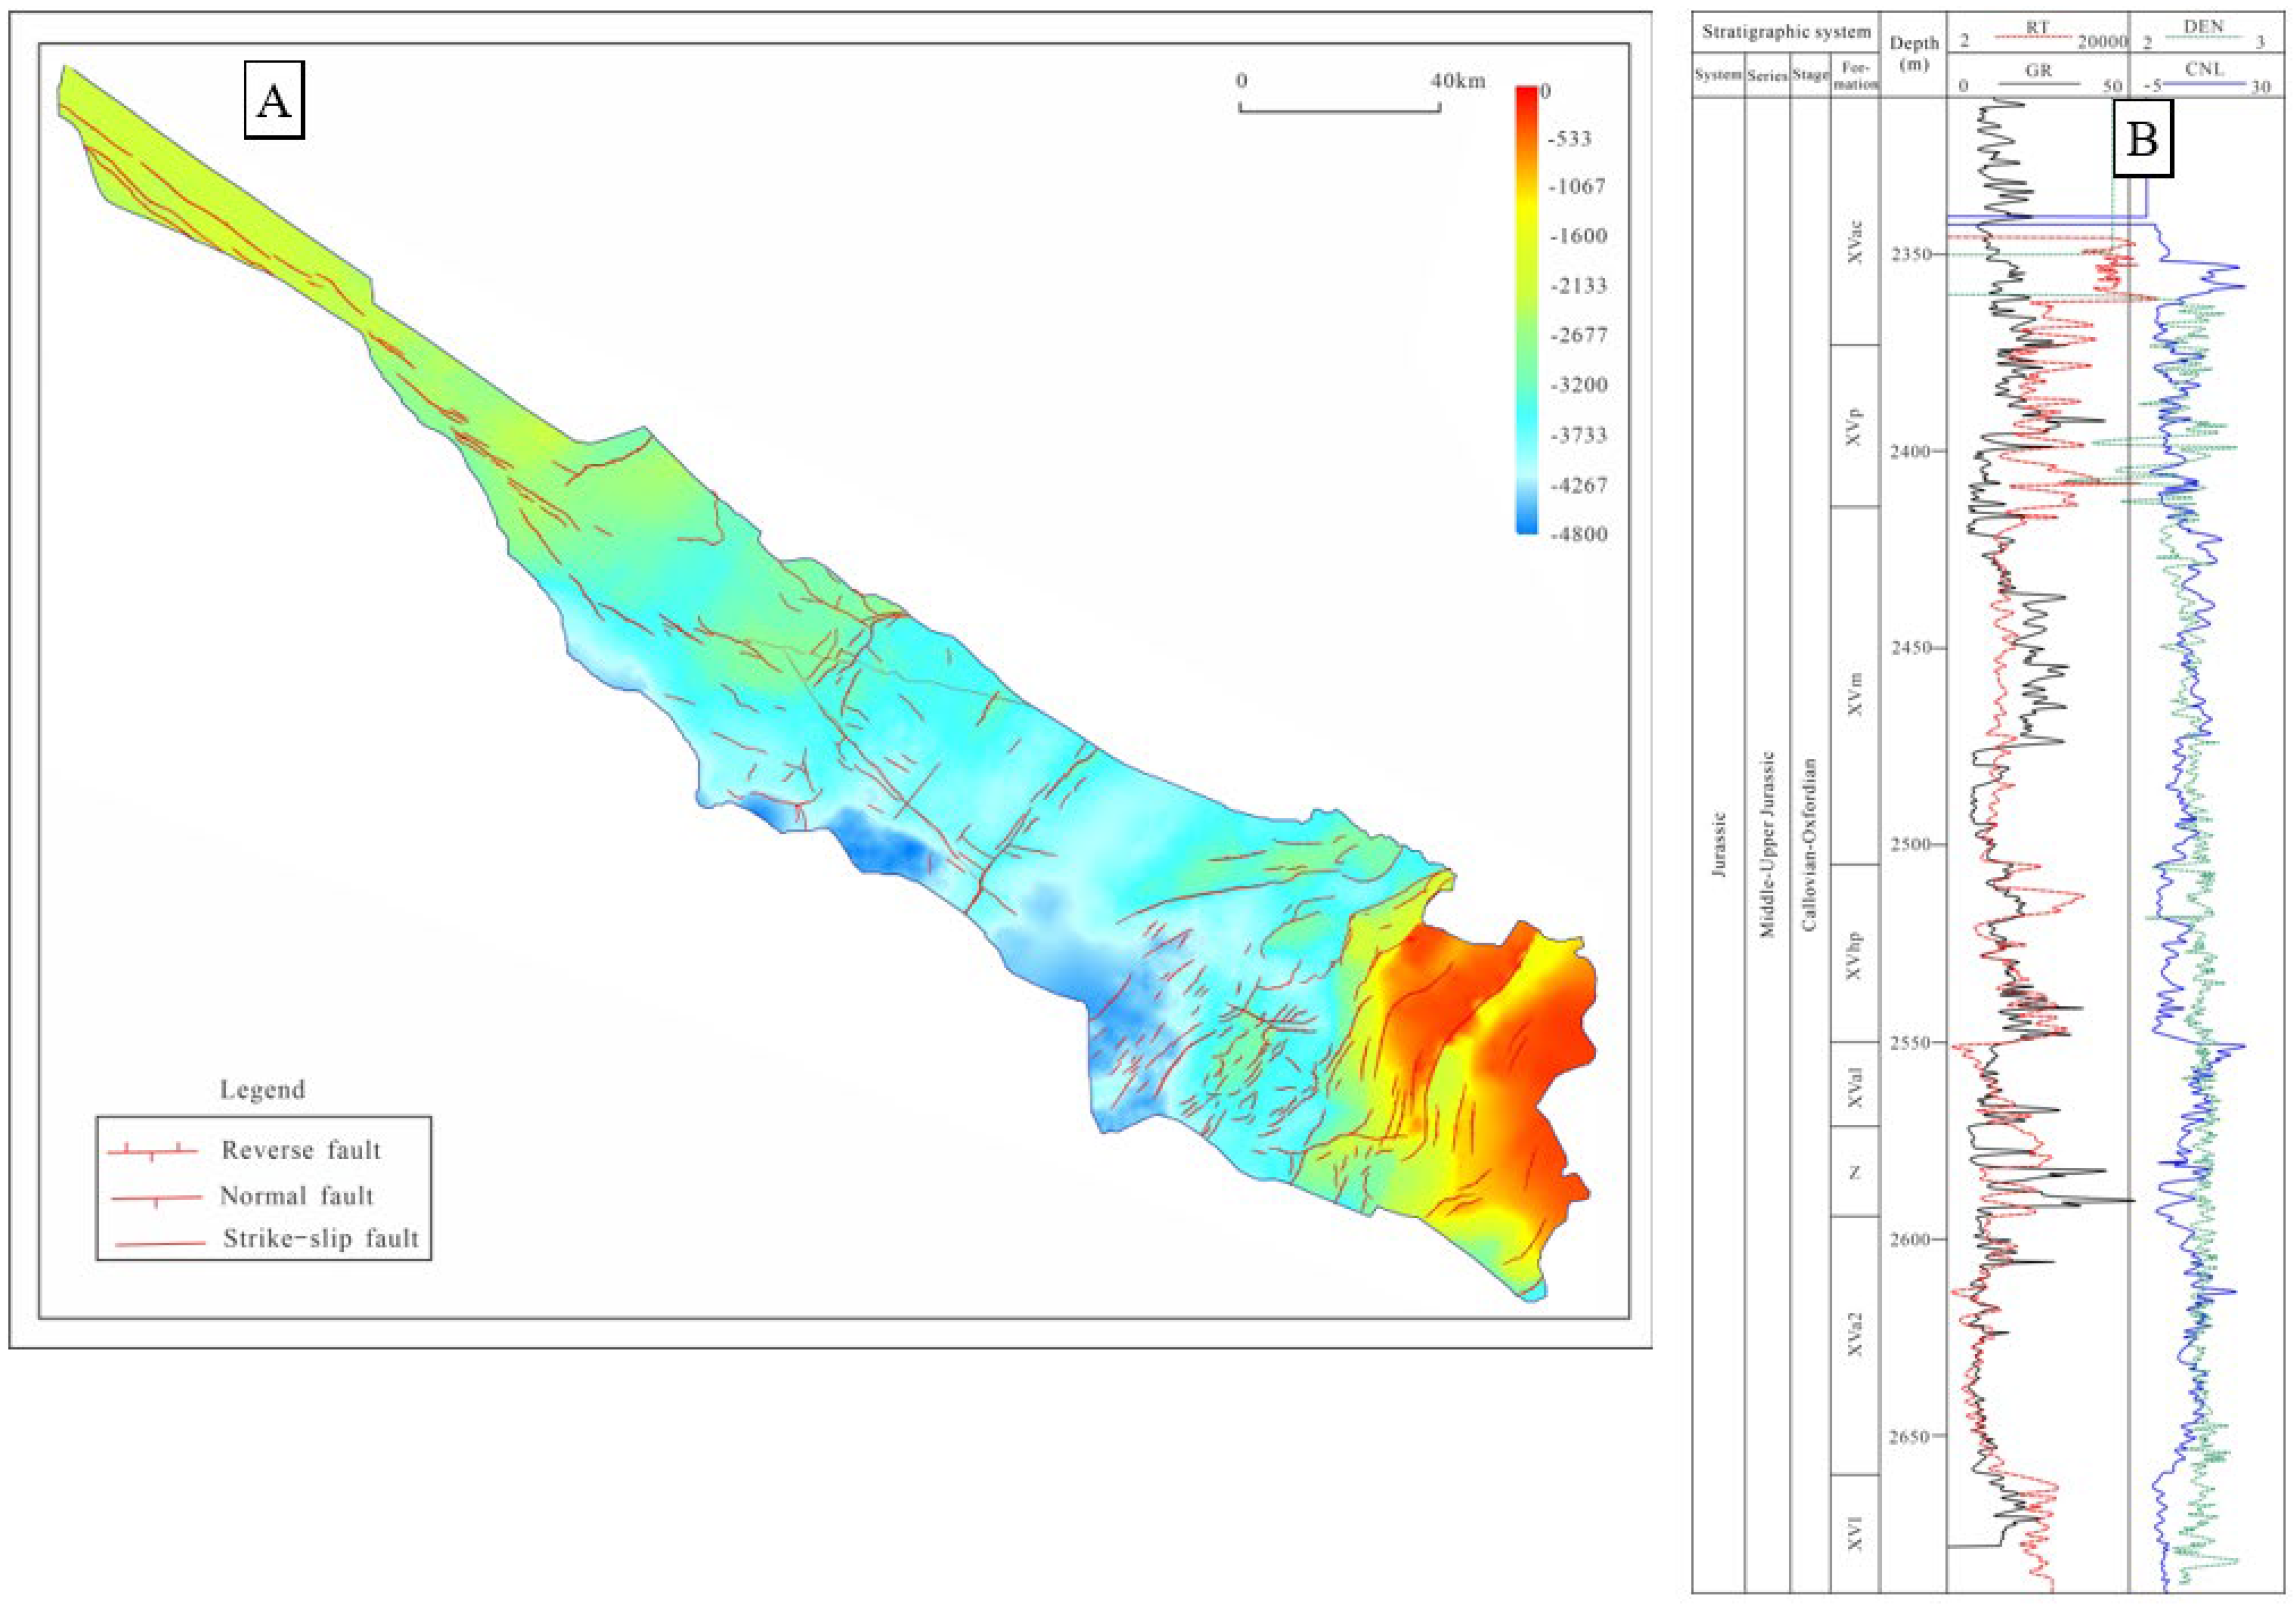
2.3. Location of Study Area and Main Target Strata

The study area (the right bank of Amu Darya) is located near the border of Turkmenistan and Uzbekistan in the northeast of the Amu Darya Basin (Figure 1A). The total area of the study area is 14,314 km2. The main target strata for exploration and development are the Middle and Upper Jurassic carbonate rocks. The Amu Darya Right Bank shows a structural pattern of being higher in the east, west, north, and lower in the middle and south; the faults in the west of the study area are mainly NW-striking slip faults, while those in the east are mainly reverse faults (Figure 2A). Being the main oil and gas production strata, the Callovian–Oxfordian is dominated by thick marine reef limestone, grainstone, and tight limestone interbedded with thin mudstone, with a thickness is 300–450 m. The sub-salt carbonate rocks are classified as Callovian XVI, XVa2, XVz, and Xva1 intervals, and Oxfordian XVhp, XVm, XVp, and Xvac (Figure 2B). Hereinto, the Xvac is interbedded with light gray limestone and gray white anhydrite; the XVp is massive limestone; the XVm is mainly reef limestone and bioclastic limestone mixed with micrite; the upper part of the XVhp is dark gray argillaceous limestone, and the lower part Is brownish-gray tight limestone; the xVa1 is gray limestone with relatively developed organisms and a slightly coarser texture; the XVz is mainly dark gray tight limestone; the xVa2 is gray limestone with crystal powder; the XVI layer is tight bedded limestone. The main production intervals of natural gas are XVp, XVm, XVhp, xVa1, and so on. The reservoir rocks are mostly reef and shoal facies limestone in the sedimentary facies belts such as platform fore-edge upslope, platform margins, and open platforms. Furthermore, the tectonic fractures of different scales in the study area greatly enhanced the accumulation, migration, and flow capacity of oil and gas.

3. Data and Methods

In this study, the 600 m coring data and thin sections analysis data of 68 wells in the Callovian-Oxfordian formation were used, mainly including the porosity and permeability analysis data of 65 wells (13,450 samples), core photos of 62 wells, thin sections of 19 wells, and scanning electron microscope data of 13 wells. Thin sections of 15 wells (594 samples) were stained to accurately identify pore types and diagenetic process.

3.1. Petrography

The Dunham classification system [18] as modified by Embry and Klovan [19] was mainly used for sedimentary facies analysis, with reference made to the carbonate sedimentary facies description method proposed by Flügel in 2010 [20]. The vertical division of sedimentary facies and stratigraphic correlation were mainly based on core data and petrophysical logging (mainly using natural gamma-ray GR, sonic differential time DT and density logging RHOB).

3.2. Reservoir Quality

The flow unit method was used to quantitatively evaluate the reservoir quality using the flow unit index. The flow unit method was proposed by Amaefule et al. [21] by correcting the equation proposed by Kozeny [22] and Carman [23], and flow zone indicator (FZI) values were used to define different flow units [15,24,25,26]. The input data include porosity ( ϕ e ) and permeability (K) measured on core plugs [27].
In this study, the porosity and permeability obtained by testing 13,450 core plug samples in the target intervals are used to evaluate reservoir quality, whereas density (RHOB), sonic (DT), and resistivity (LLD and LLS) logs are mainly used to evaluate reservoir quality in uncored intervals.
0.0314 k Φ e = ( ϕ e 1 ϕ e ) ( 1 τ × S g × F s )
The left-hand side of the equation is the reservoir quality index RQI (μm), defined as follows:
R Q I = 0.0314 k / ϕ e
where Φ e is the effective porosity and k is the permeability.
The normalized porosity or pore-matrix ratio (PMR) is defined as follows:
P M R = ϕ e 1 ϕ e
FZI (μm) is the flow zone indicator, defined as follows:
F Z I = ( 1 τ × S g × F s )
By combining Equations (2)–(4), Equation (1) can be transformed into the following:
R Q I = P M R × F Z I
Taking the logarithm on both sides of Equation (5) gives:
l o g R Q I = l o g P M R + l o g F Z I

4. Results

4.1. Facies Analysis
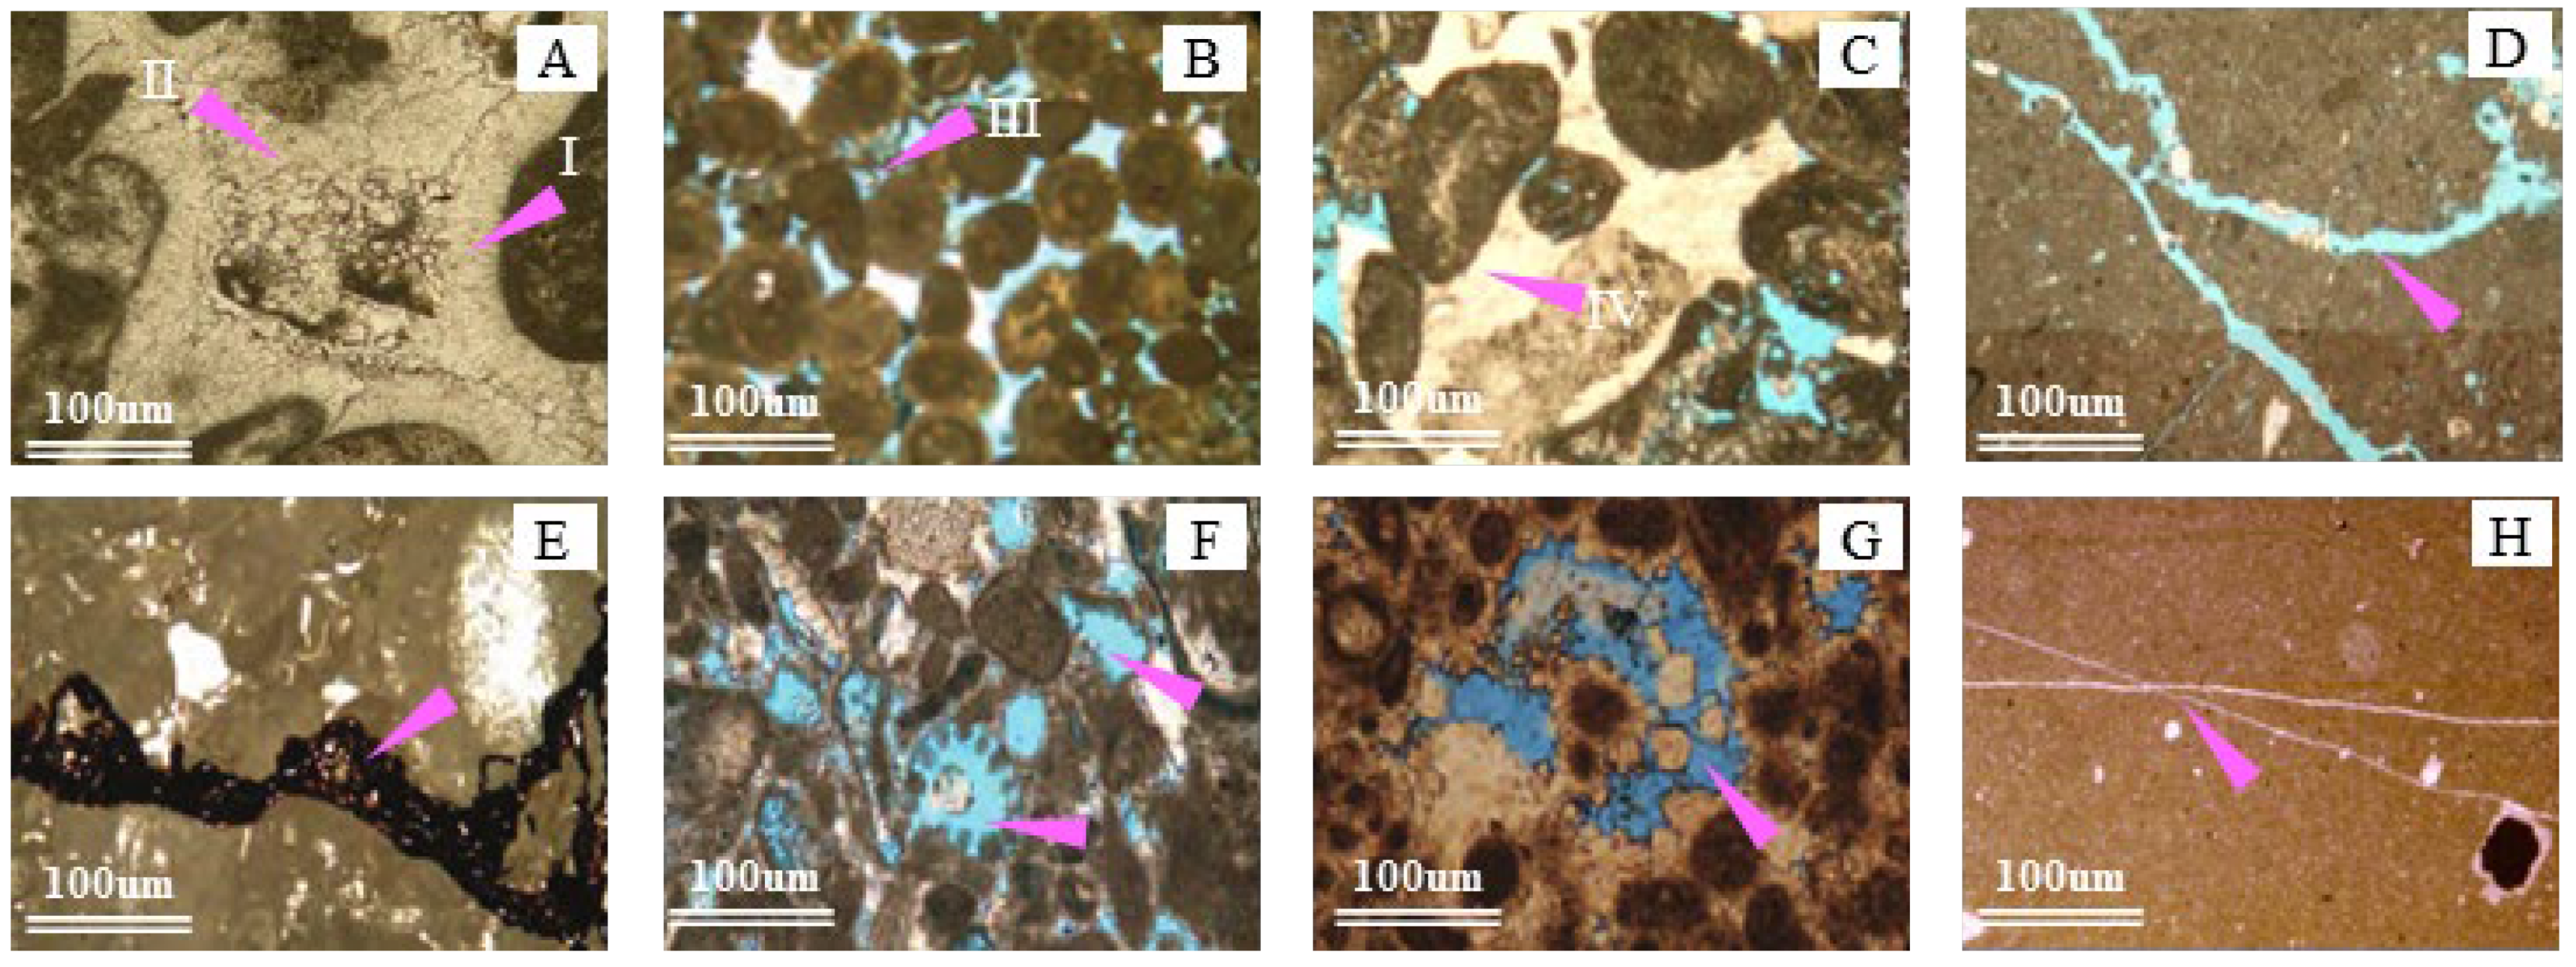
Since diagenetic events and reservoir quality are mainly controlled by depositional attributes, the sedimentary facies must first be investigated in details. Based on the core and thin sections, 15 sedimentary facies (F1–F15) were deposited in seven facies belts (FB1–FB1), such as evaporative platform, restricted platform, open platform, platform margin, platform fore-edge upslope, platform fore-edge downslope, and basin facies in the Oxford period are identified based on rock texture, grain types, sorting and comparative analysis with the standard facies models. See Table 1 and Figure 3 for sedimentary facies characteristics and representative photomicrographs of depositional facies. To provide a basis for our ongoing discussion on reservoir quality, only the facies belts are briefly described in this paper.
(1) Evaporative platform: The evaporative platform facies belt is formed under arid and hot climate conditions, including Sabkha facies (F1) dominated by gypsum and evaporative lagoon facies (F2) dominated by micrite and gypsum interlayer. The evaporation lagoon facies is mainly at the top of Callovian-Oxfordian strata (Figure 3).
(2) Restricted platform: The restricted platform facies belt has three sedimentary facies: tidal flat (F3), restricted platform shoal (F4), and lagoon (F5). The main lithology of tidal flat facies is algal limestone, with occasional dolomite; the main lithology of shoal facies is micrite oolitic limestone and calcarenite; the main lithology of lagoon facies is bioclastic micrite (Figure 3).
(3) Open platform: The open platform is composed of open platform shoal (F6) and inter-shoal (F7) facies. The main lithology of the open platform shoal facies is bioclastic limestone while the main lithology of the inter-shoal facies is bioclastic micrite (Figure 3).
(4) Platform margin: The platform margin facies is a transition zone between deep water deposits and shallow water deposits, which is the sedimentary environment with the strongest hydrodynamic force and can be classified into two sedimentary facies: platform margin shoal (F8) and organic reef (F9). The main lithology of the shoal facies at the platform margin consists of well-sorted bioclastic limestone, calcarenite, and oolitic limestone. The reef facies is distributed in groups and belts along the platform margin and intergrow vertically with bioclastic shoals. Its main lithology is rudist skeleton reef limestone and boundstone, with a small amount of coral reef limestone. The biological framework is mainly composed of rudist, coral, moss, and algae (Figure 3).
(5) Platform fore-edge upslope: The platform fore-edge upslope facies belt is divided into three sections: the shoal (F10), the bioherm (F11), and the mud facies of the platform fore-edge upslope (F12). The lithology of the shoal is dominated by calcarenite and bioclastic limestone. They consist of intraclasts or spherulites, and so on. The bioclasts are dominated by bivalves, followed by echinoderms, foraminifera, Crinoidea, and algae. The lithology of bioherm facies is mainly micritic grainstone composed of bioclasts, spherulites, clotted limestones, and algal nodules. The mud facies of the platform fore-edge upslope is mostly microcrystalline limestone, with a few foraminifera and pleopods (Figure 3).
(6) Platform fore-edge downslope: The platform fore-edge downslope facies belt is classified as lime-mud mound (F13) and mud (F14) facies. The lime-mud mound is only found in the middle and lower parts of the platform foreslope and is composed of wackestone, and a small amount of packstone. It is composed of very pure fine-grained lime-mud or lime-mud with spherulites and bioclasts, and the bioclasts are mainly rinoideaa, brachiopods, gastropods, etc. The mud facies of platform fore-edge downslope are dark thin-layer bioclastic microcrystalline limestone and spherulitic microcrystalline limestone deposited in deep water and a low-energy environment (Figure 3).
(7) Basin: Two types of basin facies are developed in the study area (F15): One is a deep Callovian sea basin beneath the platform foreslope with a deep and low-energy water body. Its main lithology consists of thin-layer dark microcrystalline limestone and marl rich in organic matter and argillaceous lamination, with a trace of bivalve and siliceous sponge spicules. The other type is the silled bay basin (deep lagoon), which was directly transformed from the early basin due to strong limitation of seawater circulation caused by a large-scale decline in sea level at the end of the Oxford period. The sediments contain few biological fossils, and the main lithology is mudstone with a high GR (Gamma-Ray) log response (Figure 3).

4.2. Diagenesis

Petrographic studies of core samples, core plugs and thin sections reveal that different sedimentary facies of the Callovian-Oxfordian strata have been subjected to complex and strong diagenetic processes, including cementation, mechanical compaction, chemical compaction (pressure solution), dissolution, fracturing, silicification, anhydrification, filling, dolomitization, and recrystallization. The first five were the most common (Figure 4). Considering the diagenetic process controls on reservoir quality (i.e., porosity and permeability), these five main diagenetic processes can be classified into two categories:

4.2.1. Reservoir Quality Reducing Diagenetic Processes

(1)
Cementation
Cementation mainly occurs in a high-energy reef and shoal facies limestone where various primary pores form, and the cement is predominantly calcite. Based on the distribution patterns of cement, four-stage cementation can be identified in the Callovian-Oxfordian Stage [5,7]. Stage I: Quasi-syngenetic comb-shell-shaped calcite (0.05–0.15 mm) covered particles with a uniform thickness (of 0.05–0.15 mm) or growing along the pore wall of a biological reef skeleton pore (Figure 4A). Stage II: In the early stage of diagenesis, the equigranular (0.05–0.1 mm) sparry calcite filled in the pores between reef skeletons or bioclastic grains, growing along the pore edges, or forming a second-generation cement texture with the asaphopsoides isopachous calcite cement in Stage I (Figure 4A); Stage III: Medium-coarse grained (0.3–2.0 mm) equigranular sparry calcite filled in primary pores from late early diagenetic stage to early mid-diagenetic stage (Figure 4B). Stage IV: Intergrowth calcite filled in the remaining pores in the late mid-diagenetic stage (Figure 4C). Although the cementation process in the four stages significantly reduced the primary porosity and deteriorated the reservoir quality, the high-energy reef and shoal facies medium-thick calcite cementation process provided a rigid framework, thus reducing the impact of compaction on the quality of such reservoirs.
(2)
Compaction
Mechanical compaction and chemical compaction are common in the studied intervals. Mechanical compaction mainly occurs in reef limestone and shoal facies grainstone, which leads to deformation, directional alignment, and fracturing of fine bioclasts (Figure 4D), and has little impact on the primary pore and reservoir quality of loose, porous reef limestone, and shoal facies grainstone. Chemical compaction (pressure solution) mainly occurs in the sedimentary facies with high mud content, forming stylolites (Figure 4E). Since the soluble components are dissolved and migrated during chemical compaction (pressure solution) and most of them enter the pores in the form of cement, the stylolites are filled with residual clay or organic matters from pressure solution and closed. As a result, chemical compaction (pressure solution) is highly destructive to the reservoir quality.

4.2.2. Reservoir Quality Enhancing Diagenetic Processes

(1)
Dissolution
Dissolution includes freshwater leaching and dissolution during the syngenetic sedimentary period and burial dissolution during the middle and late diagenetic periods [4]. The platform reef shoal of the highstand system tract was intermittently exposed to the atmospheric environment and was selectively dissolved (the bioclastic skeleton and bioclasts, such as rudist, coral, foraminifera, bryozoa, and rhodophyta were preferentially dissolved) under the influence of freshwater leaching resulting in abundant intergranular dissolution pores, intragranular dissolution pores, and mold pores were developed in the grain-dominated shoal and reef facies (Figure 4F,G). The burial dissolution was mainly caused by the organic acid generated in the hydrocarbon generation process that dissolved the carbonate rock, thus further enlarging the pores [28]. Although the dissolved mold or dissolved pores were partially filled with later calcite cement, these two types of dissolution significantly improved the reservoir quality.
(2)
Fracturing
Fracturing is very common in the Callovian−Oxfordian formation, and the tectonic fractures formed are often partially filled with calcite and carbonized asphalt (Figure 4H). Microfractures are important for linking up pores and cavities in the reservoir and improving its performance; additionally, the tectonic fractures are prone to dissolution, which is very conducive to the formation of secondary dissolution pores and dissolution fractures and greatly improve the reservoir quality.

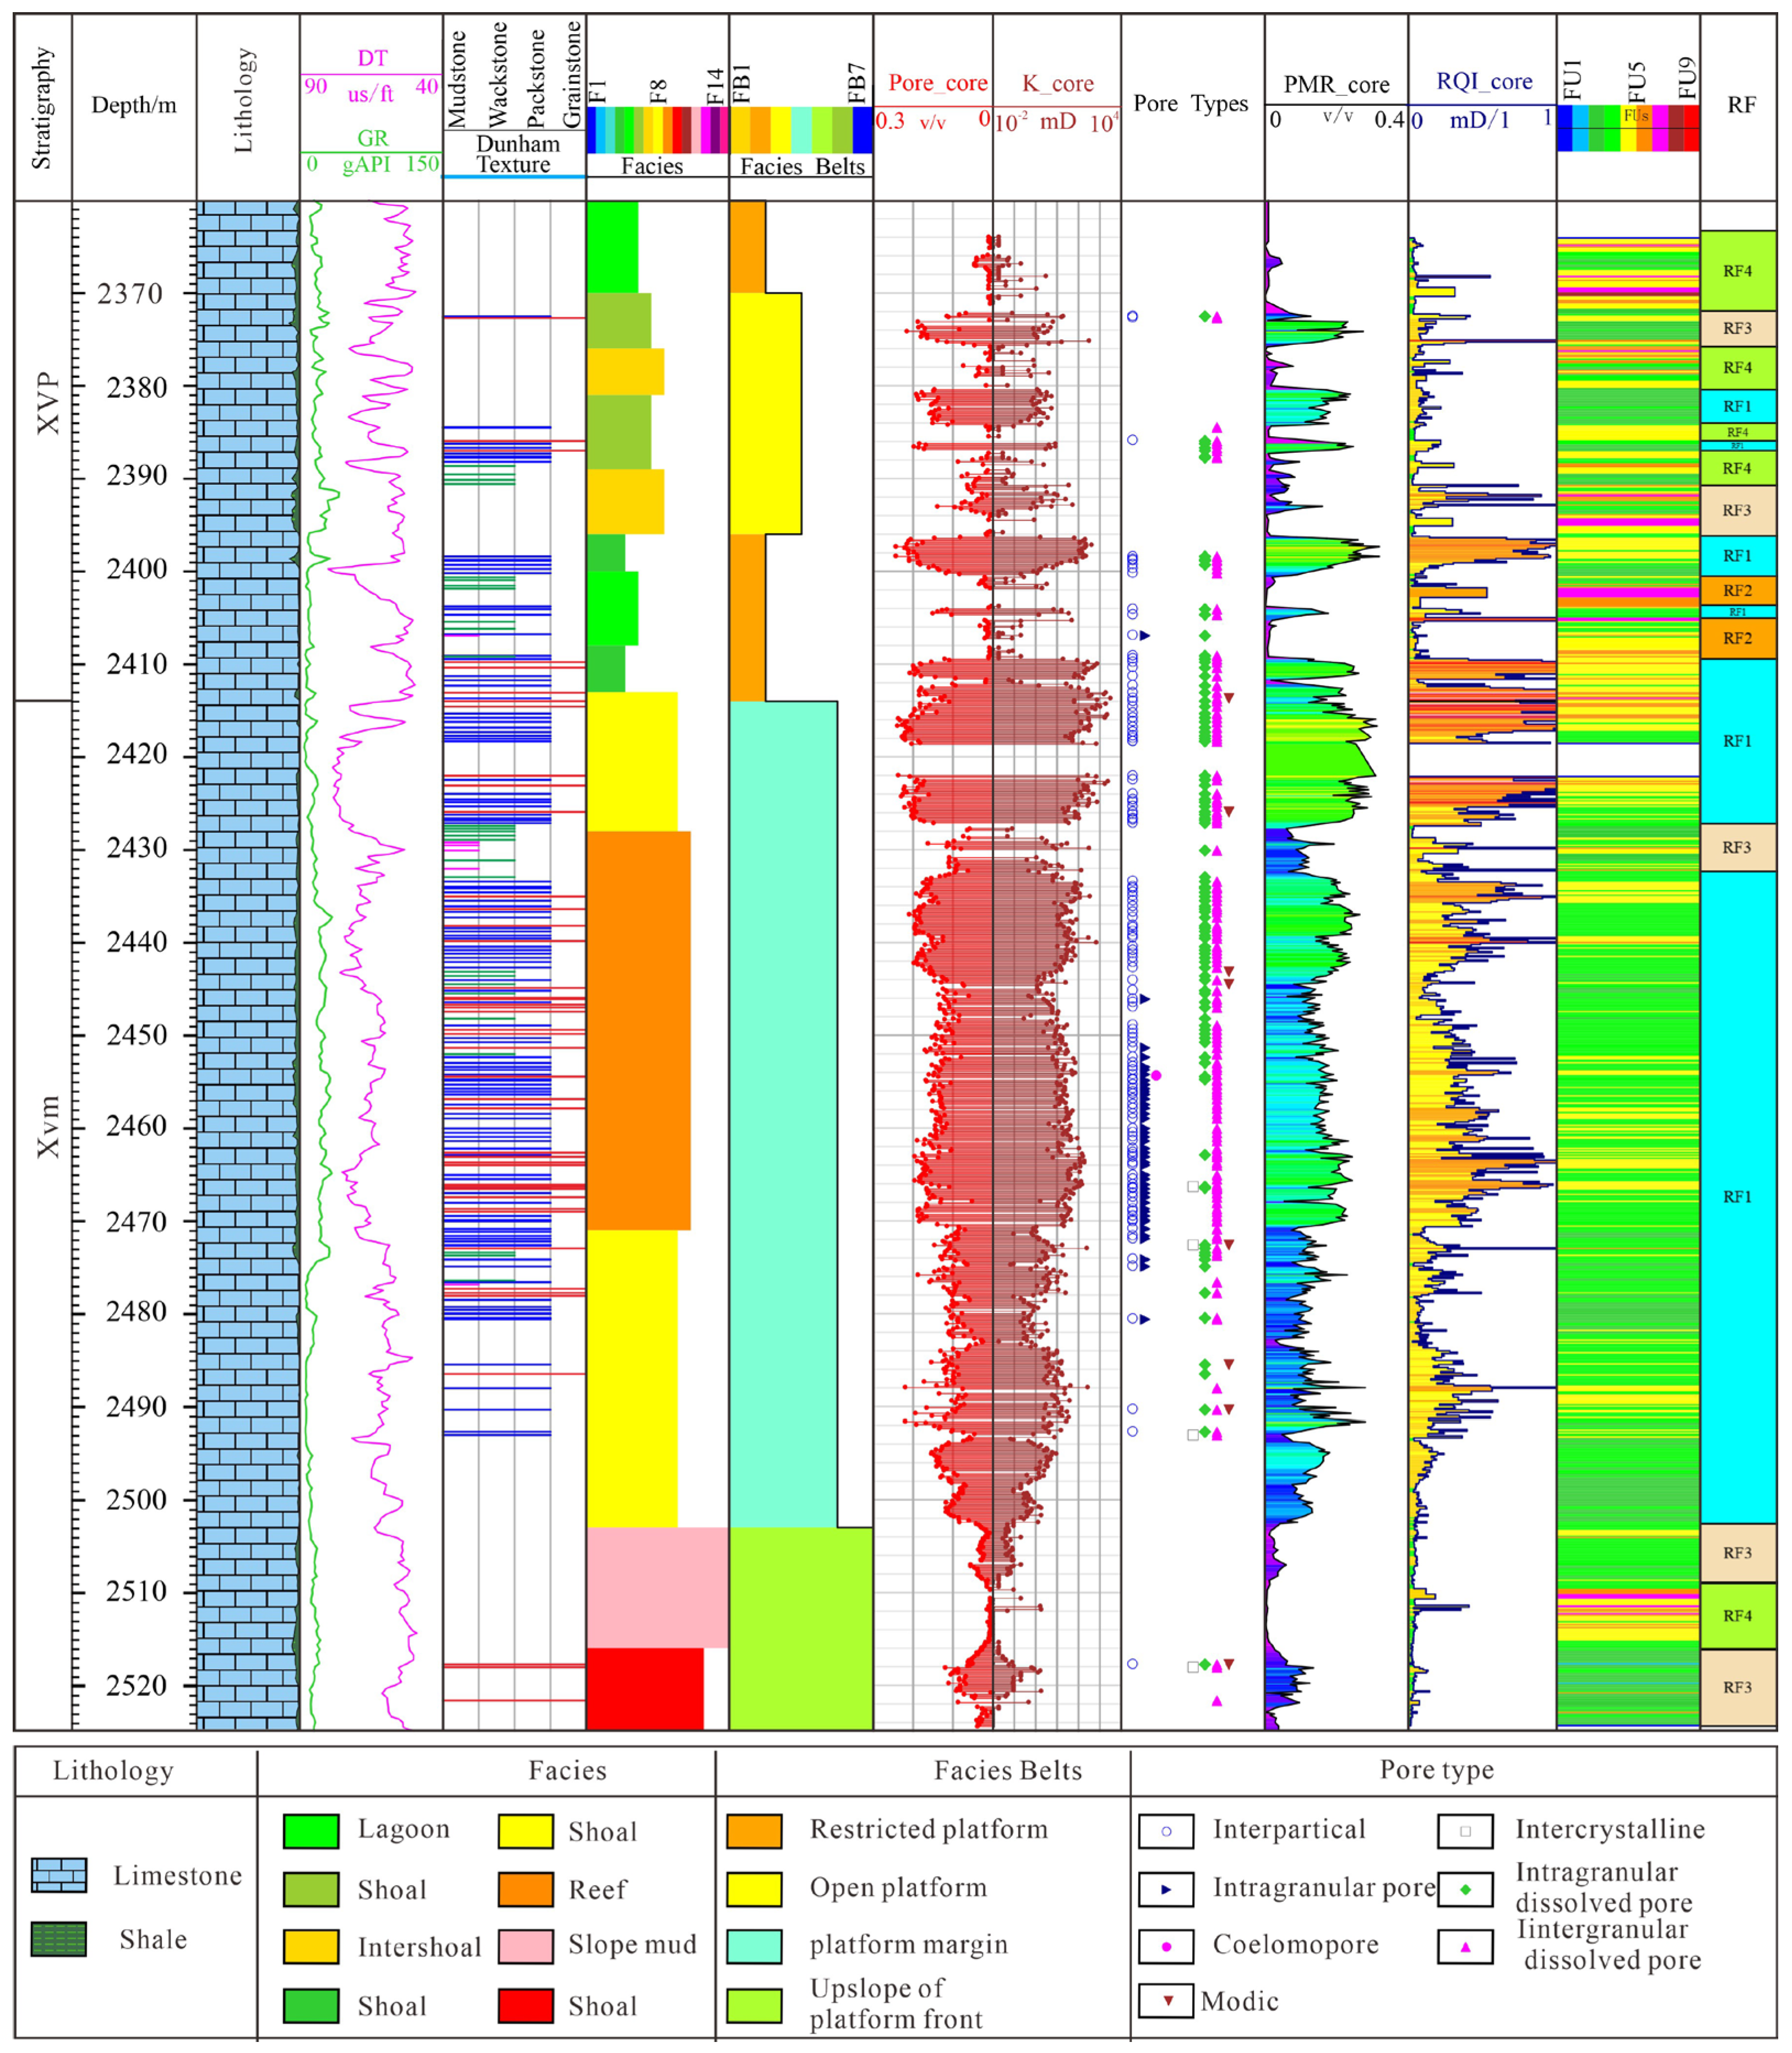
4.3. Reservoir Quality
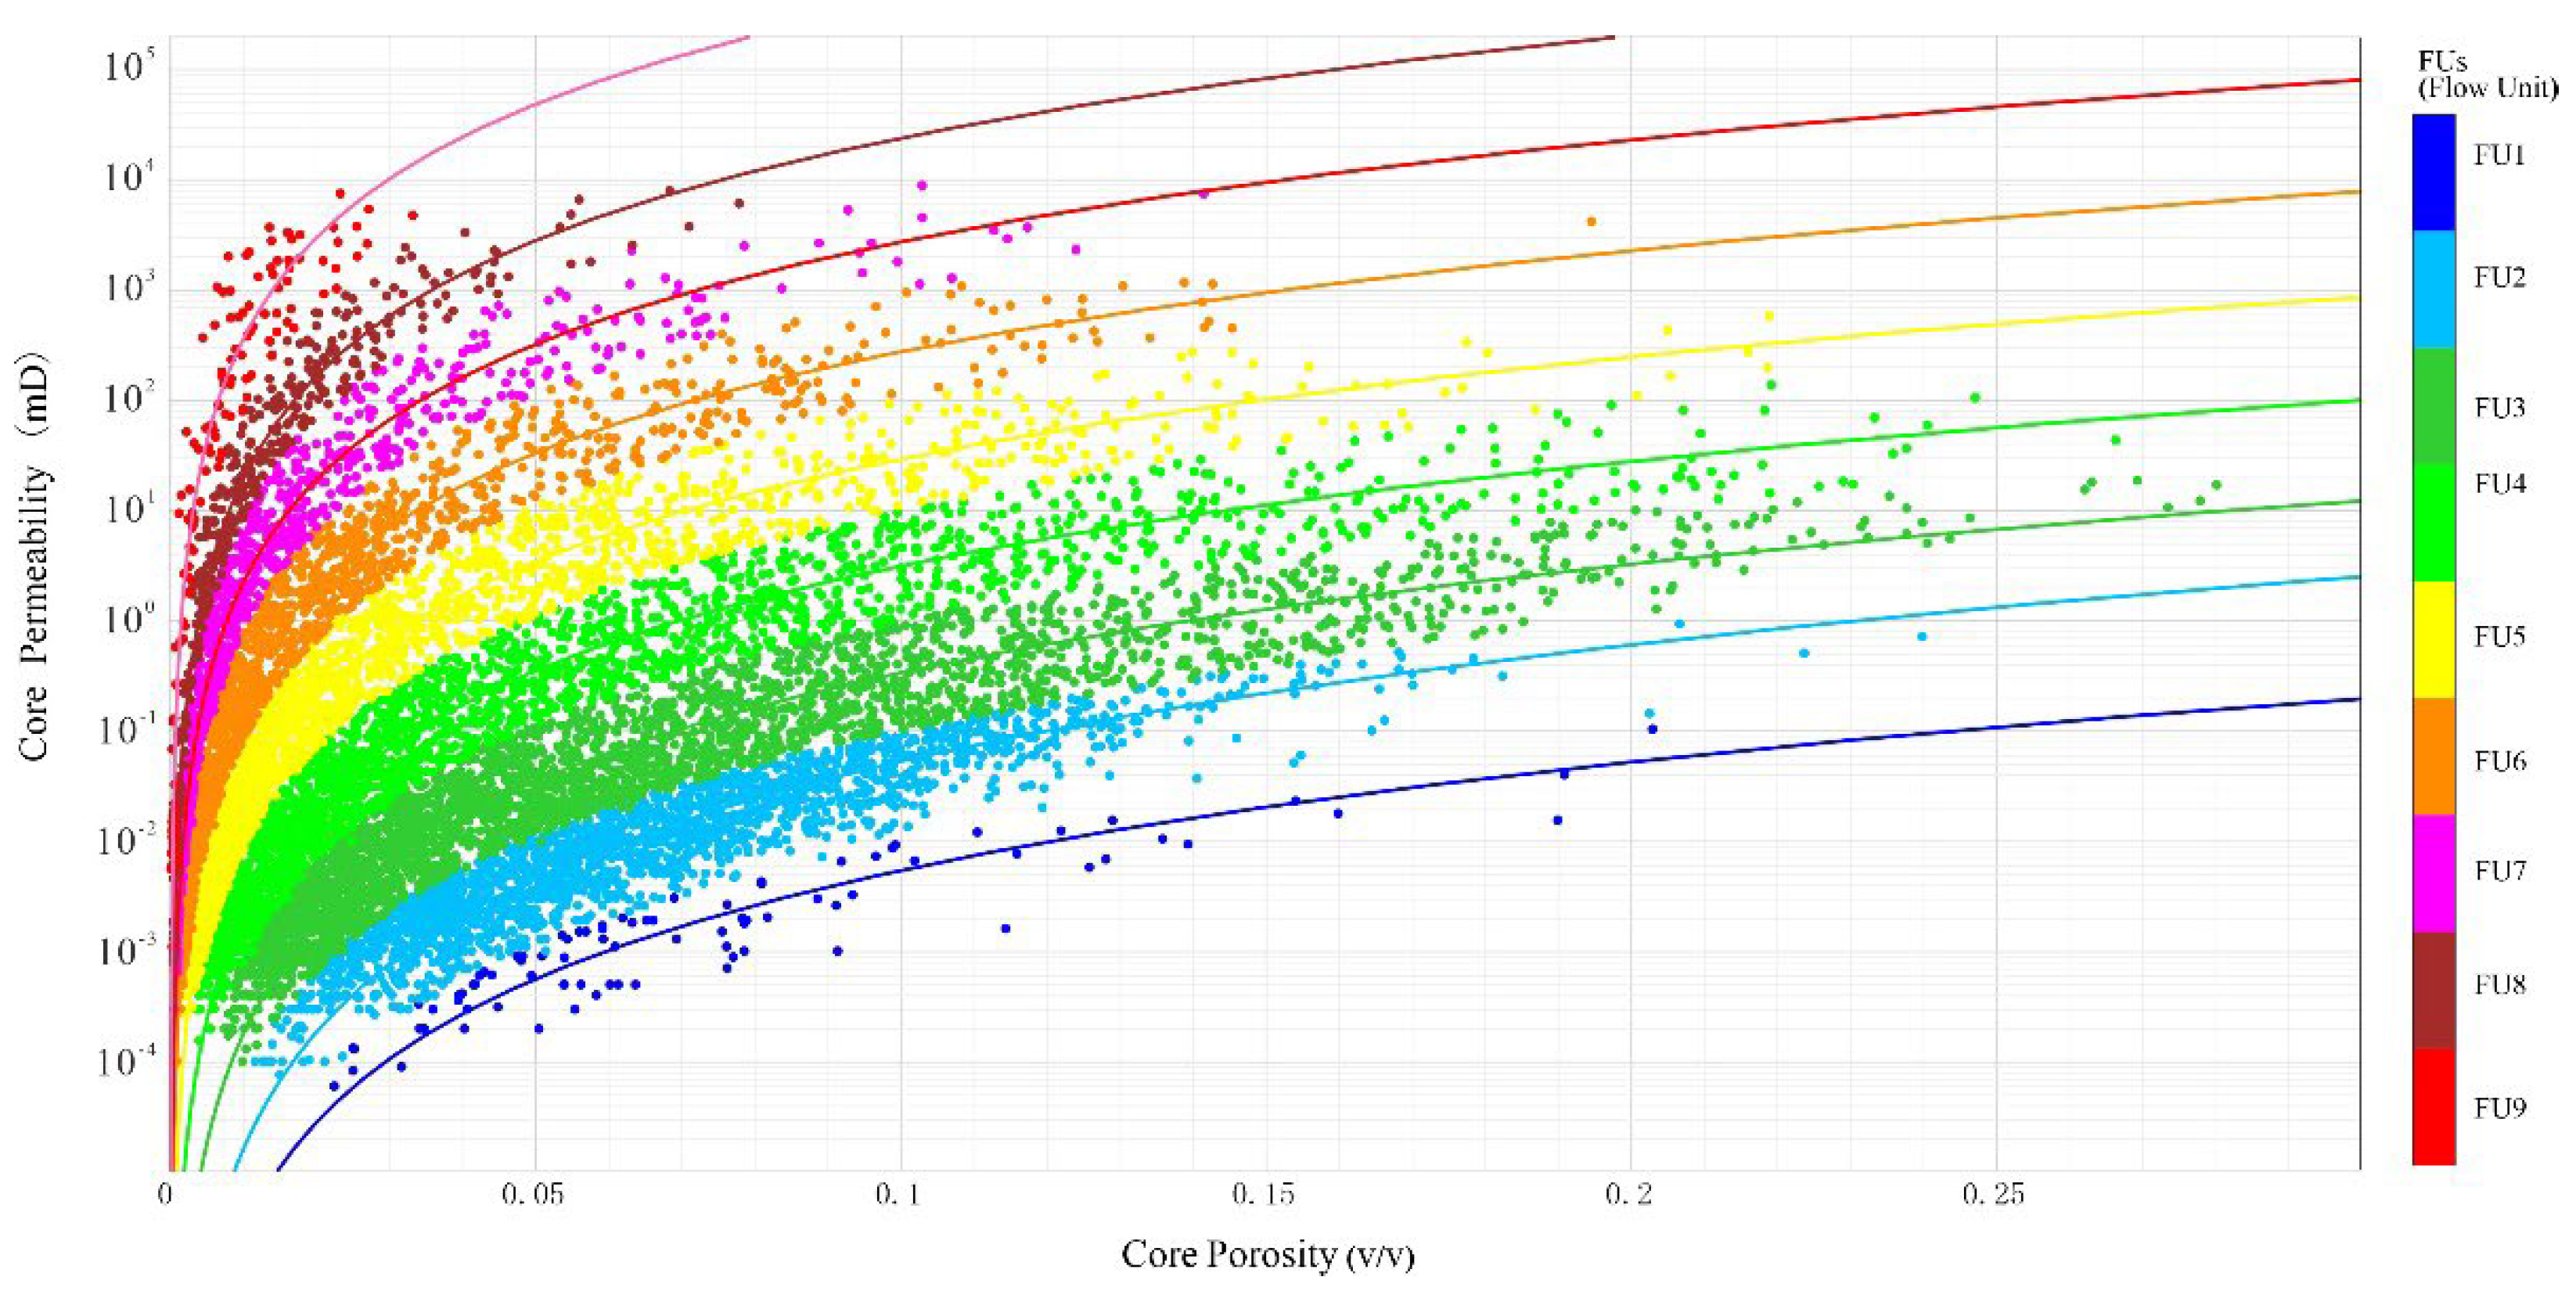
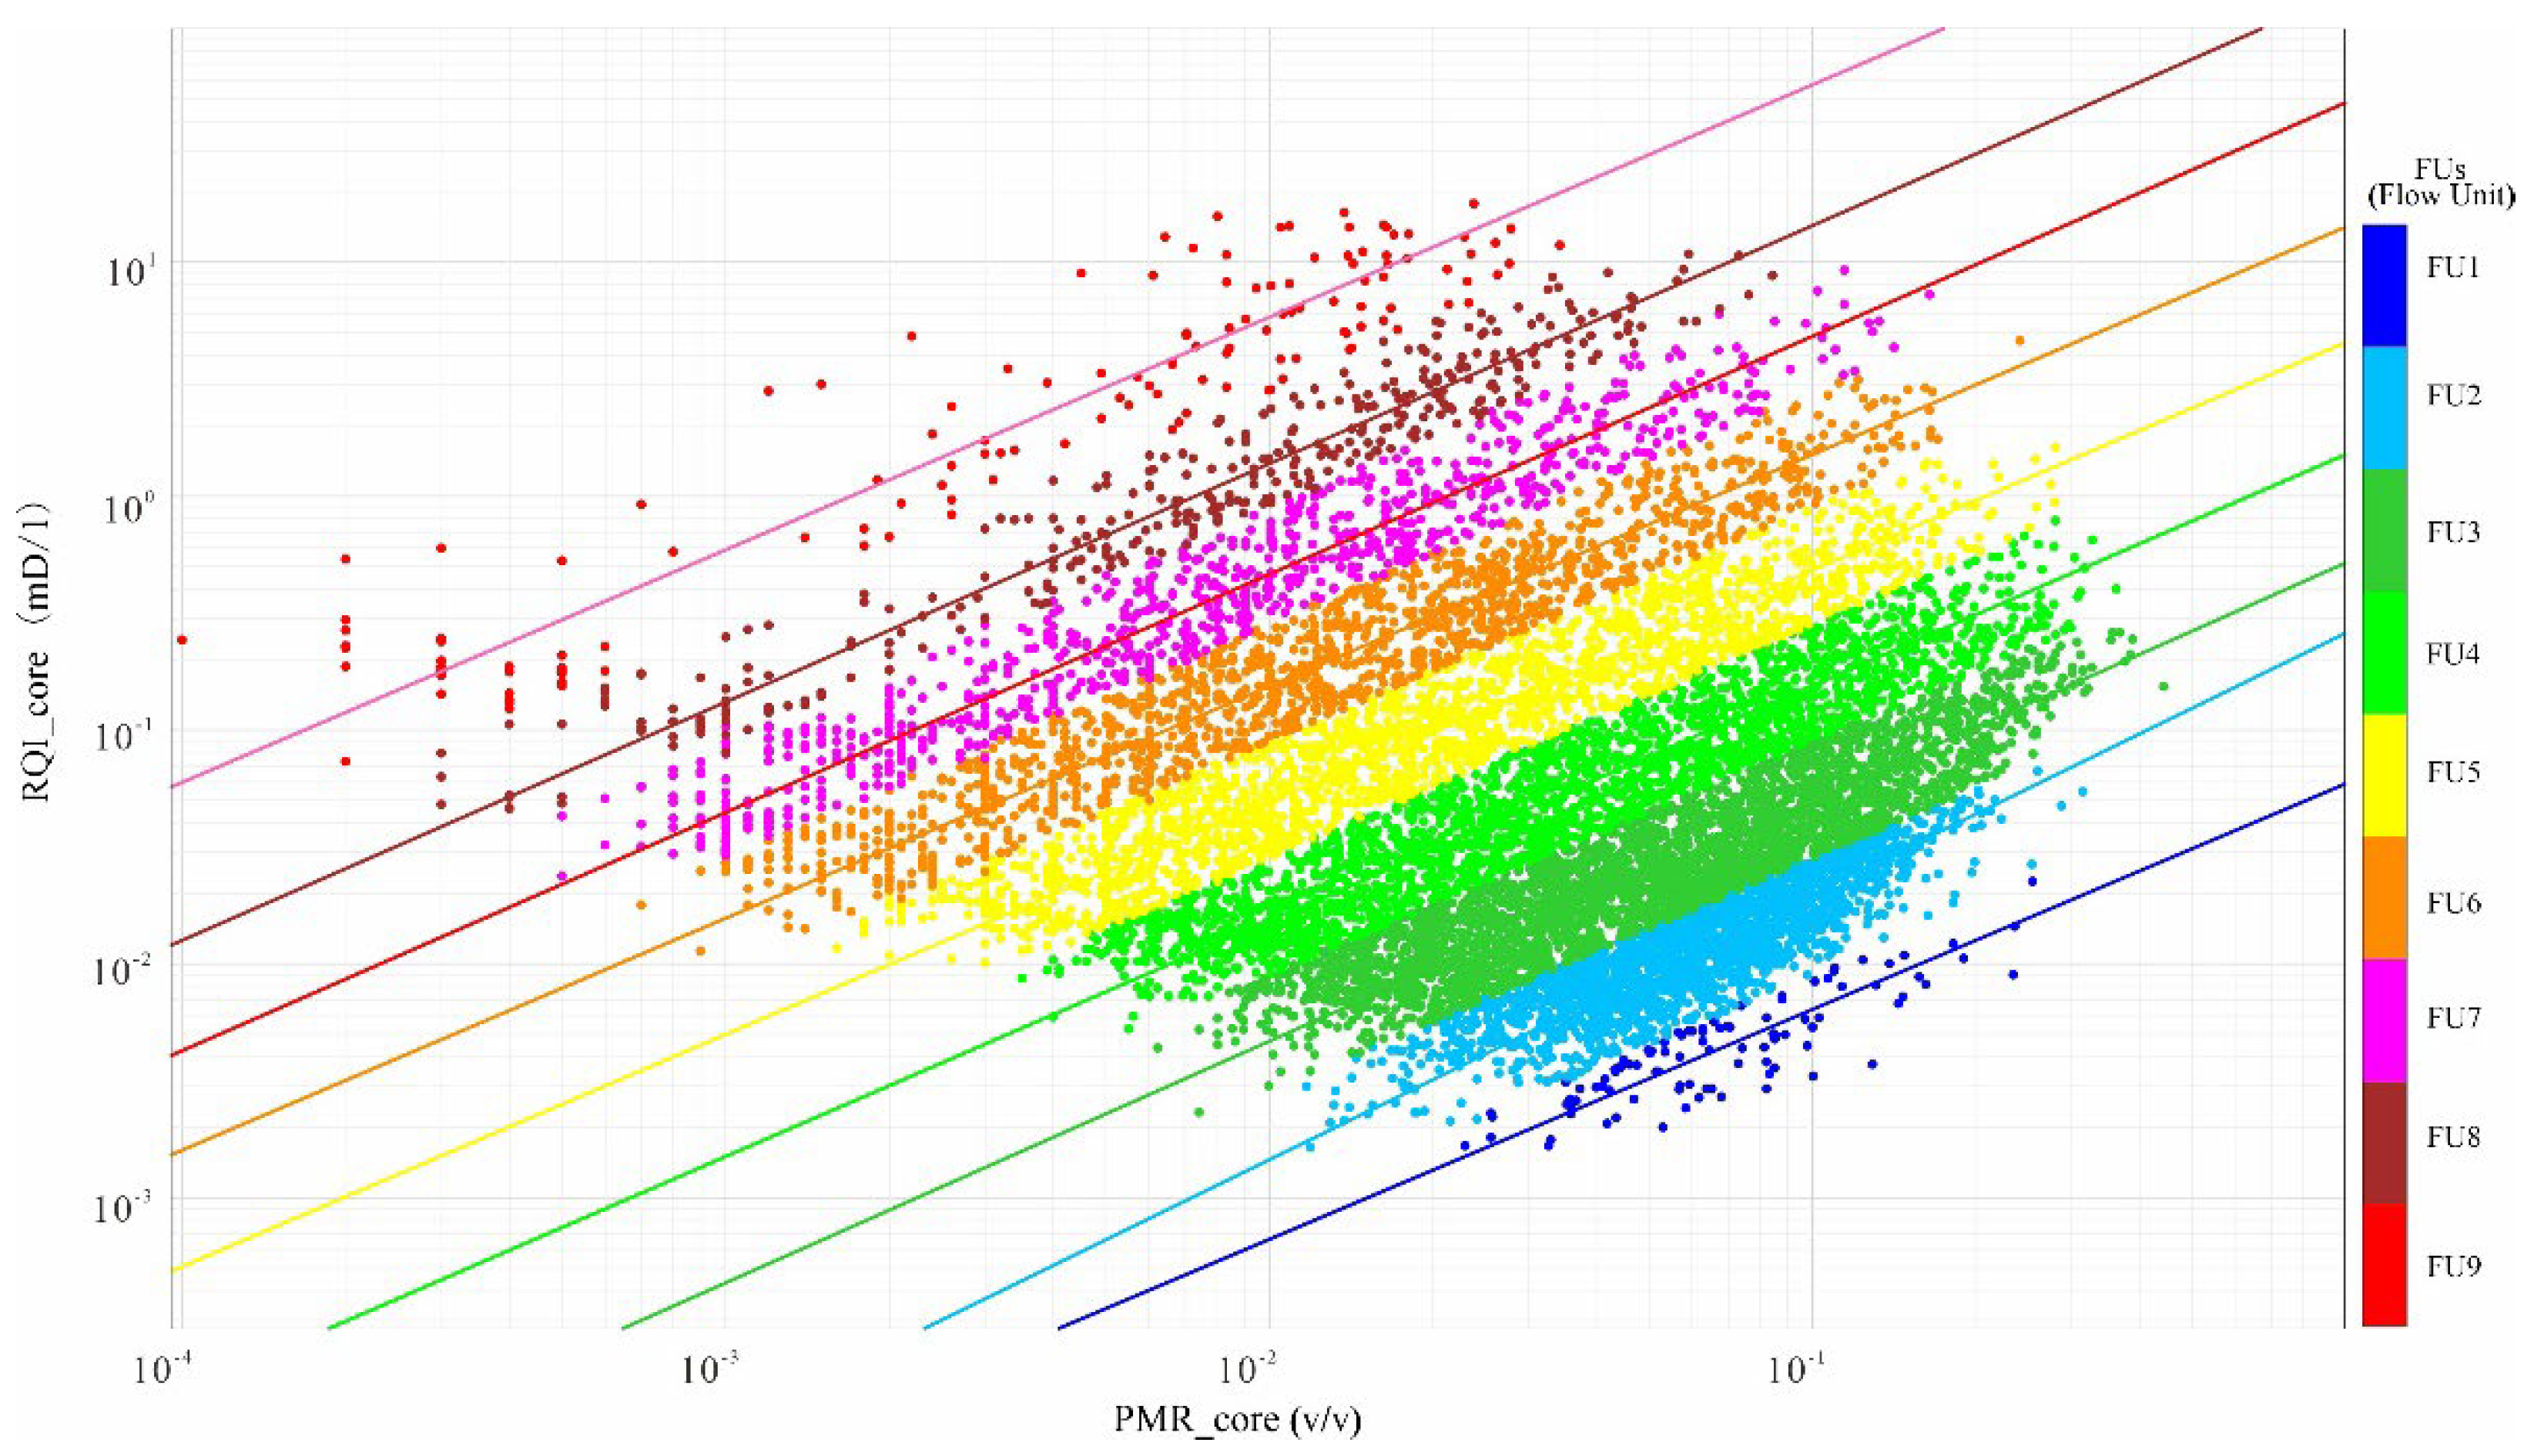
Generally, the quality and heterogeneity of carbonate reservoirs are affected by geological contexts such as sedimentation, diagenesis, and porosity characteristics, which affect the FZI value. Consequently, the reservoir quality can be quantitatively evaluated using the FZI method [29,30,31,32].

4.3.1. Flow Unit

Ideally, on a log-log crossplot of reservoir quality index (RQI) versus normalized porosity (PMR), sample points with similar FZI values should be plotted on the same straight line with a slope of 1, while sample points with different FZI values should be plotted on another parallel straight line. Samples on the same straight line constitute an independent flow unit due to similar pore throat properties. When PMR = 1, the intercept of each straight line represents the average FZI value of a flow unit [15,24].
The flow units of the Callovian-Oxfordian formation were identified using the data from 68 key wells. Figure 5 is the porosity−permeability crossplot of the identified nine flow units (FUs) and the RQI of different flow units as a function of PMR are shown in Figure 6. As shown in Figure 5 and the statistical parameters of different flow units (Table 2), the average porosity gradually decreases with the increase in the number of identified FUs; the average permeability gradually increases as the number of identified FUs increases, and the FZI gradually increases. Consequently, as the number of identified FUs increases, the storage capacity of the interval gradually decreases, whereas the flow capacity and reservoir quality improve. Furthermore, by classifying FUs in key wells, the longitudinal distribution of different reservoir qualities can be better evaluated.

4.3.2. Pore Types

The results of petrographic studies of cores and thin sections, as well as scanning electron microscopy (SEM) analysis, show that different pore types exist in the Callovian-Oxfordian formation (Figure 7), which can be classified into three types based on genesis:
(1)
Primary pore types
Primary pores refer to the pores formed during sedimentation, the primary pores in the studied formaton include interparticle pores, intraskeletal pores, coelomopore, shadow pores, bioboring pores, and intercrystalline pores (Figure 7A–F). An interparticle pore is the dominant pore type of packstone-grainstone of shoal facies (Figure 7A), which are mainly the pore spaces between beach facies bioclasts, pelletoids, and oolities. In terms of strata, interparticle pores are the dominant pore type of XVm and XVa1 layers. The intraskeletal and coelomopore pores are mainly developed in the biohermal facies (XVm) limestone in the platform margin facies belt, with a few intercrystalline pores, which is a pore type in the dolomitized packstone-grainstone main facies belt (Figure 7F), and is mainly developed in the Xvac layer and exposed environments such as the top of Sabkha and shoal facies; bioboring pores and shelter pores are less visible in the target interval.
(2)
Secondary pore types
Secondary pores refer to the pores formed after sediment deposition. The target stratum mainly includes intragranular dissolved pores, intergranular dissolved pores, intracrystal dissolution pores, mold pores, fractures, stylolites, and vugs (Figure 7G–L). Due to atmospheric freshwater dissolution, various dissolution pores were formed and mainly distributed in reef limestone, calcarenite, calcirudite, bioclastic limestone, and other grainstones in the reef (shoal) facies; burial dissolution shaped the vugs which are distributed along the fractures, mainly near the fracture zone; bioboring pores were usually filled and then dissolved (Figure 7E). Additionally, tectonic fractures of different scales (Figure 7K) are common in the outcrops, cores, and thin sections. Tectonic fractures greatly improved the reservoir quality (especially, the permeability of the mud dominated facies belt).
(3)
Micropores
Petrographic and SEM analysis indicate that there are micropores (including round, subrounded, oblique to rhombic micrite interparticle pores in limestones) and micro molds in micrites are only visible under the microscope in low-energy, mud-dominated facies belts (e.g., mud facies on the platform fore-edge downslope) of the Callovian-Oxfordian stage (Figure 7I). Such micropores can only be identified by SEM images, not in the routine petrological studies.

5. Discussion

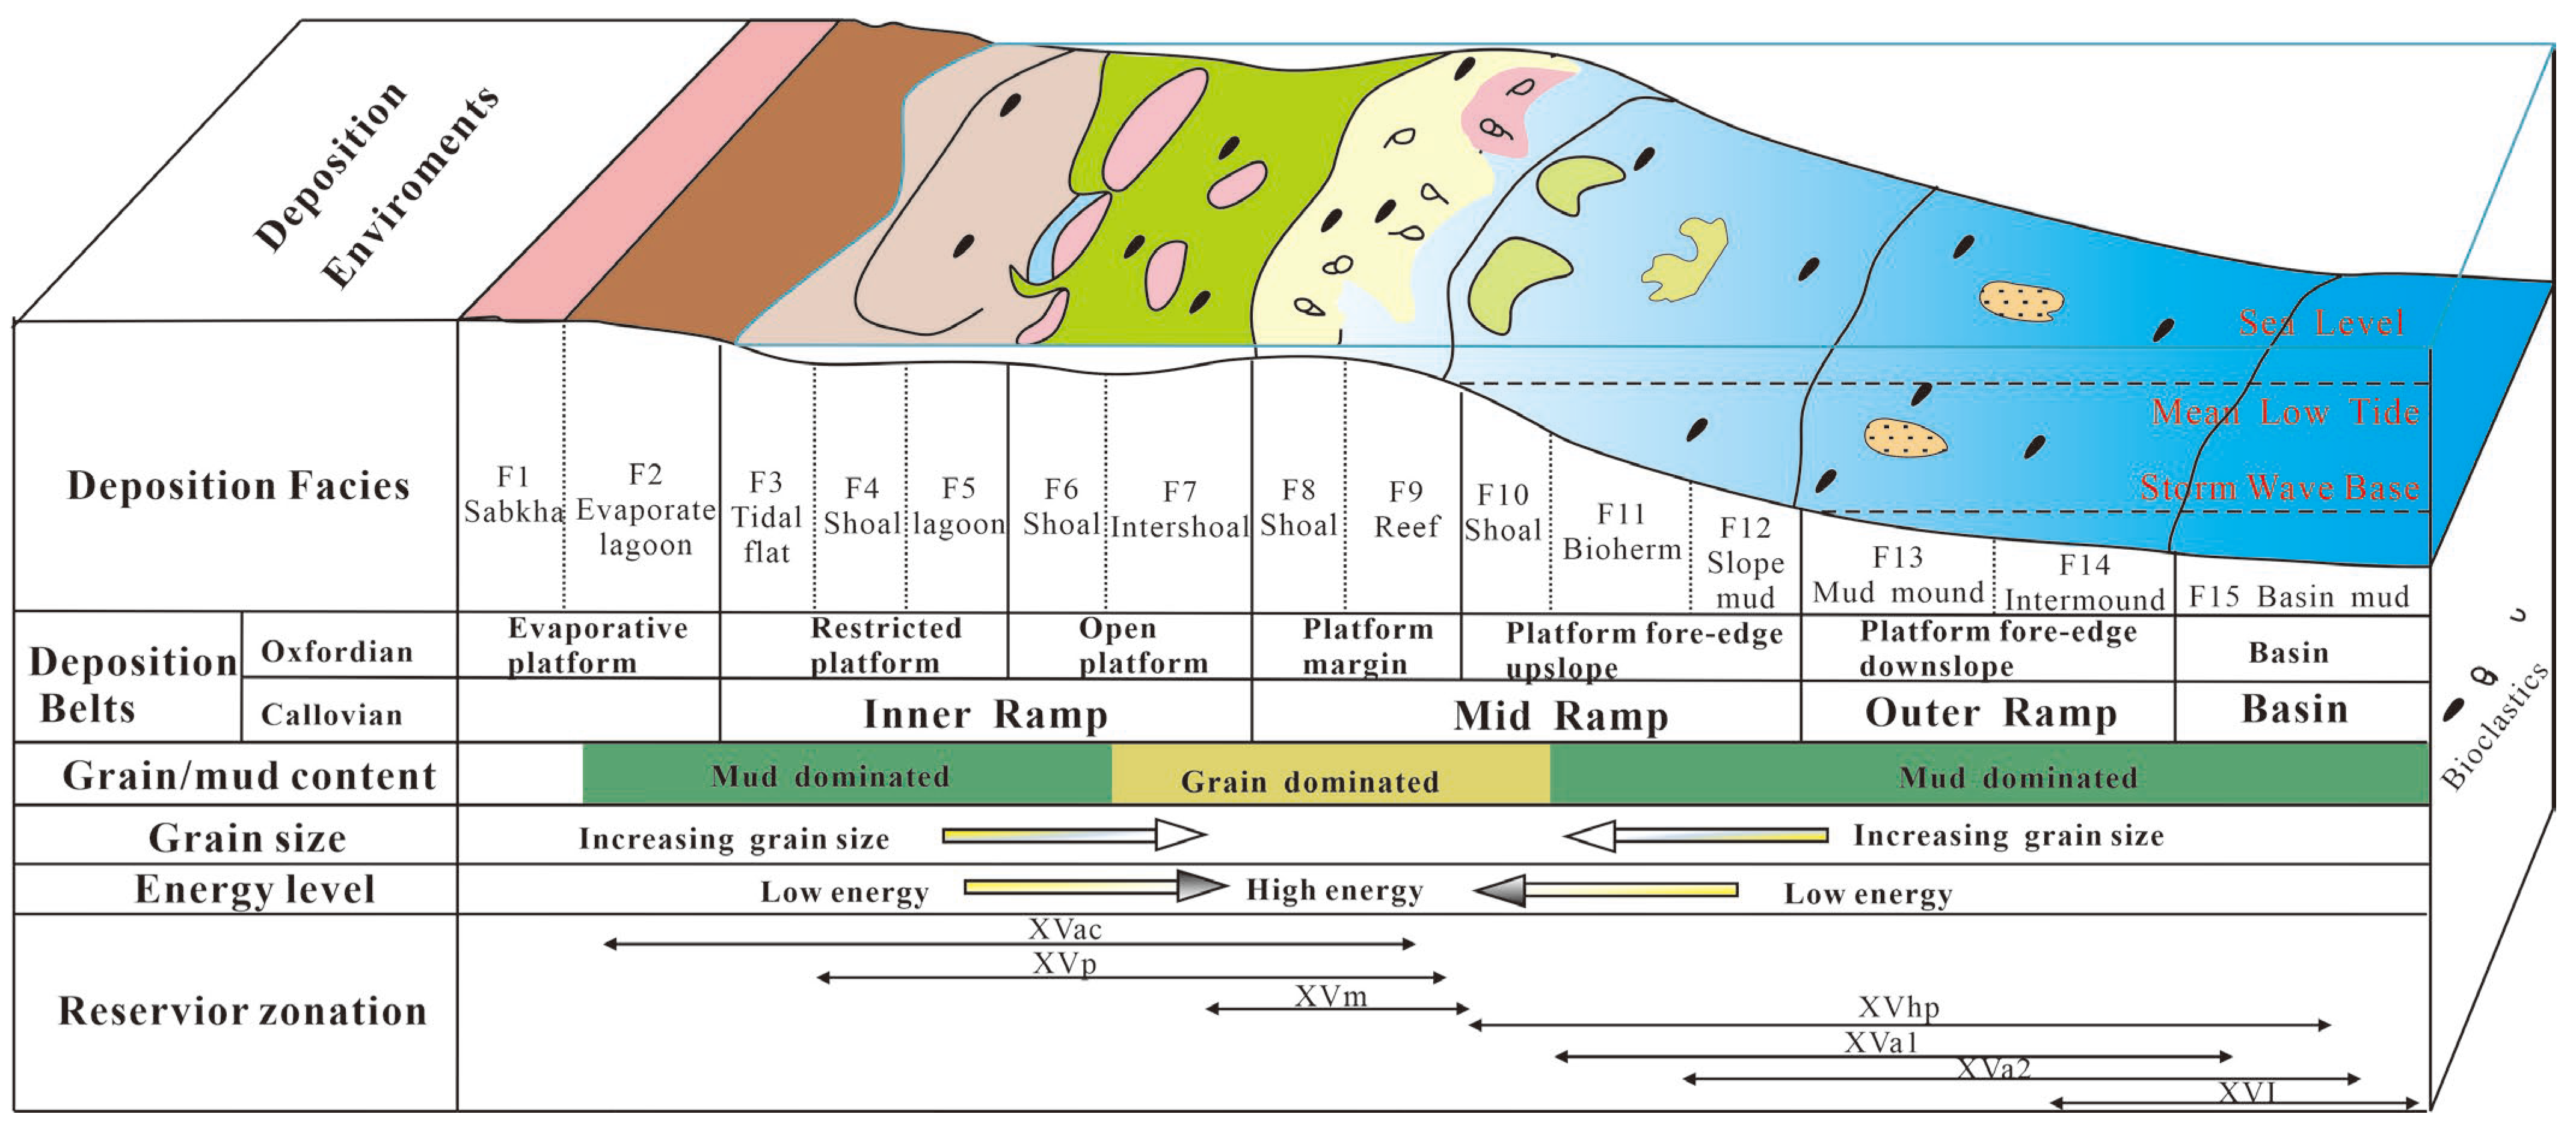
5.1. Sedimentary Model

The recognition of sedimentary facies helps to construct the sedimentary environment of the target intervals and to exhibit a sedimentary model. The sedimentary model helps guide the deployment of well locations during the early stages of oil and gas exploration and development, and to establish a more accurate fine geological model (especially the sedimentary facies model) during the middle and later stages to guide the efficient development of oil and gas reservoirs.
Through the analysis of sedimentary facies of Callovian-Oxfordian formation, 7 sedimentary facies belts and 15 sedimentary facies are identified; the conceptual sedimentary model is depicted in Figure 8. A relatively similar model was proposed in the Zagros area and other surrounding areas in the Middle East [33,34,35], which indicate a slightly sloping depositional setting and proposed a carbonate ramp conceptual model.
The area under study in the Callovian period is a carbonate gentle slope sedimentary system composed of an inner ramp, mid ramp, outer ramp, and basin facies belts. The inner ramp is composed of an internal closed inner ramp (Sabkha, tidal flat, and lagoon) and an external restricted inner ramp (shoal and restricted subtidal zone). The shoal at the high point of the ancient landform serves as the barrier between the inner and the outer zones. The water body of the inner ramp exposed above the sea level is blocked and highly evaporative with gypsum-bearing micrite deposited. The restricted inner ramp has a shallow water body, with poor circulation, and is dominated by micrite deposits. The mid ramp is divided into two zones: an inner zone (open subtidal zone) and an outer zone (shoal and reef flat). The water body in the inner zone has low-energy but good circulation, with prosperous organisms and low-energy bioclastic shoals deposited. The water body in the outer zone is highly energetic, with high-energy shoals or reef–shoal complexes developed. The outer ramp is divided into two zones: an inner zone and an outer zone. The inner zone is located above the lowest storm surface and is dominated by storm action induced packstone deposition. The outer zone is in a low-energy environment, with wackstone and lime-mud mounds developed. The basin facies is located below the lowest storm surface, with marlstone, calcareous mudstone, and mudstone deposited.
In the early Oxfordian period, under regional transgression, the outer zone of the mid ramp and outer ramp in the Callovian period were gradually submerged, and the inner ramp—mid ramp gradually developed into an edged shelf-type carbonate platform (this model is similar to Wilson’s platform model). The evaporative platform facies belt is located in the supratidal low-energy zone, which is often exposed above the sea surface and has poor water circulation. It can be classified into two sedimentary facies: Sabkha and evaporative lagoon. The restricted platform facies zone is located in the intertidal-subtidal low-energy zone, with tidal flat facies, low-energy shoal facies, and lagoon facies developed. The water body in the open platform facies belt has good circulation, with the intra-platform bioclastic shoals and inter-shoal facies developed. The platform margin facies zone is located in the subtidal high-energy zone, with reef facies and high-energy bioclastic shoal facies developed. The upslope of platform front is located below the wave base, with point reefs developed locally. The reef shoals and the inter-reef shoals sedimentary landform are quite different. The downslope of platform front and the basin facies have quiet water bodies and are characterized by low-energy micrite, wackstone, and mudstone deposition.

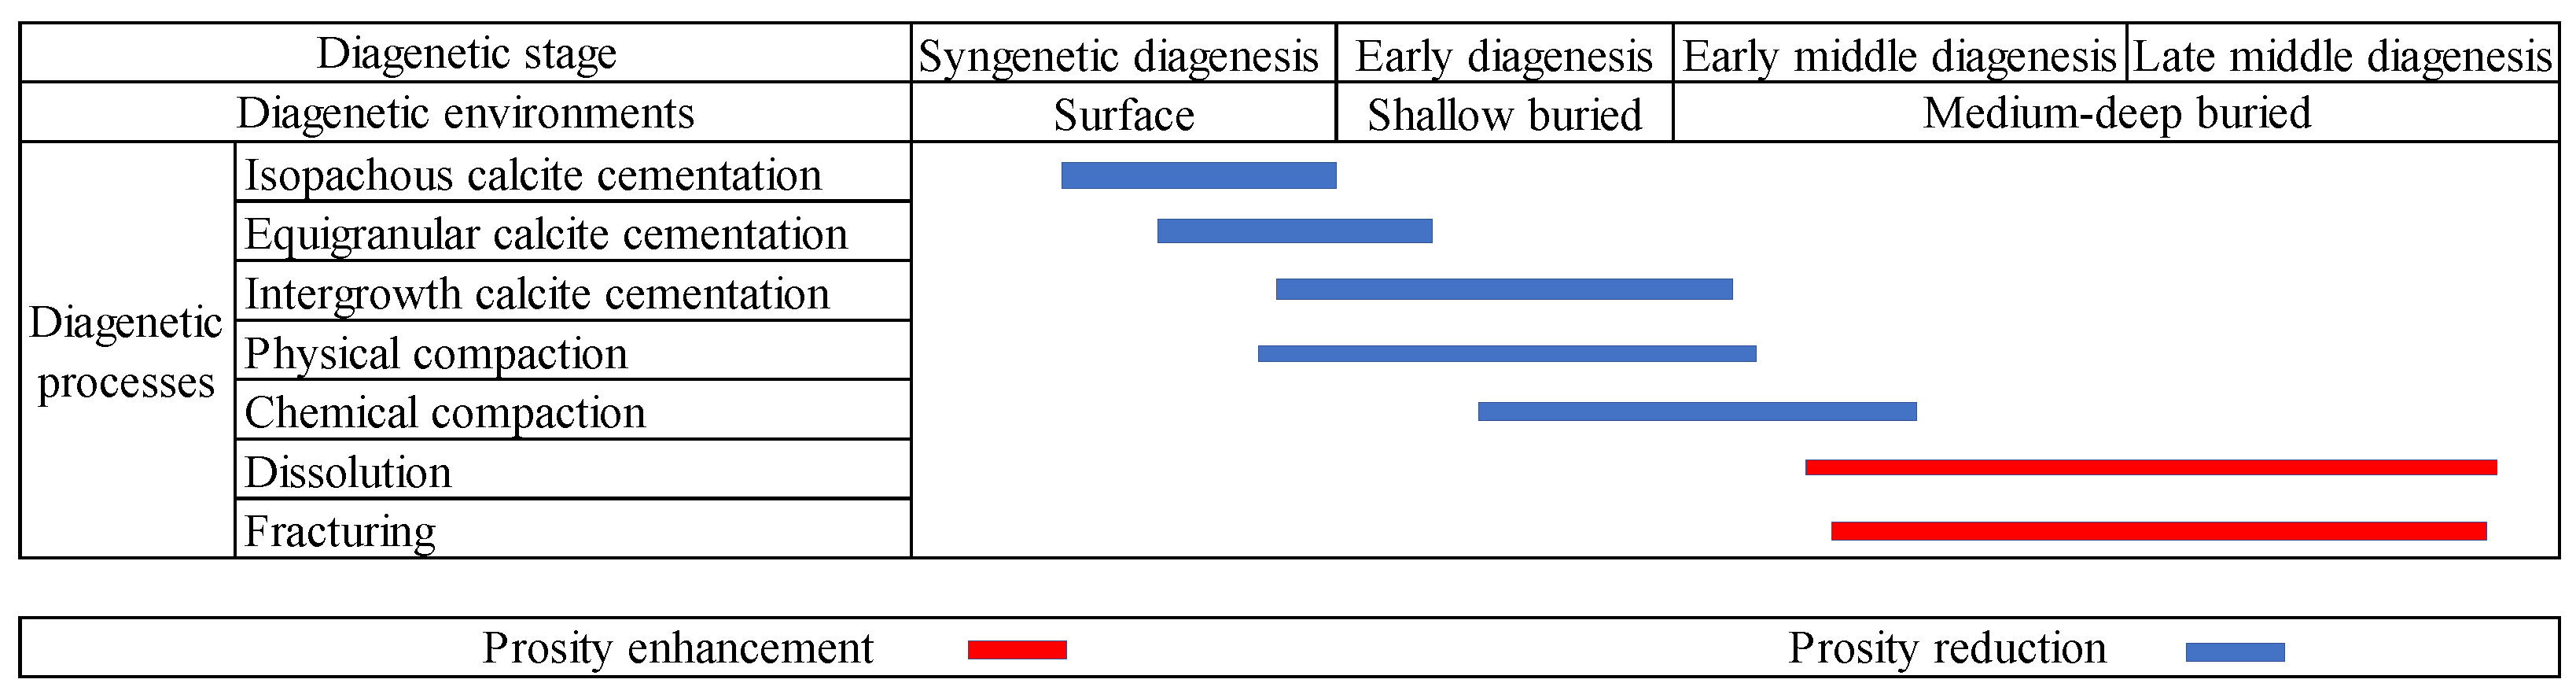
5.2. Diagenesis History

By establishing and interpreting the diagenetic sequence based on the petrographic characteristics of diagenesis and its relationship, the main diagenesis process of the Callovian-Oxfordian stage can be summarized as follows (Figure 9):
(1)
Syngenetic diagenensis: In the sedimentary environment of biological reef and shoal facies with high-energy, the porosity was reduced and the reservoir performance deteriorated due to edged asaphopsoides isopachous calcite cementation and equigranular calcite cementation. The main pore types at this stage are the remaining primary pores like interparticle pores, intraskeletal and coelomopore pores.
(2)
Early diagenesis: This stage is characterized by diagenetic processes such as mechanical compaction and chemical compaction (pressure solution), equigranular calcite cementation, and intergrowth calcite cementation. The reservoir is dominated by the remaining primary pores, as the number of primary pores was severely reduced.
(3)
Early middle diagenesis: At this stage, intergrowth calcite cementation occurred, and chemical compaction was further strengthened, but local strong diagenetic fracturing and dissolution improved the reservoir quality. The reservoir space is still dominated by remaining primary pores, with a few secondary pores.
(4)
Late middle diagenesis: The main diageneses are dissolution and fracturing, as well as secondary pores such as intergranular dissolution pores and intragranular dissolution pores, mold pores, intercrystalline dissolution pores, vugs, and fractures were widely developed.
These results have been similarly reported in previous studies. As Lee et al. [36] noted, the mechanical compaction can reduce porosities to 30% in carbonates, which occurred the depth shallower than 750 m and before major chemical compaction. Tavakoli et al. [37,38] pointed out the diagenetic heterogeneity and explained the similar influence on reservoir performance in different sedimentary environments.

5.3. Controlling Factors of the Reservoir Quality

Using a comprehensive analysis of petrographic and petrophysical data, we evaluated the quality of the Callovian-Oxfordian reservoir on the Right Bank of Amu Darya. To establish a reliable relationship between physical property analysis data (porosity and permeability) and lithofacies data, five reservoir types (RF1–RF5) were identified based on facies characteristics (such as rock texture), dominant diagenesis, and pore types; the distribution and average values for porosity, permeability, RQI, porosity to matrix ratio (PMR), and FZI of different reservoir facies (RFs) were recorded (Figure 10, Table 3).
As depicted in Figure 10 and Table 3, From RF1 to RF4, the average porosity, permeability, and RQI gradually decrease, indicating that the reservoir storage capacity and flow capacity gradually decrease, and the reservoir quality gradually deteriorates. An exception occurs in the statistical values of RF5, wherein its porosity and PMR are lower than those of RF1, RF2, RF3, and RF4, indicating that RF5 has a low storage capacity (even no storage capacity at all), whereas its permeability and RQI are higher than those of RF2, RF3, and RF4. This indicates that its flow capacity is higher than those of the three reservoir facies.
Based on the statistics presented above, we analyzed the sedimentological characteristics of different reservoir facies (RF1–RF5) of the Callovian-Oxfordian formation, their corresponding relation with FUs, and their distribution characteristics (Figure 11 and Figure 12).

5.3.1. Dissolved Grain-Dominated Reservoir Facies—RF1

This reservoir facies (RF1) is mainly distributed in the high-energy shoal and biohermal facies in the inner ramp and mid ramp facies belts, and the main lithology is grainstone or packstone with bioclasts, oolites, and so on. Since this reservoir facies is usually developed near the sequence boundary and has undergone strong dissolution, it has pore types such as intragranular dissolution pores, intergranular dissolution pores, and mold pores formed by atmospheric dissolution (Figure 11). According to the statistical results of FZI, porosity, and permeability (Table 3, Figure 10 and Figure 11), RF1 mainly corresponds to three flow units, namely, FU4, FU5, and FU6, with a high storage capacity and flow capacity, an average porosity of 14.3% and an average permeability of 22.5 mD. This kind of reservoir facies is mainly distributed in the XVm layer of the Callovian-Oxfordian formation, which has a thickness of about 30 m in general. When it is at the platform margin, the thickness can reach 70–80 m (Figure 11), followed by XVp and XVa1 layers, with a thickness of 5–8 m. RF1 mainly distributed in the western part of the study area and has good lateral continuity. The reservoir facies is characterized by good connectivity, abundant reserves, high single-well and stable production.

5.3.2. Compacted/Cemented Grain-Dominated Reservoir Facies—RF2

The reservoir facies (RF2) is mainly composed of packstone and grainstone deposited on a restricted platform, open platform, and platform fore-edge upslope. Generally, it is far away from the sequence boundary and has been subjected to strong cementation and mechanical compaction, with weak dissolution. The remaining interparticle pores are the most common pore type. Although the reservoir facies is dominated by grainstone with high primary porosity, the pore throat radius is small and the permeability is low due to strong mechanical compaction. In addition, as the calcite cement plays an important blocking role in the pore space and pore throat size, the quality of the RF2 reservoir is lower than that of RF1 (Table 3), which is characterized by a medium FZI, porosity, and permeability (Table 3 and Figure 10). The average porosity is 11.2%, the average permeability is 0.5 mD and is mainly composed of flow units FU3 and FU4. Generally, RF2 has a higher storage capacity, but its flow capacity is lower than that of RF1. It is mainly distributed in XVp and XVhp layers with a small thickness and sporadic distribution. For example, the RF2 thickness of Well S1 is 5.4 m (Figure 11) and that of Well C1 is 12.4 m (Figure 12). RF2 mainly distributed in the western part of the study area, it has poor lateral continuity and planar distribution.

5.3.3. Packstone/Wackstone Dominated Reservoir Facies—RF3

The reservoir facies (RF3) mainly consists of bioherm (F11), mud mound (F13), and inter-shoal (F7) facies of open platform deposited in the upslope and downslope of the platform front-edge. Since the reservoir facies is less affected by the dissolution of atmospheric fresh water, only a few dissolution pores are developed. Although the occasionally developed mold pores increased porosity, they had little impact on permeability since most of the mold pores are isolated pores, leaving the porosity and permeability of packstone and wackstone relatively low (the average porosity is 5.9%, and the average permeability is 0.016 mD). The RF3 mostly associated with FU2 and FU3 (Table 2 and Table 3). In the open platform or platform margin facies belt, the thickness of a single layer of the RF3 is small, usually 3–5 m (Figure 11); in the slope facies at platform front-edge, the thickness of a single layer of the RF3 is relatively large, usually 20–50 m (Figure 12). RF3 mainly distributed in the middle part of the study area and it has poor lateral continuity.

5.3.4. Microporous Mudstone-Dominated Reservoir Facies—RF4

The reservoir facies (RF4) is widely distributed, especially in the central and eastern part of the basin, including mudstone-dominated sedimentary facies in the inner ramp, mid ramp, and outer ramp, and are mainly distributed in the F12–F15 facies, and the XVhp, XVz, and XVI layers. It is difficult to observe the macropore type of these facies on cores and only a few micropores are visible by microscopic or SEM image. Additionally, due to diagenetic processes such as fine-grained dolomitization and anhydrite cementation, the porosity and permeability of these mud-dominated facies are usually further reduced, making it difficult to significantly improve the reservoir quality even if there is dissolution. Consequently, the RF4 is characterized by low porosity (average porosity of 1.3%) and low permeability (average permeability of 0.006 mD) and has the lowest reservoir quality and poor lateral continuity. The thickness of a single layer is generally 2–3 m and is mainly composed of flow units FU1 and FU2 (Figure 10, Figure 11 and Figure 12). Due to the poor storage and flow capacity, the RF4 is mainly an interlayer that blocks the fluid flow in the Callovian-Oxfordian stage.

5.3.5. Fracturing Mudstone-Dominated Reservoir Facies—RF5

RF5 is mainly developed in sedimentary facies belts with high mud content and low-energy environments, such as slope mud (F12) on platform fore-edge upslope and slope mud (F14) on platform fore-edge upslope. The main lithology is mudstone. The most prominent characteristic of RF5 is that the permeability of rocks is significantly increased due to the fracturing in the late middle diagenetic stages (Figure 9), thus greatly enhancing the flow capacity of the reservoir. The average porosity is 1.1% and the average permeability is 1.82 mD. It is mainly distributed in the XVhp, Z, and XVI layers of the Callovian-Oxford formation. When compaction and cementation dominate and there is no fracturing, the RF5 corresponds to flow unit FU1 with a low reservoir quality, and is mainly an interlayer; when both fracturing and dissolution occur, RF5 corresponds to FU2; when many open microfractures are developed, the permeability of this RF is greatly improved, and the corresponding FUs are FU8 and FU9, which mainly form flow channels for fluid (Figure 11 and Figure 12). RF5 mainly distributed in the fracture development area, especially in the eastern part of the study area which is strongly affected by tectonic movement. The lateral continuity mainly depends on the development of natural fractures.

6. Conclusions

Through a comprehensive evaluation of sedimentary facies, diagenesis, and reservoir quality of the Callovian-Oxfordian formation of the Middle and Lower Jurassic series on the right bank of the Amu Darya River, the following main conclusions are drawn:
(1)
Through facies analysis, we believe that the Callovian period is a gentle slope carbonate platform sedimentary model, which mainly includes four sedimentary facies belts, namely, the inner ramp, mid ramp, outer ramp, and basin. The Oxfordian period is an edged shelf-type carbonate platform sedimentary model, which mainly includes 15 sedimentary facies deposited in seven sedimentary facies belts, namely, the evaporative platform, restricted platform, open platform, platform margin, platform fore-edge upslope, platform fore-edge downslope, and basin facies.
(2)
The diagenesis fields of carbonate rocks in the Callovian-Oxfordian stage include atmospheric freshwater, shallow burial, and medium-deep burial environments. The main diagenetic processes include four-stage cementation, mechanical compaction, chemical compaction (pressure solution), dissolution, and fracturing, among which the dissolution and fracturing are the main processes that improve reservoir quality.
(3)
The main primary and secondary pore types in the target formation were identified; nine FUs were determined using the flow unit index method; five reservoir facies, as well as their reservoir quality and variation characteristics, were identified according to rock texture and flow characteristics, diagenesis, and pore types.
(4)
The reservoir quality evaluation revealed that the reservoir facies with the highest reservoir quality is RF1, which is the highest storage capacity and has strong flow capacity. Its corresponding flow units are FU4, FU5, and FU6. The reservoir facies with the second highest reservoir quality is RF2, and its corresponding flow units are FU3 and FU4, which are less distributed in the target intervals. RF4 has the lowest reservoir quality, and its corresponding flow units are FU1 and FU2, which mainly form an interlayer that blocks the fluid flow. Despite its very low storage capacity, RF5 serves mainly as a flow channel for the fluid in the Callovian-Oxfordian Stage due to the development of micro-fractures.

Author Contributions

Data curation, P.C.; Investigation, M.C.; Methodology, L.Z.; Software, H.S.; Validation, C.G.; Writing—original draft, Y.X.; Writing—review & editing, H.W. and W.Y. All authors have read and agreed to the published version of the manuscript.

Funding

This work was supported by PetroChina Science and Technology Major Project (2021DJ3301). The authors would like to thank the management of RIPED for authorizing the presentation of this work.

Conflicts of Interest

The authors declare no conflict of interest.

References

  1. Ulmishek, G.F. Petroleum Geology and Resources of the Amu Darya Basin, Turkmenistan, Uzbekistan, Afghanistan and Iran; USGS: Reston, VA, USA, 2004; pp. 1–38.
  2. Xu, S.; Wang, S.; Sun, X. Petroleum geology and resource potential. Oil Forum 2007, 6, 31–38. [Google Scholar]
  3. Zhang, B.; Zheng, R.; Liu, H. Characteristics of Carbonate Reservoir in Callovian-Oxfordian of Samandepe Gas field Turkmenistan. Acta Geol. Sin. 2010, 84, 117–125. [Google Scholar]
  4. Zheng, R.; Liu, H.; Wu, L. Geochemical characteristics and diagenetic fluid of the Callovian-Oxfordian carbonate reservoirs in Amu Darya basin. Acta Petrol. Sin. 2012, 28, 961–970. [Google Scholar]
  5. Wen, H.; Gong, B.; Zheng, R. Deposition and Diagenetic System of Carbonate in Callovian-Oxfordian of Samandepe Gas field, Turkmenistan. J. Jilin Univ. Earth Sci. Ed. 2012, 42, 991–1002. [Google Scholar]
  6. Liu, S.; Zheng, R.; Yan, W. Characteristics of Oxfordian carbonate reservoir in Agayry area, Amu Darya Basin. Lithol. Reserv. 2012, 24, 57–63. [Google Scholar]
  7. Dong, X.; Zheng, R.; Wu, L. Diagenesis and porosity evolution of carbonate reservoirs in Samandepe Gas Field, Turkmenistan. Lithol. Reserv. 2010, 22, 54–61. [Google Scholar]
  8. Xu, W.; Zheng, R.; Fei, H. The sedimentary facies of Callovian-Oxfordian Stage in Amu Darya basin, Turkmenistan. Geol. China 2012, 39, 954–964. [Google Scholar]
  9. Xu, W.; Zheng, R.; Fei, H. Characteristics and timing of fractures in the Callovian-Oxfordian boundary of the right bank of the Amu Darya River Turkmenistan. Nat. Gas Ind. 2012, 32, 33–38. [Google Scholar]
  10. Wang, L.; Zhang, Y.; Wu, L. Characteristics and identification of bioherms in the Amu Darya Right Bank Block, Turkmenistan. Nat. Gas Ind. 2010, 30, 30–33. [Google Scholar]
  11. Zeng, Z.; Chen, F.; Chen, Z. Forward Modeling of Callovian-Oxfordian Reefs of Upper Jurassic in AS Block of Amu Darya Right Bank in Turkmenistan. Xinjiang Pet. Geol. 2011, 32, 201–203. [Google Scholar]
  12. Zhang, W.; Liu, X.; Zhang, M. Forward Seismic Modeling and its Response of Point reef Reservoir in Amu Darya Area of Turkmenistan. J. Oil Gas Technol. 2011, 33, 72–75. [Google Scholar]
  13. Lucia, F.J. Carbonate Reservoir Characterization: An Integrated Approach; Springer Science & Business Media: Berlin/Heidelberg, Germany, 2007. [Google Scholar]
  14. Ahr, W.M. Geology of Carbonate Reservoirs: The Identification, Description and Characterization of Hydrocarbon Reservoirs in Carbonate Rocks; John Wiley & Sons: Hoboken, NJ, USA, 2011. [Google Scholar]
  15. Mehrabi, H.; Ranjbar-Karami, R.; Roshani-Nejad, M. Reservoir rock typing and zonation in sequence stratigraphic framework of the Cretaceous Dariyan Formation, Persian Gulf. Carbonates Evaporites 2019, 34, 1833–1853. [Google Scholar] [CrossRef]
  16. Mehrabi, H.; Bahrehvar, M.; Rahimpour-Bonab, H. Porosity evolution in sequence stratigraphic framework: A case from Cretaceous carbonate reservoir in the Persian Gulf, southern Iran. J. Petrol. Sci. Eng. 2021, 196, 107699. [Google Scholar] [CrossRef]
  17. Lv, G.; Liu, H.; Zhang, B.; Deng, M.; Zhang, X. Exploration and Development of Large Sub-Salt Carbonate Gas Fields on Right Bank of Amu Darya; Science Press: Beijing, China, 2013. [Google Scholar]
  18. Dunham, R.J. Classification of carbonate rocks according to their depositional texture. In Classification of Carbonate Rocks; Ham, W.E., Ed.; American Association of Petroleum Geologists Memoir: Tulsa, OK, USA, 1962; Volume 1, pp. 108–121. [Google Scholar]
  19. Embry, A.F.; Klovan, J.E. A late devonian reef tract on northeastern banks Island, NWT. Can. Pet. Geol. Bull. 1971, 19, 730–781. [Google Scholar]
  20. Flügel, E. Microfacies of Carbonate Rocks: Analysis, Interpretation and Application; Springer Science & Business Media: Berlin/Heidelberg, Germany, 2010. [Google Scholar]
  21. Amaefule, J.O.; Altnubay, M.; Tiab, D.; Kersey, D.G.; Keeland, D.K. Enhanced reservoir description: Using core and log data to identify hydraulic (flow) units and predict permeability in un-cored intervals/wells. Soc. Pet. Eng. 1993, 26436, 1–16. [Google Scholar]
  22. Kozeny, J. Ber Kapillare Leitung des Wassers im Boden, Sitzungsberichte; Royal Academy of Science Vienna: Vienna, Austria, 1927; Volume 136, pp. 271–306. [Google Scholar]
  23. Carman, P.C. Fluid flow through granular beds. Trans. Inst. Chem. Eng. 1937, 15, 150–166. [Google Scholar] [CrossRef]
  24. Gomes, J.S.; Riberio, M.T.; Strohmenger, C.J.; Negahban, S.; Kalam, M.Z. Carbonate Reservoir Rock Typing the Link between Geology and SCAL; SPE: Abu Dhabi, United Arab Emirates, 2008; p. 118284. [Google Scholar]
  25. Rahimpour-Bonab, H.; Mehrabi, H.; Navidtalab, A.; Izadi-Mazidi, E. Flow unit distribution and reservoir modeling in Cretaceous carbonates of the Sarvak Formation, Abteymour Oilfield, Dezful embayment, SW IRAN. J. Pet. Geol. 2012, 35, 1–24. [Google Scholar] [CrossRef]
  26. Mehrabi, H.; Rahimpour-Bonab, H.; Enayati-Bidgoli, A.H.; Esrafili-Dizaji, B. Impact of contrasting paleoclimate on carbonate reservoir architecture: Cases from arid Permo-Triassic and humid Cretaceous platforms in the south and southwestern Iran. J. Pet. Sci. Eng. 2015, 126, 262–283. [Google Scholar] [CrossRef]
  27. Tiab, D.; Donaldson, E.C. Petrophysics: Theory and Practice of Measuring Reservoir Rock and Fluid Transport Properties, 2nd ed.; Gulf Professional Publishing, Elsevier: Amsterdam, The Netherlands, 2004. [Google Scholar]
  28. Deng, Y.; Wang, Q.; Cheng, X.; Wu, L.; Zhao, C.; Chen, R. Origin and distribution laws of H2S in carbonate gas reservoirs in the Right Bank Block of the Amu Darya River. Nat. Gas Ind. 2011, 31, 21–23. [Google Scholar]
  29. Burrowes, A.; Moss, A.; Sirju, C.; Pritchard, T. Improved Permeability Prediction in Heterogeneous Carbonate Formations; Society of Petroleum Engineers: Barcelona, Spain, 2010; p. 131606. [Google Scholar]
  30. Enayati-Bidgoli, A.H.; Rahimpour-Bonab, H.; Mehrabi, H. Flow unit characterization in the Permian-Triassic carbonate reservoir succession at South Pars Gas field, of shore Iran. J. Pet. Geol. 2014, 37, 205–230. [Google Scholar] [CrossRef]
  31. Sfdari, E.; Kadkhodaie-Ilkhchi, A.; Rahimpour-Bonab, H.; Soltani, B. A hybrid approach for lithofacies characterization in the framework of sequence stratigraphy: A case study from the South Pars gas field, the Persian Gulf basin. J. Pet. Sci. Eng. 2014, 121, 87–102. [Google Scholar] [CrossRef]
  32. Nabawy, B.S. Impacts of the pore- and petro-fabrics on porosity exponent and lithology factor of Archie’s equation for carbonate rocks. J. Afr. Earth Sci. 2015, 108, 101–114. [Google Scholar] [CrossRef]
  33. Jamalian, M.; Adabi, M.H.; Moussavi, M.R.; Sadeghi, A.; Baghbani, D.; Ariyafar, B. Facies characteristic and paleoenvironmental reconstruction of the lower cretaceous fahliyan formation in the Kuh-e-siah area, Zagros basin, southern Iran. Facies 2011, 57, 101–122. [Google Scholar] [CrossRef]
  34. Wolpert, P.; Bartenbach, M.; Suess, P.; Rausch, R.; Aigner, T.; Le Nindre, Y.M. Facies analysis and sequence stratigraphy of the uppermost Jurassic–Lower Cretaceous Sulaiy Formation in outcrops of central Saudi Arabia. GeoArabia 2015, 20, 67–122. [Google Scholar] [CrossRef]
  35. Noori, H.; Mehrabi, H.; Rahimpour-Bonab, H.; Faghih, A. Tectono-sedimentary controls on Lower Cretaceous carbonate platforms of the central Zagros, Iran: An example of rift-basin carbonate systems. Mar. Pet. Geol. 2019, 110, 91–111. [Google Scholar] [CrossRef]
  36. Lee, E.Y.; Kominz, M.; Reuning, L.; Gallagher, S.J.; Takayanagi, H.; Ishiwa, T.; Knierzinger, W.; Wagreich, M. Quantitative compaction trends of Miocene to Holocene carbonates off the west coast of Australia. Aust. J. Earth Sci. 2021, 68, 1149–1161. [Google Scholar] [CrossRef]
  37. Tavakoli, V.; Rahimpour-Bonab, H.; Esrafili-Dizaji, B. Diagenetic controlled reservoir quality of South Pars gas field, an integrated approach. Comptes. Rendus Geosci. 2011, 343, 55–71. [Google Scholar] [CrossRef]
  38. Enayati-Bidgoli, A.; Navidtalab, A. Effects of progressive dolomitization on reservoir evolution: A case from the Permian–Triassic gas reservoirs of the Persian Gulf, offshore Iran. Mar. Pet. Geol. 2020, 119, 104480. [Google Scholar] [CrossRef]
Figure 1. (A) Map of the Amu Darya Basin and adjacent areas, the study area is indicated by red shade; (B) Stratigraphic column and major petroleum system of the basin.
Energies 15 06923 g001
Figure 2. (A) Structure map (carbonate top) of the study area. (B) Target intervals and the log characteristics of Callovian–Oxfordian.
Energies 15 06923 g002
Figure 3. Photomicrographs of 15 facies identified in the Callovian-Oxfordian stage.
Energies 15 06923 g003
Figure 4. Photomicrographs of diagenetic features of the Callovian-Oxfordian stage. ((AC) refer to cementation, where I is isopachous calcite cementation, II is equigranular calcite cementation, III is medium-coarse calcite filling, and IV is intergrowth calcite filling; (D) is the fracture formed by mechanical compaction; (E) is the stylolite formed by chemical compaction; (F) indicates mold pores, intragranular dissolution pores, and intergranular dissolution pores formed by dissolution; (G) refers to intergranular and intragranular dissolution pore; (H) refers to the shear fracture formed by fracturing).
Energies 15 06923 g004
Figure 5. Porosity−permeability cross plots of different flow units.
Energies 15 06923 g005
Figure 6. RQI−PMR cross plots of different flow units.
Energies 15 06923 g006
Figure 7. Photomicrographs and SEM images of various pore types of the Callovian-Oxfordian stage (AL). They include interparticle (IP), intraskeletal (IS), coelomopore (CL), shadow pore (SP), bioboring pore (BP), intercrystalline (IC), intragranular dissolved pore (IRD), intergranular dissolved pore (IED), intracrystal solution pore (ICS), modic (MO), fracture (FR), and stylolite (ST) pore type.
Energies 15 06923 g007
Figure 8. Conceptual depositional model presented for the Callovian-Oxfordian stage in the Amu Darya Basin.
Energies 15 06923 g008
Figure 9. Paragenetic sequence of diagenetic processes in the Callovian-Oxfordian stage in the studied area. Effects of diagenetic processes on porosity are shown as blue (for porosity reducing), red (porosity enhancing reducing).
Energies 15 06923 g009
Figure 10. Porosity−Permeability cross plots of reservoir facies of the Callovian−Oxfordian stage.
Energies 15 06923 g010
Figure 11. Correlation between different parameters including depositional, diagenetic, porosity, permeability, and flow units in the Callovian-Oxfordian stage of well S1.
Energies 15 06923 g011
Figure 12. Correlation between different parameters including depositional, diagenetic, porosity, permeability, and flow units in the Callovian-Oxfordian stage of well C1.
Energies 15 06923 g012
Table 1. Facies characteristics of the Callovian-Oxfordian stage.
Facies BeltsFaciesMain LithologyTextureSortingEnergy
Level
NameCodeNameCode
Evaporative
platform
FB1SabkhaF1GypsumMudstone--Low
Evaporation lagoonF2Gypsum-bearing limestoneMudstone--Low
Restricted
platform
FB2Tidal flatF3Algal limestoneMud/packstonePoorLow
Restricted platform shoalF4Micrite oolitic limestonePack/WackstoneWellHigh
LagoonF5Bioclastic micriteWack/packstonePoorLow
Open
platform
FB3Open platform shoalF6Bioclastic limestoneGrain/packstoneWellHigh
Inter-shoalF7Bioclastic micriteWack/packstonePoorLow
platform
Margin
FB4Platform margin shoalF8Biosparitic calciruditeGrainstoneWellHigh
Organic reefF9Reef (Bioclastic) limestoneGrainstonePoorHigh
Platform fore-edge upslopeFB5Shoal (upslope)F10Bioclastic limestoneGrainstoneMediumHigh
BiohermF11Micritic grainstoneGrain/packstonePoorHigh
Mud (upslope)F12MicriteWack/mudstonePoorLow
Platform fore-edge downslopeFB6Lime-mud moundF13Micrite boundstoneWack/packstonePoorLow
Mud (downslope)F14MicriteWack/mudstonePoorLow
BasinFB7Basin mudF15Argillaceous limestone mudstoneMudstonePoorVery low
Table 2. Statistics of Parameters of Different Flow Units of the Callovian-Oxfordian stage.
FU1FU2FU3FU4FU5FU6FU7FU8FU9
Porosity
(%)
Min2.31.20.70.40.20.10.10.000.00
Max20.324.030.726.624.920.514.27.80.8
Mean7.36.46.66.14.32.41.61.40.5
Permeability
(mD)
Min0.0000.0000.0000.0000.0000.0000.0000.0010.001
Max0.1030.92518.469162.00769.804189.58801.37874.37405.8
Mean0.0040.0260.4064.33018.52844.772118.20296.04662.93
Reservior Quality Index
(RQI)
Min0.0020.0020.0030.0050.010.0110.0230.0500.073
Max0.0220.0660.2600.8191.9704.6109.17010.75017.720
Mean0.0050.0140.0390.1130.2220.3920.8002.0204.680
Flow Zone Indicator
(FZI)
Min0.0290.0900.2820.8922.8198.92728.21089.407283.47
Max0.0890.2820.8912.8188.91228.12888.967278.3542381.5
Mean0.0660.1930.5261.6445.07316.16848.338143.885685.95
Table 3. Statistical parameters calculated for reservoir facies (RFS) of the Callovian−Oxfordian stage.
RF1RF2RF3RF4RF5
Porosity
(%)
Min2.92.93.00.00.0
Max25.019.711.83.22.8
Mean14.311.25.91.31.1
Permeability
(mD)
Min1.9000.0040.0040.00010.009
Max2701.4003.2000.1700.1213985.800
Mean22.5000.5000.0160.0061.820
Reservoir quality
Index(RQI)
Min0.0070.0070.0020.0020.064
Max0.2350.2350.0700.53517.719
Mean0.4830.0780.0170.0240.363
Ratio of Porosity to Matrix
(PMR)
Min0.0300.0300.0310.0000.000
Max0.3890.2610.1370.0330.032
Mean0.1270.1030.0640.0140.016
Flow zone indicator
(FZI)
Min0.1640.0380.0280.0702.200
Max343.6537.5422.0102303.9102381.515
Mean4.5350.8640.2822.55626.837
Publisher’s Note: MDPI stays neutral with regard to jurisdictional claims in published maps and institutional affiliations.

