
Assessment of Energy Efficiency Measures in Food Cold Supply Chains: A Dairy Industry Case Study


Abstract
:1. Introduction
- Produce healthy and safe products in response to market demands (SDG 2, 3 and 12),
- Guaranteeing the possibility for all consumers to have accurate information on food products (SDG 2),
- Support the profitability of urban economies (SDG 11),
- Operate within the biological limits of natural resources (SDG 15),
- Achieve high standards of environmental performance by reducing energy consumption, minimizing resource inputs and, where possible, using renewable energy sources (SDG 7 and 13),
- Reduce food waste (SDG 12).
2. Energy Efficiency Measures for Cold Chains
3. Methodological Approach
4. Results and Discussions
4.1. AS-IS Scenario
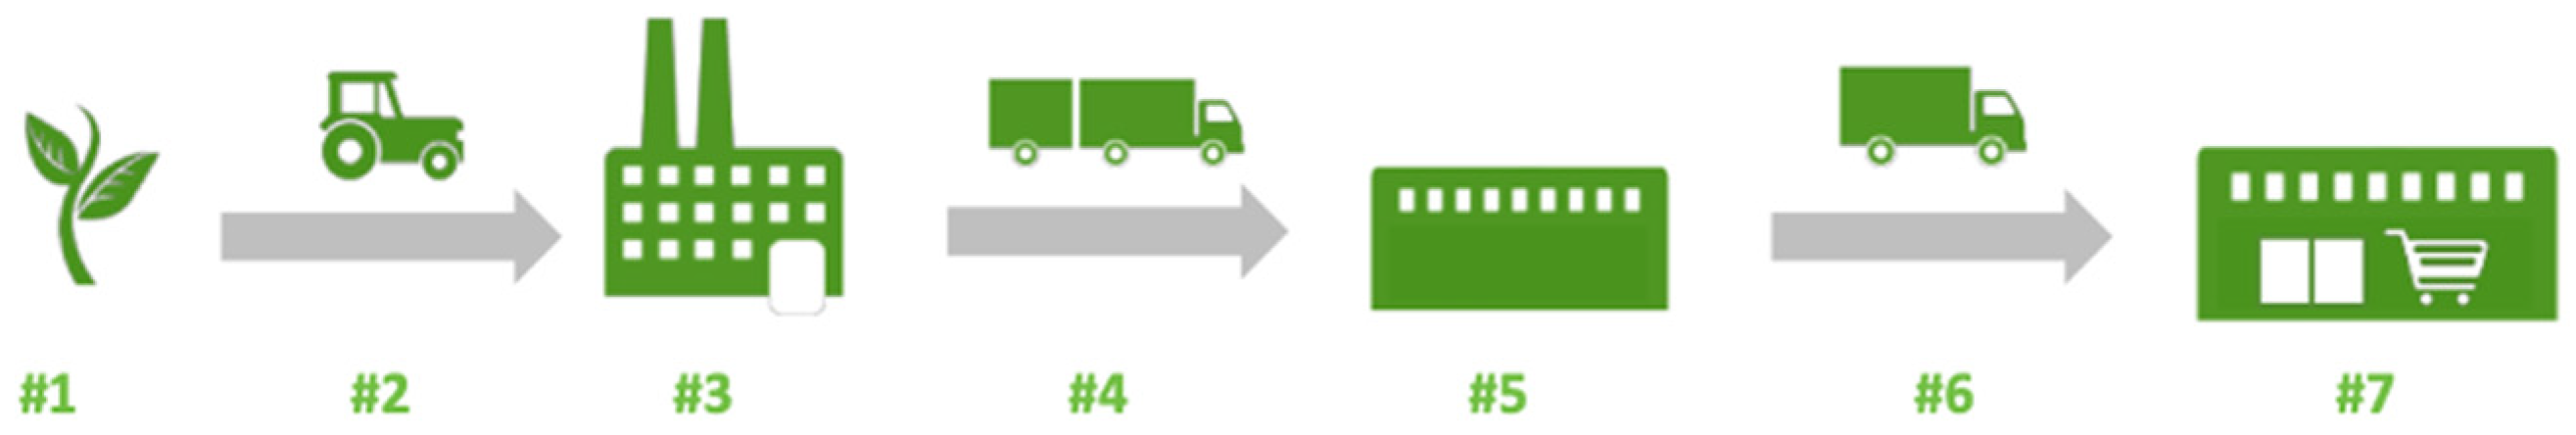
- The considered cold chain is regional: in this way, the temperature of the external environment is kept constant and equal to 30 °C in each phase.
- The production process requires different quantities of milk for every kg of cheese. For the specific case study, a value of 10 kg of milk to produce 1 kg of cheese has been considered.
- The available data refers to the overall warehouse which stores different products (e.g., dairy products, fish, meat, fruit and vegetables, products intended for catering). Hence, the size of the warehouse and the energy consumption of the distribution center and the retailer were equally distributed to the products stored to obtain the percentage of electric energy necessary for the conservation of considered product (i.e., cheese).
- The first transport (from the milk supplier to the cheese producer) does not use refrigerated vehicles, but instead uses tanks insulated with polyurethane foam able to keep the milk at the required temperature; the other two transports use vehicles of different sizes, both equipped with a refrigeration system. The transport from the manufacturer to the distribution center is a long-distance transportation, while the one from the distribution center to the retailer is a multidrop. Long distance transport is related to the use of refrigerated vehicles with transit times longer than one working day. Usually, the vehicle, in this case, is loaded with foodstuffs and directly delivered to a single customer point. Hence, less than two door openings are expected during the travel journey. On the contrary, in short distance multidrop refrigerated vans or small trucks, products are delivered to different points (e.g., different customers). Hence, these transports usually imply multiple door openings, short times for product temperature recovery, and generally shared cooling capacity between two or more compartments in a single vehicle (e.g., freezer and chiller compartments within the same truck).
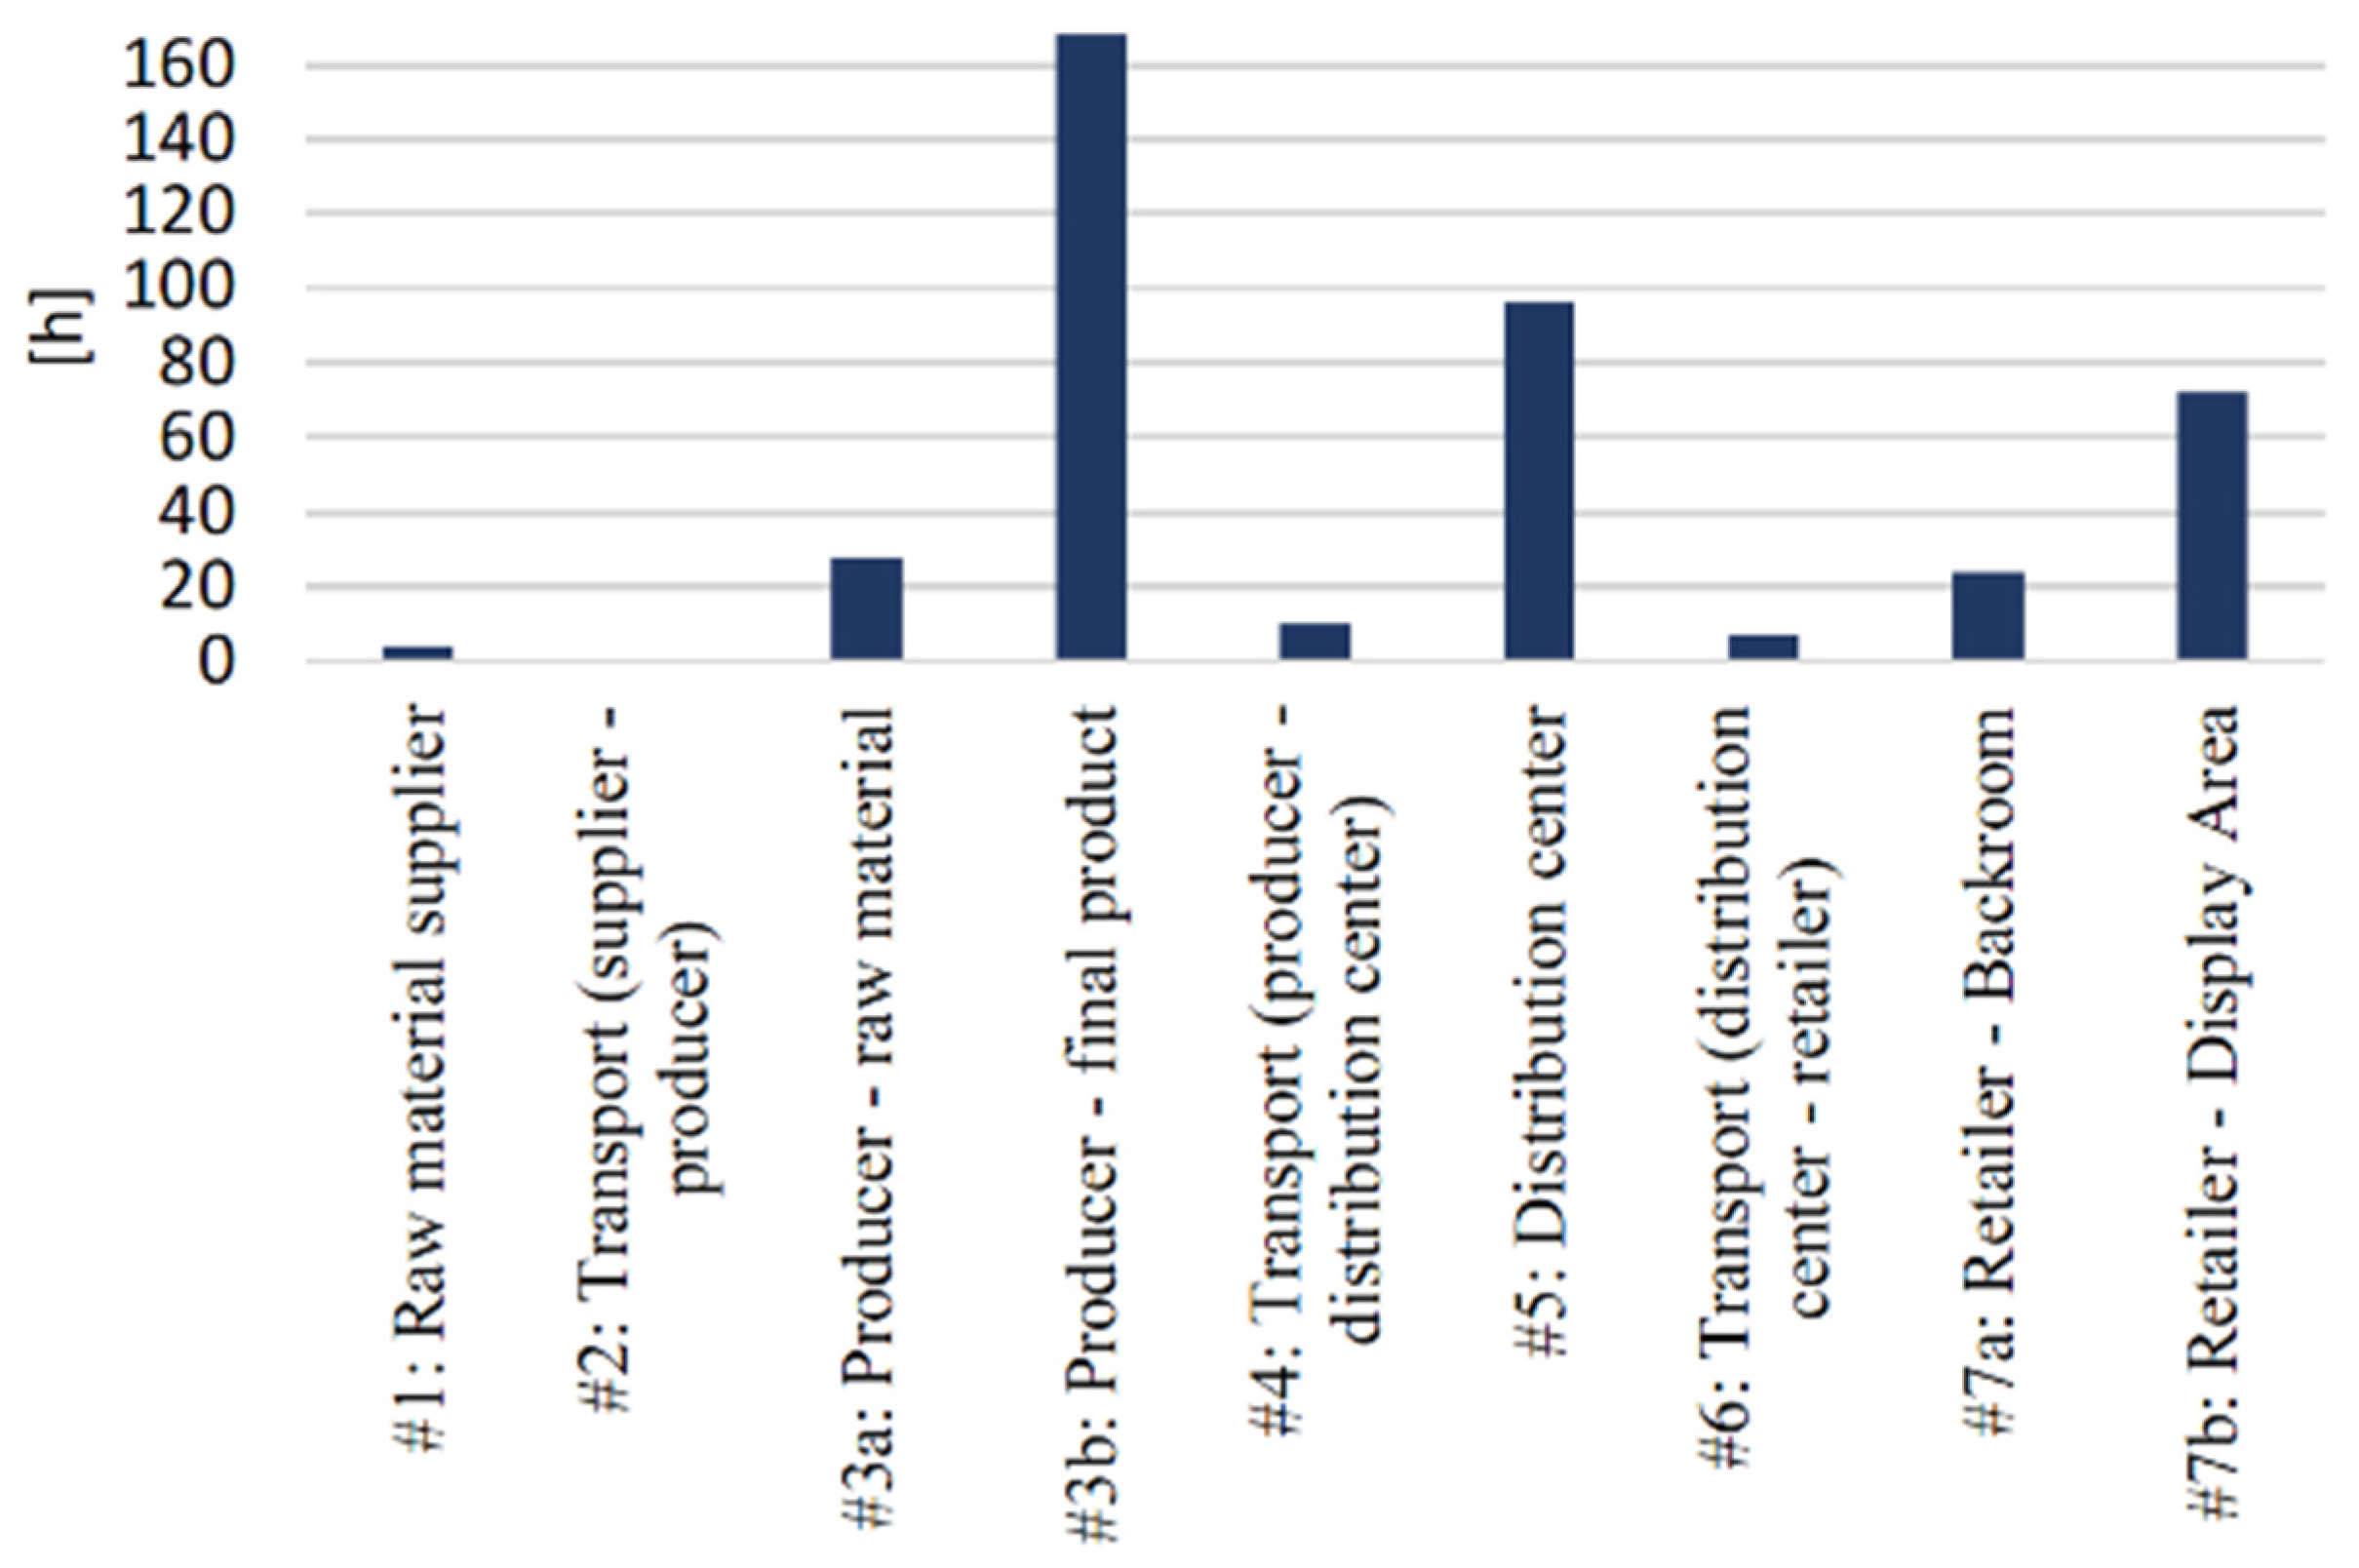
- The stages with the greatest quality losses are the storage at the milk supplier (#1) and at the producer (#3a). In fact, milk is a more easily perishable commodity than the seasoned cheese wedge (finished product).
- The higher share of quality losses of the finished product occurs at the producer (#3b) since the storage is higher than in other finished product warehouses.
- Considering quality losses, the SEC increases by about 50%. This is a non-negligible value, especially because in terms of energy efficiency it is important to avoid consuming energy for products that represent a waste and, as such, are not sold to the final consumer.
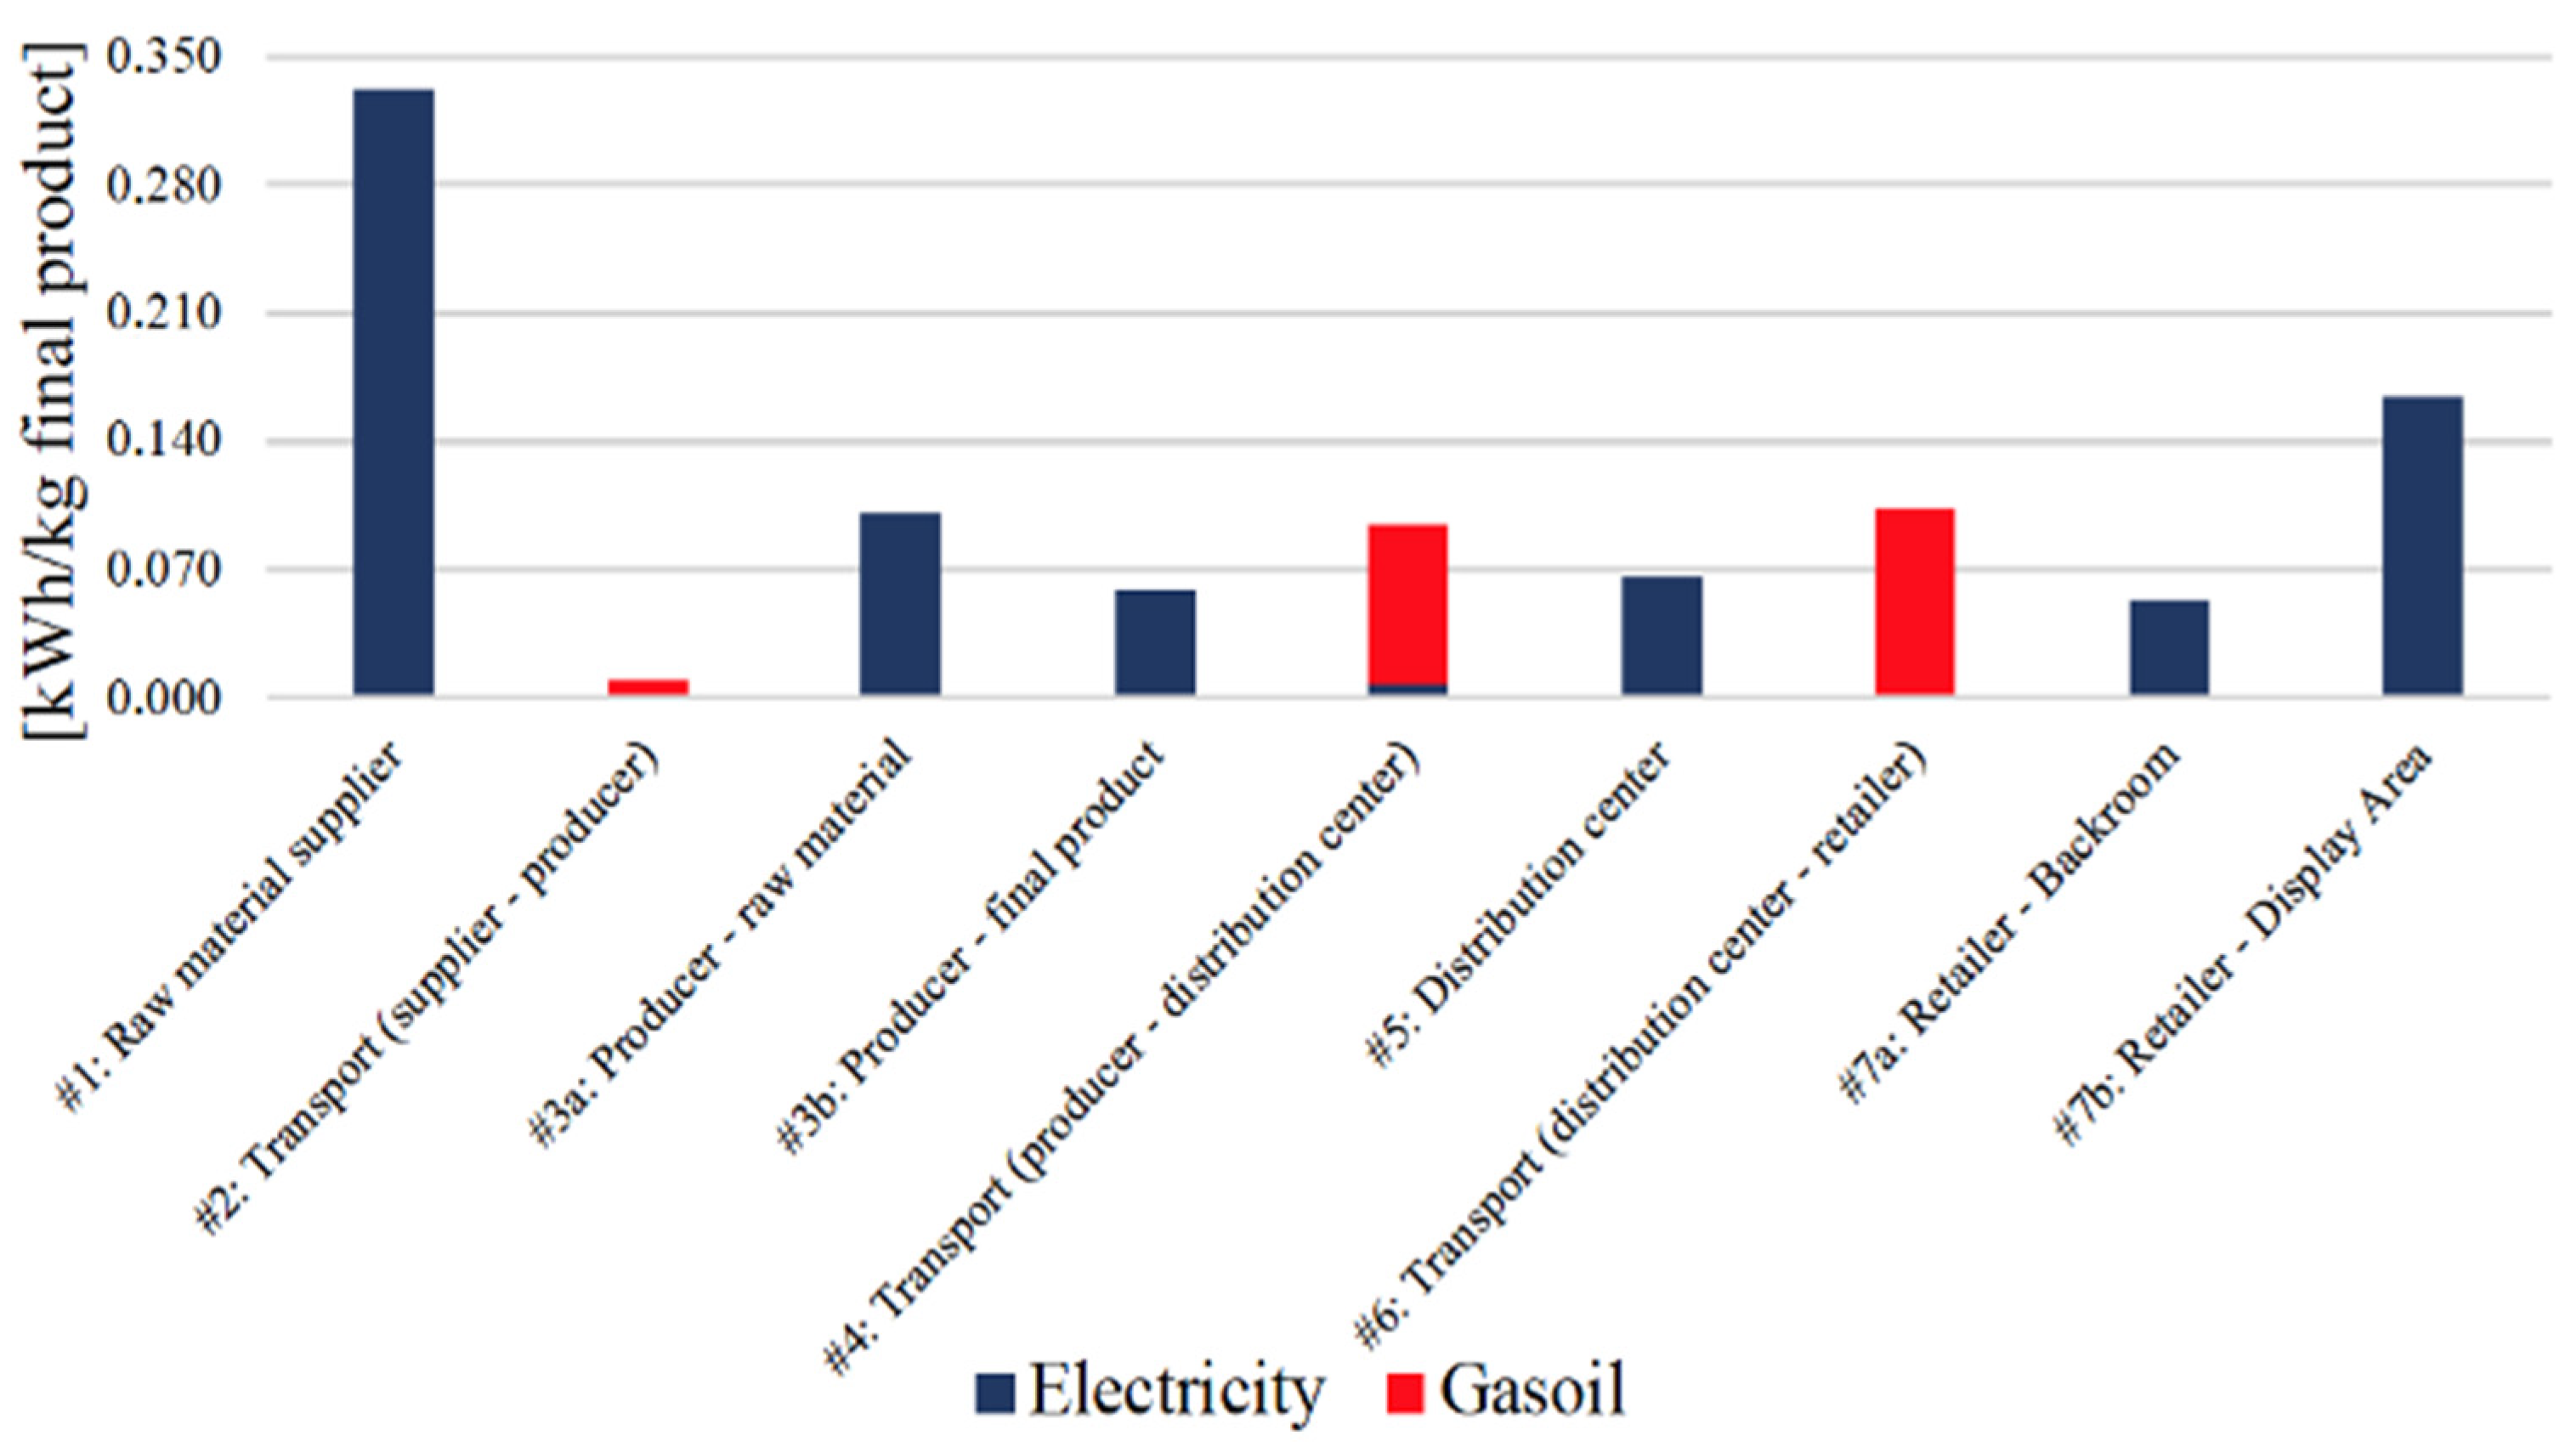
- Regarding transport, the greatest losses occur during multidrop transport, mainly due to the high number of vehicle door openings which introduce the highest temperature changes.
- The first transport, from the supplier to the producer (#2), is the one that has a lower SEC. This is because, on the one hand, it makes a relatively short journey; on the other, it uses insulated tanks and, therefore, does not require refrigeration.
- The second type of transport, from the producer to the distribution center (#4), should cover a greater distance, to which corresponds a higher fuel consumption. In addition, it has an SEC component related to the electrical power required by vapor compression refrigeration.
- The last transport, from the distribution center to the retailer (#6), covers minor distances, but it is the one with the greatest SEC: in fact, this value is affected by the vehicle door openings which, in the case of the multidrop transport, are greater and vary according to the points of sale visited. The hot air that enters the vehicle during the multiple unloading phases requires a higher energy contribution to bring the vehicle compartment back to the required temperature.

| Factor | #2 | #4 | #6 |
|---|---|---|---|
| Door opening | x | ||
| Fuel consumption | x | x | x |
| Fuel conversion factor | x | x | x |
| Refrigeration system | x | ||
| Travelling time | x | x | |
| Utilization of the vehicle | x |
4.2. TO-BE Scenario
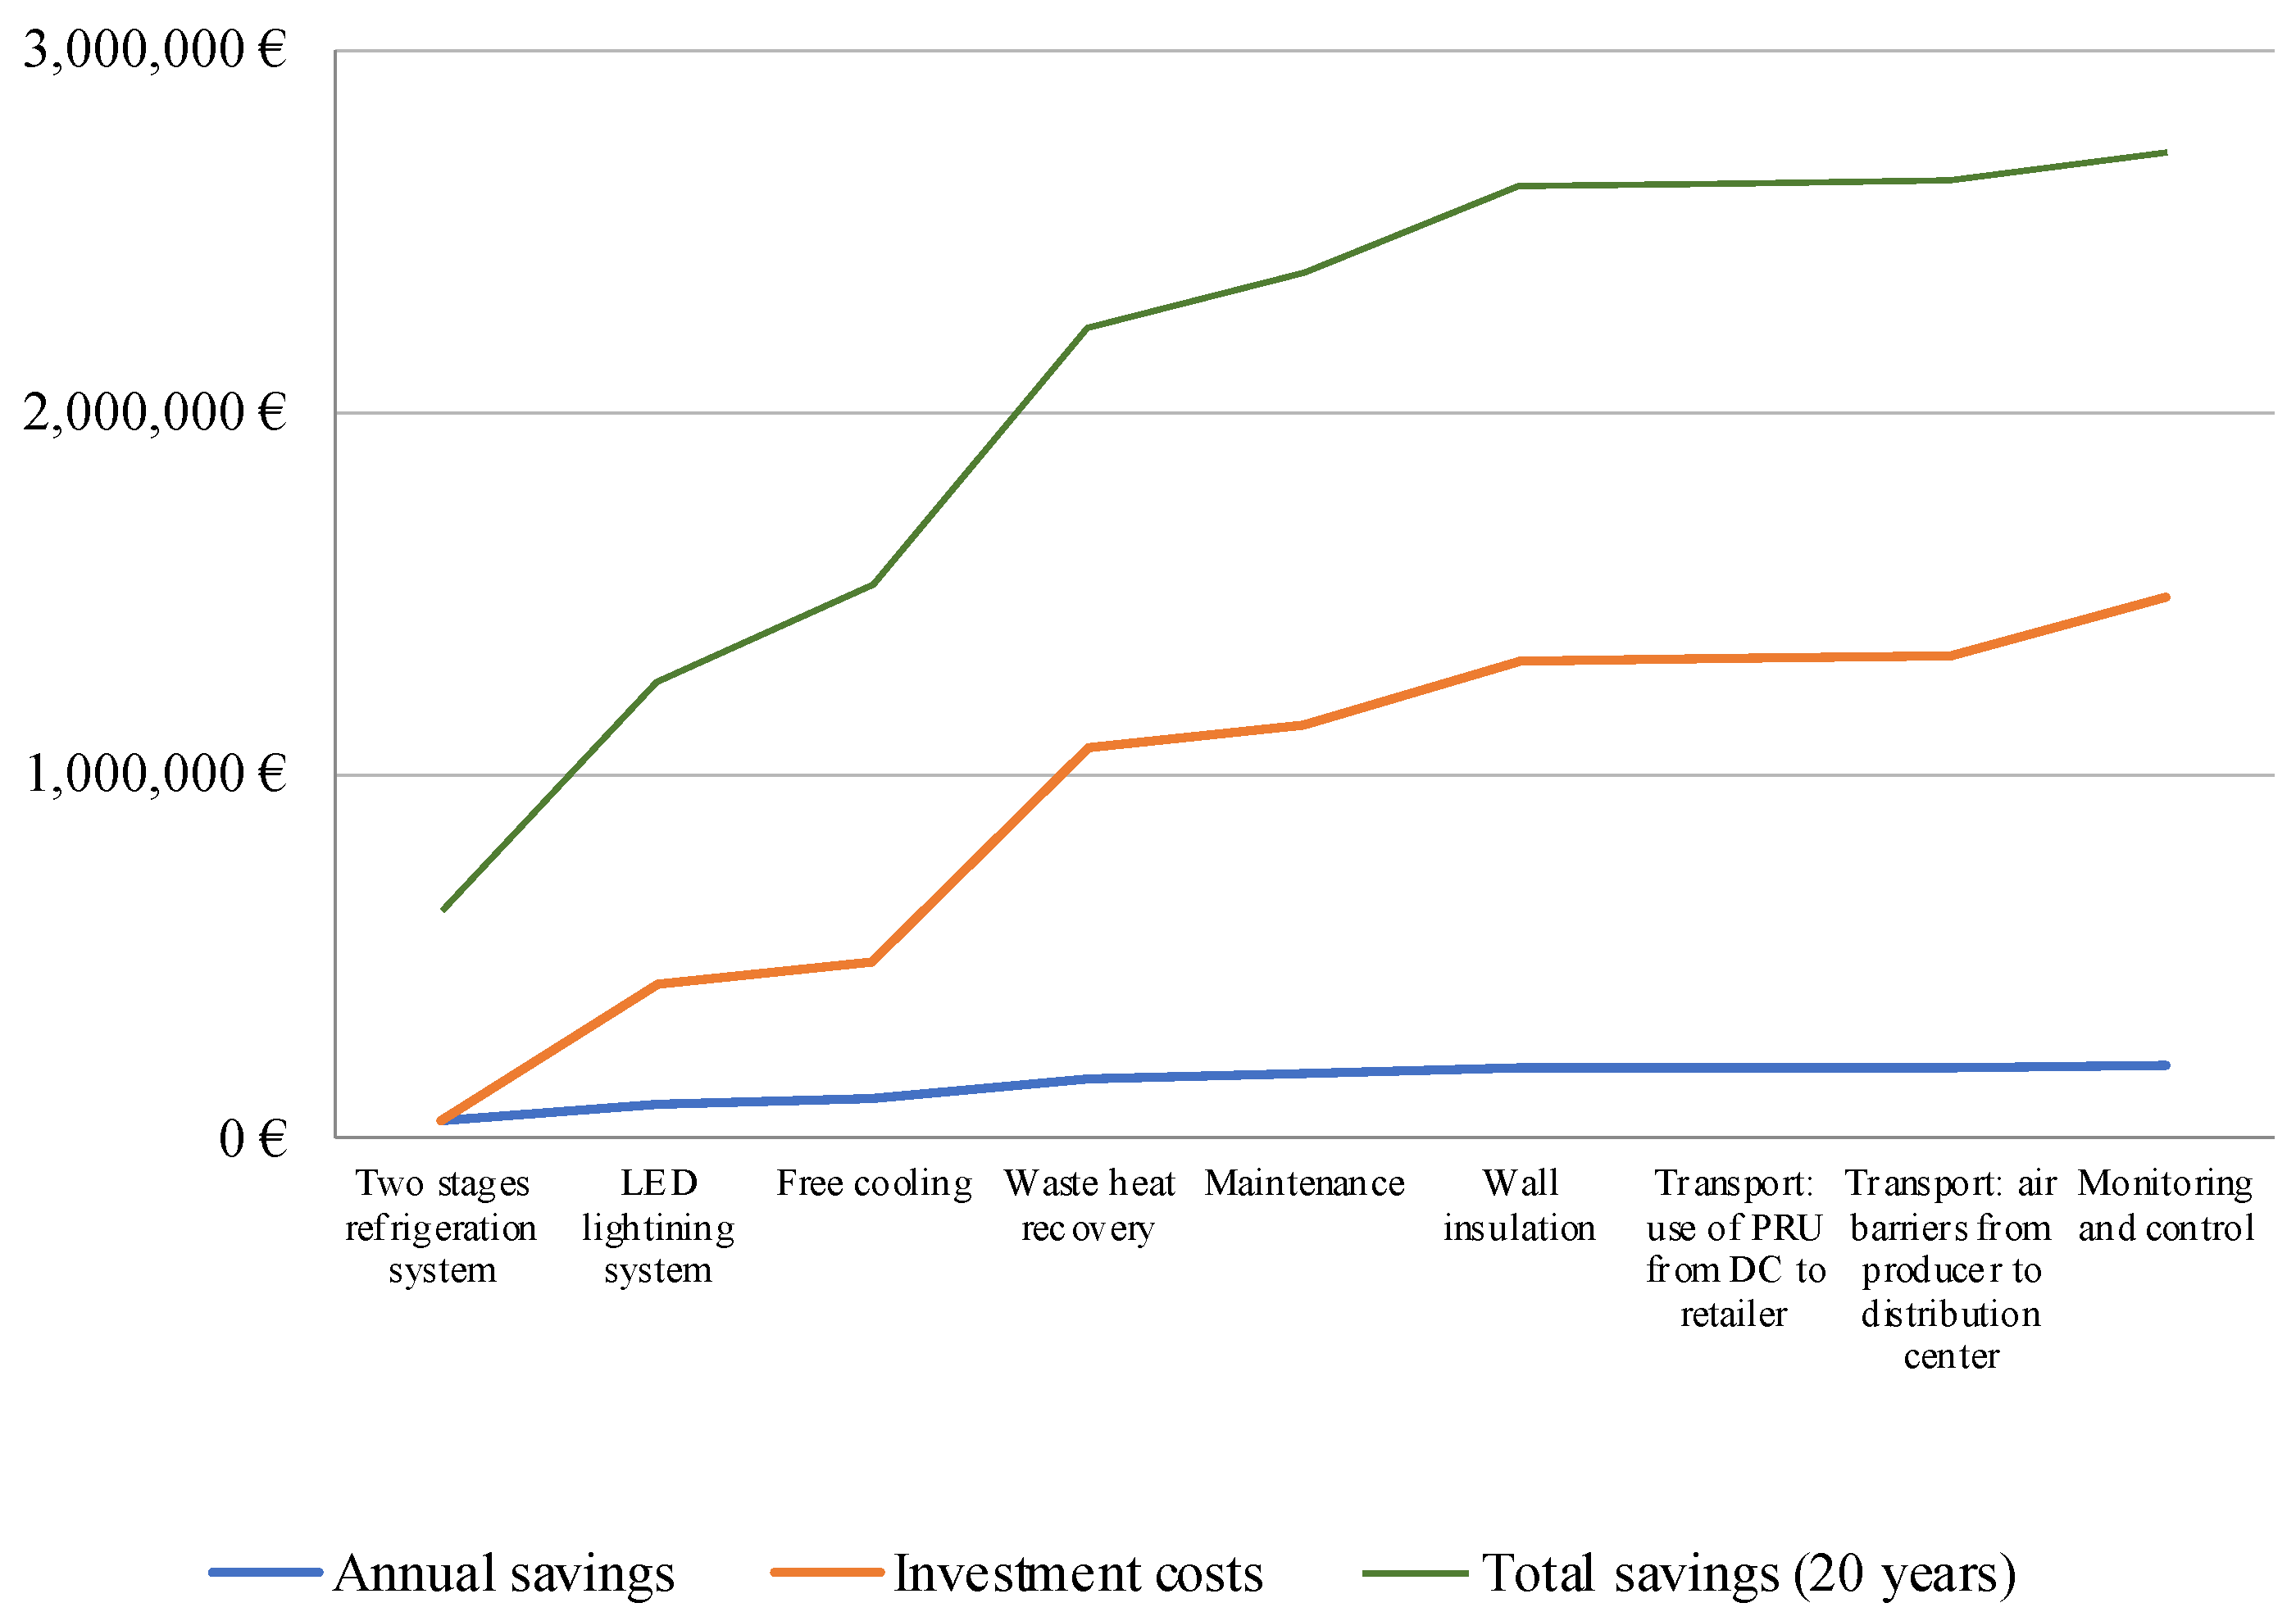
- Wall insulation. Thermal insulation of buildings allows the correct maintenance of the internal temperature of warehouses required by food products. Basically, this is the most efficient way to minimize heat transfer between two contiguous spaces. The materials most used today for wall cladding are multilayer panels, characterized by an internal insulating layer of polyurethane. The thickness and the composition of these panels, called sandwich panels, vary in relation to the insulation required to keep the products at the required temperature. The most important advantage obtained from the use of sandwich panels is the reduction of energy consumption required by the refrigeration systems. For the chain considered, it is possible to reach an additional reduction of the overall SEC of about 11.8% (with respect to the AS-IS scenario).
- LED lightning system. A traditional lighting system produces ultraviolet and infrared rays, which generate 80% heat and only for the remaining part lighting. The light is absorbed by the products and the internal structures of the warehouse and subsequently re-radiated in the form of additional heat. The heat produced becomes an additional load for the refrigeration system, which requires more energy for proper operation. Furthermore, the useful life of traditional systems in cold environments is significantly reduced, which means frequent replacement costs. By using an LED lighting system, it is possible to avoid this heat production, save energy (since they are more efficient) and face an extended lifetime even at low temperatures (50,000 h, compared to 1500 h of traditional systems). LEDs also contribute to the reduction of CO2 emissions associated with electricity generation. LED systems are more expensive than other lighting systems, but the investment is offset by the considerable energy savings introduced. For the chain considered, it is possible to reach an additional reduction of the overall SEC of about 31.5% (with respect to the AS-IS scenario).
- Maintenance. Over time, the surfaces of coils become dirty as the air moving over the coils contains dust, dirt, pollen, moisture, and other contaminants. A buildup of contaminants decreases the available surface area for heat transfer, reducing the efficiency of the heat transfer process, leading to excessive energy consumption and poor system performance. For this reason, it is important that air conditioning coils are regularly inspected and maintained to ensure they operate at optimum efficiency. With maintenance it is possible to incur energy consumption savings and economic savings. Furthermore, regular maintenance and cleaning allow greater durability of the lifespan of the system. Postponing maintenance and cleaning can have a detrimental impact on processing equipment and heating and cooling systems. When dirt and grime coat a chiller or air conditioner’s coils, they can drastically increase the costs of running that system. Moreover, particular attention must be paid to check the distribution system of compressed air, from the compressor to end uses, avoiding leaks; even very small leaks can cause significant wastage of energy and consequently high costs. The regular verification of losses is an excellent strategy to minimize costs and save money, since predictive maintenance practices have an almost negligible cost with respect to technological measures. This measure can also improve the working environment by reducing the noise caused by inefficiencies such as the presence of holes. For the chain considered, it is possible to reach an additional reduction of the overall SEC of about 7.9% (with respect to the AS-IS scenario).
- Monitoring and control. Knowing the energy consumption related to the various activities becomes essential to understanding where to intervene for improving energy efficiency. Smart and real-time monitoring can provide analysis on future consumption, share information throughout an organization, and optimize resource consumption. It also allows maintenance of temperature in the desired range, limiting quality losses and temperature abuses. Moreover, if there are possible interruptions in the cold chain, prompt intervention can ensure the quality of the products. Remotely it is therefore possible to know the consumption of all the machinery used, both in the individual company and, in the most complex systems, the entire chain. For the chain considered, it is possible to reach an additional reduction of the overall SEC of about 3.9% (with respect to the AS-IS scenario).
- Waste heat recovery. Recovering heat from the refrigeration process can save energy and cut energy costs. Heat-recovery equipment can be fitted to existing plants or integrated in new plants. There are two types of heat recovery systems from refrigeration, depending on the installation and refrigerant used: high-grade heat recovery, where heat (between 60 and 90 °C) is recuperated in refrigeration systems from de-superheating the refrigerant between the compressor and the condenser, and low-grade heat recovery, where heat (between 20 and 40 °C) comes from the refrigerant being condensed. In the food industry, it is possible to recover heat from different sources: cooling systems and compressors, pasteurization, exhaust gases from burners, etc. Waste heat generated from the refrigeration unit can be used as a heat source (e.g., to preheat water to reduce the energy use of the boiler), and, at the same time, waste heat from other processes can be used for refrigeration, using absorption refrigeration. For the chain considered, it is possible to reach an additional reduction of the overall SEC of about 35.5% (with respect to the AS-IS scenario).
- Free cooling. Free cooling indicates the direct use of an external source, typically air, but also water, when its temperature (and humidity in case of direct external air use) allow its use directly (e.g., introduction of external air without any treatment) or indirectly (i.e., treating the air or exchanging heat with air or other heat carriers) with a lower energy consumption of the HVAC or cooling system. The most suitable environment for free cooling is a combination of a cold or mild climate zone and the need for cooling energy for most of the year. This encompasses many manufacturing industries, such as the food and beverage ones. Free cooling has the objective to reduce chiller energy consumptions: this can be done via a direct intake if there is external air, via a chiller with a built-in free cooling coil, or via a free cooler working in series with a chiller. The latter should usually be more efficient, due to the larger surface area provided by the air cooler. A free cooling system, together with energy savings can offer different benefits, such as reduced water consumption, reduced operational costs, reduced carbon footprint, and reduced maintenance costs, due to the reduced number of operating hours of the compressor during the year. For the chain considered, it is possible to reach an additional reduction of the overall SEC of about 13.4% (with respect to the AS-IS scenario).
- Two-stage refrigeration system. Multistage systems have the purpose of solving issues in the classic vapor compression cycle (i.e., when the evaporator temperature becomes very low or when the condenser temperature becomes high). Apart from high temperature lift applications, multi-stage systems are also used in applications requiring refrigeration at different temperatures. A two-stage system is a refrigeration system working with two-stage compression and often also with a two-stage expansion. Flash gas is separated from liquid refrigerants in an intermediate receiver between the two expansion valves. The high-stage compressor will then remove the flash gas. The removal of the gas between the expansion stages reduces the quality of the refrigerant vapor that enters the evaporator. Each mass unit of refrigerant passing through the evaporator will then be able to absorb more heat, reducing the required refrigerant mass flow rate for a given cooling capacity. This in turn reduces the required low-stage compressor size. Because of the enhanced heat transfer coefficient in the evaporator, the heat transfer area needed is also reduced. The investment is, usually, lower than traditional systems, because smaller compressors and evaporators are required. For the chain considered, it is possible to reach an additional reduction of the overall SEC of about 55.2% (with respect to the AS-IS scenario).
5. Conclusions
Author Contributions
Funding
Conflicts of Interest
Abbreviations
| CSC | Cold Supply Chain |
| EEM | Energy efficiency measures |
| GHG | Greenhouse Gases |
| HFC | Hydrofluorocarbon |
| HVAC | Heating, ventilation and air conditioning |
| KPI | Key performance indicator |
| NEB | Non-energy benefit |
| SDG | Sustainable Development Goal |
| SEC | Specific energy consumption |
| UN | United Nations |
References
- European Commission—Joint Research Centre. Energy Use in the EU Food Sector: State of Play and Opportunities for Improvement; Publications Office: Luxembourg, 2015; ISBN 9789279482991. [Google Scholar]
- Gwanpua, S.G.; Verboven, P.; Leducq, D.; Brown, T.; Verlinden, B.E.; Bekele, E.; Aregawi, W.; Evans, J.; Foster, A.; Duret, S.; et al. The FRISBEE tool, a software for optimising the trade-off between food quality, energy use, and global warming impact of cold chains. J. Food Eng. 2015, 148, 2–12. [Google Scholar] [CrossRef]
- Coulomb, D. Refrigeration and cold chain serving the global food industry and creating a better future: Two key IIR challenges for improved health and environment. Trends Food Sci. Technol. 2008, 19, 413–417. [Google Scholar] [CrossRef]
- James, S.J.; James, C. The food cold-chain and climate change. Food Res. Int. 2010, 43, 1944–1956. [Google Scholar] [CrossRef]
- International Institute of Refrigeration. The Carbon Footprint of the Cold Chain. 2021. Available online: https://iifiir.org/fr/fridoc/l-empreinte-carbone-de-la-chaine-du-froid-7-lt-sup-gt-e-lt-sup-gt-note-143457 (accessed on 11 August 2022).
- Cagno, E.; Trianni, A. Evaluating the barriers to specific industrial energy efficiency measures: An exploratory study in small and medium-sized enterprises. J. Clean. Prod. 2014, 82, 70–83. [Google Scholar] [CrossRef]
- Marchi, B.; Zanoni, S. Supply chain management for improved energy efficiency: Review and opportunities. Energies 2017, 10, 1618. [Google Scholar] [CrossRef]
- Zanoni, S.; Marchi, B.; Puente, F.; Neusel, L.; Hirzel, S.; Krause, H.; Saygin, D.; Oikonomou, V. Improving Cold Chain Energy Efficiency: EU H2020 project for facilitating energy efficiency improvements in SMEs of the food and beverage cold chains. Refrig. Sci. Technol. 2020, 361–369. [Google Scholar] [CrossRef]
- Zanoni, S.; Marchi, B. Environmental impacts of foods refrigeration. In Environmental Impact of Agro-Food Industry and Food Consumption; Academic Press: Cambridge, MA, USA, 2021; pp. 239–259. ISBN 9780128213636. [Google Scholar]
- Neusel, L.; Hirzel, S.; Zanoni, S.; Marchi, B. Energy efficiency from farm to fork? On the relevance of non-energy benefits and behavioural aspects along the cold supply chain. ECEEE Ind. Summer Study Proc. 2020, 101–110. Available online: https://www.eceee.org/library/conference_proceedings/eceee_Industrial_Summer_Study/2020/2-sustainable-production-towards-a-circular-economy/energy-efficiency-from-farm-to-fork-on-the-relevance-of-non-energy-benefits-and-behavioural-aspects-along-the-cold-supply-chain/2020/2-084-20_Neusel.pdf (accessed on 11 August 2022).
- Marchi, B.; Zanoni, S.; Zavanella, L.E. Energy efficiency measures for refrigeration systems in the cold chain. Proc. Summer Sch. Fr. Turco 2019, 1, 222–228. [Google Scholar]
- ICCEE. Deliverable 2.1—Main Report on Supply Chain Energy Impact Analysis and Best Practices. 2020. Available online: https://iccee.eu/wp-content/uploads/2020/07/D2.1-PU-UNIBS-Main-report-on-supply-chain-energy-impact-analysis-and-best-practices-1.pdf (accessed on 11 August 2022).
- Diaz, F.; Vignati, J.A.; Marchi, B.; Paoli, R.; Zanoni, S.; Romagnoli, F. Effects of Energy Efficiency Measures in the Beef Cold Chain: A Life Cycle-based Study. Environ. Clim. Technol. 2021, 25, 343–355. [Google Scholar] [CrossRef]
- Marchi, B.; Zanoni, S.; Romagnoli, F.; Ferretti, I. Multi criteria decision analysis for improving cold chain sustainability. Proc. Summer Sch. Fr. Turco 2021. [Google Scholar]

| Category | EEM | Energy Saving | Readiness Level | KPI |
|---|---|---|---|---|
| Auxiliary technology | LED lightening system | 3 | 3 | 9 |
| Optimal sizing of the equipment (i.e., motor, pump, drive systems, steam generator) | 2 | 1 | 2 | |
| More efficient motors | 1 | 3 | 3 | |
| Use of natural light | 1 | 2 | 2 | |
| More efficient ventilation system | 3 | 2 | 6 | |
| Building | Wall insulation | 3 | 2 | 6 |
| Roof insulation and substitution of the windows | 3 | 2 | 6 | |
| Warehouse with separated compartments | 3 | 1 | 3 | |
| Employee | Staff training (operators and drivers) | 1 | 2 | 2 |
| Increased awareness, responsibility, and active engagement | 1 | 2 | 2 | |
| Energy generation and recovery | Waste heat recovery | 3 | 2 | 6 |
| Energy storage system (thermal and/or electrical) | 3 | 2 | 6 | |
| Industrial symbiosis | By-product exchanges | 3 | 1 | 3 |
| Sharing of infrastructure, utilities, or access to services (e.g., waste treatment) | 2 | 1 | 2 | |
| Cooperation on issues of common interest (e.g., sustainability planning) | 2 | 1 | 2 | |
| Maintenance | Regular cleaning of condensers and evaporator coils | 1 | 3 | 3 |
| Minimization of compressed air leakages | 2 | 3 | 6 | |
| Review and optimization of the cooling distribution system | 3 | 2 | 6 | |
| Management | Energy audit | 2 | 2 | 4 |
| Exploitation of energy benchmarks, and EnPIs | 1 | 1 | 1 | |
| Monitoring and control | Real-time monitoring system | 3 | 1 | 3 |
| Use of automatic control system | 3 | 1 | 3 | |
| Refrigeration system | Usage of alternative refrigerant | 3 | 2 | 6 |
| Free cooling | 3 | 2 | 6 | |
| Alternative refrigerant cycle (e.g., two stages) | 3 | 2 | 6 | |
| Transport | Improved insulation through air barriers | 2 | 3 | 6 |
| Optimized travel routes | 2 | 2 | 4 | |
| Portable refrigerated units | 3 | 2 | 6 | |
| Use of eutectic plates | 2 | 3 | 6 |
| Factor | #1 | #3a | #3b | #5 | #7a | #7b |
|---|---|---|---|---|---|---|
| Coefficient of utilization | x | x | ||||
| Quality losses | x | x | ||||
| Storage size | x | x | x | |||
| Storage time | x | x | x | |||
| Temperature (inside the warehouse) | x | x | x | x | x | x |
| EEM | Annual Savings (€/year) | Costs (€) | PB | VAN (€) |
|---|---|---|---|---|
| Transport: use of PRU from DC to retailer | 596 | 5000 | 8.4 | 3103 |
| Transport: air barriers from producer to distribution center | 611 | 12,000 | 19.6 | −3700 |
| Wall insulation | 17,345 | 176,791 | 10.2 | 58,943 |
| LED lightining system | 46,255 | 370,489 | 8.0 | 258,136 |
| Maintenance | 11,563 | 60,000 | 5.2 | 97,156 |
| Monitoring and control | 5782 | 160,000 | 27.7 | −81,422 |
| Waste heat recovery | 52,037 | 594,521 | 11.4 | 112,682 |
| Free cooling | 19,658 | 60,000 | 3.1 | 207,165 |
| Two-stage refrigeration system | 46,255 | 52,550 | 1.1 | 576,074 |
| TOTAL | 200,105 | 1,491,351 | 1,228,137 |
Publisher’s Note: MDPI stays neutral with regard to jurisdictional claims in published maps and institutional affiliations. |
© 2022 by the authors. Licensee MDPI, Basel, Switzerland. This article is an open access article distributed under the terms and conditions of the Creative Commons Attribution (CC BY) license (https://creativecommons.org/licenses/by/4.0/).
Share and Cite
Marchi, B.; Bettoni, L.; Zanoni, S. Assessment of Energy Efficiency Measures in Food Cold Supply Chains: A Dairy Industry Case Study. Energies 2022, 15, 6901. https://doi.org/10.3390/en15196901
Marchi B, Bettoni L, Zanoni S. Assessment of Energy Efficiency Measures in Food Cold Supply Chains: A Dairy Industry Case Study. Energies. 2022; 15(19):6901. https://doi.org/10.3390/en15196901
Chicago/Turabian StyleMarchi, Beatrice, Laura Bettoni, and Simone Zanoni. 2022. "Assessment of Energy Efficiency Measures in Food Cold Supply Chains: A Dairy Industry Case Study" Energies 15, no. 19: 6901. https://doi.org/10.3390/en15196901
APA StyleMarchi, B., Bettoni, L., & Zanoni, S. (2022). Assessment of Energy Efficiency Measures in Food Cold Supply Chains: A Dairy Industry Case Study. Energies, 15(19), 6901. https://doi.org/10.3390/en15196901