1. Introduction
Among all atmospheric discharges that pose a significant threat to people, animals, and ground objects, the biggest threats are the negative and positive cloud-to-ground (CG) lightning. Lightning discharges consist of various current components that are generally pulsed in nature. In CG negative lightning, there are three different types of current components (strokes) transferring electric charge to the ground: the return stroke (RS), the continuing current (CC), and the so-called M-components [
1,
2].
The lightning return stroke is a unipolar and aperiodic high-power current pulse. The peak of this surge usually reaches tens of kiloamperes and the frequency spectrum achieves several megahertz, due to the steepness of the stroke front, for which the rise time is in the range of fractions of a microsecond to several microseconds. The total duration of a typical lightning return stroke is up to 3 milliseconds, while the charge that is transferred to the ground is in the range of several coulombs [
1,
2,
3]. Each flash typically contains three to five return strokes, while the observed upper range of this parameter reaches several dozen strokes [
4]. Due to the high value of the current and its steepness, they are the source of the most dangerous overvoltages for electric and electronic equipment [
5,
6].
Almost 50% of any observed RS, independently of its order, is followed by some kind of continuing current (CC). The typical CC is similar to a rectangular wave, lasting mainly from tens to hundreds of milliseconds. This wave is often superimposed by other lightning current components, which are commonly known as M-components [
1]. The current values of CC are usually in the range of 30–200 A, while the electric charge that is transferred during this lightning stage from the cloud to the ground is typically 10–20 C [
7,
8,
9,
10,
11]. In fact, the results of a detailed registration of lightning current made it possible to distinguish six types of CC. Three of them occur more often: a more or less exponential current decay, gradual current increase and decrease, and a plateau with a small current value [
12,
13]. Due to the high value of dissipated energy during the CC, this lightning component is responsible for most of the serious lightning damage associated with thermal effects, such as blowing the fuses protecting electrical installations and transformers, damage to technical equipment, fires of buildings and forests, etc. Therefore, the importance of this component is very high in terms of lightning protection issues, the same as the return stroke component.
The third type of significant current strokes occurring during lightning discharges is the previously mentioned M-components, which appear in the relatively steady continuing current as disturbances superimposed on this current. Typical M-components can be characterized by current pulses with peak values of 100–200 A. They are relatively slow-changing waves in comparison with those of the return-stroke current pulses, having a much longer rising time (300–500 μs); they also have a charge that is about ten times smaller, which is transferred to the ground (0.1–0.2 C) [
1,
3,
14].
Experimental and computational studies of the effectiveness of current lightning protection systems (LPS), installed on different structures, have been carried out for over two decades. For example, the distribution of the surge current in the LPS of a small residential building during a direct triggered lightning strike has been investigated at Camp Blanding, Florida [
15,
16].
A similar experimental investigation using a different kind of mobile current generator has been performed for nearly the last 10 years at the open-air test site in Huta Poreby, Poland. The research, carried out in cooperation with the University of Florida (UF), was aimed at establishing similar dependencies related to the effectiveness of lightning protection systems, but these were in soil with much lower resistivity than in Florida (in the order of 100 Ωm at Huta Poreby, versus 4000 Ωm at Camp Blanding). The published results that have so far been received during tests at Huta Poreby have focused mainly on measuring and modeling the fast-changing components of the lightning current, that is, high-current return strokes [
17,
18,
19].
The preliminary results of the first open-air tests, which were carried out with the use of a specially designed mobile generator to determine the distribution of the long continuing current in the lightning protection system of a residential building and the attached electrical installation, were presented in an earlier study [
20].
This paper presents a comprehensive study of the CC component distribution in the lightning protection system of the test object. The new measurements obtained for the higher values of injected currents, which are similar to those that occur during natural lightning discharges. are presented and analyzed. The efficiency of the LPS that was mounted on the test house was determined for this new registration and compared with the previously obtained results for the CC and RS components. In addition, computer simulations were carried out, based on the proposed model of a new CC current generator.
As a result, this work complements an overall investigation in the field of experimental and computational studies of LPS efficiency for the two basic components of the lightning current. The research was carried out as part of a project conducted in Huta Poreby, which was completed, after ten years of testing, in 2021.
2. Experimental Setup
The entire facility that has been built on the open-air test site was described in detail in previous publications [
17,
18]. The most important data regarding this experimental setup will be presented below, with particular emphasis on the characteristics of the unique generator, which is capable of simulating lightning continuing currents.
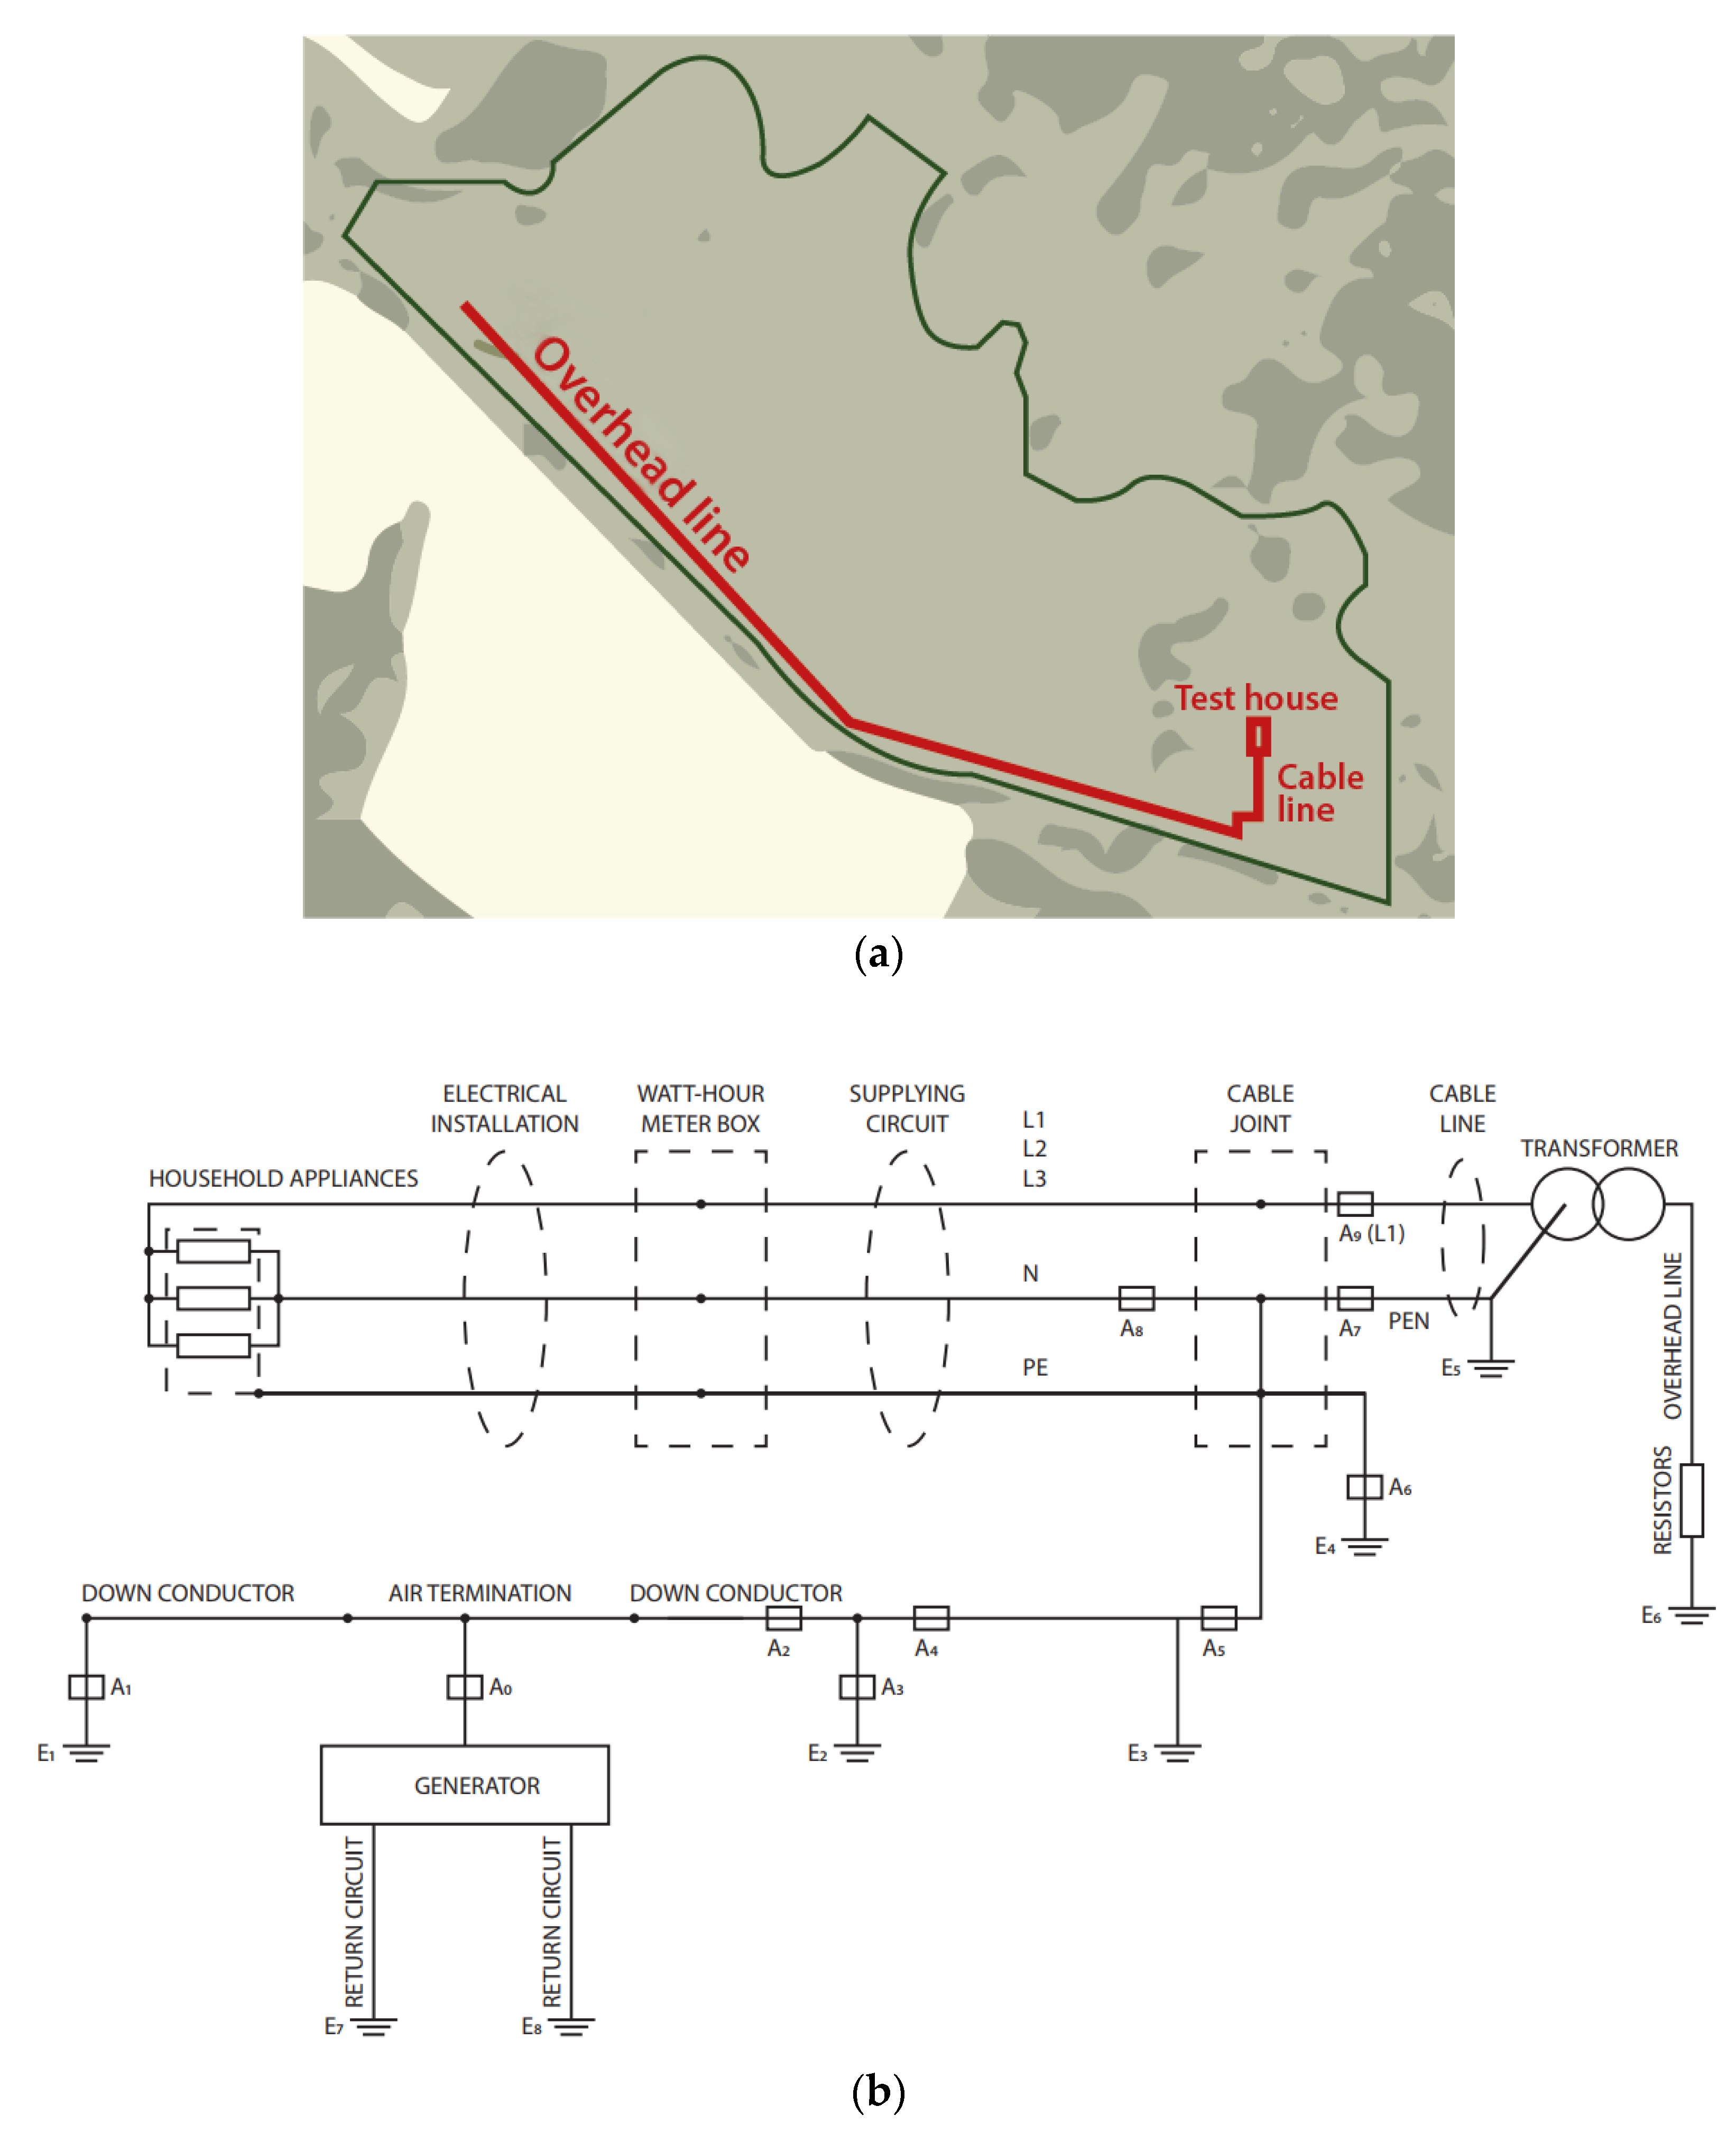
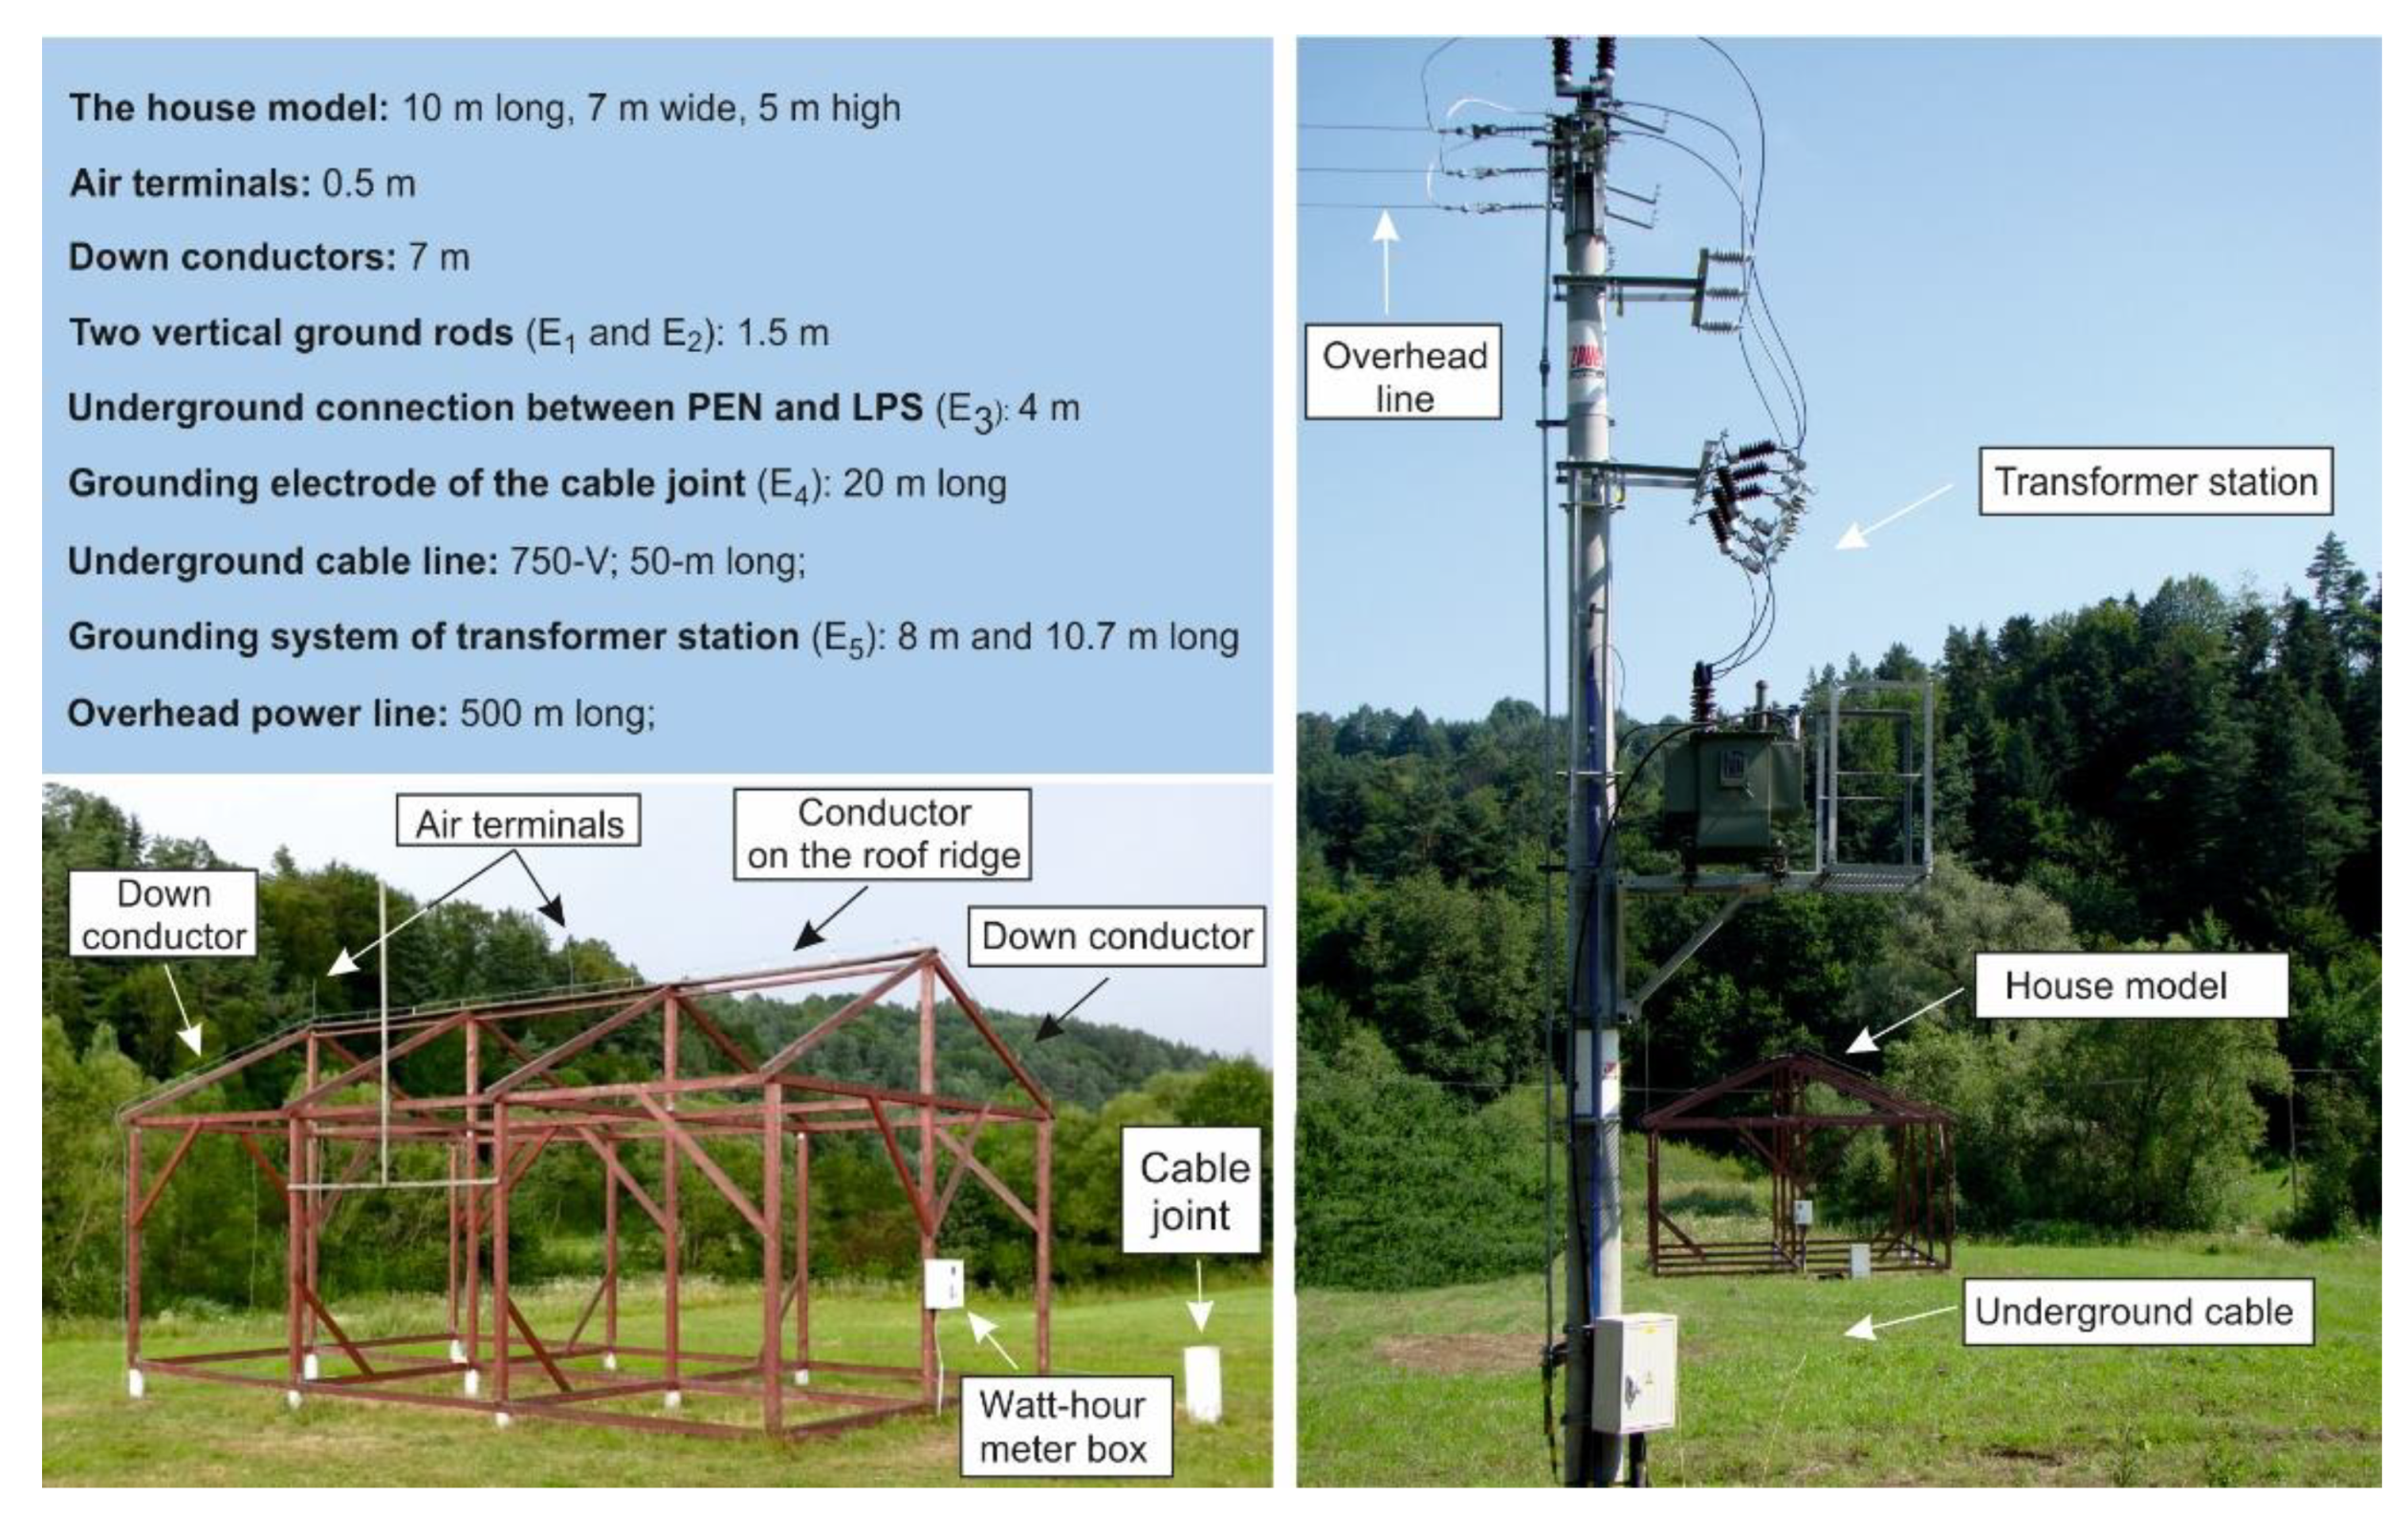
The basic element of the test object is a physical model of a typical residential building with an installed lightning protection system. The electrical installation of the facility was connected by an underground cable line to the MV/LV distribution transformer. Additionally, an unenergized overhead power line that was 500 m long and wave-matched on the second end, with resistances equal to 470 Ω, was connected to the MV side of the transformer (see
Figure 1a).
Note that only a single stage of the overvoltage protection was implemented in the watt-hour meter box since the main goal of the project was to analyze the distribution of the lightning current in the external LPS. The currents flowing into the electrical installation inside the test house were very small (below 1 A) and had no practical effect on this distribution. Therefore, the electrical installation inside the house was not fully developed. A detailed layout of all conducted installations, including, among others, the lightning protection system of the building connected to the impulse current generator, is shown in
Figure 1b. In order to better illustrate the analyzed system, pictures of the main objects and the installation built at the test site in Huta Poreby, together with a description of their parameters, are presented in
Figure 2.
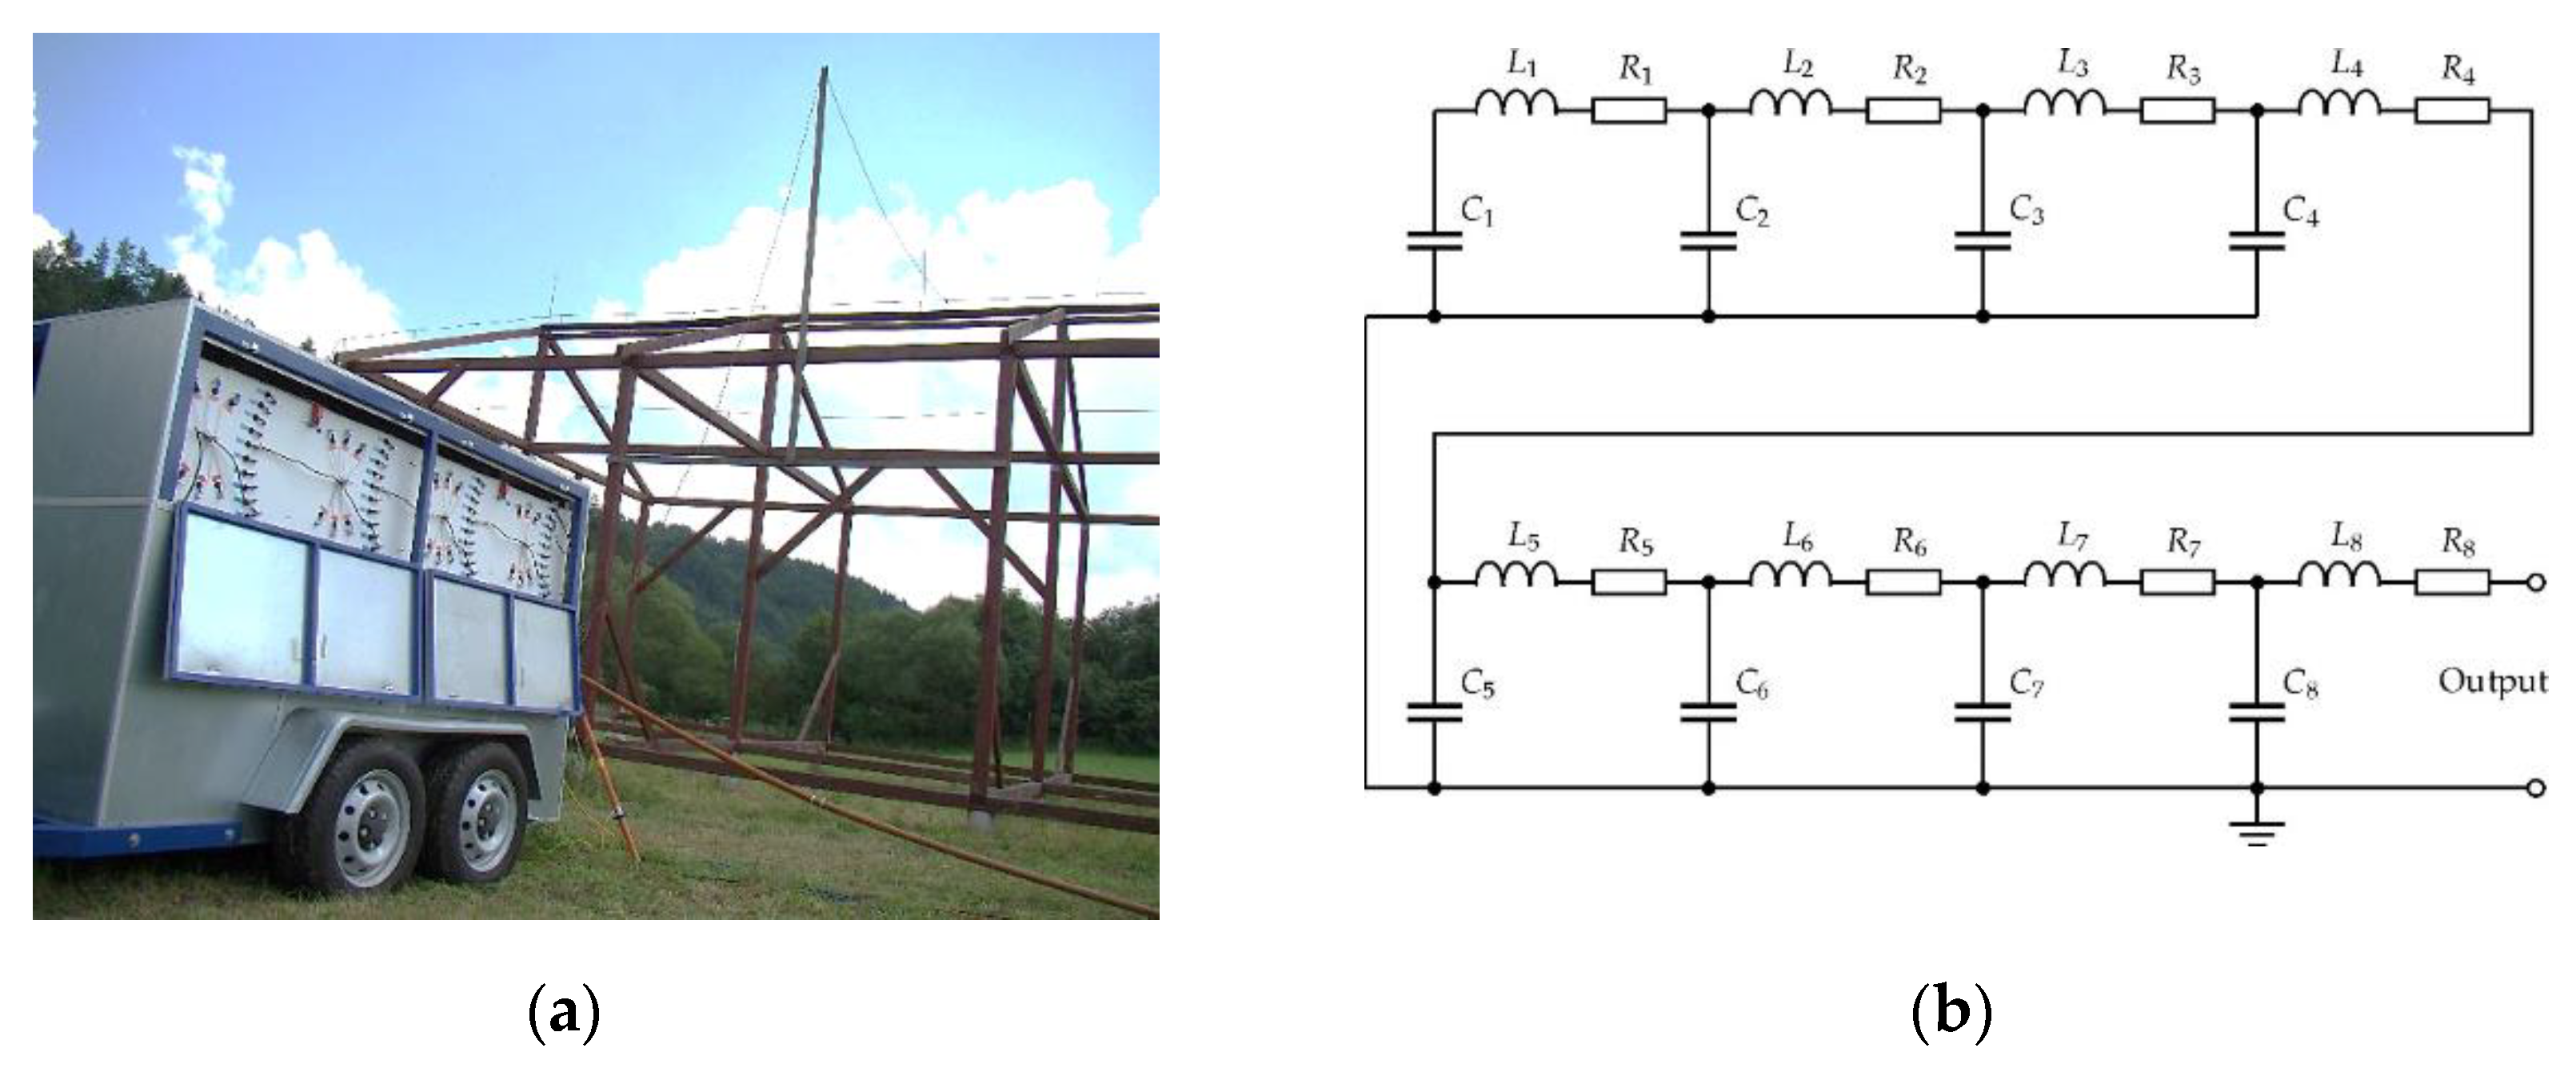
In order to physically simulate the continuing current, a special impulse current generator was used, with a spark gap acting as a typical closing switch (see
Figure 3). The basic parameters of the generator are: type GUP-10/100, operating voltage up to 10 kV, stored energy 100 kJ, maximum current 500 A, and its duration from the interval is 10–120 ms, according to the settings. Thanks to the precise setting of the operating voltage the generator was capable of injecting the same current in subsequent tests. As the basic configuration of the generator, an 8-segment-long line was used. In a relatively simple way, one can change the peak current value and duration of the pulse by changing the capacitance, which consists of six adjustment levels, from 50 μF to 300 μF, and by changing the inductance using nine adjustment levels, from 1.85 mH to 153 mH.
Figure 3b shows a simplified schematic of the generator.
During each current injection, five currents could be measured simultaneously, using low-induction shunts and battery-powered oscilloscopes. In such a configuration, the possibility of repeating the experiment for the same input currents from the generator at the constant impedance value of the test object and other conditions was crucial, due to the large number of measuring points distributed throughout the system.
3. Numerical Model
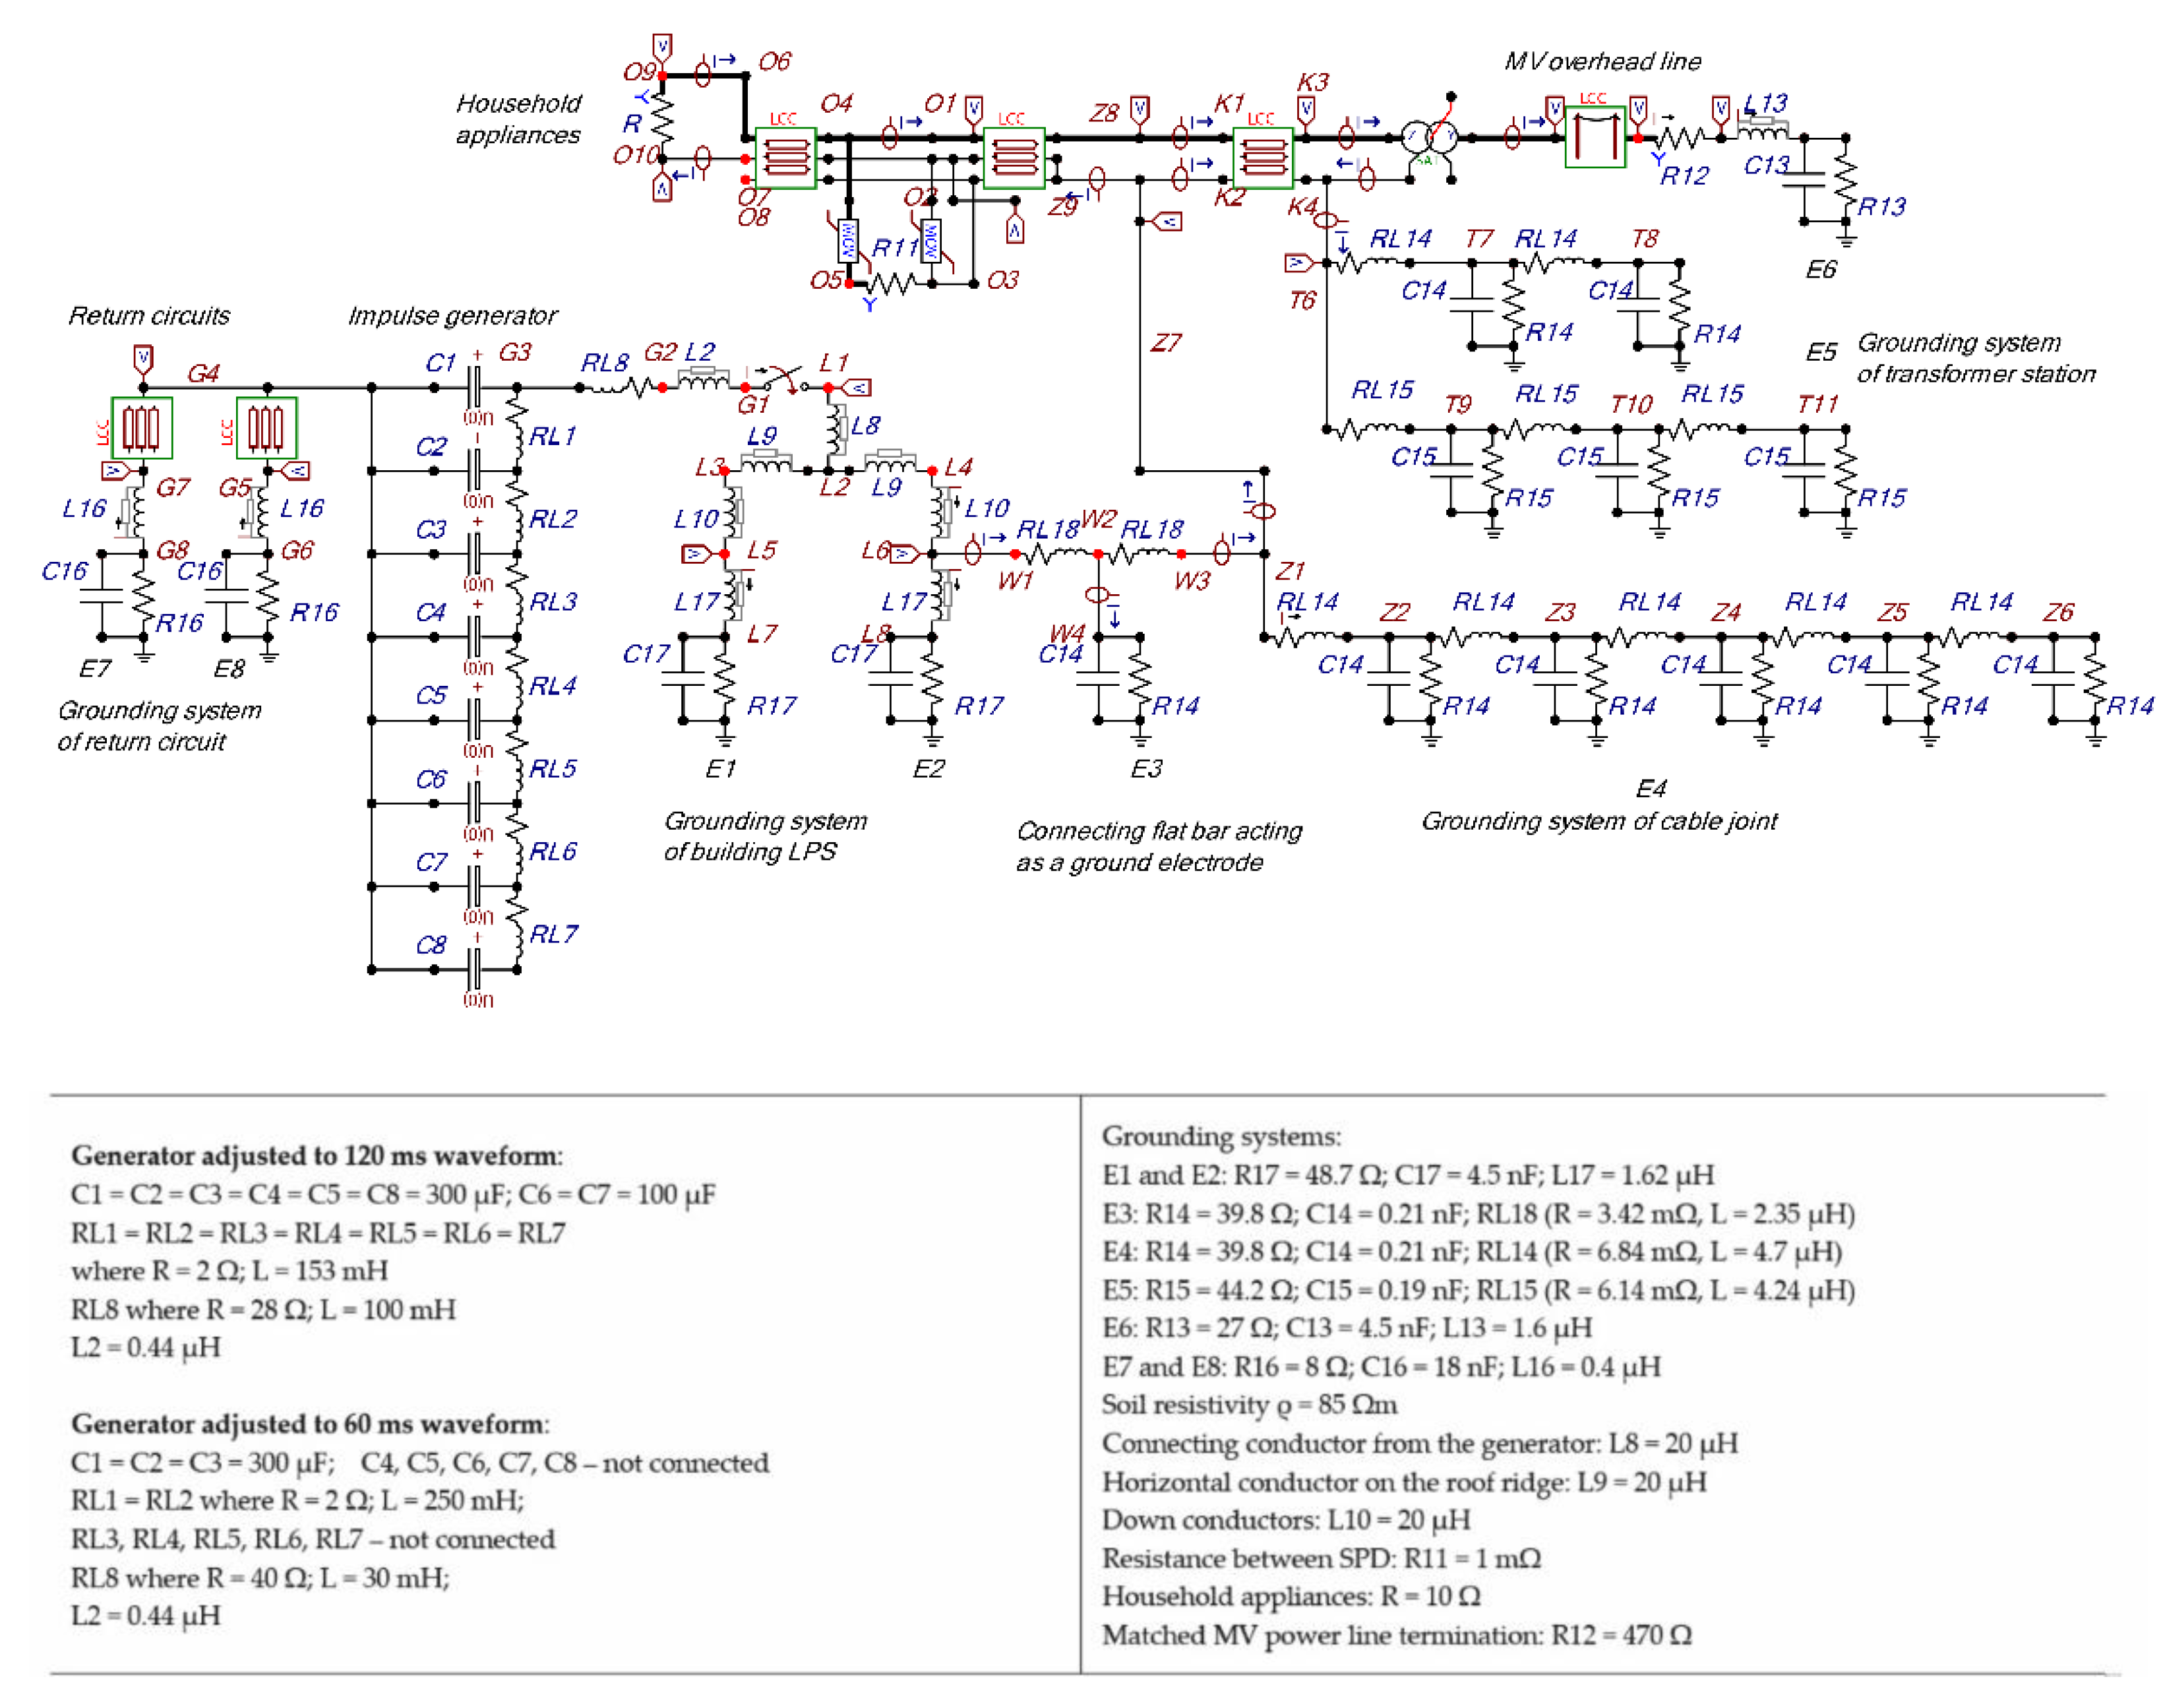
A complex model of the test object and measuring system, based on the circuit theory approach, has been prepared and implemented in the ATP-EMTP software package. In fact, the model shown in
Figure 4 is an improved version of the model used in [
19] for the computation of lightning return stroke currents and voltages in the LPS of a residential building and an attached overhead power line.
When modeling the real system used for field tests, one important element is the method of representation of the impulse current generator. The input current depends not only on the parameters of the generator itself but also on the whole circuit to which it is connected, i.e., the tested object and all groundings [
21,
22,
23]. Therefore, the generally accepted approach, which uses an ideal current source with an arbitrarily defined current waveform, is a far-reaching simplification of the real conditions in this type of computer investigation. In our study, the impulse generator was modeled in detail, with lumped elements having the same parameters as the real current source that was used at the test site (see
Figure 4). Note that the charge voltage value of the generator capacitances has been selected so that the generated current pulse has the same peak value as during the experimental tests.
The LPS conductors mounted on the structure above ground were modeled using the lumped inductances for simplicity (see
Figure 1b and
Figure 2). Moreover, the RLC circuit proposed by Sunde [
24] was applied, in order to take into account the frequency characteristics of ground electrodes [
17,
25]. Note that many analyses and proposals for the modification of this circuit approach have been made and presented in publications, among others, in [
26,
27,
28,
29,
30,
31]. However, an analysis carried out by another researcher showed that the models of ground electrodes proposed in [
24] proved to be the most suitable. Finally, such a solution was adopted when modeling the vertical and horizontal ground electrodes shown in
Figure 1.
Furthermore, the cable version of the ATP-EMTP line and cable constants (LCC) with distributed parameters was used to model the single- and multi-wire-insulated conductors of the test object. A cable line and supplying circuit were placed in the ground, while the conductors of the electrical installation were located in the building at some distance from the ground. The return circuit single-wire insulated conductors were laid out on the ground. The overhead line version (with uninsulated conductors) of the LCC model was used for modeling the MV overhead power line (see
Figure 1b and
Figure 4).
In the ATP-EMTP library, there are several quite good models of power transformers by which to simulate their work, in a range from the power frequency to several kilohertz, which is sufficient for the analyzed CC waveforms. Based on the nominal parameters of the transformer used in experimental studies, the current model was created using the SATTRAFO module.
Finally, different household appliances that were connected to its unpowered electrical installation were represented using resistors, R = 10 Ω, which were implemented for each phase. Note that the frequency characteristics of these appliances were previously analyzed in detail [
32]; however, for the estimation of the lightning current distribution in the LPS, such a simple representation using resistances turned out to be entirely sufficient.
The currents flowing in the LPS of the test object and the attached conducted installation were measured in points A
1–A
9, as shown in
Figure 1b. Generally, the injected current was divided into two parts. The first part was flowing into the ground of the building through two vertical electrodes, E
1 and E
2, while the remainder of the current was flowing toward the cable joint through the horizontal underground flat bar, E
3. Then, part of the current was flowing to the grounding electrode E
4 of the cable joint, and the rest to the PEN conductor. The current flowing in the PEN conductor finally reached the electrical installation inside the facility and the transformer, through the underground cable line. In the transformer station, the current was flowing to the grounding system E
5 and also induced a small current on the MV side of the transformer that was flowing in turn along the overhead line to the grounding electrode, E
6. It is worth emphasizing that the whole circuit was closed through the conducted soil and all groundings, including the grounding electrodes of the generator return path.
4. Measurement and Computational Results
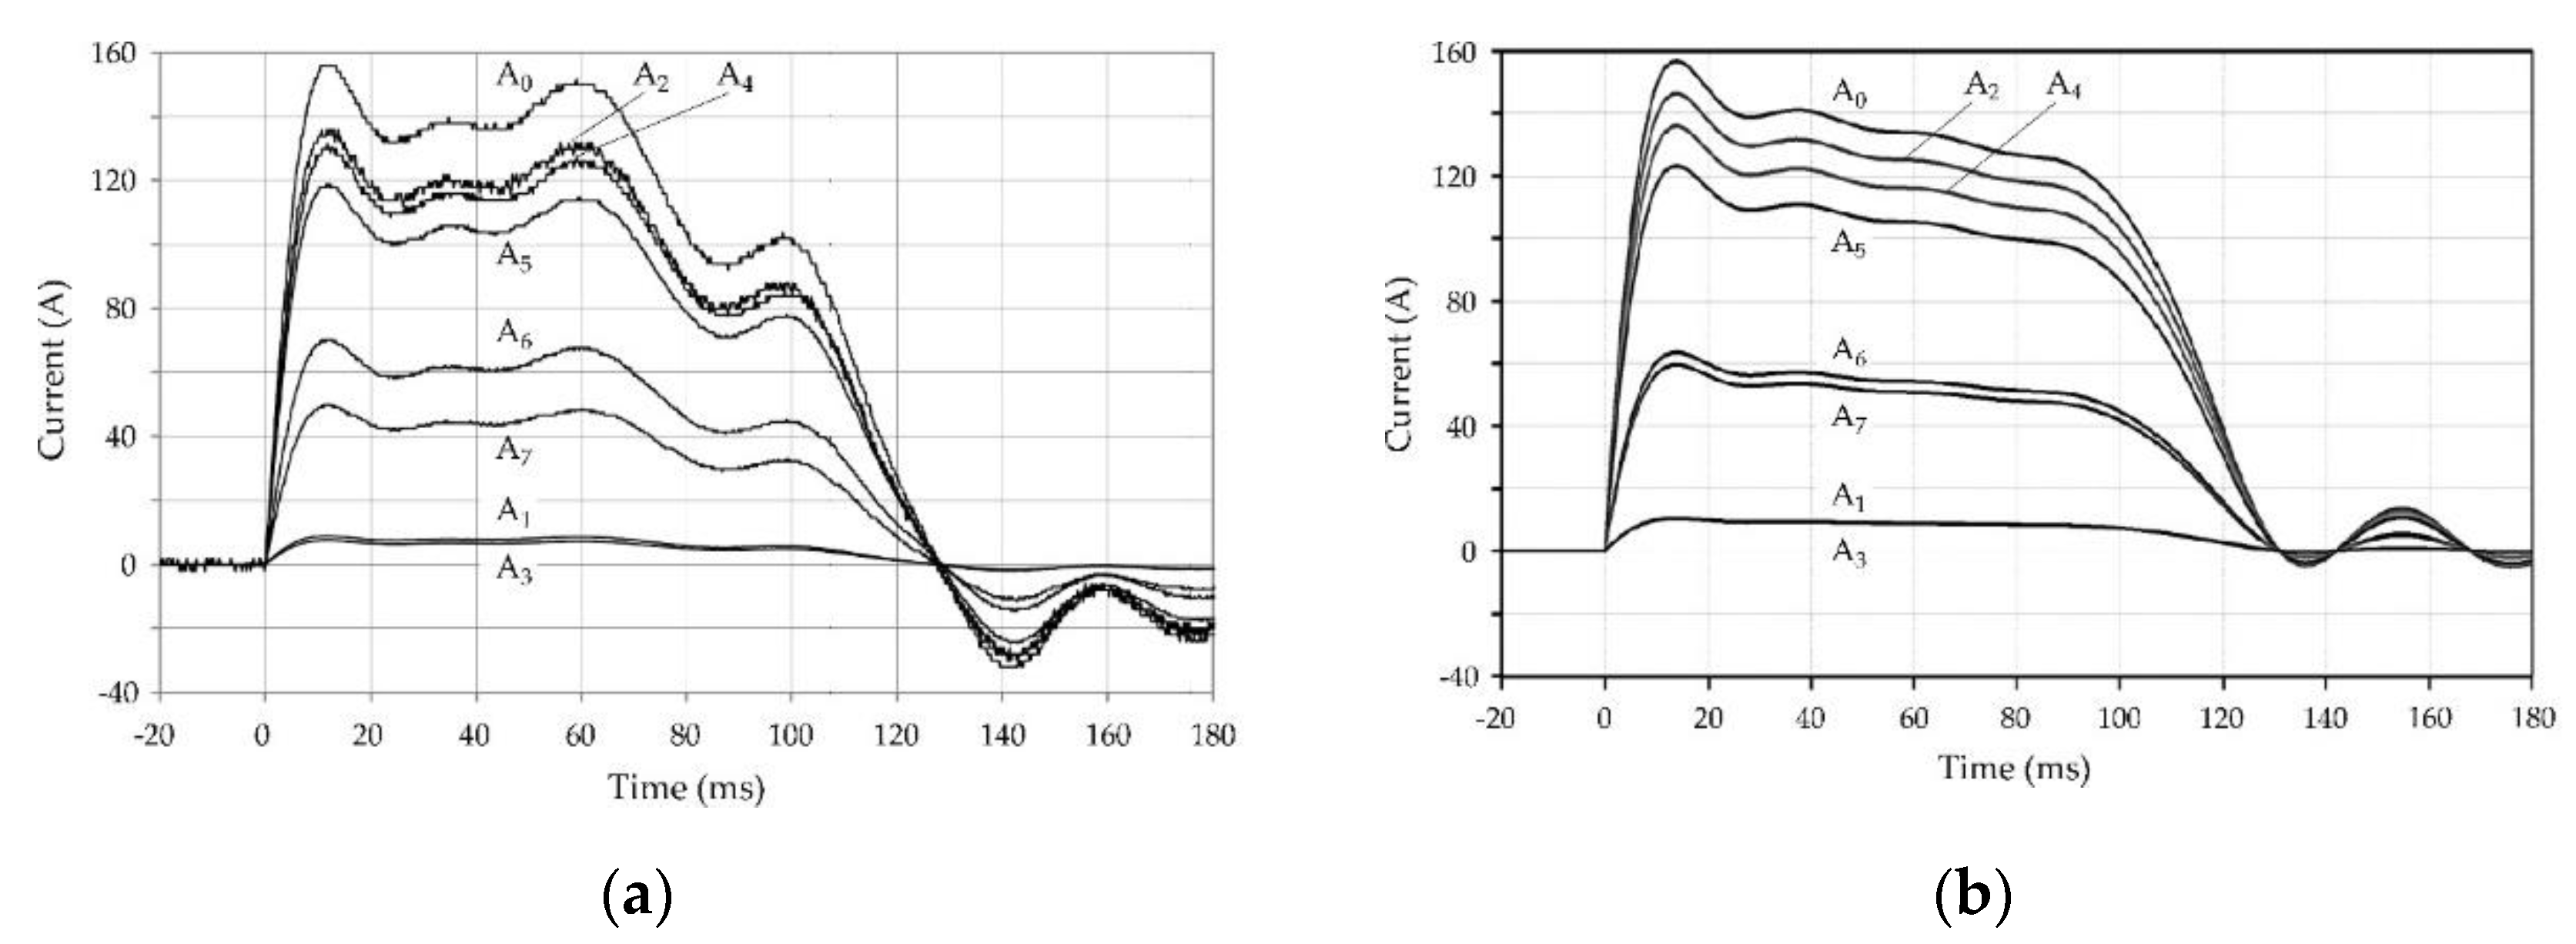
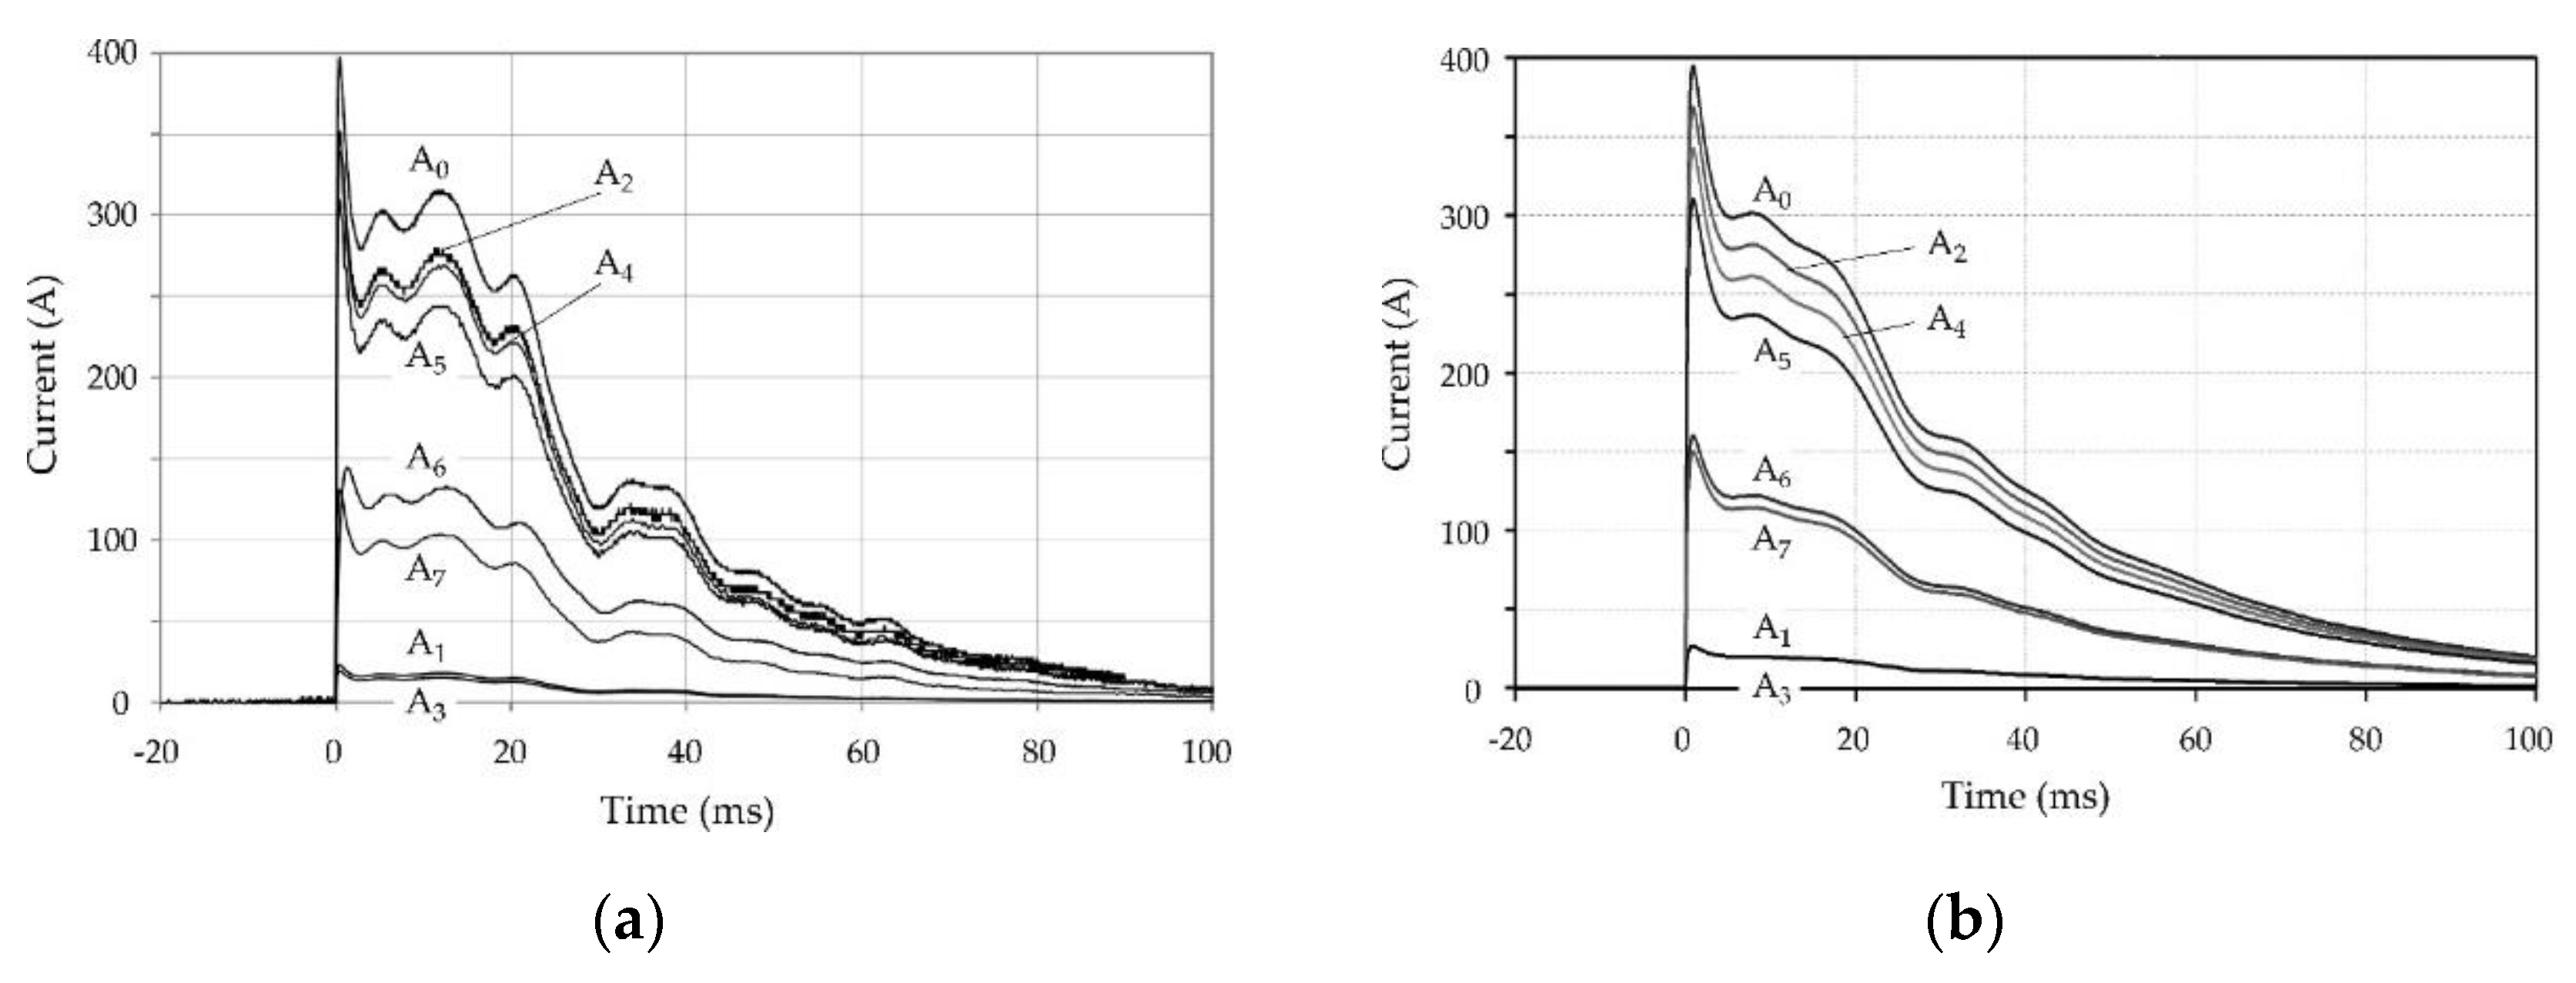
The selected results of experimental tests and the computer simulation are presented in
Figure 5,
Figure 6,
Figure 7,
Figure 8 and
Figure 9. Current waveforms were measured and modeled at ten points, A
0 to A
9.
The distribution in the test object of the injected current with a duration of 120 ms is shown in
Figure 5, where the same measurement points are marked as in
Figure 1b. The currents flowing in the electrical installation, A
8 and A
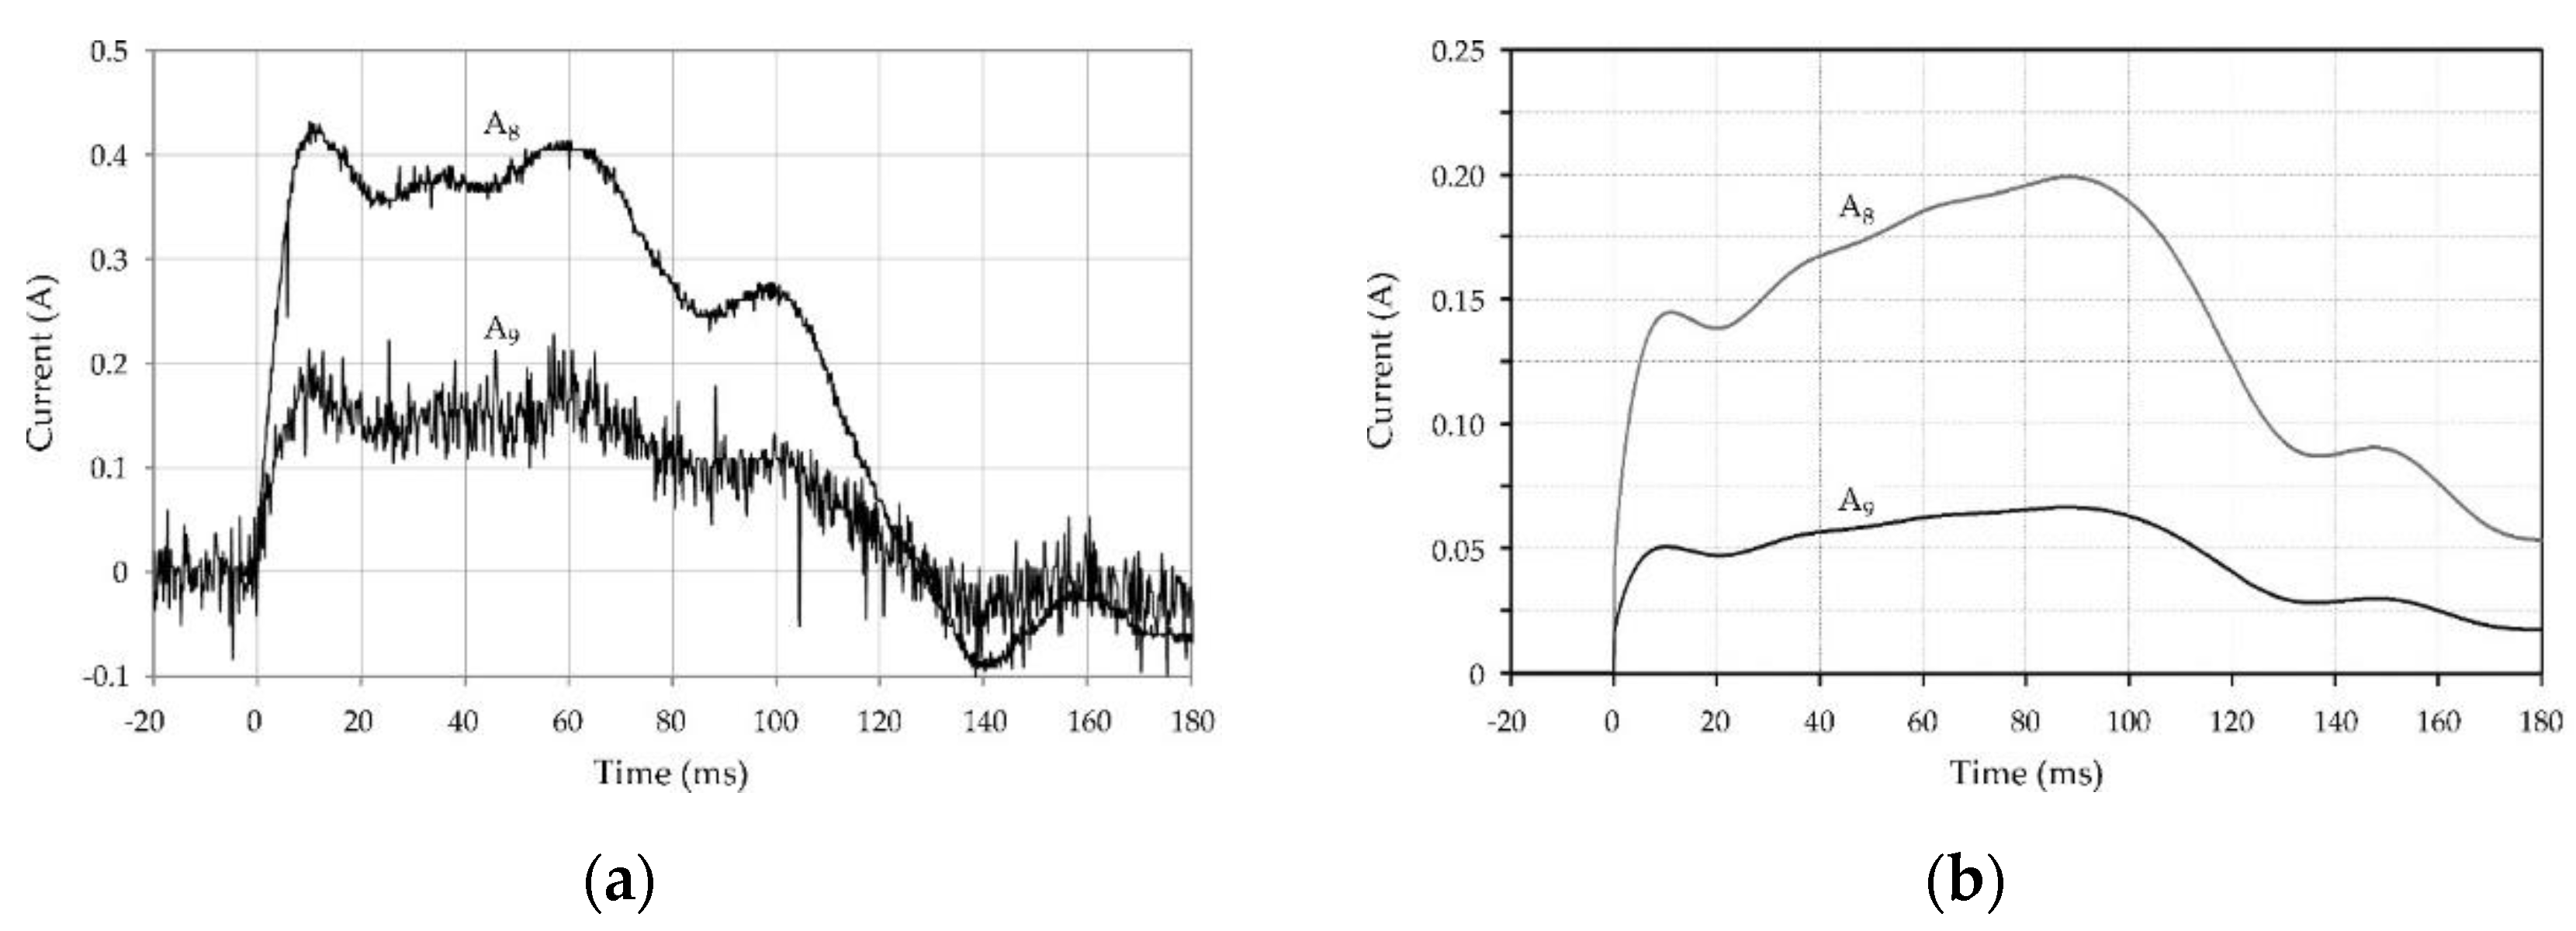
9, were less than 1 A; therefore, they are shown in a separate
Figure 6, together with the currents flowing into the grounding system of the physical model of a typical residential building. Note that for an even better insight into the nature of these small currents, they are shown again in
Figure 7. Apart from the measured waveforms, the obtained results of the computer simulations are also presented in
Figure 5,
Figure 6 and
Figure 7 (right panels) in the case of a current injected from the mobile generator, with a total duration of 120 ms. Comparing the calculated waveforms with the measured ones, certain differences, resulting mainly from the imperfect representation of the real system in the modeling process, can be noticed, but taking into account its high complexity, it can be generally stated that the obtained computer results are satisfactory.
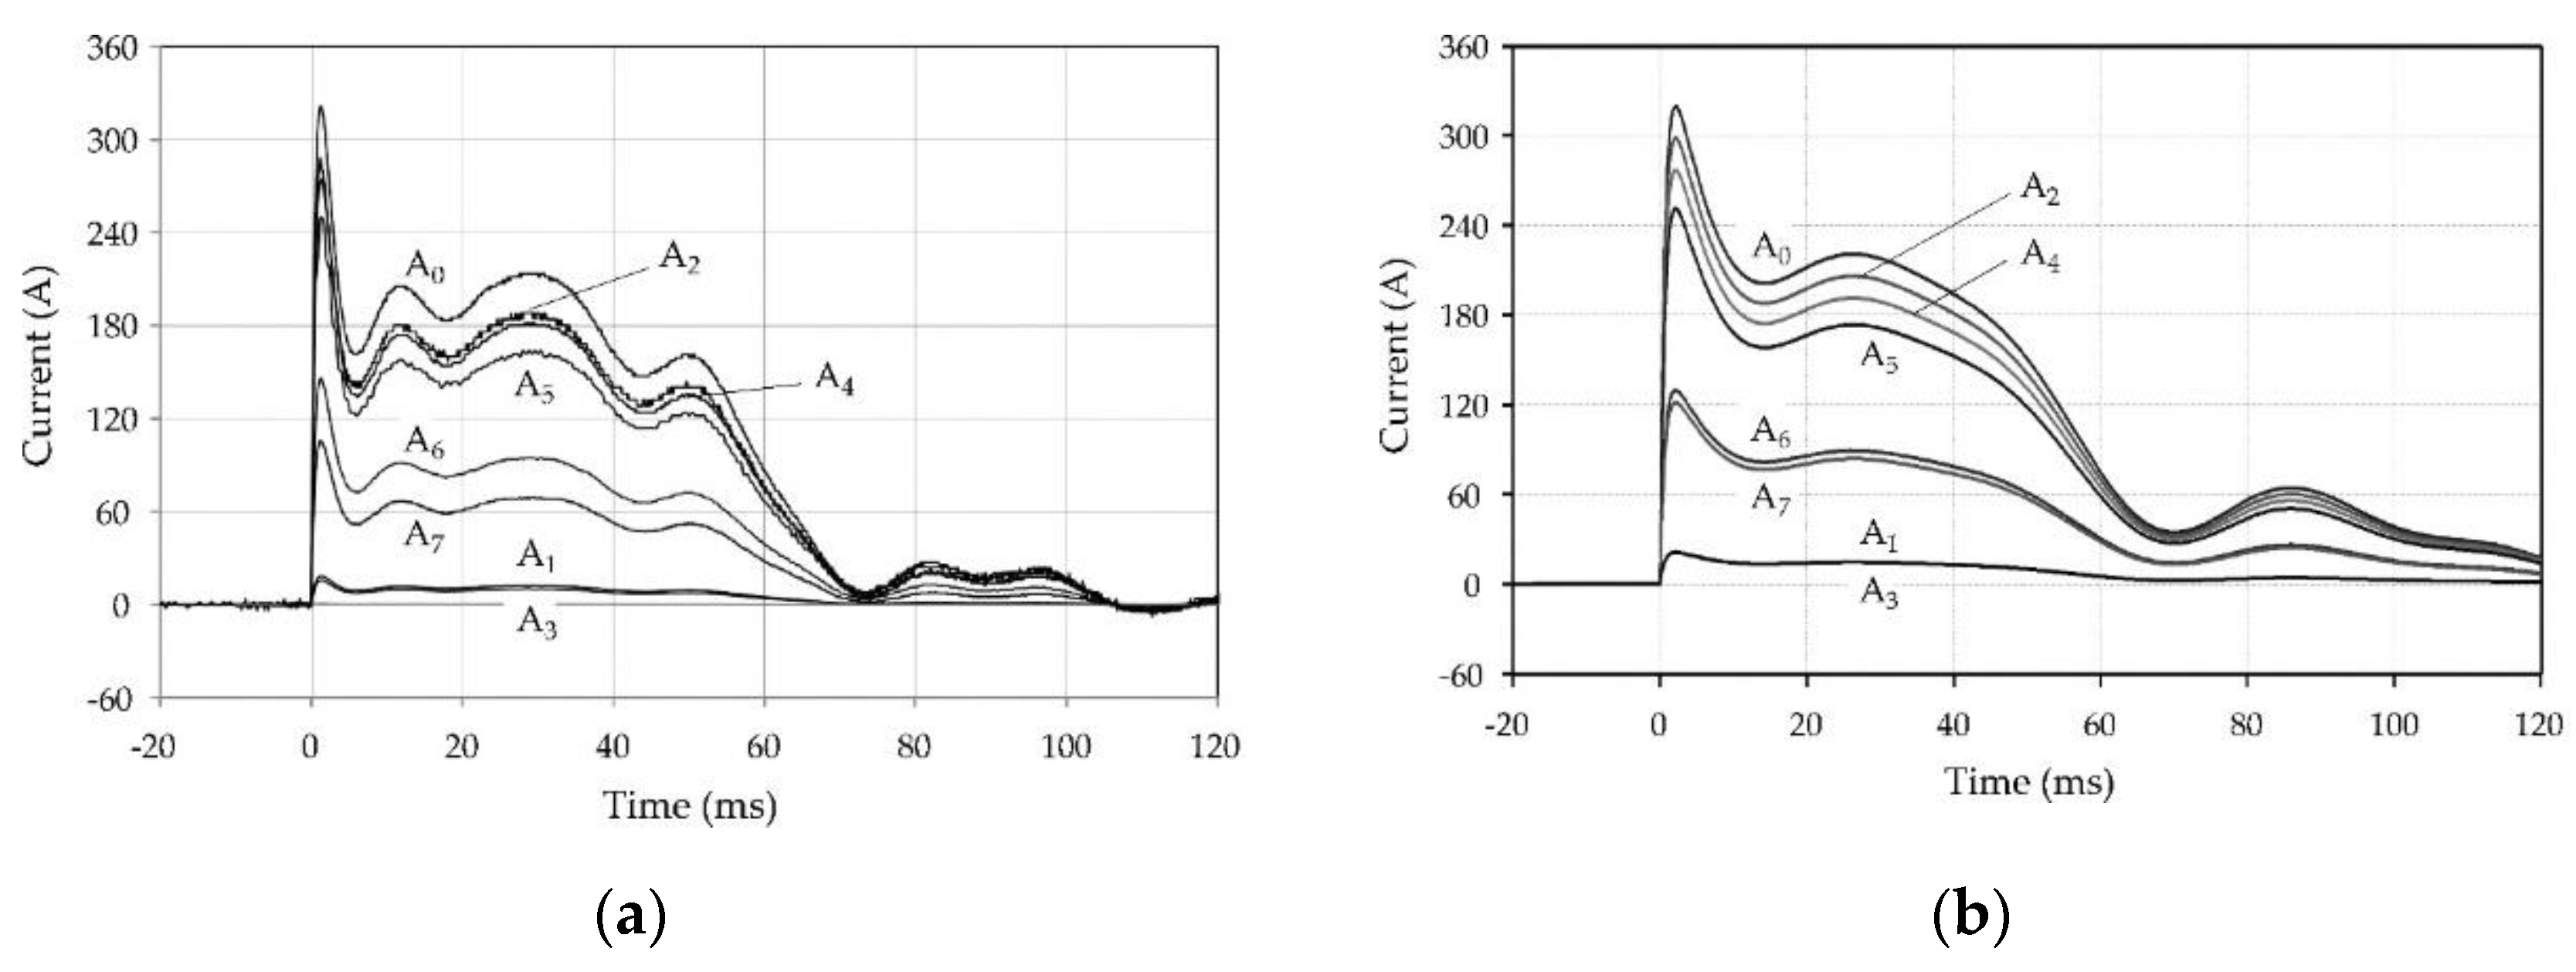
The performed measurements and calculations were repeated after adjusting the generator to inject shorter current impulses, i.e., of 60 ms and 30 ms duration, into the LPS air termination. Note that the new registrations were made for twice the values of CC currents, compared to those described in [
20], which made the injected currents similar to those that occur during natural lightning discharges. The obtained results, together with the computed waveforms, are presented in
Figure 8 and
Figure 9.
5. Analysis and Discussion
The current waveforms that are shown in
Figure 5,
Figure 8, and
Figure 9 are characterized by considerable similarity. According to the authors of [
10], they can represent type I of the six identified continuing current types, which is determined more or less by the exponential decay waveshape. This type of continuing current component of the lightning current is treated as the first or second most frequently occurring CC waveshape. Therefore, it can be stated that the irregular waveshapes of the currents obtained from the generator are very similar to the natural CC, with superimposed M-components.
Generally, the distribution of the injected current pulses depends on the frequency-dependent impedance of the test object elements and, in particular, on the impedance of their groundings. However, due to the relatively slowly changing nature of the lightning’s continuing current, the upper range of its frequency spectrum does not exceed several dozen kilohertz; in addition, the resistance of the groundings instead of impedance can be used in practice during a rough analysis of the distribution of this lightning current component. The effect of this, among other things, is that the current wave shape does not change in the different parts of the system. The proportions between the amplitudes of currents in the individual elements of the test object are also almost the same in all considered cases, that is, with different pulse durations injected from the generator. Some differences only occur, especially in the initial part of the current waveforms, when the changes are the fastest. In fact, in the case of shorter impulses, the first current peak is much sharper, which means much higher steepness to the wavefront, followed by other local current peaks exceeding several dozen percentage values of the remaining parts of the waveforms (see
Figure 8 and
Figure 9). This results from the parameters of the generator and from the properties of the test object.
For example, the resistance values of the vertical ground electrodes, carried out at low frequency [
19], of the LPS (E
1: 47.6 Ω, E
2: 43.3 Ω) and underground flat bar (E
3: 29.3 Ω) are 5 to 10 times greater than the grounding resistances of the cable joint (E
4: 5.9 Ω) and the transformer station (E
5: 4.7 Ω). Therefore, currents A
1, A
3, and the current making up the difference between A
4 and A
5 flowing into the E
1, E
2, and E
3 groundings, respectively, are smaller by the same number of times than the currents A
6 and A
7, flowing through the E
4 and E
5 ground electrodes, respectively (see
Figure 5 and
Figure 6).
The comparison of waveforms in
Figure 5 and
Figure 7 shows that, through the conductor N of the internal wiring of the electrical system, there flows into it about 100 times less current A
8, compared to the current A
7 flowing into the cable PEN conductor. The current A
8 flows through the household appliances, returns as current A
9 along the phase conductors of the installation, and finally flows through the watt-meter box to the cable joint. Then, it continues to flow through the cable to the transformer windings and, finally, to the grounding system of the transformer station. The currents A
8 and A
9 are limited mainly by the impedances of household appliances, the inductances of the long circuit, and the transformer LV windings.
Regarding the LPS operation of a residential building mounted at the Huta Poreby test site, which has very conductive ground (resistivity of about 100 Ωm), the lightning continuing current was dissipated into the local ground with a few percent more efficiency than in the case of a lightning return stroke current. A comparison of the efficiency of the same LPS for the RS and different CC components is presented in
Table 1.
It is important to note that for the CC components with twice the current values, a slight reduction in the efficiency of the installation was indicated (relatively more current is flowing toward the transformer station through the PEN conductor), but the efficiency is still higher than for the RS component.
The computer simulation results of the distribution of the lightning continuing current are shown in
Figure 5b,
Figure 6b,
Figure 7b,
Figure 8b and
Figure 9b. Taking into account the complexity of the system, a generally good agreement between the waveforms and amplitudes of currents that are measured and modeled has been obtained.
Some differences occur in the case of current A
2, where its measured values are smaller than the values of differences between the measured currents A
0 and A
1. This is not the case for the computed current A
2, as expected. Furthermore, current A
7 in the PEN conductor has about 30% higher values compared to its measured values (see
Figure 5,
Figure 8, and
Figure 9). One can also see small differences between the computed and measured currents A
1 and A
3 (see
Figure 5), which flow into the grounding system of the building (see points E
1 and E
2 in
Figure 1). This is related mainly to differences between the measured and modeled ground electrode parameters. In the case of the numerical model, the parameters of both ground electrodes are the same, since the same geometrical parameters of the E
1 and E
2 electrodes and the same value of ground resistivity were used, while there may be some differences in the real arrangements and conditions.
The biggest differences occur between the measured and calculated waveforms of currents A
8 and A
9 (see
Figure 7), flowing through the test object electrical installation and underground cable line. For these relatively very small currents compared to the injected current, the greatest differences were to be expected. In fact, an inability to accurately reproduce a real complex system in the circuit model can significantly affect the obtained computer simulations.
Finally, it should be noted that despite the possibility of using simplified assumptions in a rough analysis of the lightning continuing current distribution in the LPS and attached conducted installations, an accurate frequency-dependent approach is still required for detailed modeling of the current waveshapes in different parts of the system. Moreover, the results of the computer simulations are also influenced by mutual inductances and capacitances, as well as by dispersed capacitances, mainly relative to the ground, which were not included in the presented model. Despite these limitations, it can be stated that the proposed model actually shows the lightning continuing current distribution with a satisfactory level of accuracy.
6. Conclusions
Measurements and the numerical modeling of long-duration current impulses distribution in the lightning protection system, electrical installation, and supply network of the test object presented in the paper represent the close of a more than ten-year period of research conducted at the test site of Huta Poreby. During this period, the effectiveness of various LPS configurations was tested and the results were compared to those obtained at Camp Blanding during experiments with rocket-triggered lightning. The findings of that research have been presented in this paper.
The measurements of lightning continuing current distribution conducted at the test site on a structure equipped with LPS were then modeled using the ATP-EMTP software package. The circuit models of all elements of the tested facility were created and presented in detail, together with a new model of the impulse current generator. The correctness of the proposed models has been confirmed by satisfactory accuracy between the measured and modeled distribution of the lightning continuing current component. Some small differences between the experimental and computational results are caused by an incomplete representation of the actual parameters of the real test object in its numerical model, such as, for example, the mutual and dispersed inductances and capacitances occurring in real conditions.
The results shown in this paper are, to a certain extent, similar to those presented for the distribution of lightning return strokes obtained during previous research carried out at the University of Florida and at the Rzeszow University of Technology. However, it is worth noting that the efficiency of the LPS system in dissipating the lightning current to the local ground is several percent higher for the continuing current component, compared to the return stroke currents. Moreover, due to the low content of high-frequency components in the spectrum of the long continuing current, the waveshape of this lightning component is practically the same in the entire tested installation. It means that the influence of the frequency-dependent ground impedance on the relatively slower-changing current waveforms of long-duration components is significantly smaller, compared to its effect on the fast-changing waveforms of return strokes, as was expected.


