Article

Life-Cycle Assessment of Bio-Jet Fuel Production from Waste Cooking Oil via Hydroconversion

1
College of Aeronautical Engineering, Civil Aviation University of China, Tianjin 300300, China
2
Transportation Science and Engineering, Civil Aviation University of China, Tianjin 300300, China
*
Author to whom correspondence should be addressed.
Energies 2022, 15(18), 6612; https://doi.org/10.3390/en15186612
Submission received: 31 July 2022 / Revised: 25 August 2022 / Accepted: 7 September 2022 / Published: 9 September 2022

Abstract

:
A life-cycle assessment of bio-jet fuel from waste cooking oil (WCO) produced by hydrotreatment was performed and compared with petroleum-derived jet fuel. This study aimed to evaluate the sustainability and find out the bottleneck restricting the development of WCO-based jet fuel production. The carbon intensity of the WCO-based bio-jet fuel was 63.7% lower compared to the conventional jet fuel, and the proportion of greenhouse gas (GHG) emissions caused by hydrogen in the WCO was 18.7%. The feedstock stage proportion of GHG emissions of first-, second-, and third-generation biofuels increased. A sensitivity analysis found that the transportation distance of WCO was more sensitive to GHG emissions, and it is important to develop a detailed plan for feedstock collection. A scenario analysis was also performed according to China’s energy structure and hydrogen sources. Although the electric power structure derived from renewable energy will increase GHG emissions in the immediate future, it will eventually reduce emissions due to technical progress by 2050. The preparation of jet fuel from WCO can not only recycle waste but can also contribute to emission reduction for the aviation industry, which is a potential sustainable and feasible aviation fuel route.

1. Introduction

In recent years, greenhouse gas (GHG) emissions of jet fuel, which account for approximately 2% of GHG emissions, have increased significantly with the rapid development of the aviation industry [1,2,3]. The International Air Transport Association (IATA) announced that CO2 emissions will be reduced by half by 2050 [4]. Bio-jet fuel has the potential to reduce GHG emissions throughout the entire life cycle [5,6,7]. ASTM D7566 has approved seven alternative aviation fuel routes that have been commercialized. In 2017, the Aviation Environmental Protection Committee (CAEP) proposed verification requirements for alternative aviation fuels including not only technical performance (ensuring flight safety) but also sustainability (ensuring emission reduction) [8].
Life-cycle assessment (LCA) has proven to be extremely useful for assessing liquid fuels based on their global warming potential and is widely used as a tool to assess the sustainability of energy systems [9,10]. The emission value of traditional jet fuel is about 73.2 ± 2.1 g CO2e/MJ, and the GHG emissions of coal and natural gas liquefaction fuel may be twice than that of petroleum-based fuel [11]. The GHG emissions of soybean-oil-based fuel, a first-generation biomass, are 13.0–141.0 g CO2e/MJ [10]. The GHG emissions of microalgae-oil-based fuel (a third-generation fuel) are 17.2–851.9 gCO2e/MJ [10]. The large fluctuation range is closely related to the production mode and capacity of algae and the distribution scheme of by-products, and further efforts must be made before large-scale production can be achieved. A second-generation biofuel can be commercialized and applied on a large scale. These biofuels are derived from biomass that cannot be consumed by humans, including plants and municipal solid waste. Mohammad et al. found that a bio-jet fuel from jatropha could achieve a 75% reduction in GHG emissions compared to petroleum-derived jet fuels [12]. Ringsred et al. found that the carbon intensity of pyrolysis-based bio-jet fuels produced by hydrotreatment in Canada was 69–71% lower than the carbon intensity of a conventional fossil-based jet fuel [13]. Beal et al. found that forestry residue and waste oil pathways decreased emissions (23 and 35 g CO2e/MJ, respectively) [14].
It is expected that about 50,000 tons of sustainable aviation fuel will be used in five years in China. China’s output of waste cooking oil (WCO) has reached 10 million tons a year. However, WCO is not used in commercialization applications for aviation fuel in China, and few studies have been conducted to evaluate the sustainability and feasibility of the WCO-based aviation fuel. Therefore, in this paper, LCA analysis of bio-jet fuels produced from WCO by hydrotreatment with different conversion processes were performed from the perspective of carbon emission and energy consumption. Sensitivity analysis of the transport distance of the feedstock and fuel, as well as the treatment capacity, was performed. A scenario analysis was also performed according to China’s energy structure and hydrogen sources.

2. Methods

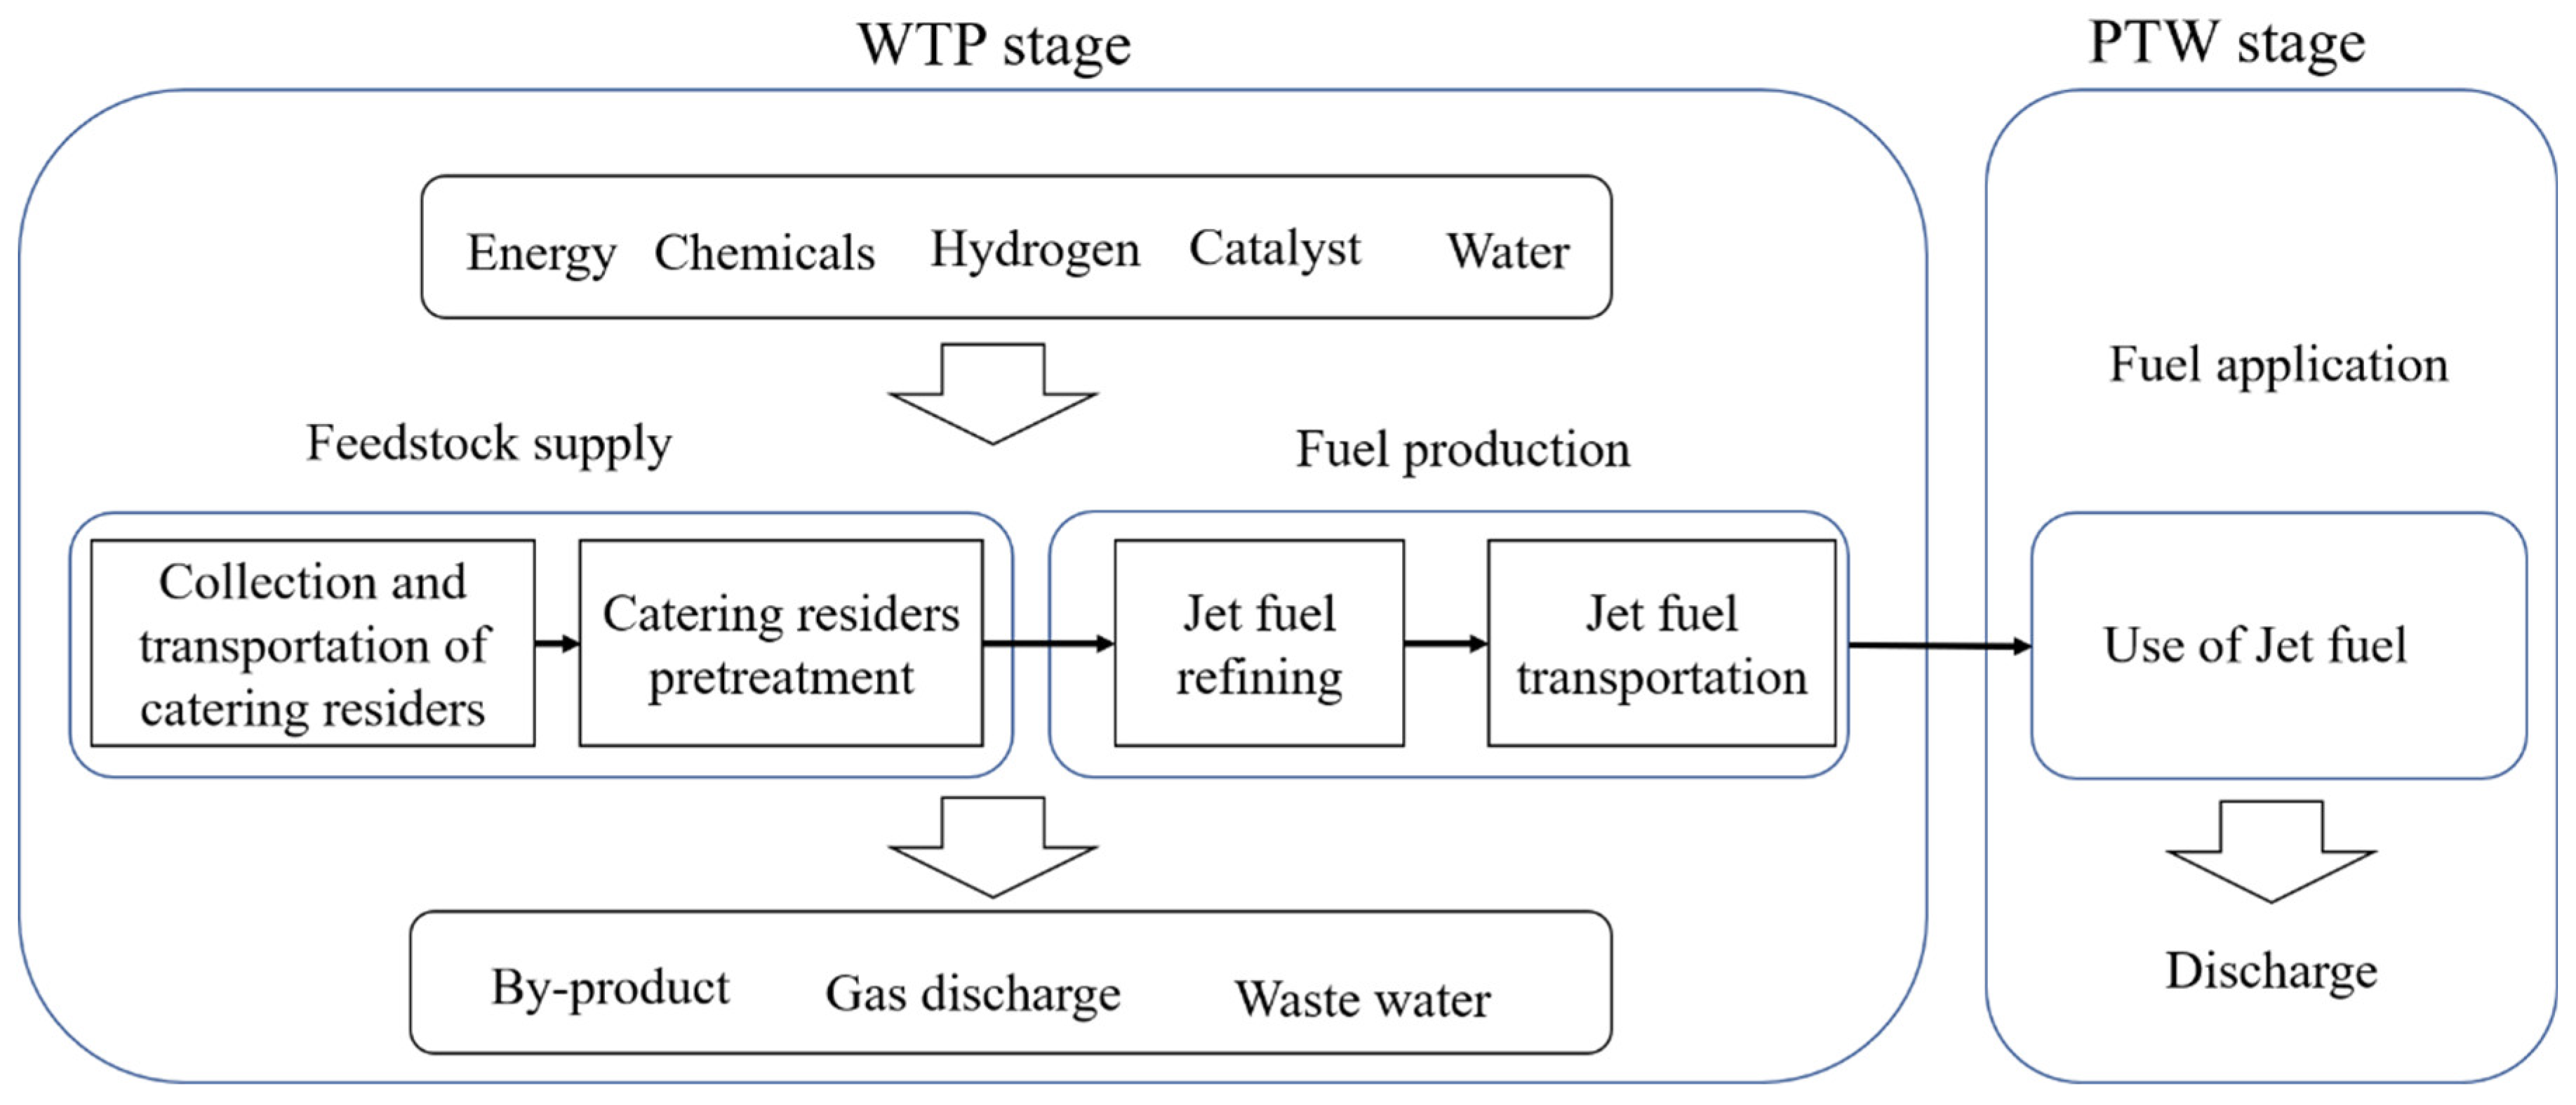
2.1. LCA system Boundary

LCA system boundaries and material energy flow charts are shown in Figure 1. LCA included the feedstock supply stage (collection and transportation of the meal residue, WCO pre-treatment), jet fuel production stage (refining and the transportation), and the use of a jet fuel stage [15]. The energy consumption and GHG emissions were mainly analyzed by ASPEN PLUS and GREET, modified by Chinese statistics (seen in Supplementary Materials) [15,16]. The functional units of this study were the energy consumption and GHG emission per 1 MJ of bio-jet fuel produced [10] (WTP, well-to-pump, the stage of the fuel production; PTW, pump-to-wheel, the stage of fuel consumption).
Transportation included the transportation of meal residue and bio-jet fuel. A goods wagon was used to recycle the meal residue, and the energy consumption was 2.36 MJ/(t·km) [17]. The average transportation distance was 80 km, from which the energy consumption and emission data of the recycling and transportation process of WCO could be calculated. The transportation of bio-jet fuel was based on the transportation structure of refined oil in China, and its average transportation distance was calculated with reference to the transportation model in GREET.

2.2. WCO Pretreatment and Jet Fuel Production

WCO was used for the bio-jet fuel after pretreatment such as gravitational settling, centrifugation, and so on (water and solid impurities removed) (data from the Bihai Environmental Protection Company in Tianjin, China). The power of the centrifuge was 90 kW, and the treatment capacity was 60 m3/h. One ton of WCO could be obtained after pretreatment of ten tons of meal residue. Power generation structure was from China in 2020.
WCO was mainly composed of glycerides and free fatty acids. Bio-jet fuel was obtained by one-step hydrogenation, and the process of one-step hydrogenation is shown in Figure S1 (Supplementary Materials) [18]. The treatment capacity of catering waste oil was 600 ton/d. The optimized operation conditions were 380 °C, 500 mL/mL, and 3 Mpa [18]. The used cooking oil (UCO-1 (one-step hydrogenation) and UCO-2 (one-step hydrogenation)) process was based on the data from the literature [16], and the energy structure was based on the data from the Chinese mainland. Details of the methods used in this study can be found in the Supplementary Materials.

3. Results and Discussion

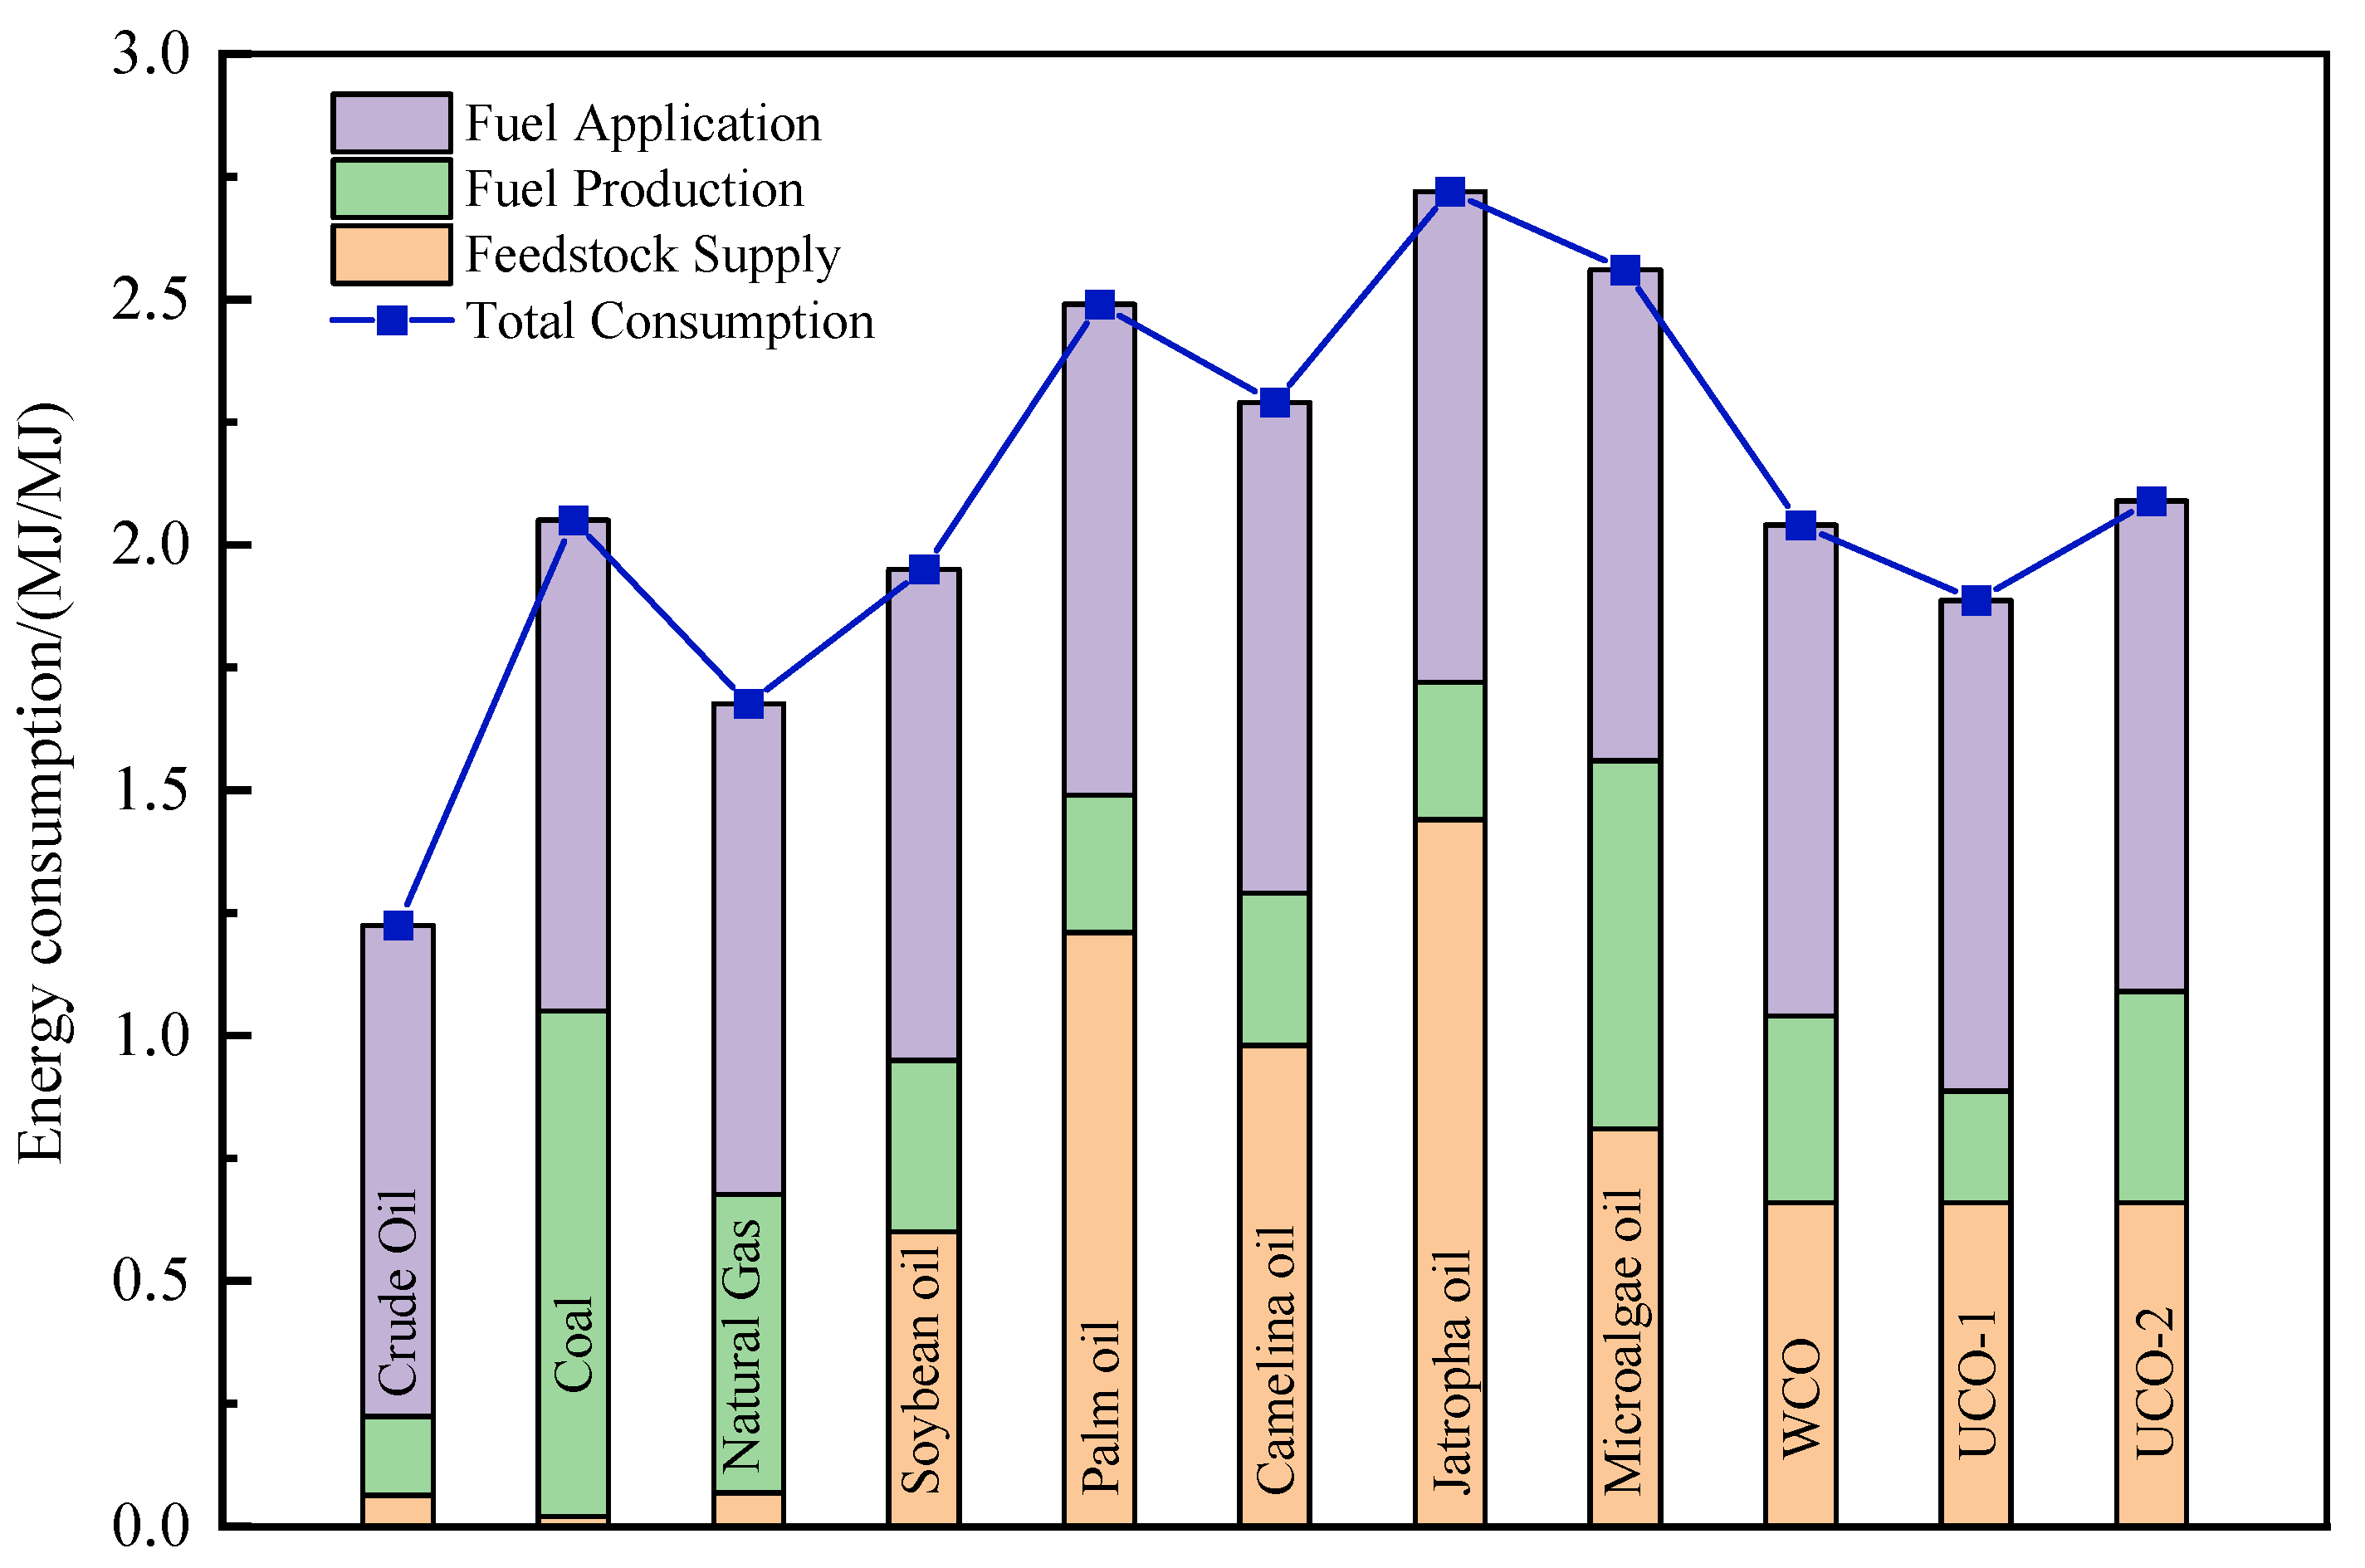
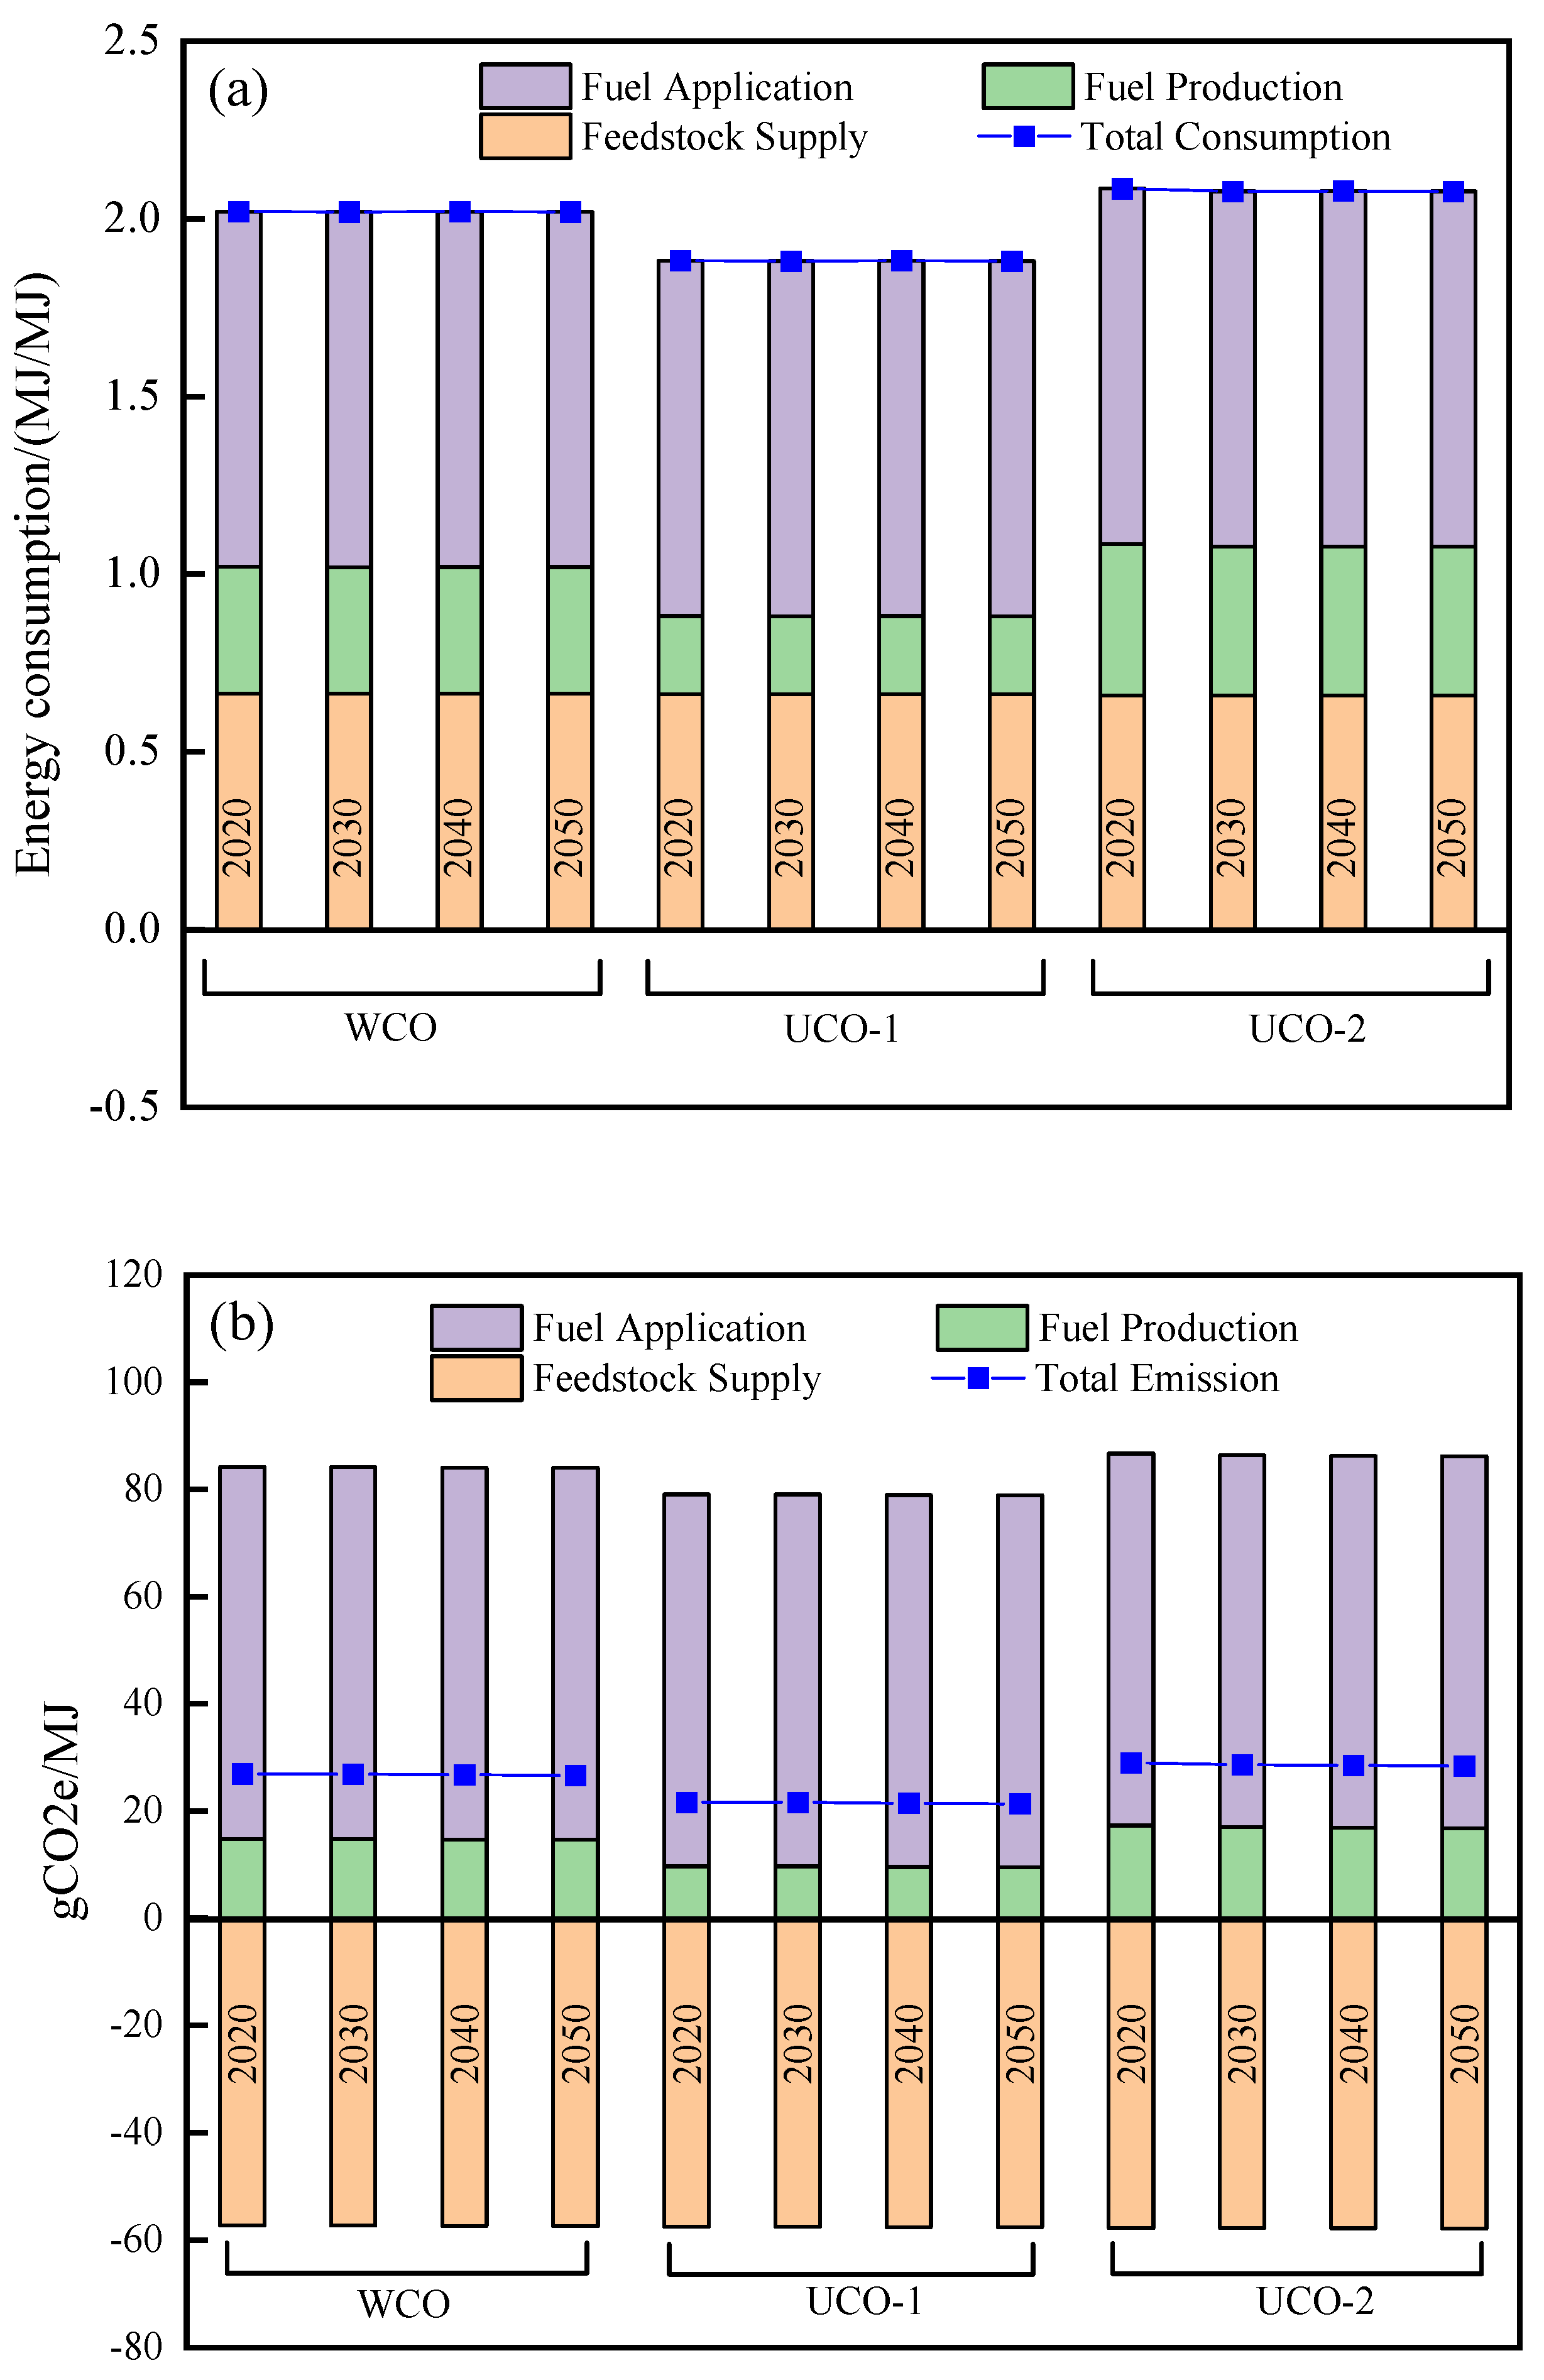
3.1. Energy Consumption Analysis

Each feedstock had unique characteristics that would affect the hydrogenation process and partition coefficient and would eventually have an impact on the energy consumption and GHG emissions. The energy consumptions of the different feedstocks are shown in Figure 2. From Figure 2, the energy consumption of fossil fuels was low in the feedstock stage owing to the relatively mature mining technology. The energy consumption of coal was one half or one third of that of natural gas or crude oil because of its more mature and simple acquisition and processing technology [10]. Soybean oil, a first-generation biofuel, has low energy consumption owing to its mature soybean planting technology and wide planting area. The energy consumption of camelina and jatropha oil, both second-generation biofuel raw materials, were much higher than that of soybean oil (1.6 and 2.4 times, respectively), which was related to its low yield (camelina) and the use of a large amount of fertilizer (jatropha) [12]. The energy consumption of microalgae oil was 35% higher than that of soybean oil because of the higher energy consumption during the planting and pressing stages. The energy consumption of WCO in the feedstock stage included the soybean oil raw material stage, collection and transportation, and pretreatment. The treatment (physical treatment, such as gravity sedimentation and centrifugal separation) is also relatively simple [19], and the energy consumption of WCO (collection, transportation, and pretreatment) was very low (accounting for 11.7, 4.9, and 8.6% of the energy consumption of soybean oil, jatropha oil, and microalgae oil, respectively) [20].
The energy consumption at the fuel production stage of petroleum-based oil was the lowest because the refining technology was mature, and more mature by-products shared similar energy consumption, while the energy consumption of coal was the highest because of the complex synthesis process [21]. The energy consumption of palm oil at the production stage was low among the biofuels, which may be related to its C16 fatty acids. However, camelina oil has a higher number of double bonds and a relatively high hydrogen consumption. The microalgae oil yield was also high because of the low oil yield and the need for more raw materials [22]. WCO had more free fatty acids, and the number of double bonds were reduced compared to soybean oil after the environmental impact of food residue and water, which reduced the hydrogen consumption of saturated double bonds. Moreover, this part of the fatty acids did not require a transformation of fatty acid glycerides into fatty acids, which reduces the hydrogen consumption [19]. The WCO passed through a thermal oxygen environment to produce cyclic products or polymeric macromolecules. The energy consumption at the production stage of the WCO-based oil was almost the same as that of the soybean oil. The energy consumption of UCO-1 was 47.2% lower than that of UCO-2 because of the hydrofining, hydrocracking, and isomerization that were performed in one reactor [23].
After the reduction of by-products, the total energy consumption of crude oil was the lowest among the fossil raw materials. The energy consumption of WCO was lower (75.0 and 89.1% of the energy consumption of jatropha oil and microalgae oil, respectively) among the biomass fuels but still higher than that of the fossil fuels.
The energy consumption of various raw materials varied significantly at different stages. In general, the energy consumption of each material’s (especially coal) fuel stage is higher than that of the raw material stage. The energy consumptions of the feedstock and soybean oil production were 30.8% and 7.9%, respectively. The percentages of jatropha oil were 52.9 and 10.3%, respectively. The WCO values were 32.4 and 18.6%, respectively. WCO had low energy consumption in the feedstock stage (4.1% in collection and 0.3% in pretreatment, except for the soybean oil period) and showed good prospects for use as bio-jet fuel. The energy consumptions of feedstock and the production of microalgae oil were 31.6 and 29.3%, respectively; thus, the third-generation biofuel technology needs to be improved [12,24].

3.2. Global Warming Potential Analysis

The GHG emissions of the bio-jet fuel life cycle of the different feedstocks are shown in Figure 3. From Figure 3, the GHG emissions of fossil fuels in the raw material stage were greater than zero, whereas the GHG emissions of biomass were negative because of the carbon fixation of CO2 by photosynthesis. The GHG emissions of soybean oil were the lowest because of its mature planting technology and area, lower energy consumption, and emissions. The GHG emissions of camelina, jatropha, and microalgae oil were high because of their low yield, the use of a large amount of fertilizer, and the low oil production rate [25]. The GHG emissions of WCO at the feedstock stage were low because of the simple collection and pretreatment (15.0, 1.0, and 32.0% of the GHG emissions of soybean oil, respectively).
The GHG emissions of petroleum at the production stage were low because of the mature refining process, whereas the GHG emissions of coal were high. The biofuel emissions at the production stage were relatively close, but generally higher than those of petroleum-based fuels. The hydrogen consumption and GHG emissions of WCO were low, owing to its high free fatty acid content and saturation. GHG emissions at the production stage of WCO, UCO-1, and UCO-2 accounted for 60.8, 37.3, and 65.0% of the GHG emissions of soybean, respectively.
After the reduction, the total GHG emissions of fossil fuels were higher than those of biofuels. The order was coal, natural gas, then crude oil. The GHG emissions of soybean, camelina, jatropha, and microalgae oil account for 42.6, 44.4, 54.6, and 41.3% of the GHG emissions of petroleum-based fuel, respectively. The GHG emissions of WCO, UCO-1, and UCO-2 accounted for 36.3, 29.0, and 37.1%, respectively, of the GHG emissions of petroleum-based fuel. It can be seen that the one-step method was more beneficial for emission reduction than the two-step method [16].
Soybean oil emissions accounted for 29.0 and 71.0% of emissions in the raw material and production stages, respectively. The proportions of GHG emissions of palm, camelina, jatropha, WCO, and microalgae oil at the raw material stage were 37.3, 37.0, 52.0, 48.0, and 68.3%, respectively. The main GHG emissions of the first-generation biofuel occurred in the feedstock stage, while the production stage was the main contributor of the third stage (Figure 3). In conclusion, compared with other biomasses, WCO had lower energy consumption and GHG emissions, a wide range of sources, and is a promising bio-jet fuel raw material.

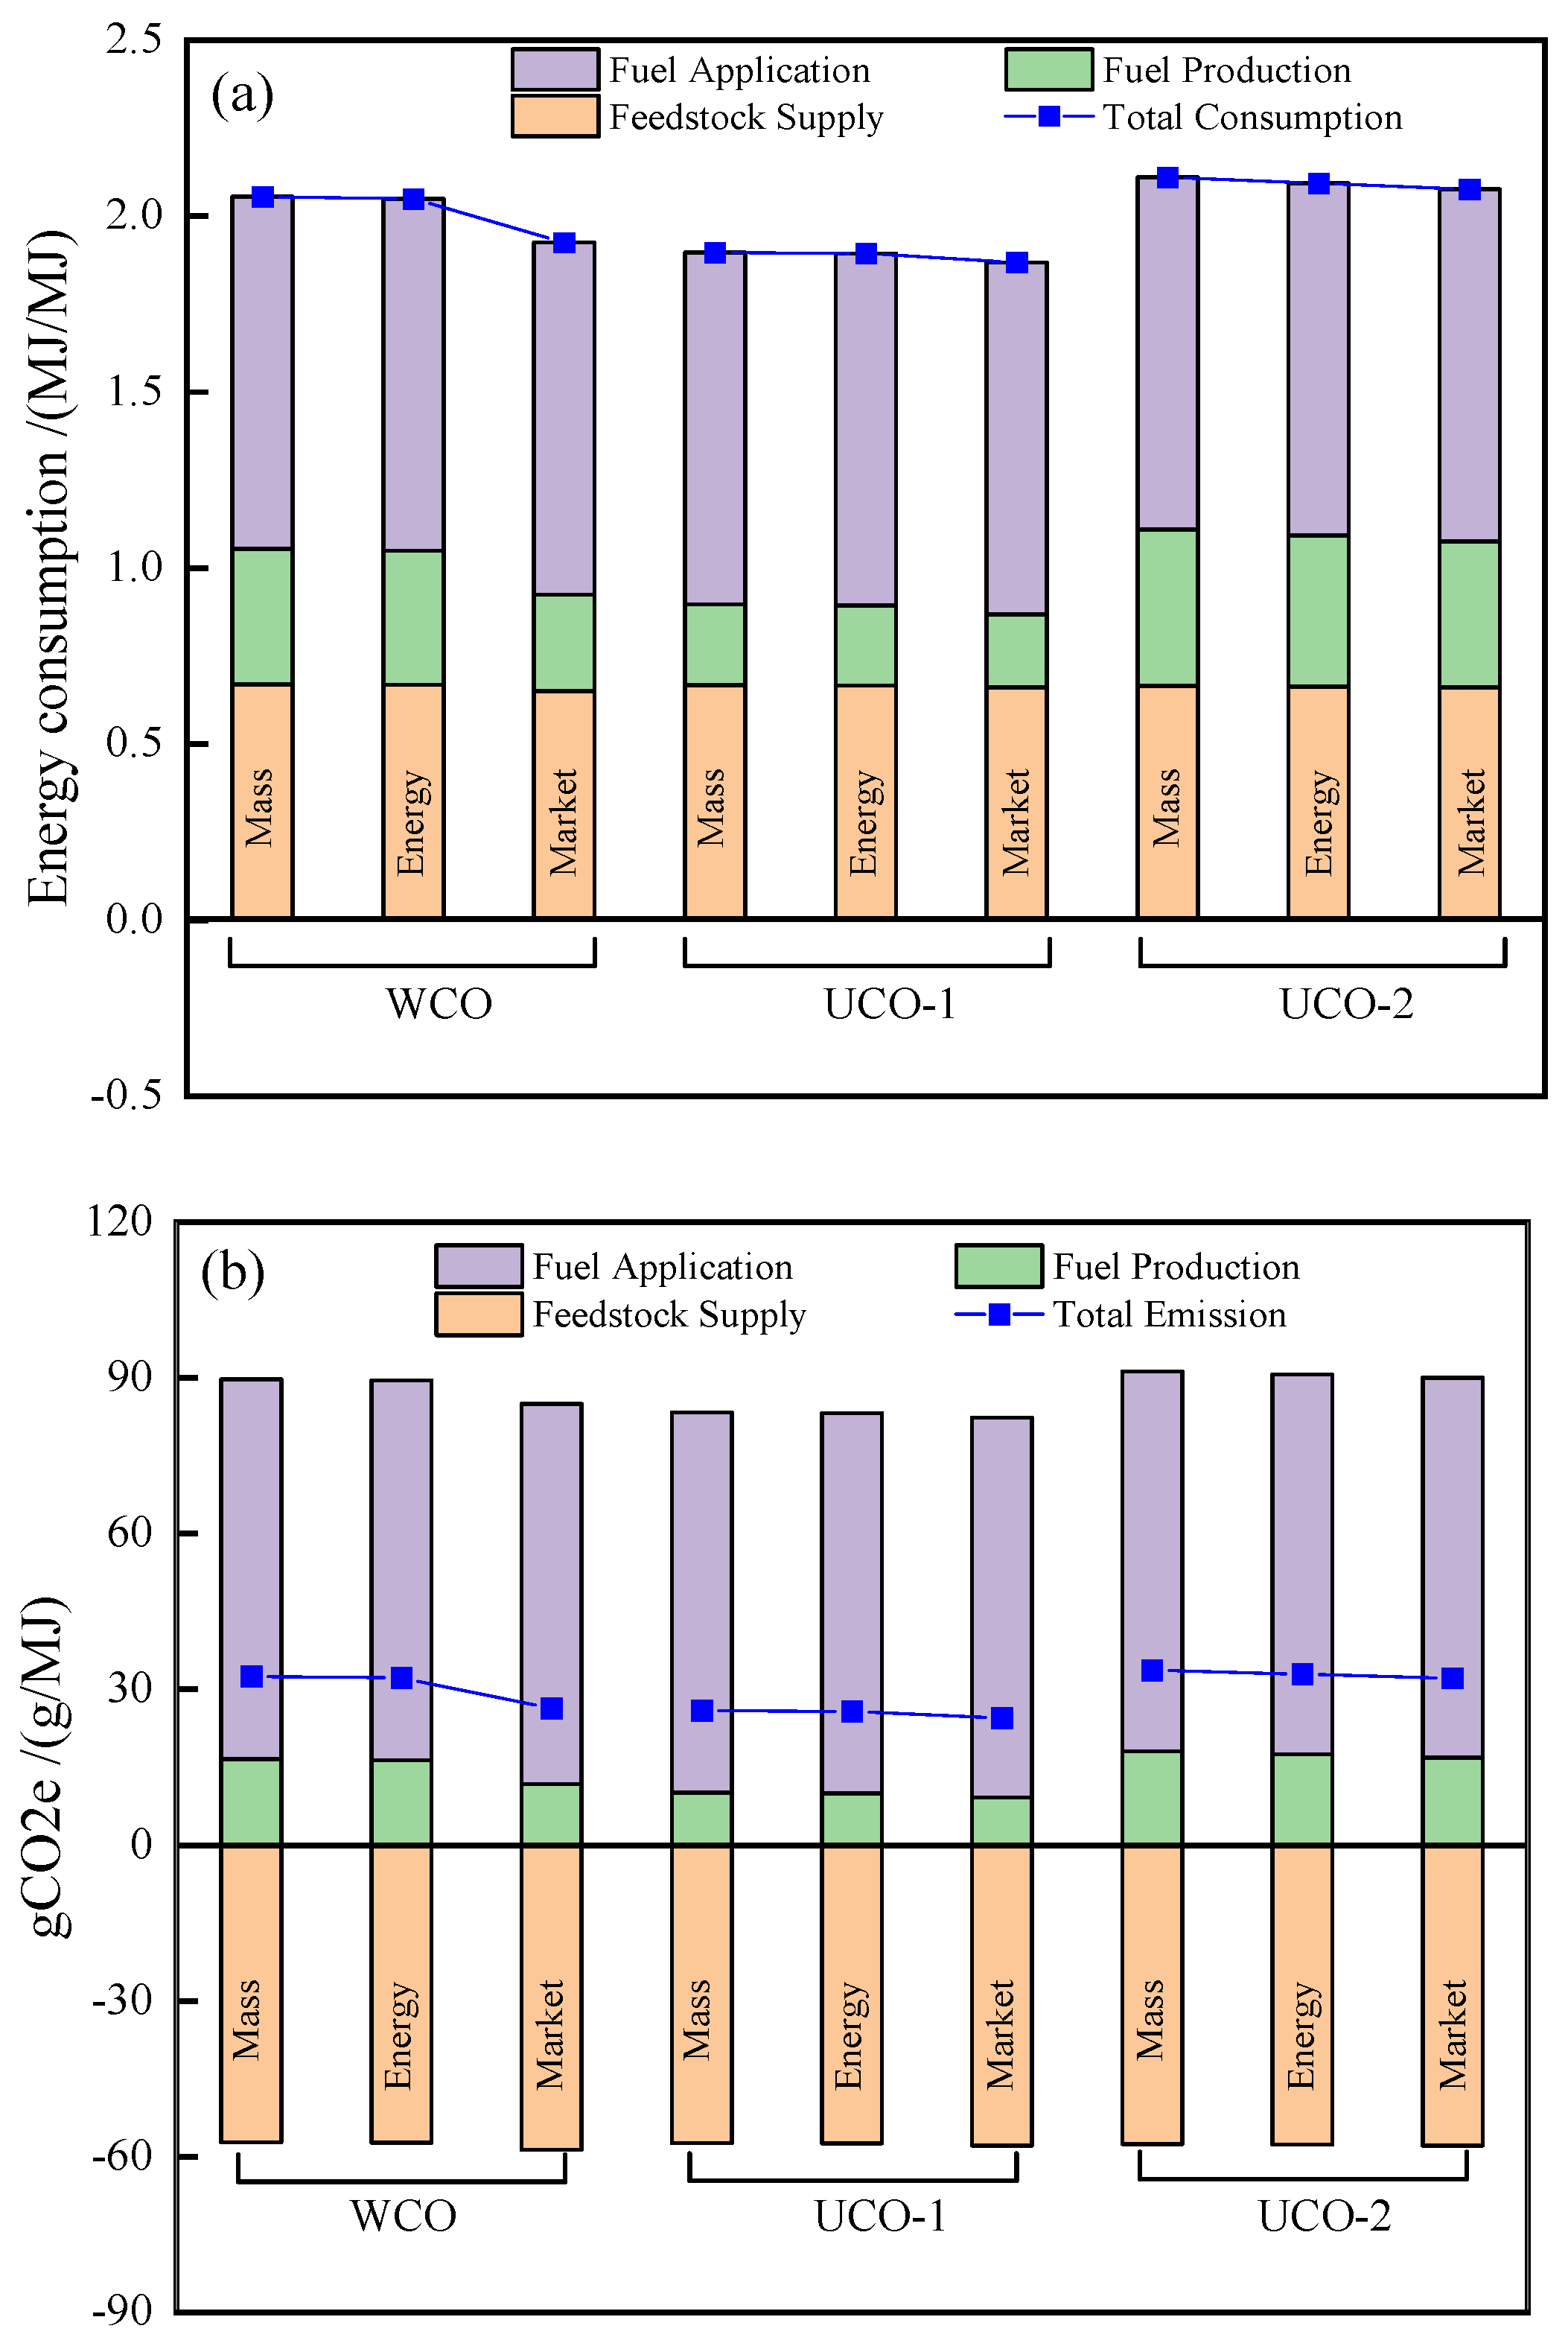
3.3. The Effect of Different Allocation Method on the GHG Emissions

The effects of the different allocation methods on the energy consumption and GHG emissions of WCO, UCO-1, and UCO-2 are shown in Figure 4. From Figure 4a, the energy consumption of the feedstock stage, fuel production, and total were all in the order of mass allocation, energy allocation, and market allocation after reduction. For example, the mass allocation method of WCO was slightly higher than that of the energy allocation method because of the similar heat values of gasoline, jet fuel, and diesel [26]. However, the market allocation method of bio-jet fuel was the lowest at every stage because of the prices of gasoline, and diesel was much higher than jet fuel because naphtha was also slightly higher [27]. The energy reduction rates in the feedstock supply stage of the mass allocation, energy allocation, and market allocation methods were 62.8, 63.3, and 73.7%, respectively, while the energy reduction rates in the fuel production stages were 62.5, 63.0, and 73.3%, respectively.
The GHG emission distribution reduction is related to the yield, heat value, and price. Regarding WCO, the mass allocation method was slightly higher than the energy allocation method because of the similar heat values. However, the discount rate of the market allocation method at each stage was the highest, and the GHG emissions after the discount were the lowest, which was the same as the energy consumption. The GHG emission reduction rates in the feedstock supply stage of the mass allocation, energy allocation, and market allocation methods were 62.8, 63.3, and 73.7%, respectively, and the fuel production stages were 62.4, 62.9, and 73.2%, respectively. The fuel production stage was the same as the feedstock supply stage for energy consumption and GHG emissions.

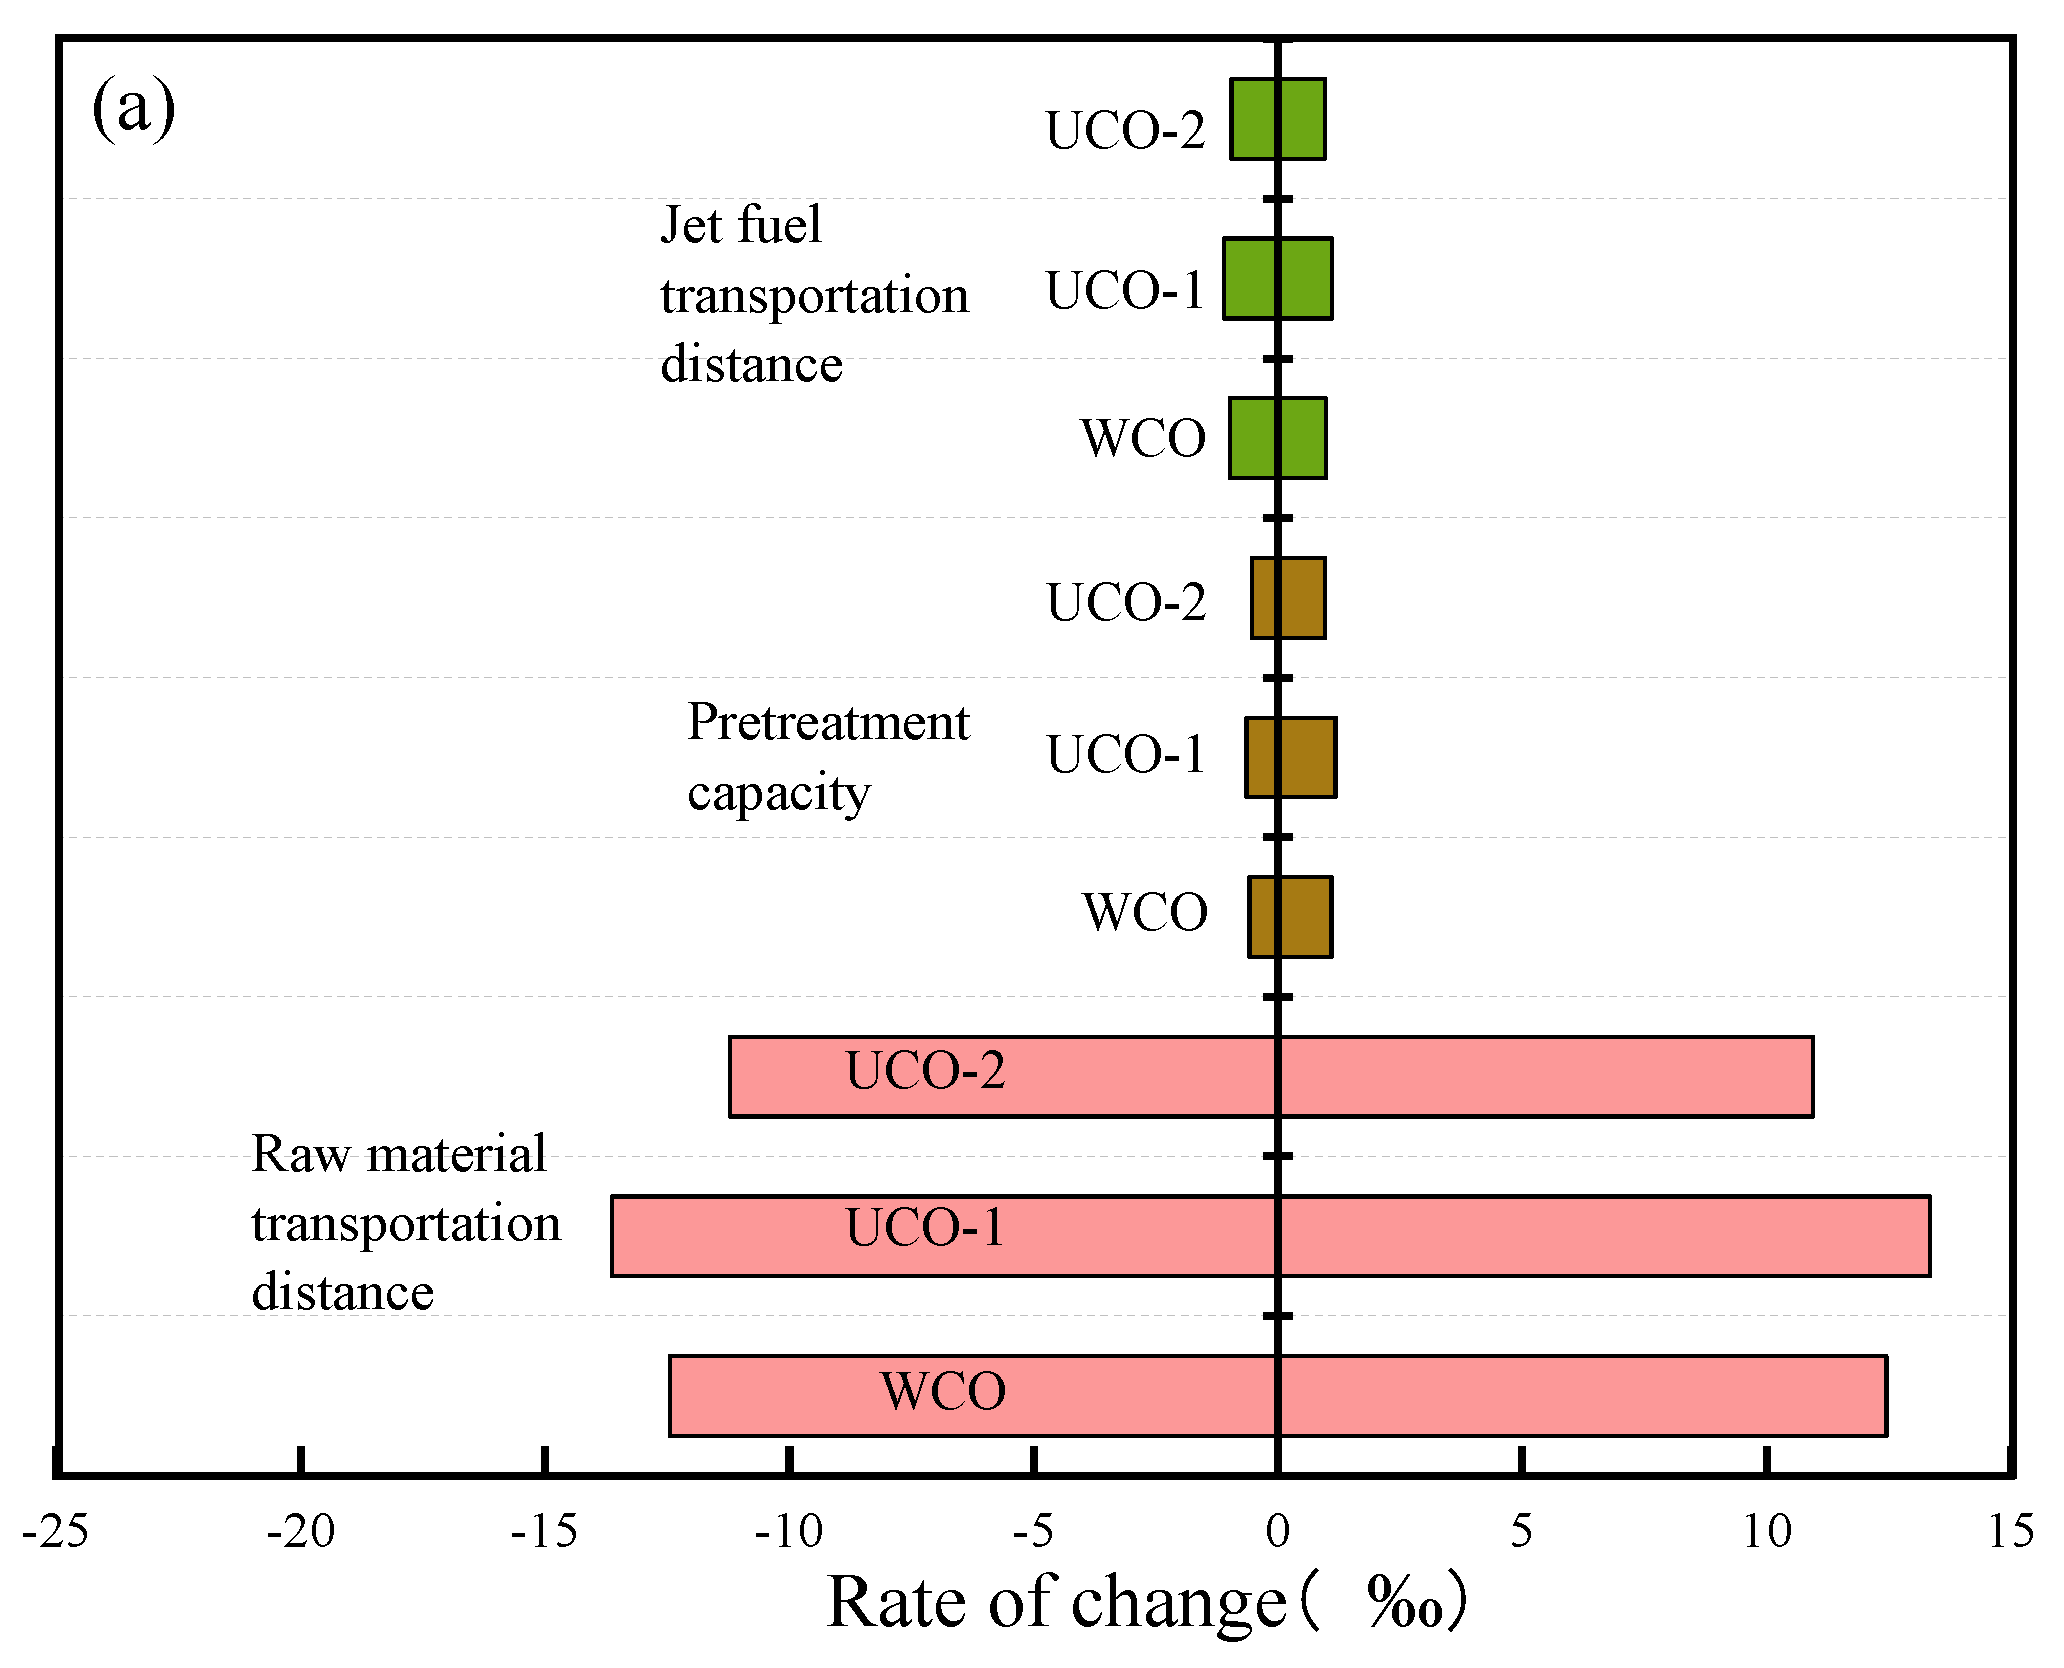
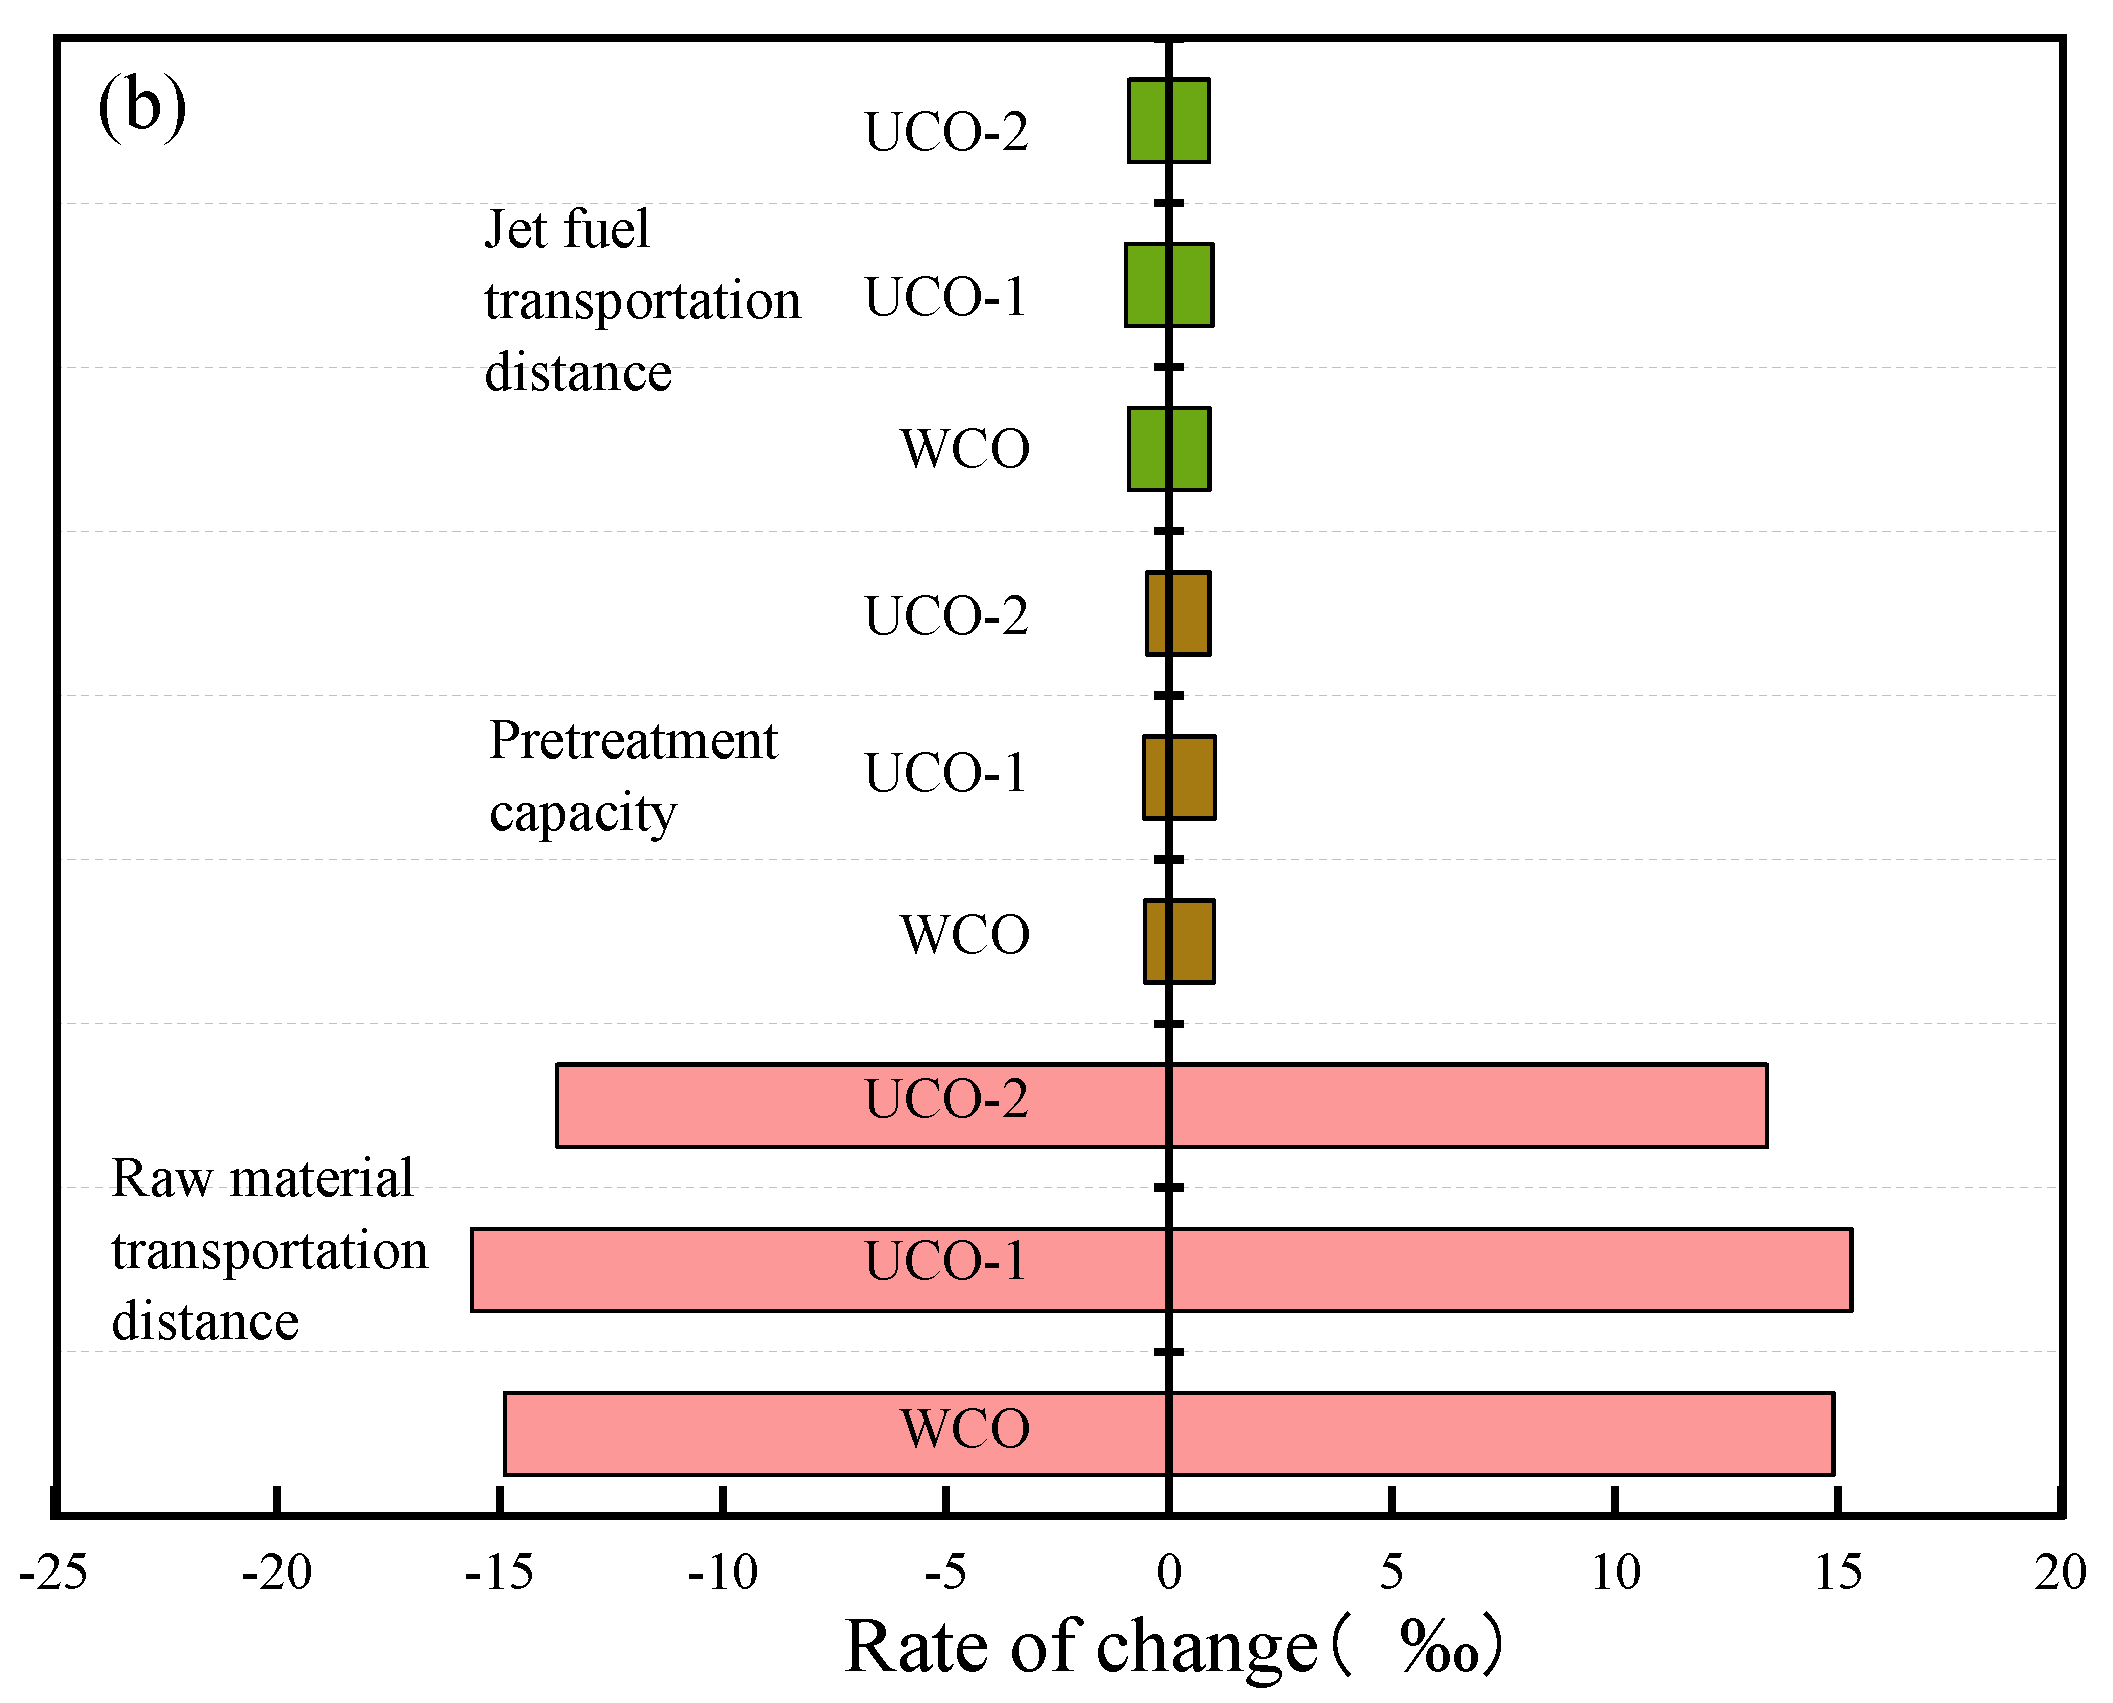
3.4. Sensitivity Analysis

A sensitivity analysis of the raw material transportation distance, jet fuel transportation distance, and WCO pretreatment capacity at a base value of ±30% was also performed to analyze the effects of various factors on the LCA energy consumption and GHG emissions of the bio-jet fuel (Table 1, Figure 5).
From Figure 5, the raw material transportation distance had a major impact on the energy consumption and GHG emissions. When the raw material transportation distance increased from 56 to 80 km, the total energy consumption of WCO, UCO-1, and UCO-2 increased by 12.5, 13.6, and 11.2%, respectively, while GHG emissions increased by 14.9, 15.6, and 13.7%, respectively. Therefore, detailed planning of the transportation route of the feedstock could significantly reduce LCA energy consumption and GHG emissions [28].
The WCO pretreatment capacity and jet fuel transportation distance had less impact on energy consumption and GHG emissions. When the WCO pretreatment capacity increased from 42 m3/h to 60 m3/h, the total energy consumption of WCO, UCO-1, and UCO-2 increased by 1.1, 1.2, and 1.0%, respectively, while the GHG emissions increased by 1.0, 1.0, and 0.9%, respectively. When the jet fuel transportation distance increased from 140 to 200 km, the total energy consumptions of WCO, UCO-1, and UCO-2 increased by 1.0, 1.1, and 1.0%, respectively. The GHG emissions increased by 0.9, 1.0 and 0.9%, respectively.

3.5. Scenario Analysis

3.5.1. The Sources of Electricity

Scenario analyses of four different power compositions (2020, 2030, 2040, and 2050) were performed according to “Energy outlook of the world and China in 2050” of the China Petroleum Economic and Technological Research Institute (Table 2 and Figure 6) [29].
Electricity was used in different stages. The proportions of electricity in the total energy consumption of WCO, UCO-1, and UCO-2 were 5.7, 1.8, and 1.0%, respectively, and the GHG emission proportions were 5.7, 1.6, and 1.0%, respectively. For WCO in 2030, 2040, and 2050, the total energy consumption was reduced by 6.6, 1.7, and 4.4% from 2030 to 2050, and GHG emissions were reduced by 4.6, 31.9, and 45.1%, respectively.
The general trend in the power structure was that the proportion of fossil energy power generation, represented by coal, gradually decreased and the renewable energy power generation gradually increased. Although the energy consumption and GHG emissions increased temporarily from 2030 to 2040, owing to the high energy consumption, the energy consumption and GHG emissions over the entire life cycle showed a decreasing trend because of technical progress. The power composition had a significant impact on the GHG emissions of bio-jet fuel, which also featured greater advantages in replacing traditional fossil fuels for the optimization of China’s power structure.

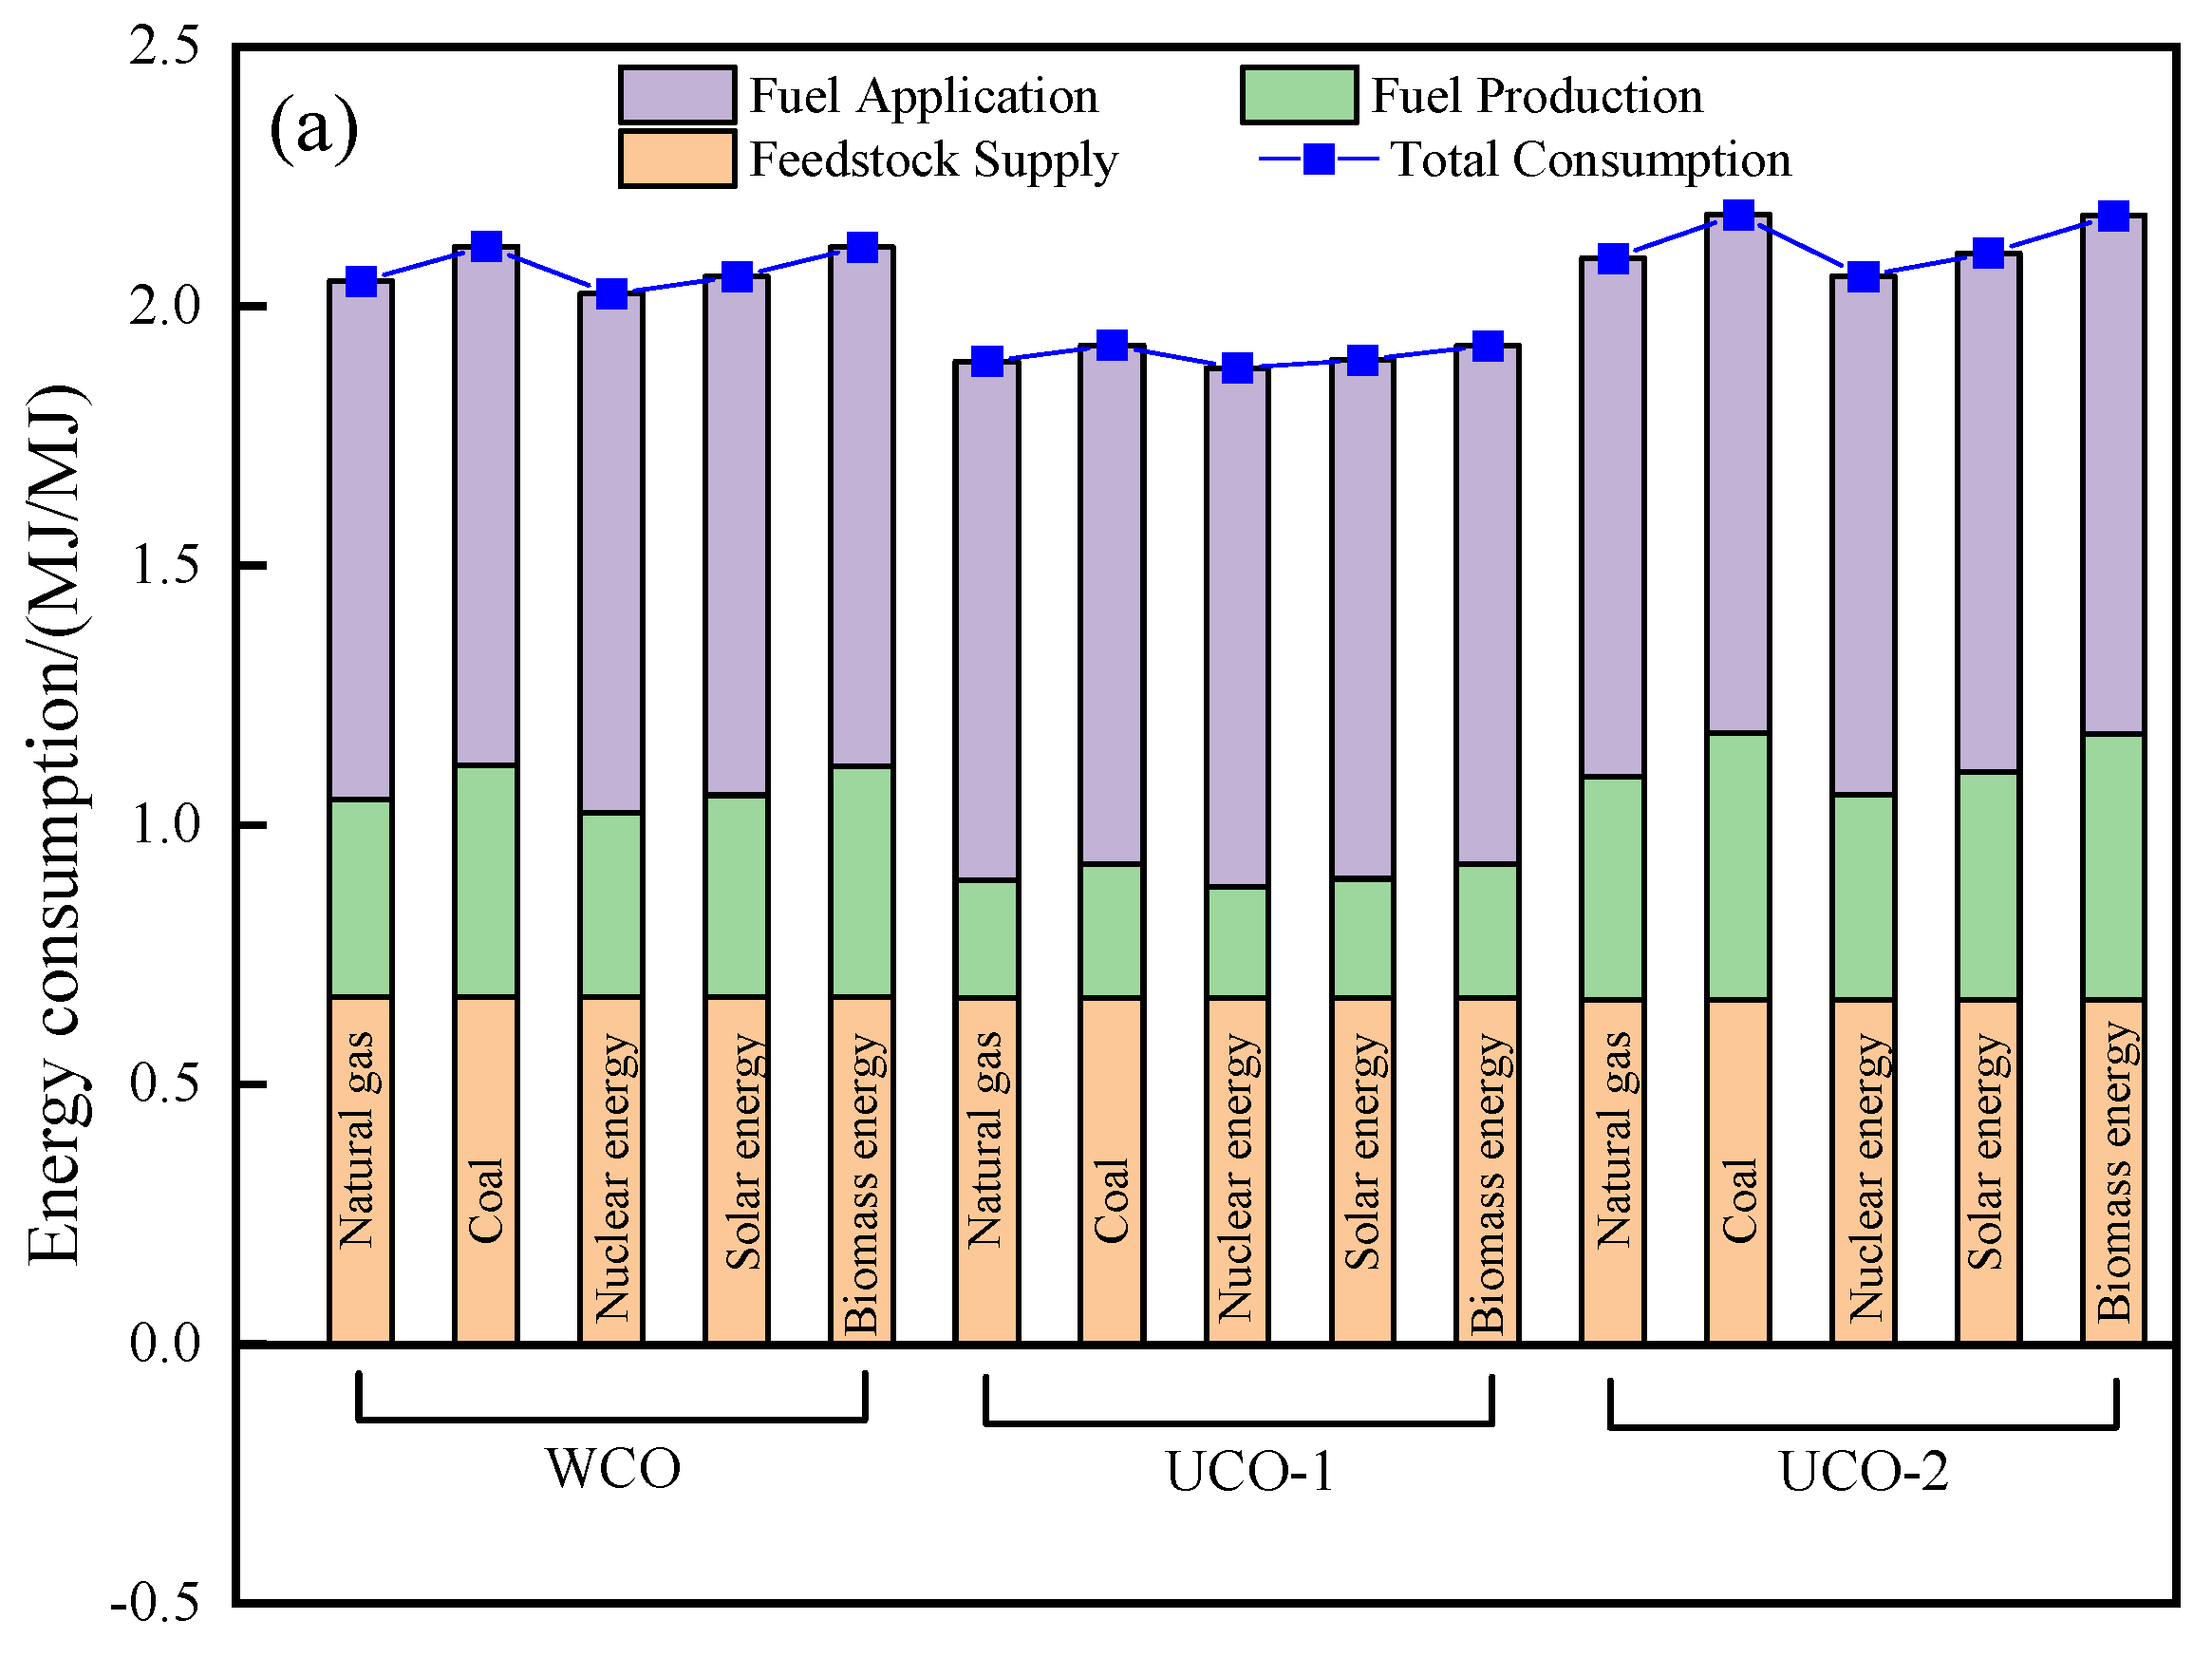
3.5.2. The Sources of Hydrogen

The energy consumption of hydrogen accounts for a large proportion of its entire life cycle. The proportions of hydrogen in the total energy consumption of WCO, UCO-1, and UCO-2 were 30.3, 12.8, and 30.5%, respectively. The contribution of hydrogen to GHG emissions was 18.7, 7.1, and 18.7%, respectively. As shown in Table 3 and Figure 7, the order of energy consumption by hydrogen was coal > biomass > solar energy > natural gas > nuclear energy; the order of GHG emissions was coal > natural gas > nuclear energy > solar energy > biomass. For WCO, the energy consumption of natural gas, solar, and nuclear energy was lower than the energy consumption of biomass by 4.5, 3.9, and 6.3%, respectively, and the GHG emissions were higher than the energy consumption of biomass by 8.2, 0.6, and 0.8%, respectively.
Energy consumption and GHG emissions from the use of coal as a hydrogen source were high. The GHG emissions of solar energy and biomass were lower, whereas energy consumption was higher than that of other energy sources. With the progress in technology, solar energy and biomass have shown great potential to produce hydrogen.

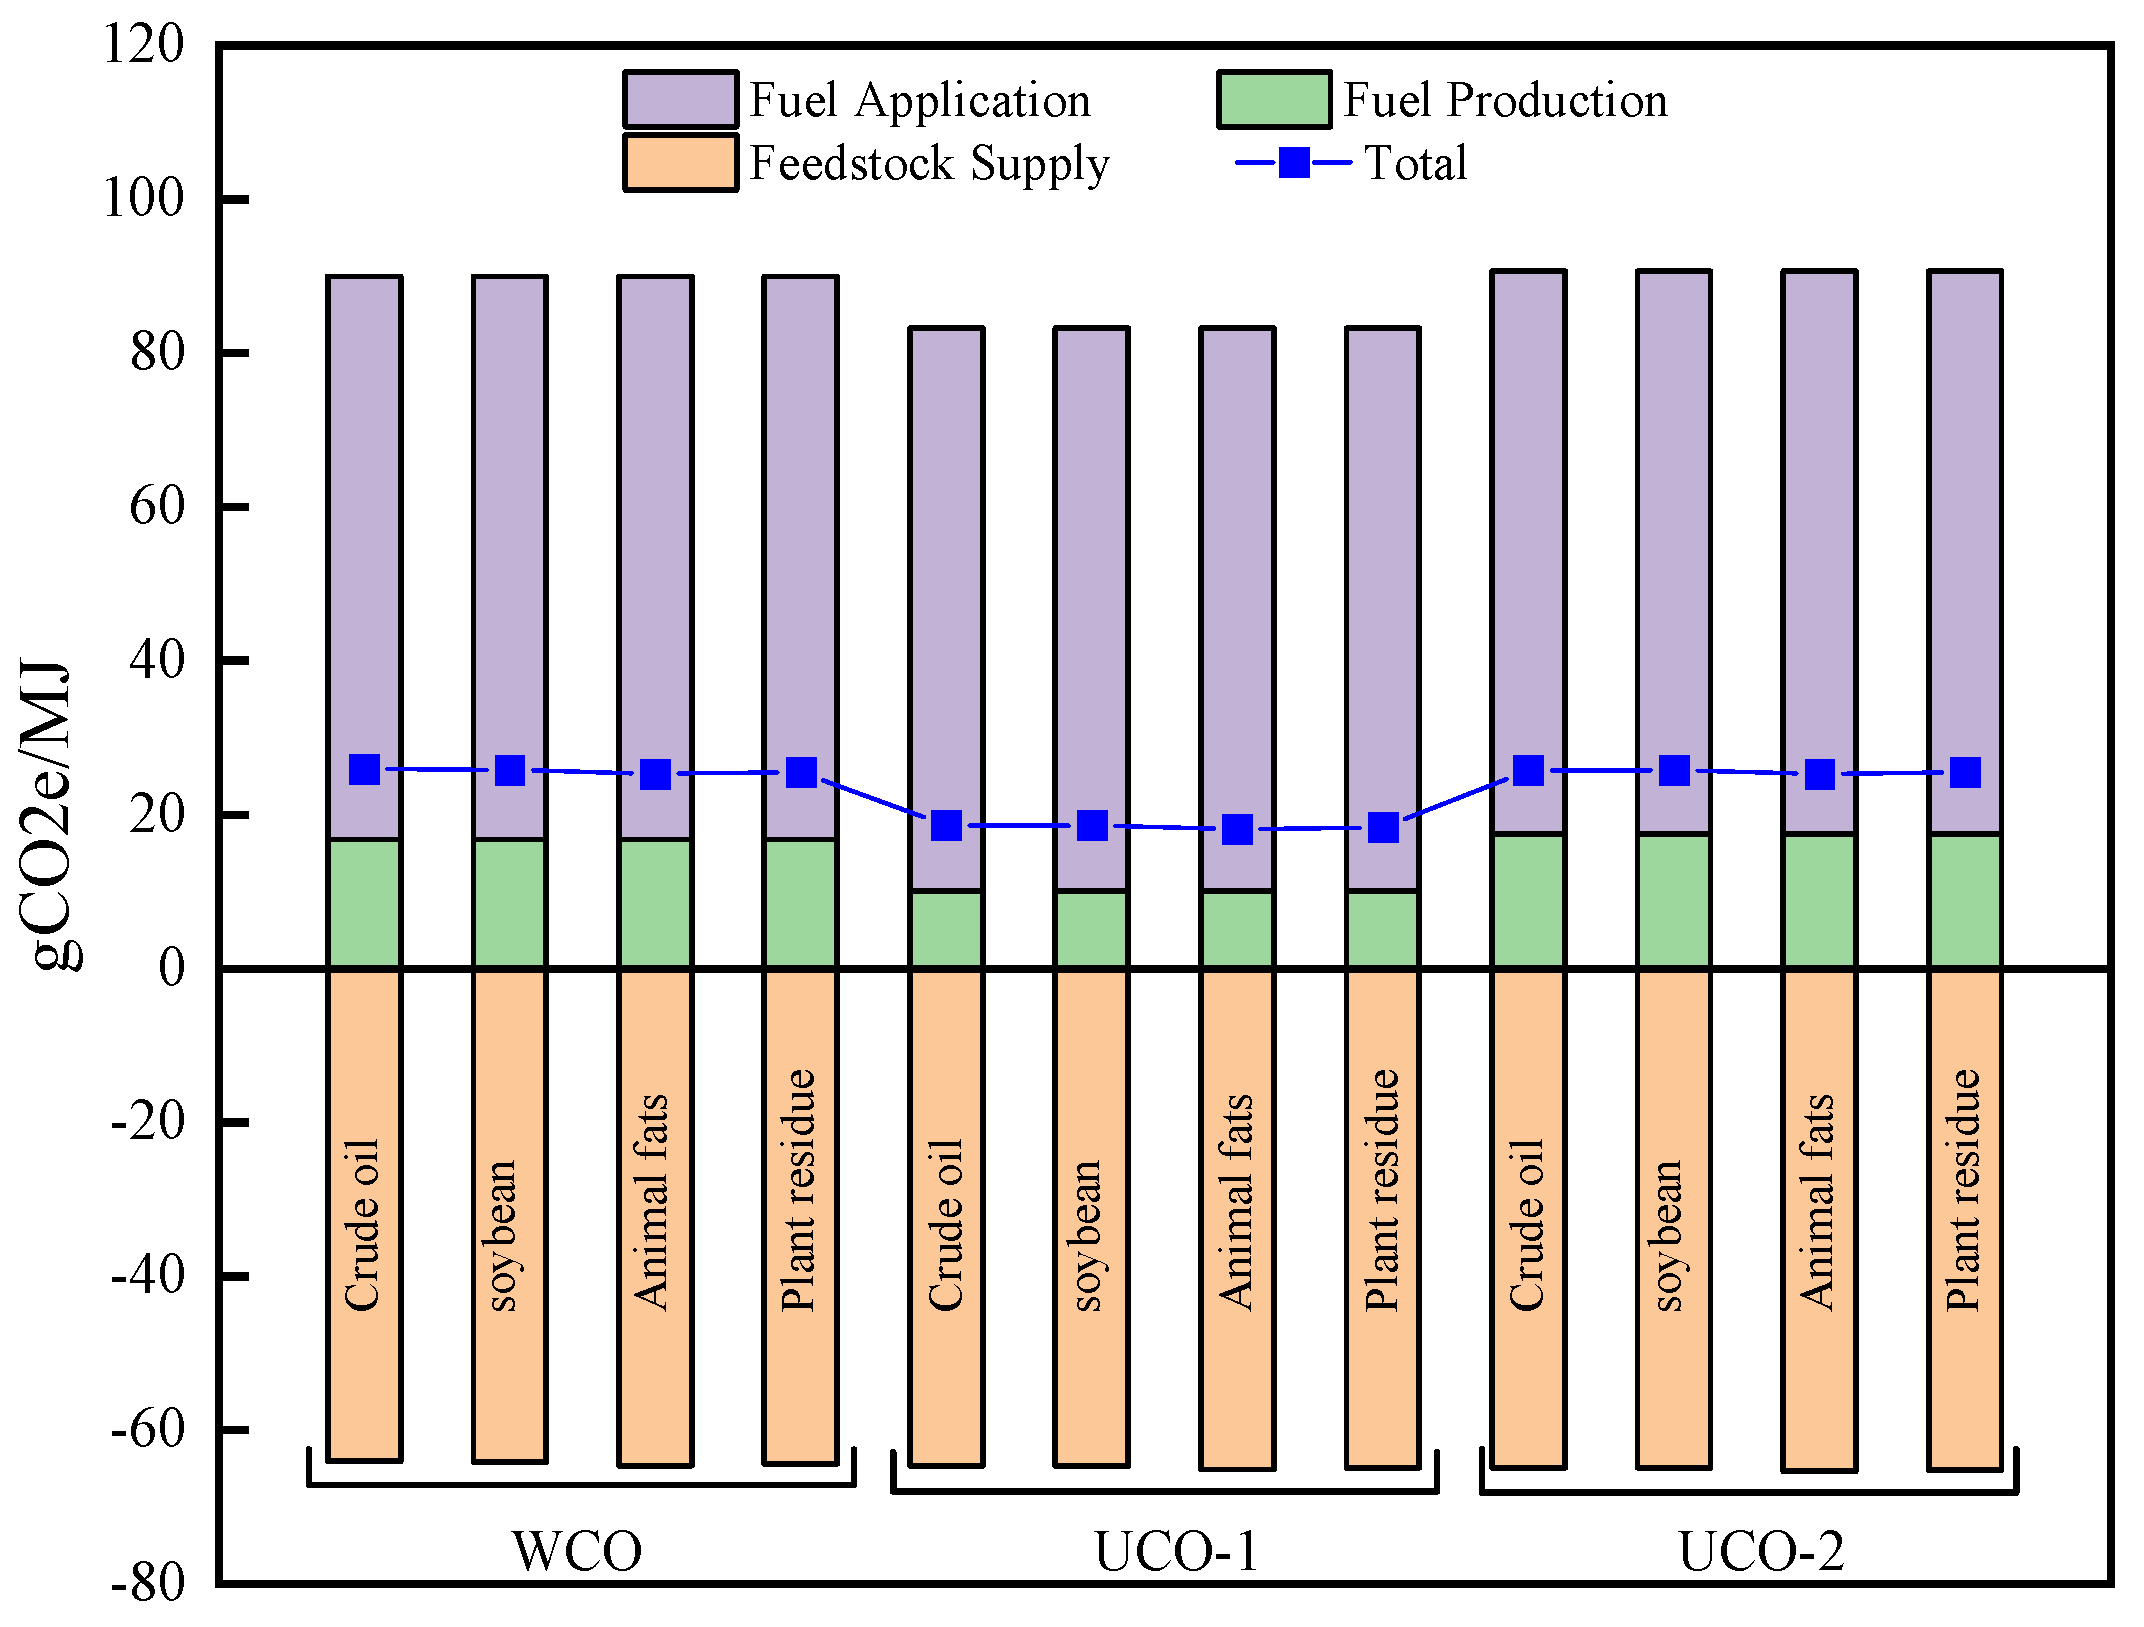
3.5.3. The Sources of Diesel

Diesel was only used in the collection stage of the raw material, and the energy consumption of diesel in the LCA was low. The ratios of the diesel contribution energy consumption of WCO, UCO-1, and UCO-2 were 7.4, 6.2, and 5.3%, respectively. GHG emissions were 3.1, 2.3, and 2.2%, respectively. The GHG emissions of using animal and vegetable fats as diesel source in the collection stage are slightly lower than that of petroleum source (Figure 8). So, it is beneficial to the environment to use biodiesel in the transportation stage.

4. Conclusions

A life-cycle analysis of the bio-jet fuel produced from WCO by hydrotreatment was performed and compared with that of a conventional fossil-based jet fuel. The energy consumption of the WCO-based bio-jet fuel was 70.7% higher than that of petroleum-derived jet fuel, whereas the GHG emissions of the WCO-based bio-jet fuel was 63.7% lower than those of the petroleum-derived jet fuel. The proportion of GHG emissions caused by hydrogen in WCO was 18.7%. The proportion of GHG emissions during the first-, second-, and third-generation biofuel feedstock stages increased. The GHG emissions of WCO were 85.2, 66.5, and 87.9% for soybean, jatropha, and microalgae oils, respectively. The proportion of GHG emissions during the first-, second-, and third-generation biofuel feedstock stages increased. The transportation distance of the WCO raw materials was more sensitive to GHG emissions. Therefore, it is important to develop a detailed plan for the collection route of raw materials to reduce energy consumption and GHG emissions. Although the electric power structure and hydrogen resources derived from renewable energy will increase GHG emissions in the immediate future, it will reduce emissions due to technical progress by 2050. The preparation of bio-jet fuel from WCO can not only recycle waste but can also contribute to emissions reductions for the aviation industry, which is a potential sustainable aviation fuel route.

Supplementary Materials

The following supporting information can be downloaded at: https://www.mdpi.com/article/10.3390/en15186612/s1, Figure S1: Preparation of jet fuel by one-step hydrogenation of waste cooking oil; Table S1: The results of hydrotreatment waste cooking over NiMo/8AHFS-Y title; Table S2: Chemical properties of waste cooking oil and soybean oil; Table S3: HDO reaction equations; Table S4: The hydrogen consumes of triglycerides; Table S5: Hydrogen consumption/(ton/d); Table S6: Composition of the gas phase; Table S7: Quality Composition of the products; Table S8: The price of refined oils, RMB/Ton; Table S9: The fuel consumption of fossil energy extraction process, %; Table S10: The proportion for various modes of fuel transportation in China; Table S11: Fuel consumption by different modes of transport; Table S12: Energy consumption and GHG emissions from different hydrogen sources; Table S13: Life cycle energy consumption and GHG emissions from different diesel sources. References [15,18,20,30,31,32] are cited in the Supplementary Materials.

Author Contributions

Conceptualization, Z.Z. and K.W.; methodology, K.W. and J.L.; software, K.W. and Z.W.; formal analysis, Z.W. and K.W.; writing—original draft preparation, K.W.; writing—review and editing, Z.Z.; supervision and funding acquisition, Z.Z. All authors have read and agreed to the published version of the manuscript.

Funding

This research was funded by [the Scientific research project of Tianjin Education Commission] grant number [2020KJ022].

Data Availability Statement

Data supporting reported results can be found in Supplementary Materials.

Acknowledgments

The financial support by the Scientific research project of Tianjin Education Commission (2020KJ022) is gratefully acknowledged.

Conflicts of Interest

There are no conflicts to declare.

References

  1. Yang, J.; Xin, Z.; He, Q.; Corscadden, K.; Niu, H. An overview on performance characteristics of bio-jet fuels. Fuel 2019, 237, 916–936. [Google Scholar] [CrossRef]
  2. Guo, F.; Zhao, J.; Lusi, A.; Yang, X.Y. Life cycle assessment of microalgae-based aviation fuel: Influence of lipid content with specific productivity and nitrogen nutrient effects. Bioresour. Technol. 2016, 221, 350–357. [Google Scholar] [CrossRef] [PubMed]
  3. Chen, X.; Shuai, C.Y.; Wu, Y.; Zhang, Y. Analysis on the carbon emission peaks of China’s industrial, building, transport, and agricultural sectors. Sci. Total Environ. 2020, 709, 135768. [Google Scholar] [CrossRef] [PubMed]
  4. IATA 2010 Report on Alternative Fuels [EB/OL]. 2010. Available online: http://www.ita.org/ps/publications/Pages/alternative-fuels.asp (accessed on 30 December 2010).
  5. Li, W.Q.; Wright, M.M. Negative Emission Energy Production Technologies: A Techno-Economic and Life Cycle Analyses Review. Energy Technol. 2019, 11, 1900871. [Google Scholar] [CrossRef]
  6. Shafaghat, H.; Linderberg, M.; Janosik, T.; Hedberg, M.; Wiinikka, H.; Sandström, L.; Johansson, A.-C. Enhanced Biofuel Production via Catalytic Hydropyrolysis and Hydro-Coprocessing. Energy Fuels 2022, 36, 450–462. [Google Scholar] [CrossRef]
  7. Halim, E.; Lee, C.P.; Wang, W.C.; Lin, J.K.; Lin, Y.C. Production of hydro-processed renewable jet fuel over SAPO-11-based catalyst. Int. J. Energy Res. 2022, 46, 1059–1076. [Google Scholar] [CrossRef]
  8. GMTF Co-Rapporteurs. CAEP-SG/20172-WP/6: ICAO CORSIA Package. In Proceedings of the Committee on Aviation Environmental Protection (CAEP) Steering Group Meeting, Montreal, QC, Canada, 11 September 2017. [Google Scholar]
  9. Cherubini, F.; Bird, N.D.; Cowie, A.; Jungmeier, G.; Schlamadinger, B.; Woess-Gallasch, S. Energy- and greenhouse gas-based LCA of biofuel and bioenergy systems: Key issues, ranges, and recommendations. Resour. Conserv. Recycl. 2009, 53, 434–447. [Google Scholar] [CrossRef]
  10. Kolosz, B.W.; Luo, Y.; Xu, B.; Maroto-Valer, M.M.; Andresena, J.M. Life cycle environmental analysis of ‘drop in’ alternative aviation fuels: A review. Sustain. Energy Fuel 2020, 4, 3229–3263. [Google Scholar] [CrossRef]
  11. Kreutza, T.G.; Larson, E.D.; Elsido, C.; Martelli, E.; Greig, C.; Williams, R.H. Techno-economic prospects for producing Fischer-Tropsch jet fuel and electricity from lignite and woody biomass with CO2 capture for EOR. Appl. Energy 2020, 276, 115841. [Google Scholar] [CrossRef]
  12. Mohammad, A.; Gordon, M.; Hamish, R.M.; Tareq, A.A. Jatropha curcas for jet biofuel production: Current status and prospects. Renew. Sustain. Energy Rev. 2021, 135, 110396. [Google Scholar]
  13. Ringsred, A.; Dyk, S.V.; Saddler, J. Life-cycle analysis of drop-in biojet fuel produced from British Columbia Forest residues and wood pellets via fast-pyrolysis. Appl. Energy 2021, 287, 116587. [Google Scholar] [CrossRef]
  14. Beal, C.M.; Cuellar, A.D.; Wagner, T.J. Sustainability assessment of alternative jet fuel for the U.S. Department of Defense. Biomass Bioenergy 2021, 144, 105881. [Google Scholar] [CrossRef]
  15. Barbera, E.; Naurzaliyev, R.; Asiedu, A. Techno-economic analysis and life-cycle assessment of jet fuels production from waste cooking oil via in situ catalytic transfer hydrogenation. Renew. Energy 2020, 160, 428–449. [Google Scholar] [CrossRef]
  16. Hsu, H.W.; Chang, Y.H.; Wang, W.C. Techno-economic analysis of used cooking oil to jet fuel production under uncertainty through three-, two-, and one-step conversion processes. J. Clean. Prod. 2021, 289, 125778. [Google Scholar] [CrossRef]
  17. Xu, Y.W.; Xie, X.M.; Huang, Z.; Qiao, X.Q.; Zhang, W.G. Life cycle analysis of biodiesel production from waste frying oil. Trans. Chin. Soc. Agric. 2010, 41, 99–103. [Google Scholar]
  18. Zhang, Z.W.; Zhang, X.W.; Chen, H.; Wang, Q.F. Hydroconversion of Waste Cooking Oil into Green Biofuel over Hierarchical USY-Supported NiMo Catalyst: A Comparative Study of Desilication and Dealumination. Catalysts 2017, 7, 281. [Google Scholar] [CrossRef]
  19. Budsberg, E.; Crawford, J.T.; Morgan, H.; Chin, W.S.; Bura, R.; Gustafson, R. Hydrocarbon bio-jet fuel from bioconversion of poplar biomass: Life cycle assessment. Biotechnol. Biofuels 2016, 9, 170. [Google Scholar] [CrossRef]
  20. Zhang, Z.W.; Zhang, X.W.; Wang, Q.F. Influence of Impurities and Oxidation on Hydroconversion of Waste Cooking Oil into Bio-jet Fuel. Chem. Eng. Technol. 2020, 43, 273–281. [Google Scholar] [CrossRef]
  21. Cai, P.P.; Zhang, C.H.; Jing, Z.; Peng, Y.W.; Jing, J.; Sun, H.J. Effects of Fischer-Tropsch diesel blending in petrochemical diesel on combustion and emissions of a common-rail diesel engine. Fuel 2021, 305, 121587. [Google Scholar] [CrossRef]
  22. Liu, Z.Y.; Yang, X.Y. Refining drop-in jet fuel coupling GHGs reduction in LCA with airworthiness in aero-engine and aircraft. Catal. Today 2020, 353, 260–268. [Google Scholar] [CrossRef]
  23. Lin, C.H.; Chen, Y.K.; Wang, W.C. The production of bio-jet fuel from palm oil derived alkanes. Fuel 2020, 260, 116345. [Google Scholar] [CrossRef]
  24. Prussi, M.; Lee, U.; Wang, M.; Malina, R.; Valin, H.; Taheripour, F.; Velarde, C.; Staples, M.D.; Lonza, L.; Hileman, J.I. The first internationally adopted approach to calculate life-cycle GHG emissions for aviation fuels. Renew. Sustain. Energy Rev. 2021, 150, 111398. [Google Scholar] [CrossRef]
  25. Han, J.; Elgowainy, A.; Cai, H.; Wang, M.Q. Life-cycle analysis of bio-based aviation fuels. Bioresour. Technol. 2013, 150, 447–456. [Google Scholar] [CrossRef]
  26. Wang, M.; Huo, H.; Arora, S. Methods of dealing with co-products of biofuels in life-cycle analysis and consequent results within the U.S. context. Energy Policy 2010, 39, 5726–5736. [Google Scholar] [CrossRef]
  27. Zhao, L.L.; Ou, X.M.; Chang, S.Y. Life-cycle greenhouse gas emission and energy use of bioethanol produced from corn stover in China: Current perspectives and future prospectives. Energy 2016, 115, 303–313. [Google Scholar] [CrossRef]
  28. Zhang, X.L.; Zhang, X.; Ou, X.M.; Yan, X.Y. Life-Cycle Energy Use and Greenhouse Gas Emissions Analysis for Bio-Liquid Jet Fuel from Open Pond-Based Micro-Algae under China Conditions. Energies 2018, 6, 4897–4923. [Google Scholar]
  29. China Petroleum Economic and Technological Research Institute. Energy Outlook of the World and China in 2050. Available online: http://etri.cnpc.com.cn/.2020.12 (accessed on 30 December 2020).
  30. China Energy Statistics Yearbook 2020, China Statistics Press, National Bureau of Statistics. 2020. Available online: http://www.tjcn.org/tjnj/NNN/39747.html (accessed on 25 June 2021).
  31. China Transportation Yearbook 2020, People’s Communications Press, Ministry of Transport. 2020. Available online: http://nianjian.xiaze.com/down/2022/zgjtnj-htm-2020.html (accessed on 1 February 2022).
  32. He, J.C.; Wu, H.W.; Xu, Y.Q. Energy Consumption of Locomotives in China Railways during 1975–2007. J. Transp. Syst. Eng. Inf. Technol. 2010, 10, 22–27. [Google Scholar] [CrossRef]
Figure 1. Life-cycle system boundary of WCO for bio-jet fuel.
Energies 15 06612 g001
Figure 2. Bio-jet fuel life cycle energy consumption with different feedstock.
Energies 15 06612 g002
Figure 3. Bio-jet fuel life cycle greenhouse gas emissions of different feedstock.
Energies 15 06612 g003
Figure 4. (a) Life-cycle energy consumption by different allocation methods. (b) Life-cycle GHG emissions by different allocation methods.
Energies 15 06612 g004
Figure 5. (a) The sensitivity analysis of energy consumption of bio-jet fuel. (b) The sensitivity analysis of life-cycle GHG emissions of bio-jet fuel.
Energies 15 06612 g005aEnergies 15 06612 g005b
Figure 6. (a) Life-cycle energy consumption in different years. (b) GHG emissions in different years.
Energies 15 06612 g006
Figure 7. (a) Life-cycle energy consumption of different hydrogen sources. (b) GHG emissions from different hydrogen sources during their life-cycle.
Energies 15 06612 g007aEnergies 15 06612 g007b
Figure 8. GHG emissions from different diesel sources during their life-cycle.
Energies 15 06612 g008
Table 1. Sensitivity analysis of different parameter.
ParameterBaselineLowHigh
Raw material transportation distance (km)8056104
Jet fuel transport distance (km)200140260
WCO pretreatment capacity (m3/h)604278
Table 2. The proportion of China’s energy mix for power generation in different years/%.
2020203020402050
Crude oil0.20.10.10.1
Coal70.144.735.027.0
Natural gas2.57.624.024.3
Nuclear energy2.97.514.014.5
Biomass0.92.05.010.0
Waterpower19.316.120.018.3
Others4.122.01.95.9
Table 3. Hydrogen life-cycle energy consumption and GHG emissions.
Hydrogen SourceEnergy Consumption/(MJ/MJ)GHG Emission/(g/MJ)
Natural gas1.695.7
Coal2.3197.6
Nuclear energy1.321.0
Solar energy1.719.0
Biomass energy2.313.1
Publisher’s Note: MDPI stays neutral with regard to jurisdictional claims in published maps and institutional affiliations.

