Article

Evaluation of Leachate Recirculation as a Stabilisation Strategy for Landfills in Developing Countries

by
John J. Sandoval-Cobo
1,
Diana M. Caicedo-Concha
2,*,
Luis F. Marmolejo-Rebellón
1,
Patricia Torres-Lozada
1 and
Johann Fellner
3
1
ECCA Group, Faculty of Engineering, Universidad del Valle, Cali 760032, Colombia
2
Faculty of Engineering, Universidad Cooperativa de Colombia, Cali 760035, Colombia
3
Institute for Water Quality, Resource and Waste Management, Vienna University of Technology, Karlsplatz 13/226-2, 1040 Vienna, Austria
*
Author to whom correspondence should be addressed.
Energies 2022, 15(17), 6494; https://doi.org/10.3390/en15176494
Submission received: 29 June 2022 / Revised: 5 August 2022 / Accepted: 16 August 2022 / Published: 5 September 2022
(This article belongs to the Special Issue Bio-Refineries and Renewable Energies Supported on ICT)

Abstract

:
This study evaluated leachate recirculation (LR) as a stabilisation strategy for landfills using bioreactor experiments with excavated waste from a tropical landfill in Colombia. The experimental evaluation was performed in two 115 L bioreactors, one simulating the operation of a landfill with LR, Br2, where the leachate produced was recirculated at a rate of 0.8 L d−1, and a control system without LR, Br1. Both systems reached stabilisation indicator values on a dry matter (DM) basis for volatile solids VS (<25% DM) and a biochemical methane potential BMP (≤10 mL CH4 g−1 DM). Likewise, towards the end of the experiment, the leachate generated in Br2 reached stabilisation indicator values for BOD5 (<100 mg L−1) and the BOD (biological oxygen demand)/COD (chemical oxygen demand) ratio (<0.1). Although the stabilisation criterion for COD was not met in any bioreactor (<200 mg L−1), LR helped to release 19% more oxidisable organic matter in Br2 than in Br1, indicating a reduction in the contaminating potential of the waste in the case of uncontrolled discharges of leachate to the environment. Regarding biogas production, the generation of CH4 in Br2 was more intense and its cumulative production was 34.5% higher than Br1; thus, Br2 achieved CH4 emission rates, indicating waste stabilisation (<1.0 L CH4 m−2 h−1) sooner than Br1, showing an accelerating effect of LR on waste degradation. A carbon mass balance indicated that waste degradation, in terms of the initial total organic carbon mineralisation and the C gas discharge via CH4, was greater in Br2. These results demonstrate the LR potential to accelerate the stabilisation of a landfill but also to reduce greenhouse gas emissions in final disposal sites where biogas is also captured and utilised for energy production; a key aspect when improving the sustainability of landfill operations in developing countries.

1. Introduction

One of the main stabilisation strategies for landfills (SSL) is waste humidification or increasing waste moisture content [1,2,3]; and leachate recirculation (LR) is one of the most employed humidification techniques in modern landfills [4,5]. Experience indicates that stabilisation time is reduced to periods of 10–15 years in landfills properly constructed that use LR, such as bioreactor landfills, compared to the 30 or more years required at conventional landfills [6]. Other advantages of bioreactor landfills over conventional landfills are an increase in waste settlement and the improvement in landfill gas production and treatment of leachates [7,8,9].
This strategy not only reduces the risk associated with the contamination of groundwater and soils in the event of a possible failure of the landfill confinement system (due to slope failures, damage of linings, etc.), but it can also increase the service lifespan of the sites and reduce their operation and post-closure management periods, also improving their environmental and economic sustainability [10,11]. Improving the operation on landfills in developing countries (DC) is a key aspect for establishing more sustainable solid waste final disposal systems, given the continuous growth in municipal solid waste (MSW) generation and the still incipient development of integrated solid waste management systems in DC [12].
The massive use of LR techniques has accelerated interest in the study of the different methods used in their implementation as well as in the most determining variables in their operation. Moisture content is a fundamental parameter in SSL via humidification, and maintaining it in the range of 40–65% is desirable to promote the rapid decomposition of MSW [13]. For this reason, bioreactor landfills operate under similar moisture conditions [14].
Another key factor that varies according to the LR-specific objectives is the leachate recirculation rate, being generally greater when the main aim is to optimise biogas generation (100–200 L ton−1 waste), although the waste composition and site-specific environmental conditions must also be taken into account (e.g., precipitation, temperature, evaporation) [15]. Together, these factors define waste hydraulic properties such as porosity, density and hydraulic conductivity that govern the movement of fluids, solutes and biomass and determine the course of the degradation processes in landfills [16,17]. In addition to waste biodegradation, compaction reduces porosity and increases the waste density, reducing hydraulic conductivity in landfills therefore hindering the infiltration and distribution of liquids or the extraction of gases [3]. In the case of tropical landfills, high precipitation and the characteristic wet MSW generated in DC affect these hydraulic properties, making it necessary to use appropriate recirculation rates to control leachate and gas flows.
MSW produced in DC also affects the control and utilisation of landfill gas in sites operated under SSL. For instance, in developed countries where this type of research has been mainly conducted, the establishment of a methanogenic phase is slow due to the high content of paper, cardboard and garden waste, which makes methane emissions initially less intense but long-lasting [18]. In contrast, waste from DC tends to degrade faster given the high content of biowaste, especially food waste; thus, landfill gas management must be carried out earlier via systems that allow its capture and utilisation.
The limited applications of SSL in DC evidence the need to investigate its applicability by considering the type of waste disposed of and landfill operating conditions in these countries. Previous studies, conducted mainly with fresh waste (FW) from landfills of the organic fraction of MSW, have denoted the positive effect of LR on biogas production and parameters used as stabilisation indicators for landfills, such as volatile solids (VS), biochemical oxygen demand (BOD) and chemical oxygen demand (COD) [19,20,21,22]. Additionally, several studies in DC have reported a positive effect of LR on landfill settlement [23,24].
In contrast to FW research, few studies in DC have evaluated LR with excavated waste (EW) from landfills [19,24]. Most of the landfill stabilisation criteria have been suggested based on studies conducted in developed countries, in terms of parameters such as BMP, respirometric index, total organic carbon (TOC), COD, BOD, BOD/COD ratio, cellulose, lignin, cellulose to lignin ratio (C/L) and ammoniacal nitrogen (NH4+) [2,14,25,26,27,28]. In other studies in developed countries, stabilisation criteria based on mass balances have been suggested; for example, characterising the degradation of organic carbon in the waste and proposing C emission rates (in terms of CO2, CH4 or CO2 + CH4) as landfill stabilisation indicators [29,30,31].
It is likely that landfill stabilisation criteria in DC are different, not only because of the MSW characteristics but also because of the landfill’s environmental and operating conditions. A few studies with EW in DC have evaluated these differences for some waste stability indicators [18,24,32]; however, their information is still scarce. Therefore, it is necessary to establish adequate criteria to evaluate landfill stabilisation in DC.
On the other hand, the large variability in MSW produced worldwide and the intrinsic heterogeneity of landfills limit the use of the generic stabilisation criteria found in the literature and instead denote the need for properly contextualised assessments [33]. For example, Ponsá et al. (2008) [34] , observed the difficulty of achieving the BMP stabilisation criterion for MSW and MSW`s organic fraction subjected to mechanical-biological treatment (MBT) (BMP > 10 mL CH4 g−1 DM), while O’Donnell et al. (2018) [35], reported cellulose (<1.5%), C/L ratio (<0.2) and BMP (<0.2 mL CH4 g−1 DM) and suggested criteria in a landfill in the US 20 years after its closure, despite the fact that the site was found to be functionally stable in terms of landfill gas production, cover settlement and leachate quality (except for NH4+, NH3).
High dependence on landfills for managing MSW, the poor technical standards followed by several sites, a lack of financial provisions required for their post-closure management as well as the short lifespans of existing sites have made the optimisation of landfill operations a priority within the current solid waste management policies in Colombia [36]. As a result, current regulations establish that in addition to the treatment and final disposal of solid waste, landfills must include recycling processes, recovery of the waste organic fraction and the use of landfill gas for energy production, also stating that leachate treatment systems must use LR in landfills where evaporation is greater than precipitation (e.g., Resolution 938 of 2019) [37].
This study evaluates the application of LR as a stabilisation strategy for landfills in DC, through experiments in landfill simulation bioreactors using EW obtained from a tropical sanitary landfill located in southwest Colombia. The functioning of humidification via LR was evaluated in terms of parameters suggested as stabilisation indicators for landfills. Hence, in addition to evaluating its applicability as SSL, the results can contribute to the establishment of adequate criteria to assess the environmental performance and post-closure management of final disposal sites in DC.

2. Materials and Methods

2.1. Waste Source

Five-year-old EW, obtained from a regional sanitary landfill, was used in this study. After separating and classifying the different fractions, an initial screening was conducted to separate large items (>30 mm), rocks and other non-biodegradable materials present in the non-identifiable fraction (a mixture of soil-like and organic fines commonly found in landfills). The EW biodegradable fractions were mixed keeping their original proportions in the landfill: yard waste (15.4%), paper and cardboard (3.7%), sanitary waste (3.8%) and non-identifiable material (77%), on a wet basis. This procedure has two advantages: on the one hand, it helps reduce the difficulties inherent in obtaining sufficiently representative samples of heterogeneous systems such as landfills [38,39], and on the other hand, it allows us to take into account the influence of partially degraded materials present in EW, represented by the unidentifiable fraction. Although the CH4 generation potential of this fraction is usually low, its contribution to biogas production is important given its high proportion in landfills [40].

2.2. Landfill Simulation Bioreactors

The simulation of LR as a stabilisation strategy was performed in 115 L polymethylmethacrylate bioreactors (0.38 m internal diameter and 1.0 m high) (Figure 1). Its design was based on previous studies of landfill waste degradation [16,41,42] and SSL using bioreactors [29]. Two bioreactor configurations were evaluated: Br1 represents the operation of a conventional landfill, and Br2 where humidification via LR was simulated.
Waste was deposited on a perforated plate located 10 cm above the bioreactor base, to facilitate leachate drainage. A peristaltic pump was connected to an irrigation system consisting of perforated stainless-steel tubes distributed radially (diameter = 0.36 m). Waste was uniformly distributed by loading waste layers and exerting compaction manually up to an average wet density of 935 kg m−3, similar to the waste density values recommended for landfills in Colombia (≥850 kg m−3) [43]. Waste density was determined using the EW wet mass and its corresponding volume, by measuring its height and the cross-sectional area of the bioreactor [41,44].
The bioreactors were first coated with aluminium foil, then a heating wire was coiled around them and finally covered by a 2 cm sheet of insolation foam. The temperature was controlled by a sensor inserted at the centre of the waste mass connected to a thermostat controlling the heating wire. The bioreactor internal temperature was maintained close to 36 °C, within the mesophilic range (20–40 °C), which generates an adequate long-term balance between biogas production and leachate quality (in terms of COD) [45] and is consistent with the mean temperature reported for landfills (~30–40 °C) [3,30].
Once loaded, the bioreactors were hermetically closed and deionised water was gradually added during the first two weeks to promote the onset of degradation and the generation of enough leachate to saturate the EW up to field capacity conditions [46]. Henceforth, deionised water was only added to replenish leachate extracted for laboratory and to maintain the waste moisture content relatively constant [32,45,47]. Daily recirculation with an average LR rate of 0.8 L day−1 was used in Br2, a value established to keep moisture in the range of 40–65%, which favours rapid waste degradation [21], but also considers LR rates used in similar experiments with EW (~0.7–4.5 L day−1) [27,45,48,49] and values effectively applied in landfills (0.01–4.1 L day−1) [15]. Table 1 summarises the bioreactors operating conditions.
Except for LR, the operation of both bioreactors was identical during the 270 days of experimentation and included periodic monitoring of the biogas and the leachate produced, as well as the initial and final characterisation of solid waste stabilisation. Likewise, hydraulic waste characterisation was performed by measuring the porosity and hydraulic conductivity at the end of the tests.

2.3. Sampling and Analytical Methods

2.3.1. Leachate

A total of 90 leachate samples were taken from each bioreactor during the experiments, and their characterisation included measurement of pH, volatile fatty acids (VFA), COD and filtered COD (CODf), BOD5, ammonia nitrogen (NH4+), total alkalinity (TA) and bicarbonate alkalinity (BA) according to APHA et al. (2012). The TOC samples were measured using a continuous Skalar San Plus 5000 System flow analyser (Skalar, Breda, Netherlands). The discharge of COD, NH4+ and TOC in the leachate was calculated as the difference in mass between two consecutive samplings, this is multiplying the amount of leachate removed by the parameter concentration for the corresponding period [29,48,50].

2.3.2. Biogas

Biogas production was measured continuously using a tipping-bucket gas flow meter connected to each bioreactor gas outlet. The gas flow meter consisted of a triangular inverted tipping bucket immersed in an acidified solution to prevent the dissolution of CO2 [51]. Each time the bucket collects a certain amount of gas, a sensor connected to a counting device records the movement of a magnet attached to the bucket, thus continuously monitoring the amount of gas produced.
Biogas samples were taken weekly in Tedlar bags connected to the bioreactor gas outlet and its composition (% CH4 and CO2) was measured using a GFM-406 gas analyser (Gas Data Ltd.). CH4 and CO2 production were calculated on a dry basis, at standard temperature (0 °C) and pressure (1 atm), according to [52] (Table 2).
Since biogas production was measured continuously, and its composition was analysed weekly, the percentages of CH4 and CO2 correspond to those measured for the corresponding sampling period. The carbon discharge in the biogas (Cgas) was calculated from the volume of CH4 (VCH4) and CO2 (VCO2) produced [49], determining their molar quantity, n (mol), applying the general gas law: PV = nRT, where V (L) is the volume at standard P and T and R the ideal gas constant (0.082 atm L K−1 mol−1). Therefore, the carbon mass released was calculated by considering that in one mole of CH4 or CO2 there is one mole of C (=12 g of C).

2.3.3. Solid Waste

The solid waste characterisation was performed at the beginning and end of the experiments and included measurement of moisture content, total solids (TS) and VS according to APHA (2012) [53], cellulose and lignin based on the method of Van Soest et al. (1991) [54] and TOC using a continuous flow analyser (Skalar San Plus 5000 system). The BMP was determined by the manometric method, following the procedure described by Sandoval-Cobo et al. (2020) [55], whereby 59.8 g of EW was incubated with granular sludge from an anaerobic digester receiving wastewater from a cattle and pig slaughterhouse. A substrate to inoculum ratio (S/I) of 1.0 g VS substrate g−1 VS inoculum was used, tests were carried out in triplicate, monitored for 30 days and blank reactors (only inoculum) were run to discount the contribution of the inoculum to CH4 production.

2.3.4. Statistical Analysis

To determine significant differences between parameter values measured to solid waste samples at the beginning and end of the experiments, one-factor analysis of variance (ANOVA) and Tukey test (p < 0.05) were performed in Excel (Microsoft Excel, 2016) [29,48,56].

2.3.5. Mass Balance

To evaluate waste degradation, a mass balance was established for each bioreactor considering the difference between the initial organic carbon of the waste (TOCin) and that at the end of the tests (TOCend), denoted as ΔTOCs, and the release of carbon in the gas phase (Cgas) and the TOC discharged in the leachate (TOCl). This way, the total TOC balance for each bioreactor was calculated as [29]:
Err TOC = Δ TOC s C gas TOC l
where ErrTOC represents the difference in the total TOC balance between solid, gas and leachate.

3. Results and Discussion

3.1. Leachate

The greatest increase in BOD5 and COD since the start of the experiment took place in both systems around the fifth week (Figure 2), for the latter probably due to the hydrolysis of the partially degraded fractions present in the EW favoured by moisture and temperature within the bioreactor. In this period, the BOD/COD values were 0.45 and 0.41 for Br1 and Br2, respectively, which is within the range for partially stabilised leachates (0.1–0.5) [57] and is consistent with the EW age (~5 years).
The greater COD and BOD5 increments in Br2 indicate the effect that LR has on initial waste degradation stages, as has been observed in similar studies with EW [45,46]. LR could have accelerated hydrolysis and acidogenesis processes in Br2 by favouring greater leaching of soluble organic substances from the solid waste to the liquid phase which, when recirculated, improves the contact between biomass and the more easily assimilable waste fractions [19]. This, together with the variable biodegradability characteristics of the various materials found in MWS, might explain the fluctuation in BOD/COD observed. In both systems, COD reduction during the first five weeks was consistent with the VFA decreasing trend, indicating the transition towards more favourable methanogenic degradation conditions since pH was close to neutrality and TA/BA ratios ~0.8 during most of the experimentation, indicating an adequate buffer capacity [58].
The final COD values in Br1 and Br2 were 1263 and 694 mg L−1, respectively, higher than the stabilisation criterion suggested for landfills (<200 mg L−1) [25]. Regarding BOD5, only the final Br2 value (70 mg L−1) was below 100 mg L−1, the target stabilisation value proposed for leachates by Reikes (2003) (cited by [59]). In general terms, the impossibility of reaching lower COD values in mature leachates is related to difficult or slow degradation compounds produced by MSW decomposition in landfills; for example, humic substances and high-molecular-weight organic compounds [60].
In terms of TOC, waste decomposition and the leaching of degradation by-products may explain why its initial content in both bioreactors (~3500 mg L−1) decreased between the third and fourth month and then increased. On the other hand, although TOC tends to decrease with the degree of waste stabilisation [39], it is likely that the observed variability was influenced by the characteristic MSW heterogeneity, as with other stabilisation indicators for landfills [26,40].
BOD/COD ratio fluctuated between 0.06 and 0.70, reaching final values of 0.35 and 0.10 for Br1 and Br2, respectively. The final BOD/COD ratio for Br2 is comparable to that of mature leachates [60] and meets the landfill stability criterion of BOD/COD < 0.1 [14,61]; however, some studies indicate that the BOD/COD relationship does not always correlate well with solid waste stabilisation. Thus, it must be analysed in conjunction with other stabilisation indicators [35,62].
During the first 200 days, NH4+ concentrations in Br1 increased slightly due to its limited transformation under anaerobic conditions, which then decreased, because of its dilution (by the addition of water) and transformation into N2O/N2 by nitrification/denitrification processes in anoxic zones [48,63]. In contrast to what was observed in Br1, the concentration of NH4+ in Br2 decreased moderately but continuously, as observed in similar studies with EW [27,28,50]. It is expected that NH4+ was the predominant N species under the pH conditions observed (<8), and it is likely that leaching, and even its transformation into N2O/N2 owing to inevitable air intrusion, occurred in Br2 due to leachate recirculation [48]. Although final NH4+ concentrations in Br2 were indicative of leachate stabilisation (10–300 mg L−1) [25], achieving such concentrations in landfills using solely humidification as SSL is unlikely and thus the implementation of LR generally requires leachate treatment systems to reduce NH4+ to acceptable levels (e.g., <70 mg L−1) [63]. Nevertheless, since NH4+ largely determines leachate treatment intensity, its removal positively impacts the duration and costs of landfill post-closure management activities [27,64].

LR Effect on Leachate Discharges
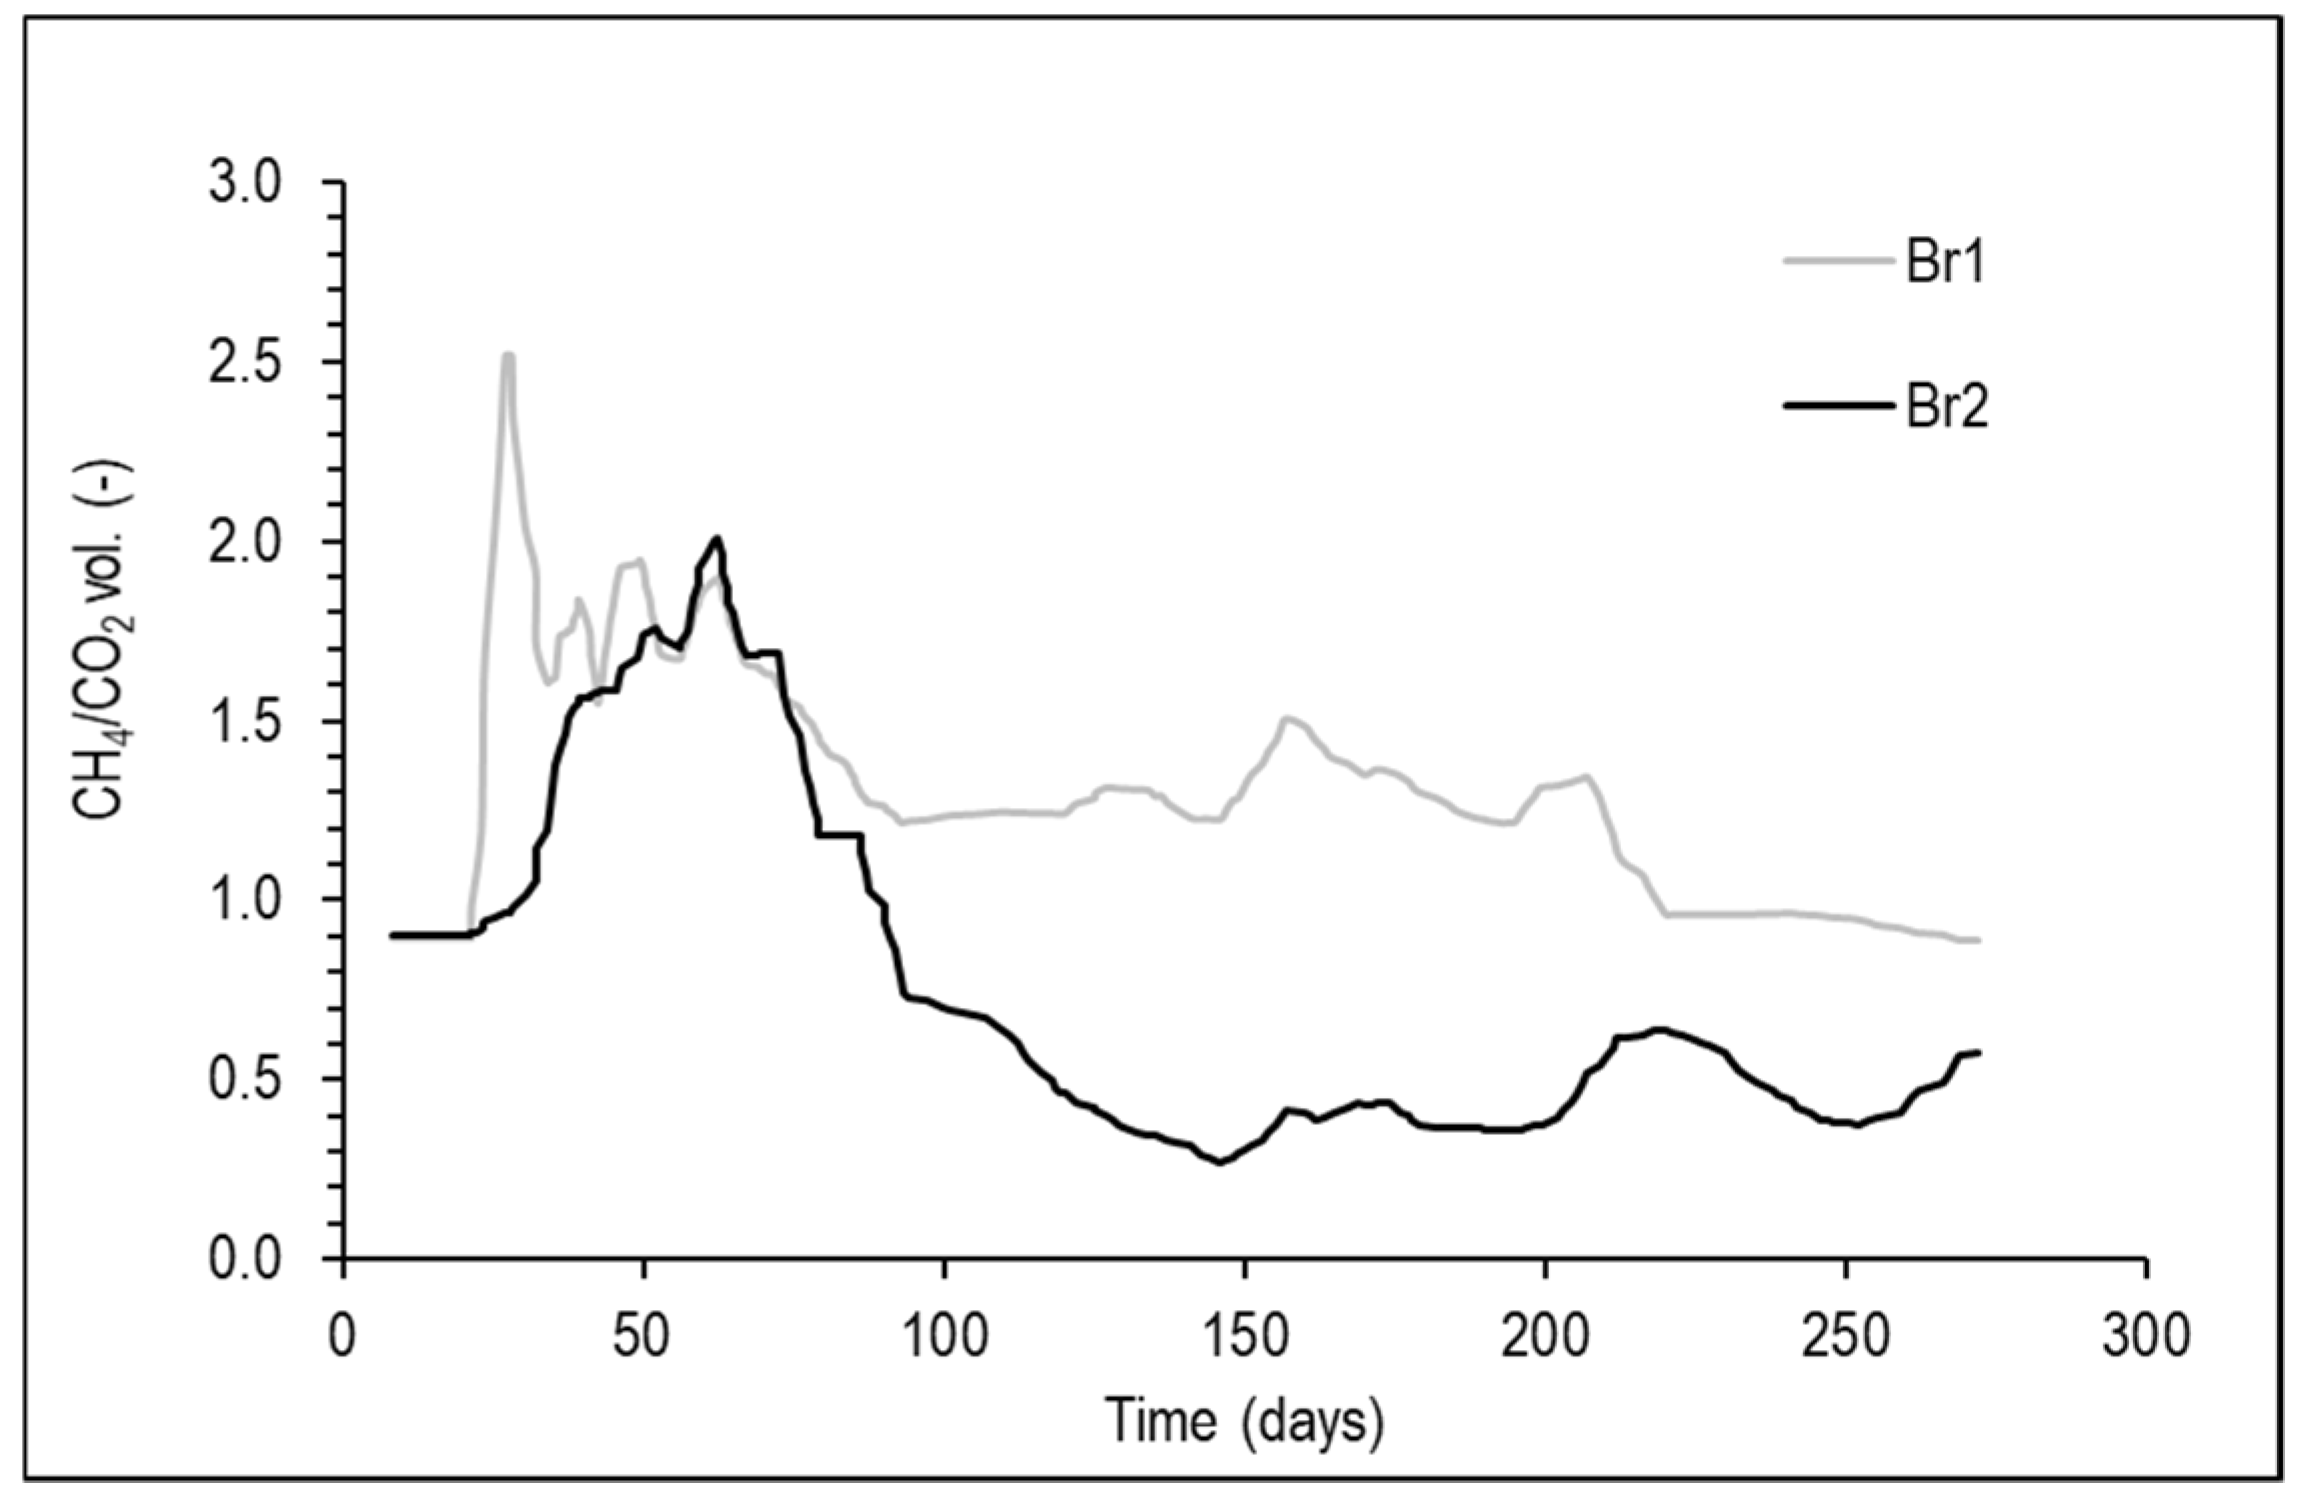
There were slight differences between Br1 and Br2 in terms of changes in organic matter; however, evaluating the impact of LR requires the analysis of its effect on the discharges of pollutants in the leachate produced, for instance in terms of oxidisable organic matter (i.e., COD) or nitrogen released (Table 3). The cumulative COD discharge in Br1 and Br2 was 583 and 694 mg O2 kg−1 DM, respectively; therefore, LR made it possible to increase the release of oxidisable organic matter of EW by 19%. Alternatively, the nitrogen discharge in Br2 (expressed as total nitrogen Kjeldahl; NTK) was 331 mg kg−1 DM, 27% lower than that of Br1, probably due to its transformation into N2O/N2.
As shown in Table 3, the emission potential of EW treated by LR depends not only on the operating conditions, e.g., temperature, duration of tests and the volume of liquids added (L/S ratio) or recirculated, but also on waste characteristics, such as its composition, age and biodegradability (e.g., in terms of VS). Studies such as those by [27,45] indicate that the optimisation of moisture (e.g., L/S = 1–2 L kg−1 DM) and LR rates applied improves the emission of oxidisable organic matter and nitrogen from EW. Likewise, bioreactor studies with food waste have shown the positive effect of humidification and continuous LR on organic matter degradation and removal [65].
There are two important conclusions regarding the effect of LR on leachate discharges. In the short term, the acceleration of degradation processes may affect leachate treatment efficiencies, making it necessary that the application of LR be complemented with measures to manage the excess of leachate produced (e.g., through evaporation ponds to facilitate its storage and recirculation) and the removal of less biodegradable compounds (e.g., via reverse osmosis, aeration or oxidising agents) [3]. In the long-term, a greater release of COD and a lower concentration of NH4+ could reduce the contamination potential of leachates: this is one of the main objectives of SSL since it reduces the risk of uncontrolled landfill emissions on health and the environment.

3.2. Biogas

Biogas production had an early onset in both bioreactors (Figure 3); however, by day 45 when the highest biogas generation rates were recorded, the cumulative production of CH4 in Br2 was 7.2 times greater than in Br1. This phase of intense biogas production coincided with the period of the greatest reduction in organic matter in the leachate (COD and VFA), indicating that under the improved conditions of moisture and temperature, EW constituted an easily assimilable substrate [46,55].
CH4 generation in Br2 was more intense during the first weeks and 60 days after the start of the experiments its cumulative CH4 production was 11.9 L kg DM−1 (equivalent to 80% of its total CH4 production at the end of the experiment), whereas in Br1 it was 5.0 L kg DM−1, 46% lower than in Br2. At the end of the experiments, the cumulative production of CH4 in Br2 was 34.5% higher than that of Br1, indicating that LR increased the production of CH4 compared to the system without LR.
During the first 60 days, the percentage of CH4 in biogas was between 40% and 65% in both systems, characteristic of methanogenic degradation conditions for MSW [66]. From this point on, the percentage of CH4 and CO2 in Br1 remained relatively constant and the CH4/CO2 ratio used to identify degradation phases in landfills was similar to that observed in sites under stable methanogenic degradation conditions (CH4: 50–60%; CH4/CO2: 1.0–4.0) [67], as shown in Figure 4.
Conversely, by day 60, the percentage of CH4 in Br2 decreased rapidly and the CH4/CO2 ratio dropped to < 1.0, characteristic of advanced stages of degradation in landfills [68]. Francois et al. (2007) [39] measured the percentages of CH4 characteristic of methanogenic phases (~54%) for 8-year EW from a landfill in France treated in bioreactors with LR (0.54 L day−1), also reporting an accelerating effect of the LR on biogas production. Using 10-year EW from a tropical dumpsite in India [24], measured the percentages of CH4 in the range 15–47% during bioreactor experiments with larger LR rates (9–30 L day−1), also concluding that LR intensified biogas production.
The effect that LR has on the acceleration of waste degradation and landfill stabilisation can be examined by analysing CH4 production rates and the corresponding total carbon emission (understood as the sum of CH4 and CO2 emissions). Figure 5 shows the daily and weekly average rate (calculated as the moving average for seven days) of CH4 production per unit area, considering the bioreactor cross-sectional area (0.116 m2).
The weekly average CH4 production rate in the first weeks was higher in Br2, reaching maximum values around day 45, at 5.8 L CH4 m−2 h−1 (~38 L day−1), 2.5 times higher than the maximum average rate in Br1, which was 2.3 L CH4 m−2 h−1. From this point on, the average rate of CH4 production decreased in both systems. However, in Br2, it decreased faster, and around day 60, it was established below <1.0 L CH4 m−2 h−1, a value suggested as a stabilisation criterion for landfills based on the methane oxidative capacity of the final coverage in landfill sites [26]. By contrast, in Br1, this criterion was met 30 days later, indicating the potential for LR to accelerate waste stabilisation and reduce landfill CH4 emissions to acceptable levels in terms of its impacts on health and the environment.
In a similar way to biogas production, carbon discharge via CH4 and CO2 produced in Br2 (Cgas) increased rapidly until day 40, when it reached its maximum (Figure 6).
In contrast, Cgas in Br1 was less acute, although it peaked around the same period. The cumulative Cgas due to CH4 and CO2 was 59.1% and 40.9%, and 62.2% and 37.8% for Br1 and Br2, respectively; therefore, LR made it possible for a larger fraction of the carbon gas to be discharged as CH4, a greenhouse gas with a global warming potential 28–30 times greater than that of CO2 [69]. This corroborates how the application of LR together with landfill gas capture and utilisation constitute a key factor in reducing global warming and other environmental impacts associated with landfills emissions, and the benefits that modern stabilisation strategies represent for mitigating climate-change-related impacts produced by landfills in DC.

3.3. Solid Waste

Table 4 shows the changes in moisture and stability indicators measured for the EW solid fraction before and after the experiments.
The EW’s initial moisture content was within the range measured during sampling in the landfill site (36.1–48.6%) and is comparable to that reported for EW with a similar age in Brazil (36.3–48.6%), China (40.4–43%) or India (28–30%) [32]. At the end of the tests, moisture in Br2 was similar to the initial level (p < 0.05), but was significantly higher than in Br1, indicating that LR allowed the reaching and maintaining of favourable moisture conditions for waste degradation. Furthermore, the higher moisture content in Br2 was close to the one recommended for bioreactor landfills (40–65%) and was positively correlated with the greatest reductions observed in the stability indicators (BMP, VS, TOC, BOD/COD); additionally, the final waste density (857 kg/m3) was above the minimum value required for sanitary landfills in Colombia (≥850 kg m−3) [43]. Thus, the LR rates applied not only helped to establish favourable degradation conditions but also indicate that higher LR rates could be used, something that could improve stabilisation results.
The original VS content of the EW was low. However, its reduction was significant (p < 0.05) in both bioreactors, although a lower value was reached in Br2. Hence, there was a clear correlation between the reduction in VS and the degradation of organic matter, and final VS in both systems were lower than target values suggested as stabilisation criteria for landfills (<25% in DM) [26,39].
EW’s original TOC was within the range (3–18% DM) reported for landfill waste with high content of organic fractions in countries such as China [50,70], India [21,32] or México [7]. Final TOC in Br2 (11.9% DM) was lower than that of Br1 (12.6%), although they did not reach stabilisation target values for landfills (e.g., <5% or 3% DM for non-hazardous or inert waste) [71]. Alternatively, TOC reductions, which were 1.6% and 7.3% for Br1 and Br2, respectively, are comparable to similar studies with EW but for longer experimental periods: Brandstätter et al. (2015) [29] , obtained 16.8% TOC reduction for 40-year EW (initial TOC = 6.67% DM) treated in bioreactors with LR for 823 days, whereas Wu et al. (2016) [50] obtained 2.4% TOC reduction for 5–8-year-old EW (initial TOC = 11.2% DM) in experiments simulating the operation of a conventional landfill during 1650 days.
The low TOC reduction observed for the EW solid fractions might be due to the presence of either slow or hardly biodegradable compounds such as synthetic materials, lignin or humic substances [49]. In fact, Prant et al. (2006) [27] indicated that only a fraction of the TOC in MSW is degradable (30–40%) under the prevailing anaerobic conditions in landfills so that the remaining organic compounds are responsible for the main environmental risks associated with landfill emissions. Therefore, although TOC reduction for the EW solid fraction was insignificant, it does indicate the potential for humidification to favour landfill waste organic stabilisation, an important aspect for the post-closure management of landfills in DC.
The initial cellulose content of EW was within the range observed in landfills, which can range from <1.0% DM for EW from old sites [27,29] to values close to 50–60% DM [72], and it only slightly decreased in Br2, whereas in Br1 it increased, possibly due to recalcitrant by-products from different phases of waste degradation, which are mixed and leached through the waste mass as a result of the operation of the landfill itself. Likewise, increases in cellulose are also related to the difficulty of obtaining representative waste samples from landfills [26,72]. Final cellulose values did not meet the suggested stabilisation criteria for landfills (<1.5% DM) [26], and neither did the cellulose to lignin ratios (C/L) for Br1 (4.5) and Br2 (3.8) (not shown in Table 4), which were above the stability criterion (≤0.2) [14], most likely due to the slow anaerobic biodegradability of lignocellulosic compounds, as has been observed in other studies with EW [18,52].
Previous studies with aged EW (>15 years old) where target values for cellulose and lignin were not met, such as those of [52] or [26], evidenced how difficult it is to meet this stabilisation criterion under conventional landfill operating conditions. In fact, during the sampling and physical characterisation of EW, partially degraded yard waste, toilet paper and diapers were still recognisable after five years of its disposal at the regional sanitary landfill.
The initial BMP was comparable to that of EW from landfills with a similar age and even older [40,73], and although in both bioreactors it decreased significantly (p < 0.01) and reached the target values proposed (≤10 mL CH4 g−1 DM) [25,28], BMP reduction in Br2 was slightly greater (95.1%) than in Br1 (88.6%). The greater BMP reduction in Br2 was positively correlated with both its higher VS and TOC reductions and higher final moisture content, demonstrating the LR potential to enhance biogas production and stabilisation.
Furthermore, the specific effect of LR on the readily biodegradable waste fractions can be analysed by contrasting the CH4 cumulative production in each bioreactor against the initial EW BMP, which was 17.5 L CH4 kg−1 DM and would correspond to its maximum CH4 production potential under anaerobic conditions. At the end of the tests, cumulative CH4 production in Br1 and Br2 was 11.0 and 14.8 L CH4 kg−1 DM, which corresponds to 63% and 84.7% of its initial BMP, respectively; therefore, CH4 production in Br2 was closer to the EW CH4 generation potential. Thus, for the same operation period, LR accelerated the degradation process in Br2.

3.4. Mass Balance

Approximately 8.0% and 13.5% of the initial EW carbon content in Br1 and Br2 were degraded during the experiments, respectively. In the solid phase, the carbon loss in Br2 (452.3 g) was greater than that in Br1 (282.4 g), indicating that the solid waste degradation was 1.6 times greater in the LR system (Figure 7). In both systems, the carbon reduction of the substrate occurred mainly through biogas, with 243 g C released as Cgas in Br1 and 311.6 g C in Br2. This way, Cgas discharge was higher from Br2 (9.3% of the initial waste TOC) than from Br1 (6.9%), i.e., mineralisation of carbon initially present in EW was 36% higher in the bioreactor with LR. Alternatively, leachate carbon emissions (TOCl) were lower than those of gas, being 26.1 g in Br1 and 26.3 g in Br2 (~0.7% of the initial waste TOC in both bioreactors), indicating that carbon removal from EW through leachate was negligible compared to its release in the gas phase.
The TOC balance precision was evaluated by comparing changes in the initial and final TOC (ΔTOCs) and the calculated carbon fluxes for each bioreactor, in terms of a percentage error, according to Brandstätter et al. (2015):
% Err TOC = Err TOC Δ TOC s × 100
The analysis showed % ErrorTOC of 5% and 25% for Br1 and Br2, respectively, comparable to errors in C balance between 11% to 32% that have been reported for other studies where bioreactors have been used to simulate the operation of SSL [29,31]. In this study, deviations in the C mass balance can be attributed to CO2 and CH4 losses during leachate sampling and recirculation, especially during the first weeks when biogas production peaked, as well as carbon deposited as carbonates in drainage layers which are not accounted for [31].
After 270 days of experimentation, C discharge in the biogas was 8.8 and 11.9 g C kg−1 DM in Br1 and Br2, respectively, indicating that LR increased the carbon discharge through biogas. These values are within the range of 2.5–15 g C kg−1 DM reported for similar studies with EW treated by LR in developed countries but for longer experimental periods [27,29,49]. Consequently, the total TOC balance allowed the quantification of C released by the waste and its discharge into the gas and leachate, allowing the assessment of landfill waste stabilisation under LR by comparing this result against the stability indicators measured to the solid waste, leachate and biogas. These results highlight the need to evaluate SSL performance not only in terms of waste stability characteristics (e.g., VS, TOC, cellulose, BOD, COD) but also using mass balances to analyse the behaviour of waste emissions under similar conditions to those found in landfills.

3.5. Waste Stability Characteristics

Table 5 summarises the waste stability indicators measured at the end of the tests in bioreactors and stabilisation criteria suggested for landfills.
In Br2, 6 out of the 10 measured parameters met at least one of the stabilisation criteria for landfills (VS, COT, BMP, BOD, BOD/COD, biogas emission rate), whereas for the system without recirculation (Br1), 4 of them were met (VS, COT, BMP, biogas emission rate). Although the most stringent TOC criteria set by European regulations for non-hazardous wastes (<5%) or inert wastes (<3%) were not met, TOC reduction achieved in Br2 was comparable to that reported in other studies with LR, although in a shorter period [27,50]. Due to the duration of the tests, cellulose and the C/L ratio did not meet the stability criteria; however, previous studies have also shown that these indicators do not always correlate well with the degree of stabilisation in landfills [52,76].
Moisture and temperature conditions enhanced biogas production in both bioreactors, which registered CH4 generation rates indicative of waste stabilisation (<1.0 L CH4 m−2 h−1). However, the joint analysis of CH4 cumulative production and BMP showed that CH4 generation in Br2 reached 84.7% of the CH4 maximum production potential for EW, higher than that reached in Br1 (63%). This agrees with other studies in tropical developing countries where greater reductions in the residual biogas potential of MSW have been observed in shorter time periods, due not only to higher fractions of wet biodegradable wastes but also to temperature conditions in sites closer to the mesophilic range, which in turn favours waste biodegradation processes in landfills [45,77]. This shows that LR could reduce both the CH4 remaining potential of EW and the time and costs required for its stabilisation in landfills.
Regarding leachate quality, none of the bioreactors reached the proposed target values for COD or NH4+. However, in Br2, BOD5 and the BOD/COD ratio met the suggested stability criteria. Conversely, the analysis of COD and nitrogen (as NTK) discharges showed that LR can help reduce the contaminating potential of leachates, a key element for improving the operation and post-closure management of landfills in DC.
Finally, the mass balance performed revealed that the mineralisation of carbon initially present in EW and its gaseous discharge (Cgas) as CH4 was greater in Br2, corroborating the positive effect that LR has on stabilisation and the reduction in GHG emissions in landfills, whereby the biogas produced is captured and utilised. Furthermore, biogas utilisation can generate economic benefits that improve the sustainability of landfills operation [78], a key aspect for the establishment of integrated solid waste management systems in DC where landfills are the most common technology used for the management of MSW [79].
These results demonstrate the importance of evaluating landfill stabilisation through approaches that integrate the measurement of waste stability characteristics and the analysis of its main emissions, contributing towards the application of more comprehensive methods to assess stabilisation strategies for landfills. Moreover, it demonstrates that establishing stabilisation criteria based on the physical, chemical and biological characteristics of wastes and the evolutions of its emissions is a logical and necessary step to implement contextualised methodological frameworks to evaluate stabilisation and post-closure management alternatives for landfills in DC, also rendering them essential for establishing technical criteria to assess the future use of final disposal sites.

4. Conclusions

Leachate recirculation (LR) experiments with EW demonstrated several of the advantages reported for humidification as a stabilisation strategy for landfills (SSL), not only in terms of waste stability indicators (VS, TOC, BMP, BOD5 and BOD/COD), which met several stabilisation criteria suggested for landfills but also in terms of the positive effect of LR on biogas emissions and leachate quality. The best stability characteristics determined for the bioreactor with LR were positively correlated with its highest moisture content, greater biogas production and the earlier establishment of low CH4 generation rates, indicating waste stabilisation.
Carbon mass balances indicated that LR allowed a greater degradation of the initial C content in the solid waste, as well as larger C emissions in the form of CH4. LR also had a positive impact on leachate quality, since, in addition to the rapid and significant reduction in COD and BOD5, the final BOD/COD ratio met the suggested stabilisation criteria. Additionally, recirculation favoured a greater release of oxidisable organic matter, thus reducing the waste contaminating potential in the long term. This is precisely one of the main objectives of the application of SSL.
The stability characteristics determined for the solid waste fraction, leachate and biogas at the end of the experiments corroborated the potential that humidification via LR has to enhance the environmental performance of landfills. Moreover, the results indicate that when humidification is complemented with the capture and utilisation of biogas and adequate treatment of leachates, it can help improve the sustainability of the operation of landfills in developing countries.
The joint analysis of waste stability characteristics and its emissions through carbon mass balances highlights the importance of bioreactor-type tests to determine stabilisation criteria contextualised to the MSW characteristics and specific operating conditions of landfills.
This has several implications. First, LR increases the potential of biogas production, a combustible gas, that could be used for the heat supply of processes in landfill sites or to produce energy, for example via an internal combustion engine, either for internal or external use. This means a reduction in uncontrolled greenhouse gas emissions and possibly, depending on the specific site energy matrix, the replacement of non-renewable for renewable sources of energy. Second, LR increases local energy security supply by reducing the dependence of foreign energy supply sources. Third, LR has a positive environmental effect in terms of the increase in the final stability of the site, which means a reduction in some of the potential damaging chemical substances and opens the possibility to restauration site projects at a later stage.
Although there have been several studies on stabilisation strategies for landfills, these have mainly been developed in developed countries, so this research contributes to the establishment of technical parameters for its application in developing countries as well as the establishment of criteria for the evaluation of their performance contextualised to the characteristics of the waste and the operating conditions of final disposal sites in these countries. Additionally, since is expected that the technical operating standards of landfills in countries such as Colombia are improved, these needed contextualised criteria will allow for the application of more comprehensive methodological approaches to evaluate stabilisation in landfills, something that will help improve environmental performance and post-closure management of final disposal sites in developing nations.

Author Contributions

Conceptualization: J.J.S.-C., D.M.C.-C., L.F.M.-R. and P.T.-L.; Methodology: J.J.S.-C., D.M.C.-C. and J.F.; Validation: J.J.S.-C., L.F.M.-R. and P.T.-L.; Formal analysis: J.J.S.-C., L.F.M.-R., D.M.C.-C. and P.T.-L.; Investigation: J.J.S.-C.; Resources: J.J.S.-C., D.M.C.-C., L.F.M.-R. and P.T.-L.; Data Curation: J.J.S.-C.; Writing: J.J.S.-C.; Visualization: J.J.S.-C.; Project Administration: J.J.S.-C.; Funding Acquisition: D.M.C.-C., L.F.M.-R. and P.T.-L. All authors have read and agreed to the published version of the manuscript.

Funding

This research was funded by Universidad Cooperativa de Colombia through grant numbers INV2837 and INV1688, the Universidad del Valle grant number CI-2908 and MINCIENCIAS with a doctoral scholarship for John J Sandoval-Cobo call 647-2014. The APC was funded by the Universidad Cooperativa de Colombia.

Institutional Review Board Statement

Ethical review and approval for this study was not applicable because it did no involve humans or animals.

Informed Consent Statement

Not applicable.

Conflicts of Interest

The authors declare no conflict of interest.

References

  1. Bareither, C.A.; Barlaz, M.A.; Doran, M.; Benson, C.H. Retrospective Analysis of Wisconsin’s Landfill Organic Stability Rule. J. Environ. Eng. 2017, 143, 04017001. [Google Scholar] [CrossRef]
  2. Reinhart, D.R.; McCreanor, P.T.; Townsend, T. The bioreactor landfill: Its status and future. Waste Manag. Res. J. Sustain. Circ. Econ. 2002, 20, 172–186. [Google Scholar] [CrossRef]
  3. Townsend, T.G.; Powell, J.; Jain, P.; Xu, Q.; Tolaymat, T.; Reinhart, D. Sustainable Practices for Landfill Design and Operation; Springer: Berlin/Heidelberg, Germany, 2015. [Google Scholar] [CrossRef]
  4. Benson, C.; Barlaz, M.; Lane, D.; Rawe, J. Practice review of five bioreactor/recirculation landfills. Waste Manag. 2007, 27, 13–29. [Google Scholar] [CrossRef]
  5. Kumar, S.; Chiemchaisri, C.; Mudhoo, A. Bioreactor landfill technology in municipal solid waste treatment: An overview. Crit. Rev. Biotechnol. 2010, 31, 77–97. [Google Scholar] [CrossRef]
  6. U.S. EPA. Bioreactor Performance. Report EPA530-R-07-007. 2007. Available online: https://www.epa.gov/sites/production/files/2016-03/documents/bio-perf.pdf (accessed on 1 July 2021).
  7. Hernández-Berriel, M.C.; Mañón-Salas, C.; Sánchez-Yáñez, J.; La Fuente, J.L.-D.; Marquez-Benavides, L. Influence of Recycling Different Leachate Volumes on Refuse Anaerobic Degradation. Open Waste Manag. J. 2010, 3, 155–166. [Google Scholar] [CrossRef]
  8. Jain, P.; Ko, J.H.; Kumar, D.; Powell, J.; Kim, H.; Maldonado, L.; Townsend, T.; Reinhart, D.R. Case study of landfill leachate recirculation using small-diameter vertical wells. Waste Manag. 2014, 34, 2312–2320. [Google Scholar] [CrossRef]
  9. Wang, Y.; Pelkonen, M.; Kaila, J. Optimization of landfill leachate management in the aftercare period. Waste Manag. Res. J. A Sustain. Circ. Econ. 2012, 30, 789–799. [Google Scholar] [CrossRef] [PubMed]
  10. Cossu, R. The sustainable landfilling concept. In Eleventh International Waste Management and Landfill Symposium; Environmental Sanitary Engineering Centre: Sardinia, Italy, 2005. [Google Scholar]
  11. UNEP & ISWA. The Global Waste Management Outlook (GWMO). 2015. Available online: http://www.unep.org/ietc (accessed on 1 January 2021).
  12. Kaza, S.; Yao, L.C.; Bhada-Tata, P.; Van Woerden, F. What A Waste 2.0: A Global Snapshot of Solid Waste Management to 2050; Urban Development Series; World Bank: Washington, DC, USA, 2018. [Google Scholar]
  13. Patil, B.; Singh, D. Study of Sustainable Engineereed Bioreactor Landfill (SEBL) for Small Communities. J. Solid Waste Technol. Manag. 2015, 41, 2–14. [Google Scholar] [CrossRef]
  14. Reinhart, D.R.; Townsend, T.G. Landfill Bioreactor Design and Operation; Routledge: New York, NY, USA, 2018. [Google Scholar] [CrossRef]
  15. Beaven, R.; Knox, K.; Powrie, W. A Technical Assesment of Leachate Recirculation; Report SC030144/R6; Environment Agency: Bristol, UK, 2009.
  16. Caicedo-Concha, D.M.; Sandoval-Cobo, J.J.; Whiting, K. An experimental study on the impact of two dimensional materials in waste disposal sites: What are the implications for engineered landfills? Sustain. Environ. Res. 2016, 26, 255–261. [Google Scholar]
  17. Liu, L.; Xiong, H.; Ma, J.; Ge, S.; Yu, X.; Zeng, G. Leachate Recirculation for Enhancing Methane Generation within Field Site in China. J. Chem. 2018, 2018, 9056561. [Google Scholar] [CrossRef]
  18. Zheng, W.; Lü, F.; Bolyard, S.C.; Shao, L.; Reinhart, D.R.; He, P. Evaluation of monitoring indicators for the post-closure care of a landfill for MSW characterized with low lignin content. Waste Manag. 2014, 36, 222–229. [Google Scholar] [CrossRef] [PubMed]
  19. Lohchab, R.; Singh, U. Performance evaluation of a landfill leachate recirculation treatment system using quadric model. J. Environ. Biol. 2017, 38, 1313–1320. [Google Scholar] [CrossRef]
  20. Ozkaya, B.; Demir, A.; Basturk, A.; Bilgili, M.S. Investigation of leachate recirculation effects in Istanbul Odayeri Sanitary Landfill. J. Environ. Sci. Health Part A Toxic/Hazard. Subst. Environ. Eng. 2004, 39, 873–883. [Google Scholar] [CrossRef] [PubMed]
  21. Patil, B.S.; Anto, C.A.; Singh, D.N. Simulation of municipal solid waste degradation in aerobic and anaerobic bioreactor landfills. Waste Manag. Res. J. Sustain. Circ. Econ. 2016, 35, 301–312. [Google Scholar] [CrossRef]
  22. Xu, Q.; Tian, Y.; Wang, S.; Ko, J.H. A comparative study of leachate quality and biogas generation in simulated anaerobic and hybrid bioreactors. Waste Manag. 2015, 41, 94–100. [Google Scholar] [CrossRef]
  23. Sandip, T.M.; Kanchan, C.K.; Ashok, H.B. Enhancement of methane production and bio-stabilisation of municipal solid waste in anaerobic bioreactor landfill. Bioresour. Technol. 2012, 110, 10–17. [Google Scholar] [CrossRef] [PubMed]
  24. Swati, M.; Karthikeyan, O.P.; Joseph, K.; Visvanathan, C.; Nagendran, R. Pilot-Scale Simulation of Landfill Bioreactor and Controlled Dumping of Fresh and Partially Stabilized Municipal Solid Waste in a Tropical Developing Country. J. Hazard., Toxic Radioact. Waste 2011, 15, 321–330. [Google Scholar] [CrossRef]
  25. Cossu, R.; Lai, T.; Piovesan, E. Proposal of a methodology for assessing the final storage quality of a landfill. In Proceedings of the 11th International Waste Management and Landfill Symposium, Sardinia, Italy, 1–5 October 2007. [Google Scholar]
  26. Knox, K.; Braithwaite, P.; Caine, M.; Croft, B. Brogborough landfill test cells: The final chapter. A study of landfill completion in relation to final storage quality (FSQ) criteria. In Sardinia 2005—10th International Waste Management and Landfill Symposium; Cossu, R., Diaz, L., Stegmann, R., Eds.; Environmental Sanitary Engineering Centre: Sardinia, Italy, 2005. [Google Scholar]
  27. Prantl, R.; Tesar, M.; Huber-Humer, M.; Lechner, P. Changes in carbon and nitrogen pool during in-situ aeration of old landfills under varying conditions. Waste Manag. 2006, 26, 373–380. [Google Scholar] [CrossRef]
  28. Ritzkowski, M.; Stegmann, R. Landfill aeration within the scope of post-closure care and its completion. Waste Manag. 2013, 33, 2074–2082. [Google Scholar] [CrossRef]
  29. Brandstätter, C.; Laner, D.; Fellner, J. Carbon pools and flows during lab-scale degradation of old landfilled waste under different oxygen and water regimes. Waste Manag. 2015, 40, 100–111. [Google Scholar] [CrossRef]
  30. Hrad, M.; Gamperling, O.; Huber-Humer, M. Comparison between lab- and full-scale applications of in situ aeration of an old landfill and assessment of long-term emission development after completion. Waste Manag. 2013, 33, 2061–2073. [Google Scholar] [CrossRef]
  31. Valencia, R.; van der Zon, W.; Woelders, H.; Lubberding, H.; Gijzen, H. Achieving “Final Storage Quality” of municipal solid waste in pilot scale bioreactor landfills. Waste Manag. 2009, 29, 78–85. [Google Scholar] [CrossRef]
  32. Shalini, S.S.; Karthikeyan, O.P.; Joseph, K. Biological stability of municipal solid waste from simulated landfills under tropical environment. Bioresour. Technol. 2010, 101, 845–852. [Google Scholar] [CrossRef]
  33. Laner, D.; Crest, M.; Scharff, H.; Morris, J.W.; Barlaz, M.A. A review of approaches for the long-term management of municipal solid waste landfills. Waste Manag. 2012, 32, 498–512. [Google Scholar] [CrossRef]
  34. Ponsa, S.; Gea, T.; Alerm, L.; Cerezo, J.; Sánchez, A. Comparison of aerobic and anaerobic stability indices through a MSW biological treatment process. Waste Manag. 2008, 28, 2735–2742. [Google Scholar] [CrossRef]
  35. O’Donnell, S.T.; Caldwell, M.D.; Barlaz, M.A.; Morris, J.W. Case study comparison of functional vs. organic stability approaches for assessing threat potential at closed landfills in the USA. Waste Manag. 2018, 75, 415–426. [Google Scholar] [CrossRef]
  36. DNP. Pólítica Nacional para la Gestión Integral de Residuos Sólidos; CONPES 3874; DNP: Bogotá, Colombia, 2016. Available online: https://colaboracion.dnp.gov.co/CDT/Conpes/Econ%C3%B3micos/3874.pdf (accessed on 1 January 2022).
  37. Minvivienda. Ministerio de Vivienda Ciudad y Territorio de Colombia; Resolución No. 938 de 2019; Minvivienda: Bogotá, Colombia, 2019. [Google Scholar]
  38. Boulanger, A.; Pinet, E.; Bouix, M.; Bouchez, T.; Mansour, A.A. Effect of inoculum to substrate ratio (I/S) on municipal solid waste anaerobic degradation kinetics and potential. Waste Manag. 2012, 32, 2258–2265. [Google Scholar] [CrossRef]
  39. Francois, V.; Feuillade, G.; Skhiri, N.; Lagier, T.; Matejka, G. Indicating the parameters of the state of degradation of municipal solid waste. J. Hazard. Mater. 2006, 137, 1008–1015. [Google Scholar] [CrossRef]
  40. Kim, H.; Townsend, T.G. Wet landfill decomposition rate determination using methane yield results for excavated waste samples. Waste Manag. 2012, 32, 1427–1433. [Google Scholar] [CrossRef]
  41. Sandoval, J.J. Characterisation of Saturated & Unsaturated Flow of Liquids in Municipal Solid Waste. Master’s Thesis, University of Southampton, Southampton, UK, 2013. Available online: https://eprints.soton.ac.uk/466854/ (accessed on 1 January 2021).
  42. Caicedo, D. A Study of the Structure in Solid Wastes and Some Implications for Fluid Flow in Landfills. Ph.D. Thesis, University of Southampton, Southampton, UK, 2013. [Google Scholar]
  43. Minvivienda. Reglamento Técnico del Sector de Agua Potable y Saneamiento Básico—RAS; Minvivienda: Bogotá, Colombia, 2012. [Google Scholar]
  44. Hudson, A. Evaluation of the Vertical and Horizontal Hydraulic Conductivities of Household Wastes. Ph.D. Thesis, University of Southampton, Southampton, UK, 2007. [Google Scholar]
  45. Wang, Y.; Pelkonen, M. Impacts of temperature and liquid/solid ratio on anaerobic degradation of municipal solid waste: An emission investigation of landfill simulation reactors. J. Mater. Cycles Waste Manag. 2009, 11, 312–320. [Google Scholar] [CrossRef]
  46. Francois, V.; Feuillade, G.; Matejka, G.; Lagier, T.; Skhiri, N. Leachate recirculation effects on waste degradation: Study on columns. Waste Manag. 2007, 27, 1259–1272. [Google Scholar] [CrossRef]
  47. Wang, Y.-S.; Odle, W.S.; Eleazer, W.E.; Bariaz, M.A. Methane Potential of Food Waste and Anaerobic Toxicity of Leachate Produced During Food Waste Decomposition. Waste Manag. Res. J. Sustain. Circ. Econ. 1997, 15, 149–167. [Google Scholar] [CrossRef]
  48. Brandstätter, C.; Laner, D.; Fellner, J. Nitrogen pools and flows during lab-scale degradation of old landfilled waste under different oxygen and water regimes. Biogeochemistry 2015, 26, 399–414. [Google Scholar] [CrossRef]
  49. Ritzkowski, M.; Heyer, K.-U.; Stegmann, R. Fundamental processes and implications during in situ aeration of old landfills. Waste Manag. 2006, 26, 356–372. [Google Scholar] [CrossRef]
  50. Wu, C.; Shimaoka, T.; Nakayama, H.; Komiya, T.; Chai, X. Stimulation of waste decomposition in an old landfill by air injection. Bioresour. Technol. 2016, 222, 66–74. [Google Scholar] [CrossRef]
  51. Walker, M.; Zhang, Y.; Heaven, S.; Banks, C. Potential errors in the quantitative evaluation of biogas production in anaerobic digestion processes. Bioresour. Technol. 2009, 100, 6339–6346. [Google Scholar] [CrossRef]
  52. Ivanova, L. Quantification of Factors Affecting Rate and Magnitude of Secondary Settlement of Landfills. Ph.D. Thesis, University of Southampton, Southampton, UK, 2007. Available online: https://eprints.soton.ac.uk/466251/ (accessed on 1 July 2021).
  53. American Public Health Association. Standard Methods for the Examination of Water and Wastewater; American Public Health Association: Washington, DC, USA, 2012. [Google Scholar]
  54. Van Soest, P.J.; Robertson, J.B.; Lewis, B.A. Methods for dietary fiber, neutral detergent fiber, and nonstarch polysaccharides in relation to animal nutrition. J. Dairy Sci. 1991, 74, 3583–3597. [Google Scholar] [CrossRef]
  55. Sandoval-Cobo, J.J.; Casallas-Ojeda, M.R.; Carabalí-Orejuela, L.; Muñoz-Chávez, A.; Caicedo-Concha, D.M.; Marmolejo-Rebellón, L.F.; Torres-Lozada, P. Methane potential and degradation kinetics of fresh and excavated municipal solid waste from a tropical landfill in Colombia. Sustain. Environ. Res. 2020, 30, 7. [Google Scholar] [CrossRef]
  56. Wang, B.; Björn, A.; Strömberg, S.; Nges, I.A.; Nistor, M.; Liu, J. Evaluating the influences of mixing strategies on the Biochemical Methane Potential test. J. Environ. Manag. 2017, 185, 54–59. [Google Scholar] [CrossRef]
  57. El-Fadel, M.; Bou-Zeid, E.; Chahine, W.; Alayli, B. Temporal variation of leachate quality from pre-sorted and baled municipal solid waste with high organic and moisture content. Waste Manag. 2002, 22, 269–282. [Google Scholar] [CrossRef]
  58. Jun, D.; Yong-Sheng, Z.; Mei, H.; Wei-Hong, Z. Influence of alkalinity on the stabilization of municipal solid waste in anaerobic simulated bioreactor. J. Hazard. Mater. 2009, 163, 717–722. [Google Scholar] [CrossRef] [PubMed]
  59. Gibbons, R.D.; Morris, J.W.; Prucha, C.P.; Caldwell, M.D.; Staley, B.F. Longitudinal data analysis in support of functional stability concepts for leachate management at closed municipal landfills. Waste Manag. 2014, 34, 1674–1682. [Google Scholar] [CrossRef]
  60. Kjeldsen, P.; Barlaz, M.A.; Rooker, A.P.; Baun, A.; Ledin, A.; Christensen, T.H. Present and Long-Term Composition of MSW Landfill Leachate: A Review. Crit. Rev. Environ. Sci. Technol. 2002, 32, 297–336. [Google Scholar] [CrossRef]
  61. Cossu, R.; Raga, R. Test methods for assessing the biological stability of biodegradable waste. Waste Manag. 2008, 28, 381–388. [Google Scholar] [CrossRef]
  62. Bolyard, S.C.; Reinhart, D.R. Application of landfill treatment approaches for stabilization of municipal solid waste. Waste Manag. 2016, 55, 22–30. [Google Scholar] [CrossRef] [PubMed]
  63. Berge, N.D.; Reinhart, D.R.; Dietz, J.; Townsend, T. In situ ammonia removal in bioreactor landfill leachate. Waste Manag. 2006, 26, 334–343. [Google Scholar] [CrossRef] [PubMed]
  64. Heyer, K.-U.; Hupe, K.; Stegmann, R. Methane emissions from MBT landfills. Waste Manag. 2013, 33, 1853–1860. [Google Scholar] [CrossRef]
  65. Xu, S.Y.; Karthikeyan, O.P.; Selvam, A.; Wong, J.W. Microbial community distribution and extracellular enzyme activities in leach bed reactor treating food waste: Effect of different leachate recirculation practices. Bioresour. Technol. 2014, 168, 41–48. [Google Scholar] [CrossRef]
  66. Tchobanoglous, G.; Theisen, H.; Vigil, S.A. Integrated Solid Waste Management: Engineering Principles and Management Issues; McGraw-Hill: New York, NY, USA, 1993. [Google Scholar]
  67. Capaccioni, B.; Caramiello, C.; Tatàno, F.; Viscione, A. Effects of a temporary HDPE cover on landfill gas emissions: Multiyear evaluation with the static chamber approach at an Italian landfill. Waste Manag. 2011, 31, 956–965. [Google Scholar] [CrossRef]
  68. Hrad, M.; Huber-Humer, M. Performance and completion assessment of an in-situ aerated municipal solid waste landfill—Final scientific documentation of an Austrian case study. Waste Manag. 2017, 63, 397–409. [Google Scholar] [CrossRef]
  69. U.S. EPA. Inventory of U.S. Greenhouse Gas Emissions and Sinks: 1990–2016. EPA 430-R-18-003. Washington, DC, USA, 2016. Available online: https://www.epa.gov/ghgemissions/inventory-us-greenhouse-gas-emissions-and-sinks-1990-2011 (accessed on 1 July 2021).
  70. Mahar, R.B.; Liu, J.; Li, H.; Nie, Y. Bio-Pretreatment of municipal solid waste prior to landfilling and its kinetics. Biogeochemistry 2008, 20, 319–330. [Google Scholar] [CrossRef]
  71. Council of the European Union. European Council Decision 2003/33/EC establishing criteria and procedures for the acceptance of waste at landfills pursuant to Article 16 of and Annex II to Directive 1999/31/EC. Off. J. Eur. Communities 2003, L11, 27–49. [Google Scholar]
  72. Kelly, R.J.; Shearer, B.D.; Kim, J.; Goldsmith, C.D.; Hater, G.R.; Novak, J.T. Relationships between analytical methods utilized as tools in the evaluation of landfill waste stability. Waste Manag. 2006, 26, 1349–1356. [Google Scholar] [CrossRef] [PubMed]
  73. Bilgili, M.S.; Demir, A.; Varank, G. Evaluation and modeling of biochemical methane potential (BMP) of landfilled solid waste: A pilot scale study. Bioresour. Technol. 2009, 100, 4976–4980. [Google Scholar] [CrossRef] [PubMed]
  74. Federal Government of Germany. Ordinance on Environmentally Compatible Storage of Waste from Human Settlements and on Biological Waste Treatment Facilities (AbfAblV); Federal Government of Germany: Berlin, Germany, 2001.
  75. U.S. EPA. Federal Register, 40 CFR Part 445, Subpart B: RCRA Subtitle D Non-Hazardous Waste Landfill; Landfills Point Source Category; Office of Federal Register: Washington, DC, USA, 2000.
  76. Bayard, R.; Benbelkacem, H.; Gourdon, R.; Buffière, P. Characterization of selected municipal solid waste components to estimate their biodegradability. J. Environ. Manag. 2018, 216, 4–12. [Google Scholar] [CrossRef] [PubMed]
  77. Machado, S.; Karimpour-Fard, M.; Shariatmadari, N.; Carvalho, M.; do Nascimento, J. Evaluation of the geotechnical properties of MSW in two Brazilian landfills. Waste Manag. 2010, 30, 2579–2591. [Google Scholar] [CrossRef]
  78. Berge, N.D.; Reinhart, D.R.; Batarseh, E.S. An assessment of bioreactor landfill costs and benefits. Waste Manag. 2009, 29, 1558–1567. [Google Scholar] [CrossRef]
  79. EPA/ISWA. International Best Practices Guide for Landfill Gas Energy Project; Global Methane Initiative: Washington, DC, USA, 2012. [Google Scholar]
Figure 1. Landfill simulation reactor.
Energies 15 06494 g001
Figure 2. Evolution of leachate physicochemical parameters during experiments in bioreactors.
Energies 15 06494 g002
Figure 3. Cumulative CH4 production.
Energies 15 06494 g003
Figure 4. CH4/CO2 ratio behaviour.
Energies 15 06494 g004
Figure 5. Methane production rate in bioreactors.
Energies 15 06494 g005
Figure 6. Carbon discharge in the biogas produced in bioreactors.
Energies 15 06494 g006
Figure 7. Changes in TOC content.
Energies 15 06494 g007
Table 1. Operation conditions in landfill simulation reactors.
UnitBr1Br2
Initial waste mass(kg DM)27.726.1
Initial waste volume(L)47.645.4
Initial bulk density(kg m−3)0.940.93
Temperature(°C)37.036.7
Liquid to solid ratio (L/S) a(L kg−1 DM)0.340.40
Total recirculated leachate(L)0172.5
Recirculation rate(L day−1)00.73
Operation time(days)272272
a: total amount of added water per dry waste mass. DM means dry mass.
Table 2. Calculation of biogas and methane produced in bioreactors.
Equation Description
P w = 0.61121 × e ( ( 18.678 T 234.5 ) × ( T 257.14 + T ) ) (1) a P w : water vapour pressure (kPa)
T: experiment temperature (°C)
V b i o g a s = V o × P a 101.2 × 273.2 273.2 + T e × ( 1 P w P a ) (2) V biogas : biogas volume at standard conditions (mL)
V o : measured volume (mL)
Pa: atmospheric pressure (kPa)
V CH 4 = V biogas × % CH 4 (3) V CH 4 : CH4 volume at standard conditions (mL)
%CH4: CH4 percentage in biogas (%)
V CO 2 = V biogas × % CO 2 (4) V CO 2 : CH4 volume at standard conditions (mL)
%CO2: CH4 percentage in biogas (%)
a: Buck’s equation (1981).
Table 3. Leachate emission potential in Br2 and comparison with reference studies.
Time Frame
(Days)
L/S
(L kg−1 DM)
LR
(L Day−1)
COD Emission
(mg kg−1 DM)
NTK Emission
(mg kg−1 DM)
EW Age
(Years)
VS
(%)
This research (Br2)2720.40.73694331 a513.0
[27]5312.00.042000635 a8–1712.2
[45]10501.5–1.82.2–4.5480013483.545.0
a: Estimated as 1.05 × NH4+ according to [45].
Table 4. Initial and final characterisation of EW moisture and stability indicators.
BeginningFinal Br1Statistical Test aFinal Br2Statistical Test a
Moisture (%) b38.2 (0.3)33.4 (0.12)*37.9 (0.1)*
VS (% DM)13.0 (1.0)10.1 (0.5)*8.8 (0.5)*
TOC (% DM)12.8 (0.9)12.6 (1.2)ns11.9 (0.5)ns
Cellulose (% DM)47.7 (18.6)49.4 (31.3)ns45.2 (32.0)ns
Lignin (% DM)9.8 (0.9)10.9 (4.8)ns11.9 (6.3)ns
BMP (mL CH4 g−1 DM)17.5 (1.4)2.4 (0.4)**1.0 (0.6)**
a: significance level according to the t-test for each bioreactor treatment; b: total mass. * p < 0.05, ** p < 0.01, ns: not significant p ≥ 0.05.
Table 5. Stability characteristics of EW at the end of bioreactor experiments.
ParameterUnitsObjective ValueReactor Performance
Br1Br2
Solid waste
VS(% DM)≤25 (a)AchievedAchieved
TOC(% DM)≤3 (b),(1)Not achievedNot achieved
≤5 (b),(2)Not achievedNot achieved
≤18 (c),(3)AchievedAchieved
BMP(ml CH4 g−1 DM)≤2 (a)Not achievedNot achieved
≤10 (d),(e)AchievedAchieved
(ml biogas g−1 DM)≤20 (c),(4)AchievedAchieved
Cellulose(% DM)≤1.5 (f)Not achievedNot achieved
C/L(-)≤0.2 (a),(g)Not achievedNot achieved
Leachate
COD (mg L−1)<200 (d)Not achievedNot achieved
BOD5(mg L−1)<140 (h)Not achievedAchieved
<100 (i)Not achievedAchieved
BOD/COD(-)<0.1(d),(g)Not achievedAchieved
NH4+(mg L−1)<300 (d)Not achievedAchieved
(mg L−1)<70 (j)Not achievedNot achieved
Biogas
Emission rate(L CH4 m−2 h−1)<1.0 (a)AchievedAchieved
(a) [26]; (b) [71]; (c) [74]; (d) [61]; (e) [28]; (f) [27]; (g) [14]; (h) [75]; (i) [59]; (j) [9]; (1) Inert waste; (2) Non-hazardous waste; (3) MBT waste; (4) Total biogas production in BMP test.
Publisher’s Note: MDPI stays neutral with regard to jurisdictional claims in published maps and institutional affiliations.

