Article

Forecast of Coal Demand in Shanxi Province Based on GA—LSSVM under Multiple Scenarios

School of Economics and Management, North China Electric Power University, Beijing 102206, China
*
Author to whom correspondence should be addressed.
Energies 2022, 15(17), 6475; https://doi.org/10.3390/en15176475
Submission received: 14 August 2022 / Revised: 30 August 2022 / Accepted: 2 September 2022 / Published: 5 September 2022

Abstract

:
Under the “carbon peaking and carbon neutrality” goal, Shanxi Province adjusts the power supply structure and promotes the development of a high proportion of new energy, which has a certain impact on the demand for thermal coal. Therefore, constructing a reasonable forecasting model for thermal coal demand can play a role in stabilizing coal supply and demand. This paper analyzes various factors related to coal demand, and uses Pearson coefficient to screen out six variables with strong correlation. Then, based on the scenario analysis method, combined with the “14th Five-Year Plan” of Shanxi Province, different scenarios of economic development and carbon emission reduction development are set. Finally, a multi-scenario GA–LSSVM forecasting model of thermal coal demand in Shanxi Province is constructed, and the future development trend of thermal coal demand in Shanxi Province is predicted. The results show that the demand for thermal coal is the largest in the mode of high-speed economic development and low emission reduction, and the demand for thermal coal is the lowest in the mode of low-speed economic development and strong emission reduction, which provides a scientific basis for the implementation of Shanxi Province’s thermal coal supply policy.

1. Introduction

With the proposal of the “carbon peaking and carbon neutrality” goal, the power industry has strengthened the adjustment of power supply structure, continuously increased the installed capacity of clean energy, and controlled the production and consumption of coal, so as to reduce carbon emissions from the source [1,2]. As a “big coal province”, the utilization of coal has always been the top priority in Shanxi Province. According to the 14th Five-Year Plan of Shanxi Province, in the future development of energy, Shanxi Province should take the initiative to participate in the national maritime strategy, promote the transformation of new energy, improve the development level of clean electricity, and promote the high proportion of new energy and renewable energy [3,4]. However, since thermal power is still the main source of electricity, and thermal power installed has the characteristics of a safe and stable supply, the installed capacity of thermal power will still exist in large quantities in the future [5]. As the main raw material of thermal power enterprises, coal is a key factor in the supply and demand of coal and electricity. It is of great practical value and economic significance to objectively analyze and predict the trend and level of demand for electric coal [6,7].
At present, the main prediction methods include support vector machines, neural networks, and genetic algorithms [8,9,10]. Zhao et al. [11] proposed the Quarterly Fluctuation Index (QFI) to predict the coal price caused by market fluctuation because the fractal model based on QFI has better prediction ability when the price fluctuates violently. In 2002, Yu and Zhu proposed an improved hybrid algorithm PSO–GA (particle swarm optimization–genetic algorithm) for China’s energy demand forecasting. Compared with single optimization methods such as GA, PSO, or ant colony optimization, it has higher accuracy and multiple linear regression [12]. In the same year, they also proposed a hybrid coded particle swarm optimization and radial basis function (MPSO–RBF) network model to predict China’s energy consumption by 2020 between 1980 and 2009 [13]. By using PSO-based energy demand forecasting (PSOEDF), Uenler [14] proposed an energy demand forecasting model with good accuracy. Kourentzes and Nikolaos [15] proposed a neural network (NN) method to predict intermittent time series. Crompton and Wu [16] used the Bayesian vector autoregression method to predict energy consumption in China and discussed the potential impact. Mirjat [17] developed Pakistan‘s LEAP model framework for 2015–2050 based on four supply-side scenarios of demand forecasting using the long-range energy alternative planning system (LEAP).
In terms of coal demand forecasting research, Zhu [18] considered the mobile holiday effects such as Spring Festival, Mid-Autumn Festival and Dragon Boat Festival, and constructed an improved X-12-ARIMA coal demand forecasting model suitable for China’s actual situation. Yang et al. [19] used a grey prediction model to predict the demand for electric coal in China. Muhammad Amir Raza et al. [20] established an energy demand model for Pakistan by using remote energy alternative planning (LEAP) software and provided suggestions for national electricity demand for Pakistan’s electricity demand forecast before 2030 and domestic energy resources such as coal, natural gas, and solar energy available in Pakistan’s Baluchistan. Li et al. [21] proposed a new coordinated operation strategy to optimize the commitments of hydraulic, thermal, and wind turbines, and applied the particle swarm optimization method to optimize coal costs and carbon emissions. Zhao et al. [22] proposed an LSTM–DNN deep learning model combining long short-term memory (LSTM) and deep neural network (DNN) to accurately predict monthly coal price fluctuations in different horizons.
However, there are still two problems in the past coal demand forecasting research: First, most studies directly use the coal consumption ratio and ring ratio information, without considering the impact of economic and environmental factors; there are obvious defects. Second, the calculation of the prediction method is complex, and the convergence accuracy makes it difficult to meet the demand. At the same time, the development of economic and environmental factors is no longer a single prediction of the time series, but also needs to consider the impact of relevant policies. “Scenario analysis” proposes reasonable assumptions on various possible schemes in the future according to the major changes in economy, industry, and policy. In summary, this paper structure, as shown in Figure 1, is established to solve the current problems. This paper considers the development trend of various influencing factors such as economy and environment in different scenarios, uses a genetic algorithm to optimize the LSSVM model, and constructs the electricity coal demand forecasting model based on GA–LSSVM in multiple scenarios. It predicts the development trend of electricity coal demand in Shanxi Province in the future, and proposes relevant policy suggestions for the supply of electricity coal and the development of electricity coal in Shanxi Province. The main flow chart of this paper is shown in Figure 1.

2. Predictive Model Building

This paper uses an improved method of support vector machine–least squares support vector machine (LSSVM), which can transform the quadratic programming problem of support vector machine into a linear equation and improve the speed and accuracy of support vector machine. In order to further improve the classification accuracy of the support vector machine, the genetic algorithm (GA) is used to optimize the penalty factor and kernel parameters of the least squares support vector machine. At the same time, the scenario forecasting method is used, which combines quantitative and qualitative analysis to improve the accuracy of forecasting. This paper proposes a multi-scenario-based forecasting model of thermal coal demand in Shanxi Province based on GA–LSSVM, which can better solve the forecasting problem of thermal coal demand.

2.1. Least Squares Support Vector Machine

The improved least squares support vector machine (LSSVM) model based on support vector machine (SVM) constructs the optimal decision surface by projecting the input vector into a nonlinear high-dimensional space [23,24]. The inequality operation of the standard SVM model is transformed into a linear equation system to solve the optimization problem according to the principle of structural risk minimization, which reduces the computational complexity of the model and improves the convergence accuracy of the algorithm [25,26].
Assuming that the total number of samples is N , and the sample set is T = { ( x i , y i ) } i = 1 N , the regression model of the sample is
y ( x ) = ω T φ ( x ) + b
where φ ( x ) is the training sample projected to the high-dimensional space, ω is the weighted vector, and b is the bias; for LSSVM, the optimization problem becomes
min 1 2 ω T ω + 1 2 γ i = 1 N ξ i 2
y i = ω T φ ( x i ) + b + ξ i , i = 1 , 2 , 3 , , N
where γ is the penalty factor and ξ i is the slack variable.
In order to solve the above problem, the Lagrangian function is established to obtain
L ( ω , b , ξ i , α i ) = 1 2 ω T ω + 1 2 γ i = 1 N ξ i 2 i = 1 N α i [ ω T φ ( x i ) + b + ξ i y i ]
where α i is the Lagrange multiplier. Let the derivative of each variable of the function be zero:
{ L ω = 0 ω = i = 1 N α i φ ( x i ) L b = 0 i = 1 N α i = 0 L ξ = 0 α i = γ ξ i L α = 0 ω T + b + ξ i y i = 0
Eliminating ω and ξ i then translates to the following problem:
[ 0 e n T e n Ω + γ 1 I ] [ b a ] = [ 0 y ]
Among them, Ω = φ T ( x i ) φ ( x i ) , e n = [ 1 , 1 , , 1 ] T , α = [ α 1 , α 2 , , α n ] , y = [ y 1 , y 2 , , y n ] T , the linear equations are solved: y ( x ) = i = 1 N α i K ( x i , x ) + b , where K ( x i , x ) is the kernel function, and the kernel function selected in this paper exp ( 1 2 σ 2 x x i 2 ) is the radial basis kernel function.

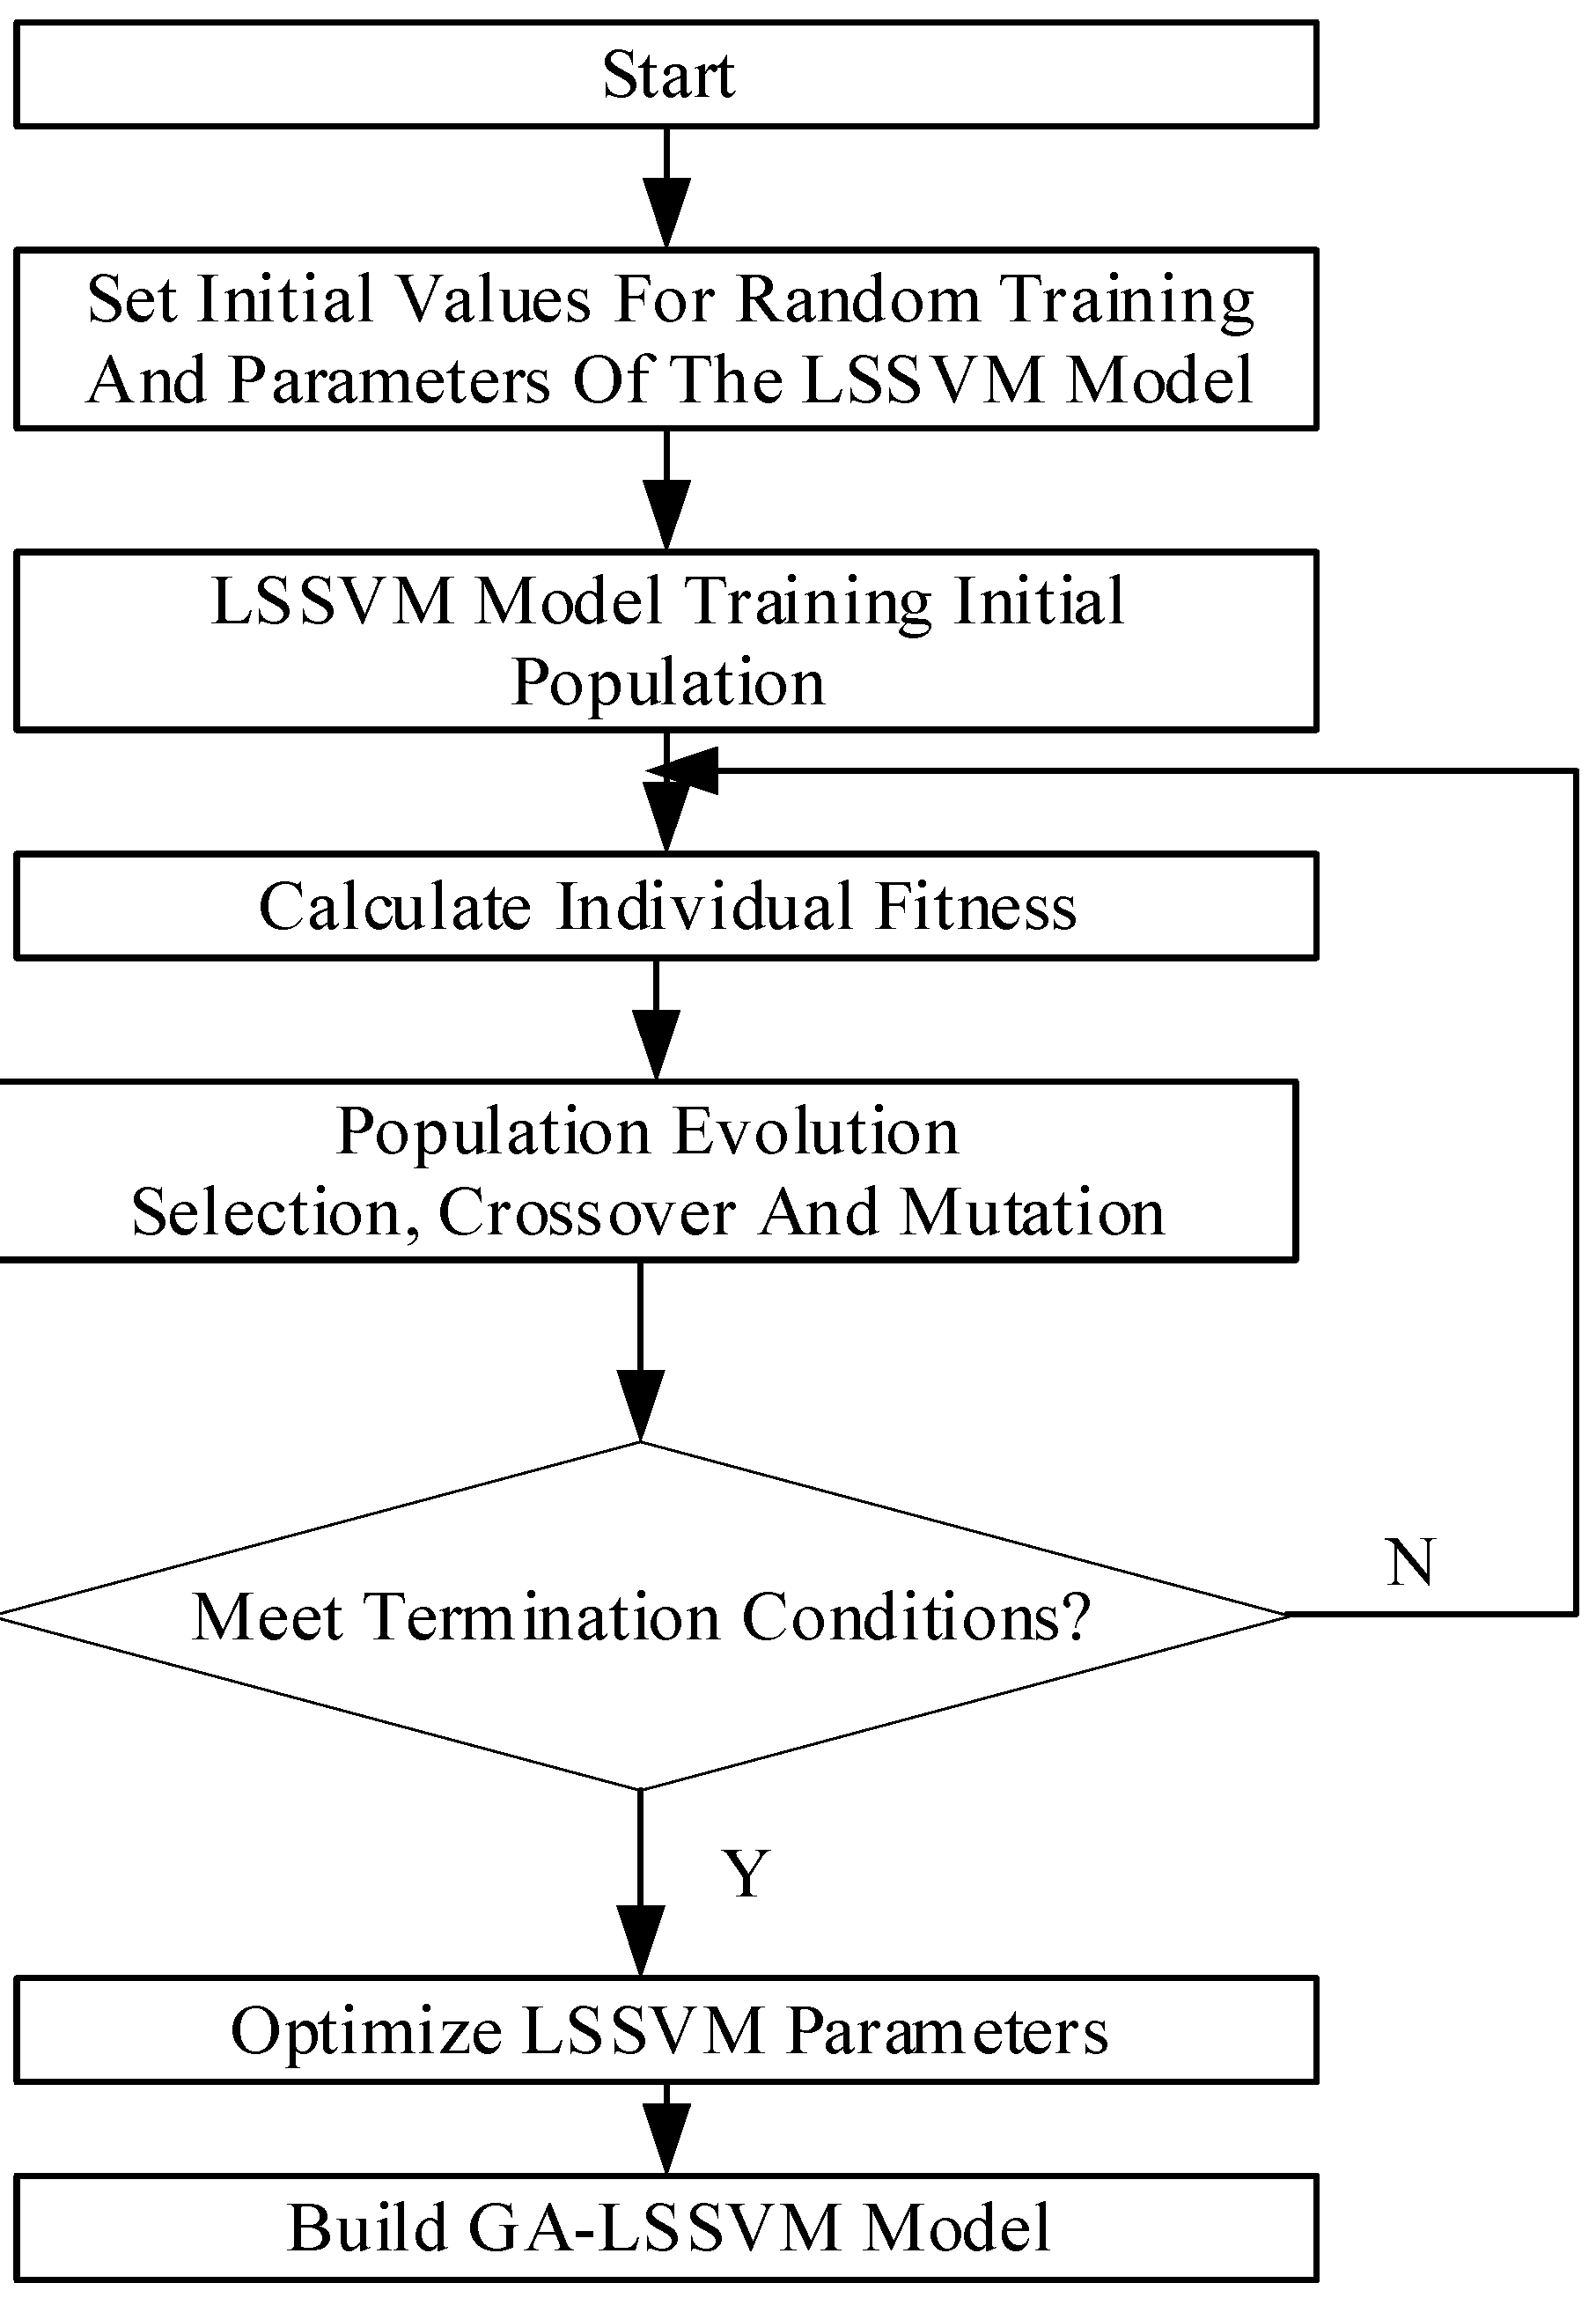
2.2. GA–LSSVM Model Construction

The main idea of a genetic algorithm (GA) is to use the solution of the problem as a “gene” by simulating the evolution of organisms [27]. According to the development characteristics of survival of the fittest, firstly the population that adapts to the environment is selected, and then through random selection, crossover, and mutation and other operations, a generation of populations that are more adaptable to the environment is finally generated. The above process is repeated continuously. After the evolution of the population and the reproduction of several generations, the population will eventually evolve into a group of individuals with the strongest adaptability, so as to obtain the optimal solutions to these problems. In this paper, the advantages of the genetic algorithm can be used to find the global optimal solution, and the parameters of the least squares support vector machine are optimized [28,29]. The specific GA–LSSVM algorithm flowchart is shown in Figure 2. The main process has the following six steps:
(1)
Set the initial values for random training and the parameters of the LSSVM model. Select training and testing samples, and set the penalty factor γ and radial basis kernel function parameters σ 2 .
(2)
The initial population is randomly generated, and the solution vector is genetically encoded. Determine the population size N , crossover probability P c , mutation probability P m , and termination evolution criterion; randomly generate individuals n as the initial population.
(3)
Calculate individual fitness. Calculate the fitness of each individual and define the fitness function:
min f ( γ , σ 2 ) = 1 ( i = 1 n ( x i x ^ i ) 2 n + 1 )
Among them, x i is the actual value of the i-th sample, and x ^ i is the predicted value of the i-th sample.
(4)
Population evolution, including the selection of mothers, crossover, mutation, and selection of progeny to generate a new generation of populations that are more adapted to the environment.
(5)
Check the termination condition. By comparing the adaptive values of each gene, the optimal fitness is obtained, and the value of the output penalty factor γ and radial basis kernel function parameter σ 2 is the optimal solution (otherwise, proceed to step 3).
(6)
Build the GA–LSSVM model [30]. Through training, the optimal parameters γ and σ 2 of LSSVM are obtained, which are brought into the LSSVM prediction model to obtain the GA–LSSVM prediction model.

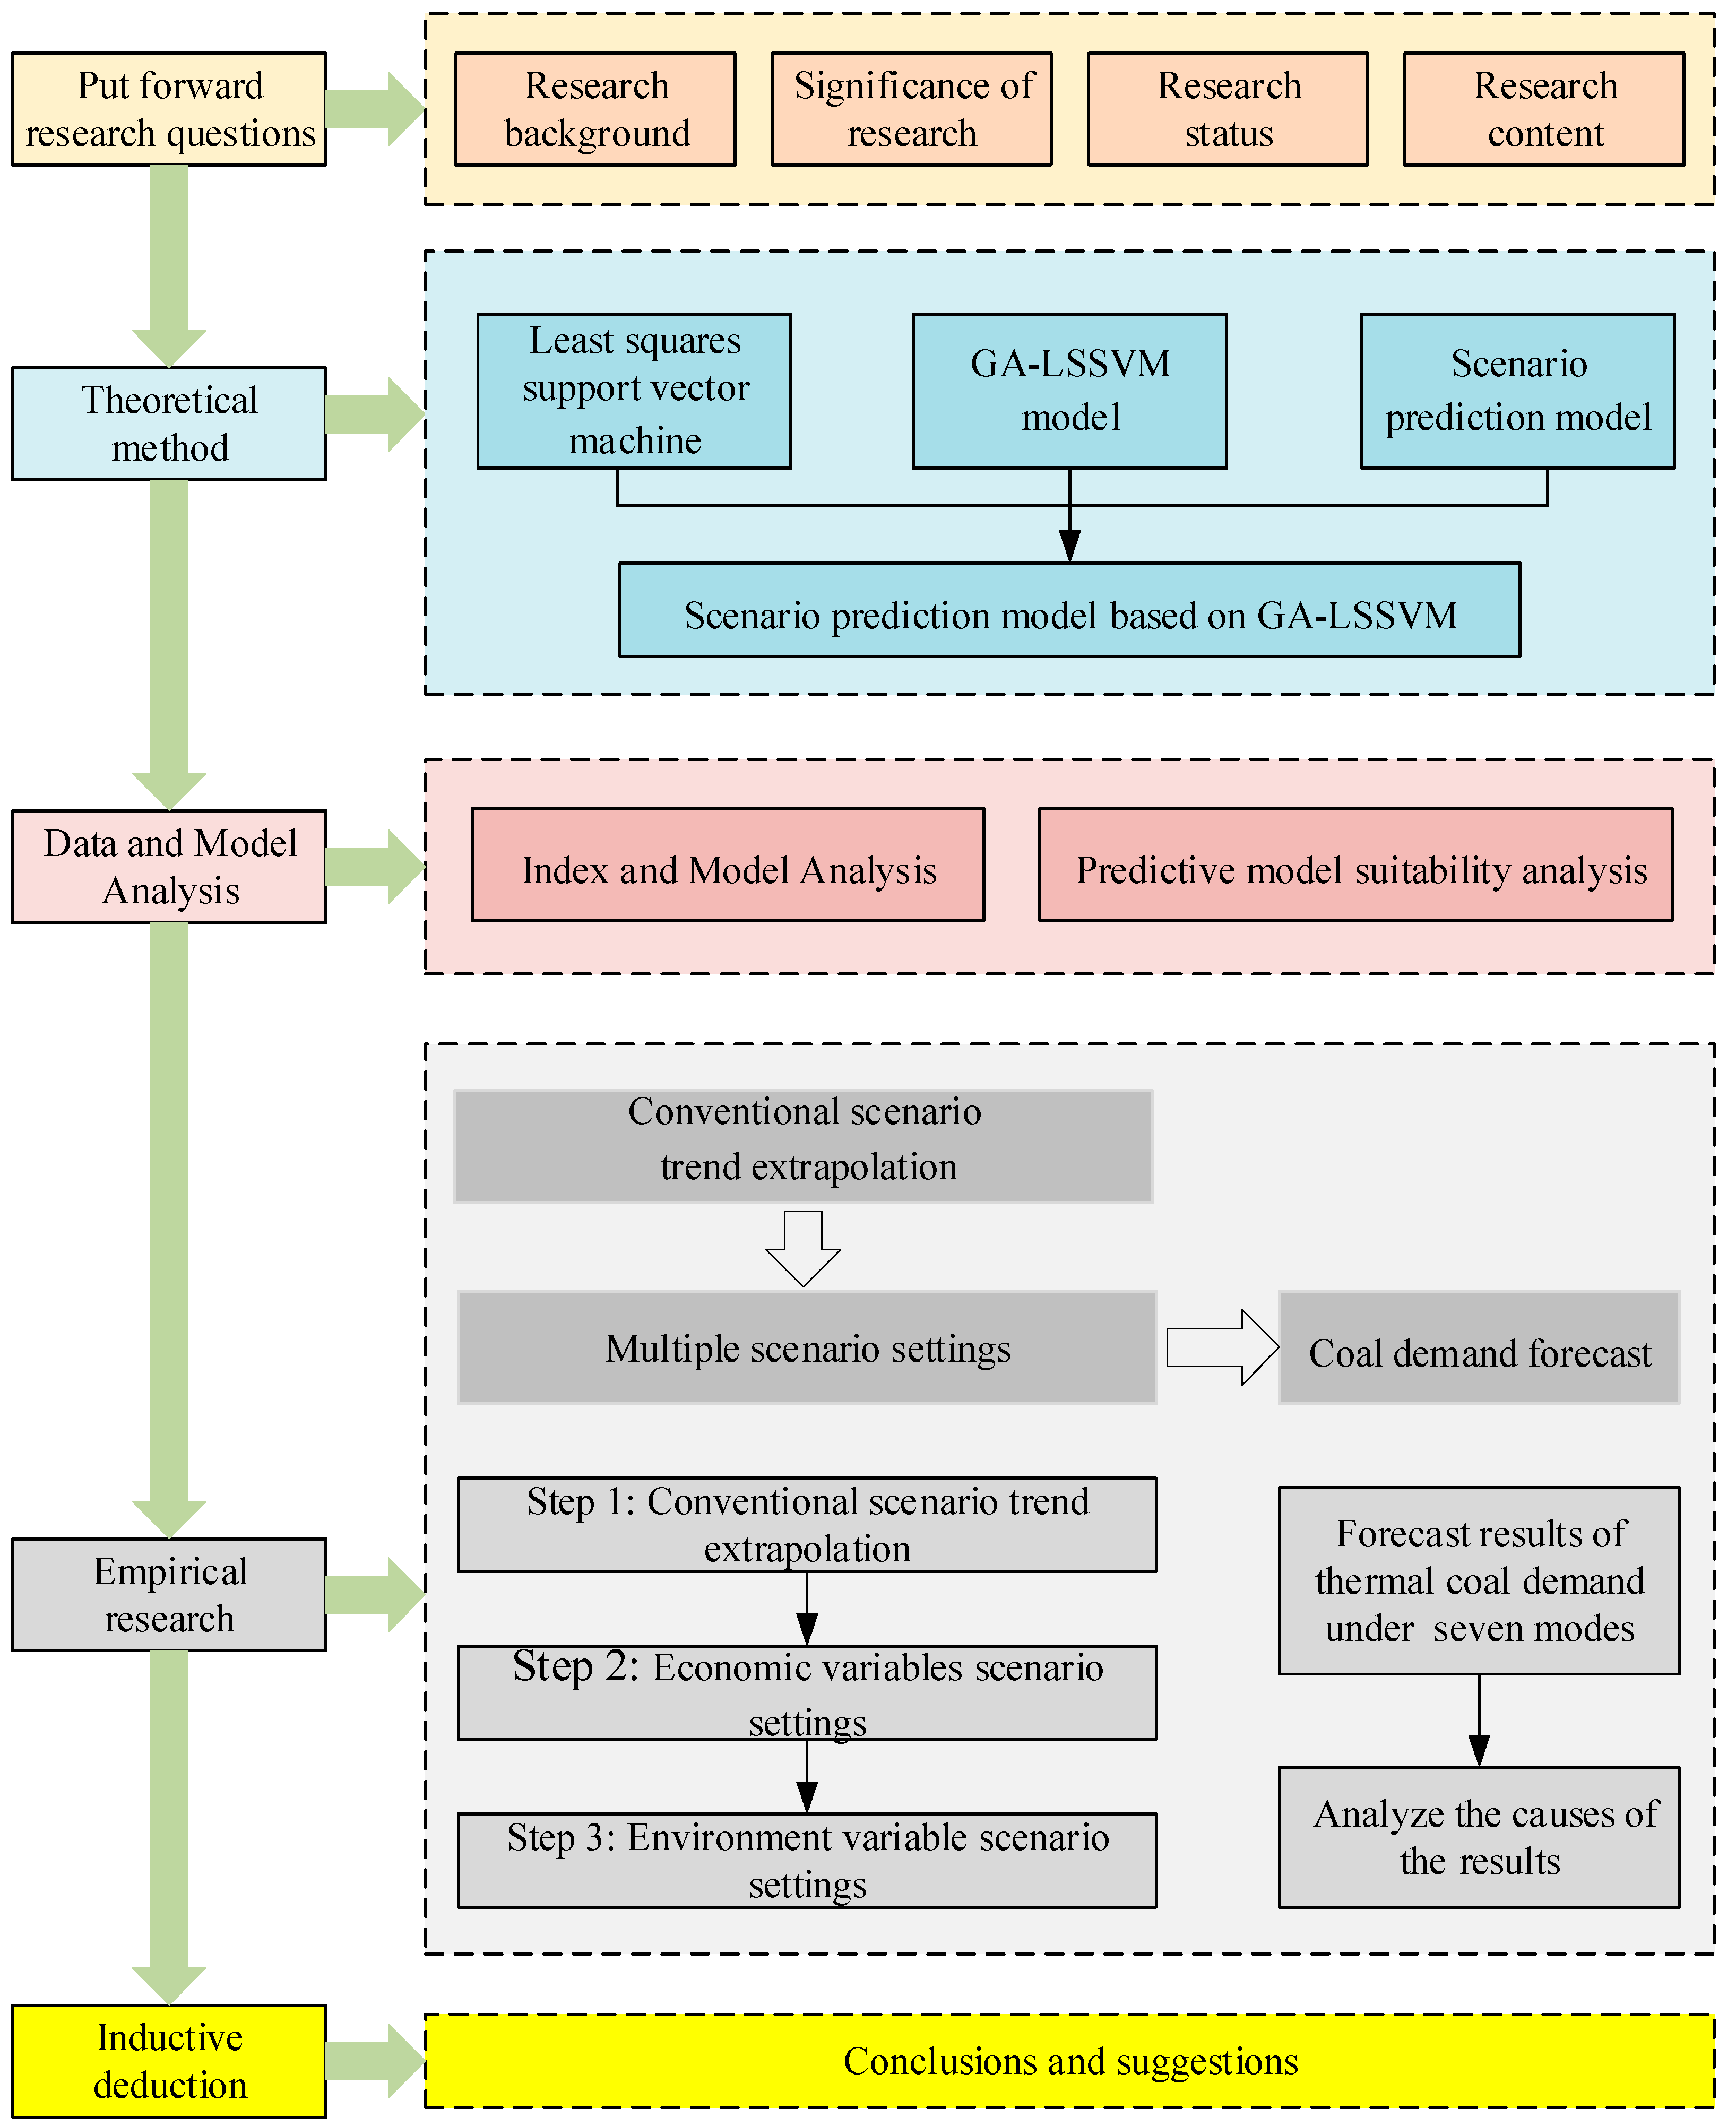
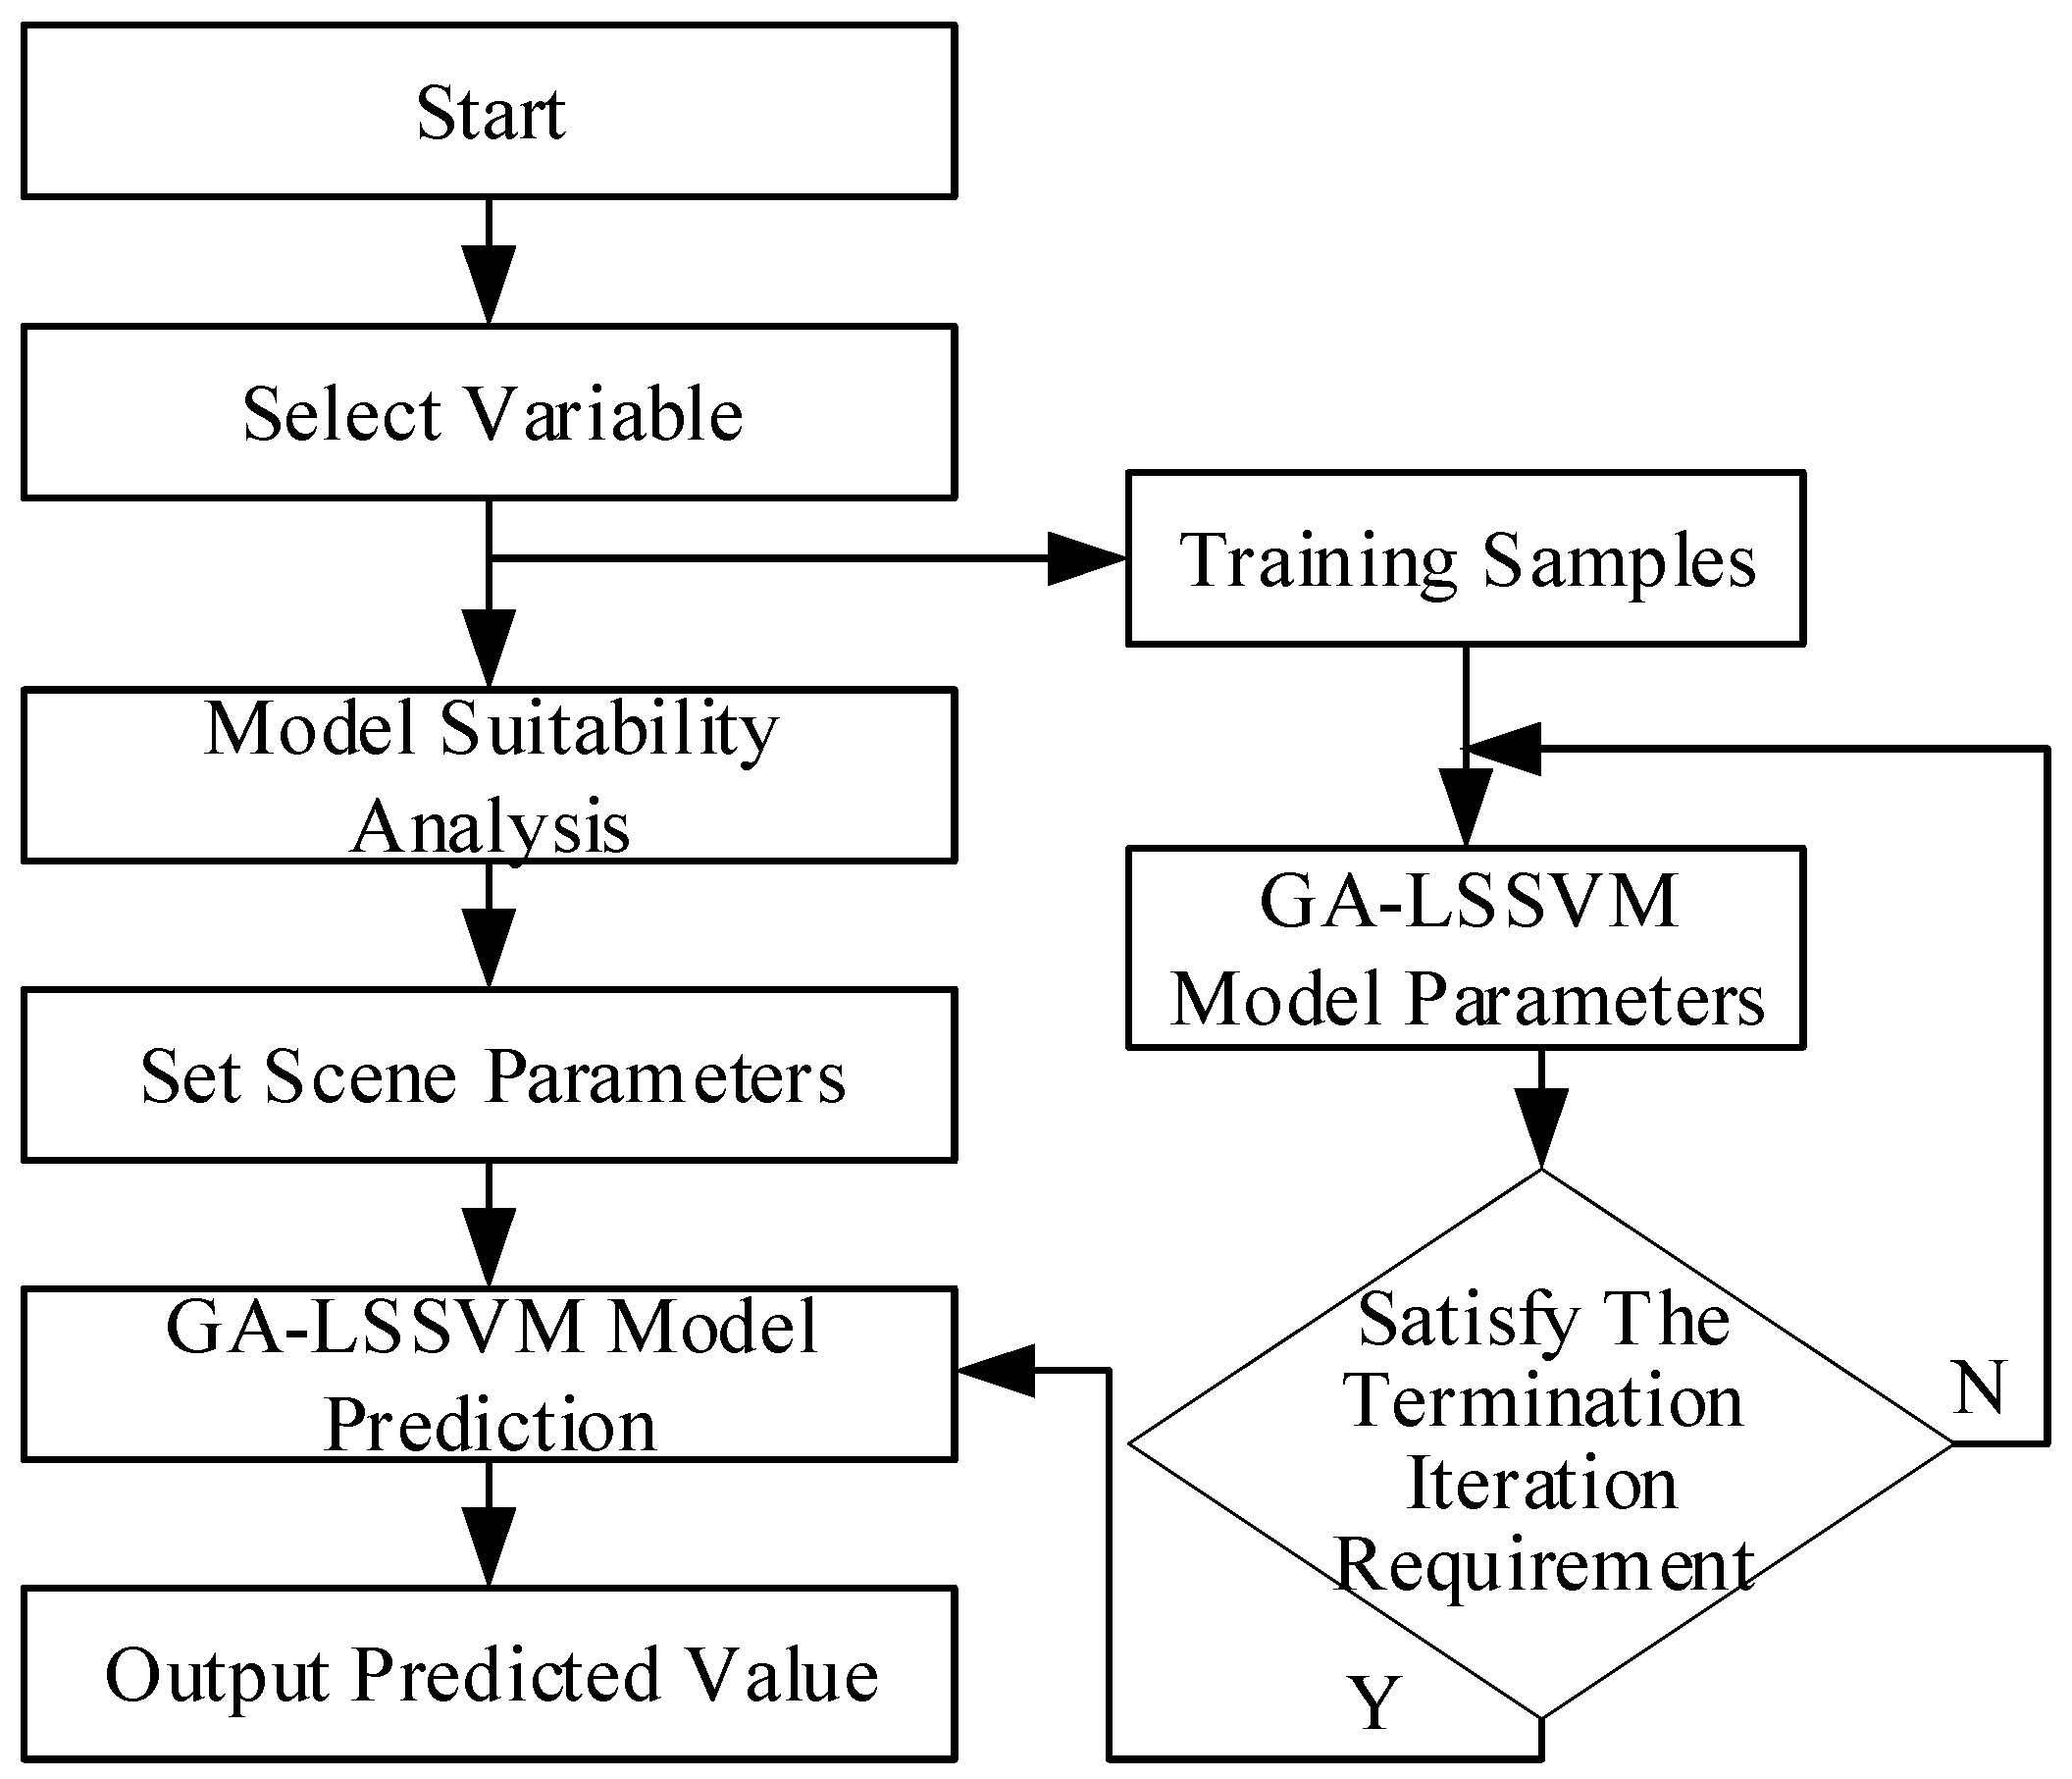
2.3. Scenario Prediction Model Based on GA–LSSVM

The scenario analysis method can imagine or estimate the future development trend of the forecast object, and is a relatively intuitive qualitative forecast method [31,32,33]. The scenario analysis method considers that the future is not a single development model, but a retrospective analysis of historical data to formulate a series of reasonable assumptions. It combines quantitative and qualitative analysis to improve the accuracy of predictions [34,35]. Therefore, this paper adopts the method of scenario analysis to forecast the demand for thermal coal in Shanxi Province.
At the same time, the forecast of demand generally needs to consider the combined effect of multiple influencing factors. In order to improve the accuracy of prediction, the model variables need to be screened. In this paper, the Pearson correlation coefficient method is used to measure the degree of correlation between variables.
The effects of random error and environmental variables are obtained, and the original data can be adjusted to obtain new values that remove the effects of environmental factors and random errors with the following formula:
η = i = 1 n ( x i x ¯ ) ( y i y ¯ ) i = 1 n ( x i x ¯ ) 2 × i = 1 n ( y i y ¯ ) 2
where x ¯ and y ¯ represent the average value of the n data, and the closer the absolute value of the correlation coefficient η is to 1, the higher the degree of correlation between the two.
Based on the above method introduction, this paper uses the scenario forecasting model based on GA–LSSVM to forecast the demand for electricity and coal in Shanxi Province. The basic flow chart is shown in Figure 3. According to the process shown in the figure, the model variables must first be selected. On the one hand, the adaptability of the model is tested and the appropriate scenario parameters are set according to the development trend of the variables; on the other hand, the samples are trained and the appropriate GA–LSSVM model parameters are input, and multiple iterations are performed until the requirements are met. Finally, the trained GA–LSSVM model is used to predict the output variables and output the predicted value.

3. Index and Model Analysis

3.1. Index Analysis

The demand for thermal coal is often linked to a variety of factors. From the perspective of economic supply and demand theory, the price of commodities is determined by both supply and demand, and the demand for thermal coal will also be affected by coal price and supply. However, at this stage, as demand factors account for the main low level of thermal coal demand, factors other than price will have a greater impact on it. In this section, coal consumption in electricity, heat production, and supply industries is used as an indicator of thermal coal demand, and the indicators are selected from two aspects of economic development and environmental protection. At the same time, the source of these data will be explained to provide guidance for subsequent research.

3.1.1. Index Selection

The demand for electricity is often inseparable from the development of the macro economy. In recent years, the scale of China’s economy has expanded rapidly. At the same time, with the continuous advancement of the urbanization process, the construction and renovation of a large number of infrastructures, the gradual large-scale accumulation of urban population, the subsequent energy demand, transportation demand, daily necessities demand, and cultural goods demand have gradually increased. The growth of these demands has directly driven the continuous increase in the demand for electricity. At present, there are five main modes of electricity production in China: thermal power generation, hydropower generation, wind power generation, photovoltaic power generation, and nuclear power generation. Although the proportion of clean energy installed capacity has increased in recent years, the production of electricity is still dominated by thermal power generation. Therefore, the growth of electricity demand is directly related to the demand for thermal coal. There are many variables that can represent macroeconomic development, such as GDP, population, urbanization ratio, electricity consumption in the whole society, and industrial structure.
With the proposal of the “dual carbon” goal, the installed capacity of clean energy has been continuously increased. China will intensify efforts to adjust the power structure, and at the same time will control the production and consumption of coal to reduce carbon emissions from the source [36,37]. However, since thermal power generation is still the main source of electricity, and thermal power installed capacity has the characteristics of safe and stable supply, thermal power installed capacity will still exist in large quantities in the future. The influencing factors of thermal coal demand related to environmental protection considered in this paper mainly include thermal power installed capacity and carbon emissions. For the calculation method of carbon emissions, according to the emission factor method provided by the Intergovernmental Panel on Climate Change (IPCC) in the “2006 IPCC Guidelines for National Greenhouse Gas Inventories”, an indirect method for measuring carbon emissions is obtained. The main formula is
C = i = 1 n E C i · M I C i · C C E i · C O F i · 44 12
Among them, C is the total amount of carbon emissions, and the unit is 10,000 tons; E C i is the consumption of the i-th energy, in tons; M I C i is the average low-level calorific value of the i-th energy, in kJ/kg; C C E i is the carbon content of the i-th energy, C O F i is the carbon oxidation factor of the i-th energy, 44 and 12 are the carbon dioxide and carbon molecular weights, respectively. The energy consumption mainly includes eight kinds of energy, including coal, coke, crude oil, gasoline, kerosene, diesel oil, fuel oil, and natural gas.
According to the above analysis of the influencing factors of thermal coal demand, using the formula of Pearson’s correlation coefficient method, we used SPSS software (IBM Corp. Released 2020. IBM SPSS Statistics for Windows, Version 27.0. Armonk, NY: IBM Corp) to analyze various factors related to thermal coal demand. Finally, six variables with strong correlation were screened out, and the results are shown in Table 1 below. It can be seen from the results that the absolute value of the correlation degree of these six variables is close to 1, the correlation is extremely strong, and the significance of each variable is less than 0.01, which is extremely significant. All variables are divided into economic variables and environmental variables. Economic variables include GDP, population, urbanization ratio, and electricity consumption in the whole society, whose changes are closely related to the level of economic development; environmental variables include thermal power installed capacity and carbon emissions.

3.1.2. Data Sources

The collected historical data on the influencing factors of thermal coal demand in Shanxi Province from 2005 to 2019 are used as the input variables of the model, and the demand for thermal coal is used as the output variable of the model. The thermal coal demand in this paper refers to the annual consumption of coal in the electricity and heat production and supply industries. All variables and data are from China Statistical Yearbook, Shanxi Statistical Yearbook, China Electricity Statistical Yearbook, China Energy Statistical Yearbook, Provincial Greenhouse Gas Inventory Compilation Guidelines, and China Industrial Statistical Yearbook. For energy coefficients, refer to the appendix of China Energy Statistical Yearbook and the data in IPCC Guidelines for National Greenhouse Gas Emissions Inventory 2006. The five variables of GDP, population size, urbanization ratio, electricity consumption of the whole society, and installed thermal power capacity, can be obtained directly from the above sources. The calculation of carbon emissions is obtained according to Equation (9), and the required relevant data can also be obtained from the above sources. If the acquired data is missing, it is supplemented by means of mean imputation.

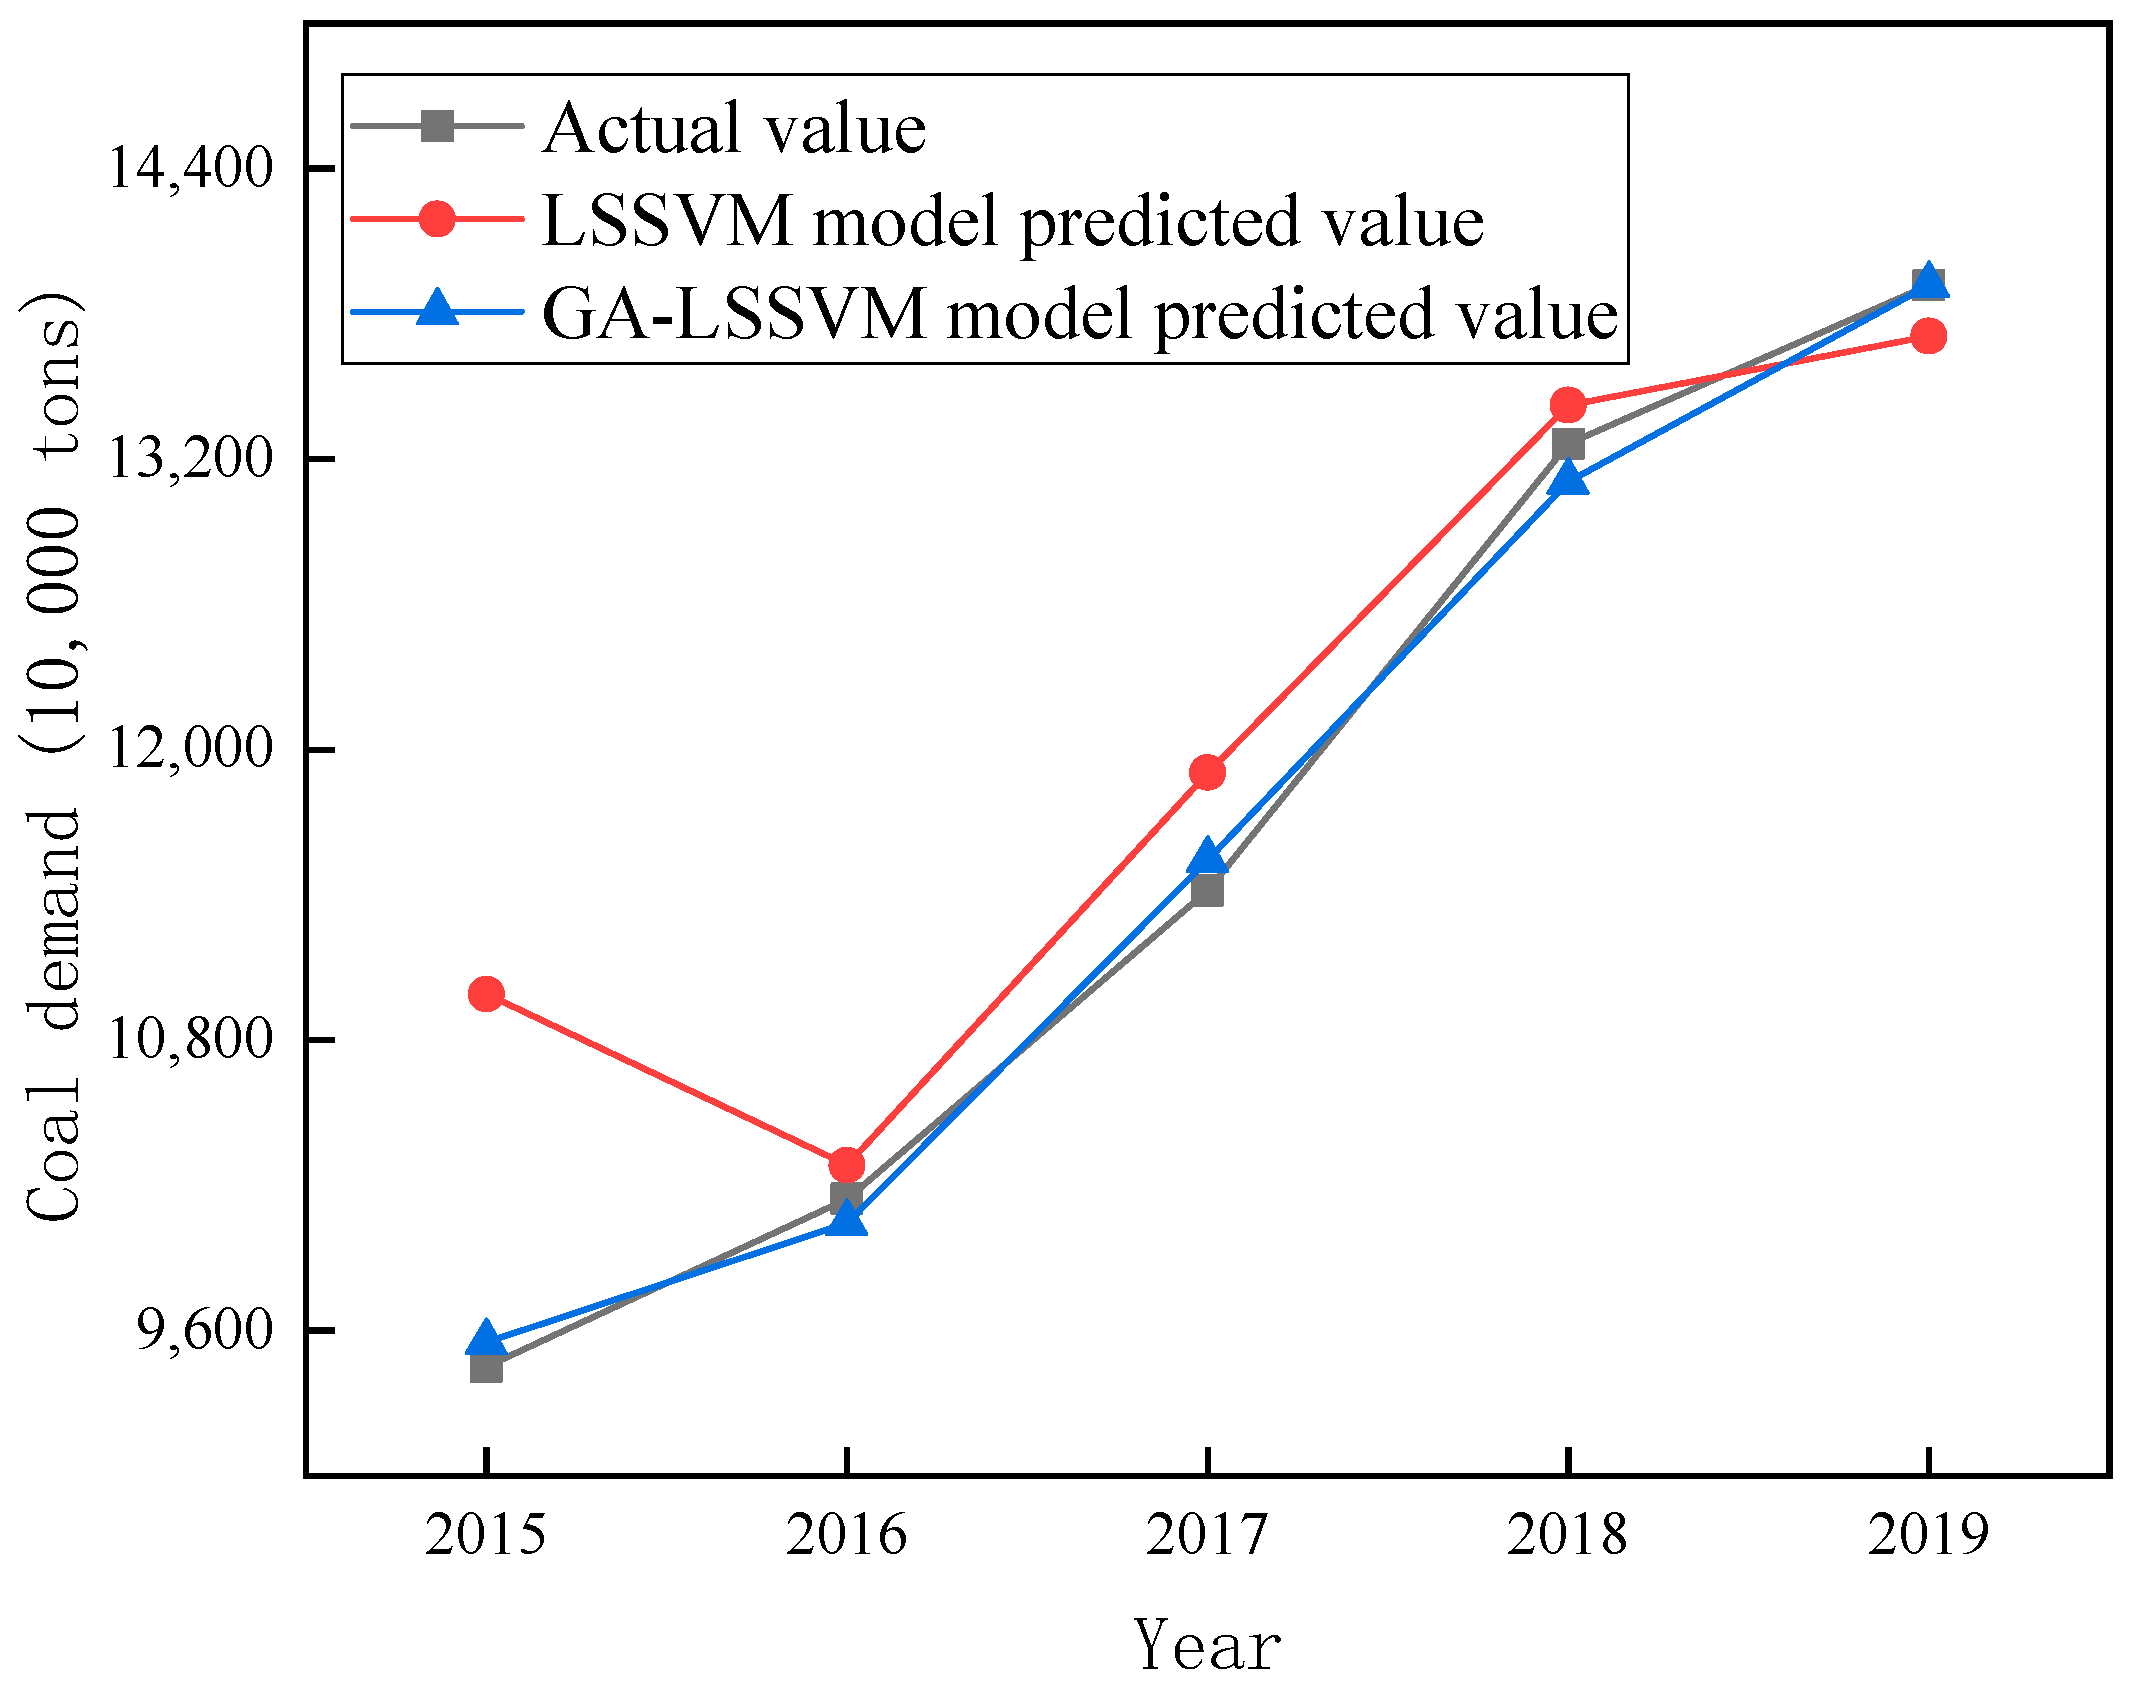
3.2. Predictive Model Suitability Analysis

The data from 2005 to 2014 is selected as the training sample of the model, and the historical data from 2015 to 2019 is used as the test set of the model to test the fitness of the model. Based on the construction of the previous GA–LSSVM model, the prediction results are shown in Figure 4, and the model error results are shown in Table 2. According to the error results from Figure 4 and Table 2, it can be seen that all errors of the LSSVM model optimized by GA optimization are smaller than the results predicted by the LSSVM model, and the average absolute percentage error is 0.87%. The predicted value is very close to the actual value, and the error is small. At the same time, the method is simple in calculation, high in convergence accuracy, has less subjective influence, and is more objective in the results obtained. Therefore, the model is suitable for forecasting the future demand for thermal coal in Shanxi Province.

4. Empirical Research

In order to predict the demand for thermal coal in Shanxi Province, the first thing to do is to sort out the changing trend of influencing factors in the future, and predict the development trend of future thermal coal demand in Shanxi Province. Afterwards, different scenarios should be set according to the changing trend of the influencing factors, and finally the predicted value will be obtained by using the model constructed above to perform scenario prediction.

4.1. Conventional Scenario Trend Extrapolation

Trend extrapolation is a method for forecasting by extrapolating the trend line of historical time series changes. According to the development law of the forecast object, a suitable curve is found to express its change trend, so as to predict future development situation.
Based on the analysis of historical data trends, using SPSS software(IBM Corp. Released 2020. IBM SPSS Statistics for Windows, Version 27.0. Armonk, NY, USA: IBM Corp.), a quadratic function curve fitting was performed on each input variable. The parameter estimation of the fitting function is shown in Table 3. It can be seen from Table 3 that the goodness of fit of the fitting curve of each factor influencing coal demand is close to 1, and the fitting effect is significant.
The predicted values of the factors affecting the demand for thermal coal from 2020 to 2030 were calculated, and the predicted results are shown in Figure 5 below. As can be seen from Figure 5, GDP, urbanization ratio, electricity consumption of the whole society, and carbon emissions show an upward trend year by year. Population and thermal power installed capacity showed a trend of first rising and then falling. On average, the population experienced negative growth, while other influencing factors maintained positive growth.

4.2. Multiple Scenario Settings

According to the 14th Five-Year Plan of Shanxi Province, considering the changes in economic development level and the development of the thermal power industry under the “dual carbon” goal, different economic development scenarios and carbon emission reduction scenarios are set. Economic variables set economic development scenarios, which are divided into high economic growth mode, normal economic growth mode, and low economic growth mode. With the proposal of the “dual carbon” goal, carbon emission reduction is imperative in Shanxi Province. Therefore, environmental variables set carbon emission reduction scenarios, which are divided into strong emission reduction models and low emission reduction models.

4.2.1. Economic Variables

According to the requirements of the long-term goals, Shanxi Province should continue to promote high-quality development and deepen the supply-side structural reform. In the next 15 years, the total economic volume should reach the level of the middle reaches of the country, speed up the introduction of talents, improve the problem of population decline, improve the new urbanization strategy, and improve the quality of urbanization development. The results of calculating its annual growth rate are shown in Table 4 below. According to the average growth rate under the conventional scenario, the average growth rate of GDP is 2.68%, which is slightly higher than the growth rate of population, urbanization ratio, and electricity consumption of the whole society, which are −0.13%, 1.85%, and 1.76% respectively. The basic level of GDP growth rate is about 2%, and the basic level of growth rate of population, urbanization ratio, and electricity consumption of the whole society is about 1%. Therefore, this paper sets the GDP, population, urbanization ratio, and the growth rate of electricity consumption in the whole society to float by about 2%, 1%, 1%, and 1%, respectively, on the basis of the conventional scenario growth model.

4.2.2. Environment Variables

Since coal prices fell, Shanxi Province proposed the deep integration of “coal–electricity integration”. With the formulation of the “dual carbon” goal, the state’s policies on energy conservation and emission reduction have been continuously introduced, and the demand for coal for power generation has also been greatly affected. The results of calculating its annual growth rate are shown in Table 5. According to the average growth rate of thermal power installed capacity and carbon emission growth rate under the conventional scenario, the values are both 1.26%. According to the impact of the growth rate change on the forecast of thermal coal demand, the strong emission reduction mode is set as thermal power installed capacity and the growth rate of carbon emissions is reduced by 5% and 10%, respectively, based on the conventional development model, and the low emission reduction mode is set as thermal power installed capacity and carbon emissions growth rates are reduced by 3% and 5%, respectively, based on the conventional development model.

4.3. Coal Demand Forecast

According to the forecast model of thermal coal demand constructed above and the setting of economic variables and environmental variables in different scenarios, this paper uses MATLAB software to screen and process the collected data of influencing factors, and analyzes the demand for thermal coal in Shanxi Province from 2020 to 2030. The specific results are shown in Figure 6. According to Figure 6, it can be seen that the demand for thermal coal in Shanxi Province shows a trend of increasing first and then decreasing under the seven modes. On the whole, under the mode of high-speed economic development and low emission reduction, Shanxi Province has the largest demand for thermal coal, which can reach 166.4952 million tons in 2030; under the mode of low-speed economic development and strong emission reduction, Shanxi Province has the smallest demand for thermal coal, which can reach 135.724 million tons in 2030. Economic development is positively correlated with thermal coal demand, and carbon emission reduction efforts are negatively correlated with thermal coal demand. That is, when the intensity of carbon emission reduction is the same, the faster the economic development speed and the greater the demand for thermal coal; when the level of economic development is the same, the stronger the intensity of carbon emission reduction, and the lower the demand for thermal coal. It can be seen that the rapid economic development will increase the demand for thermal coal, and the accelerated promotion of carbon emission reduction measures will help reduce the demand for thermal coal. A lower level is conducive to maintaining the balance of coal supply and demand and the realization of the “dual carbon” goal.

5. Conclusions and Suggestions

5.1. Conclusions

This paper considers the development trend of various influencing factors, such as economy and environment, under different scenarios, and builds a multi-scenario-based thermal coal demand forecast model based on GA–LSSVM to predict the future development trend of thermal coal demand in Shanxi Province. This paper draws the following conclusions.
(1)
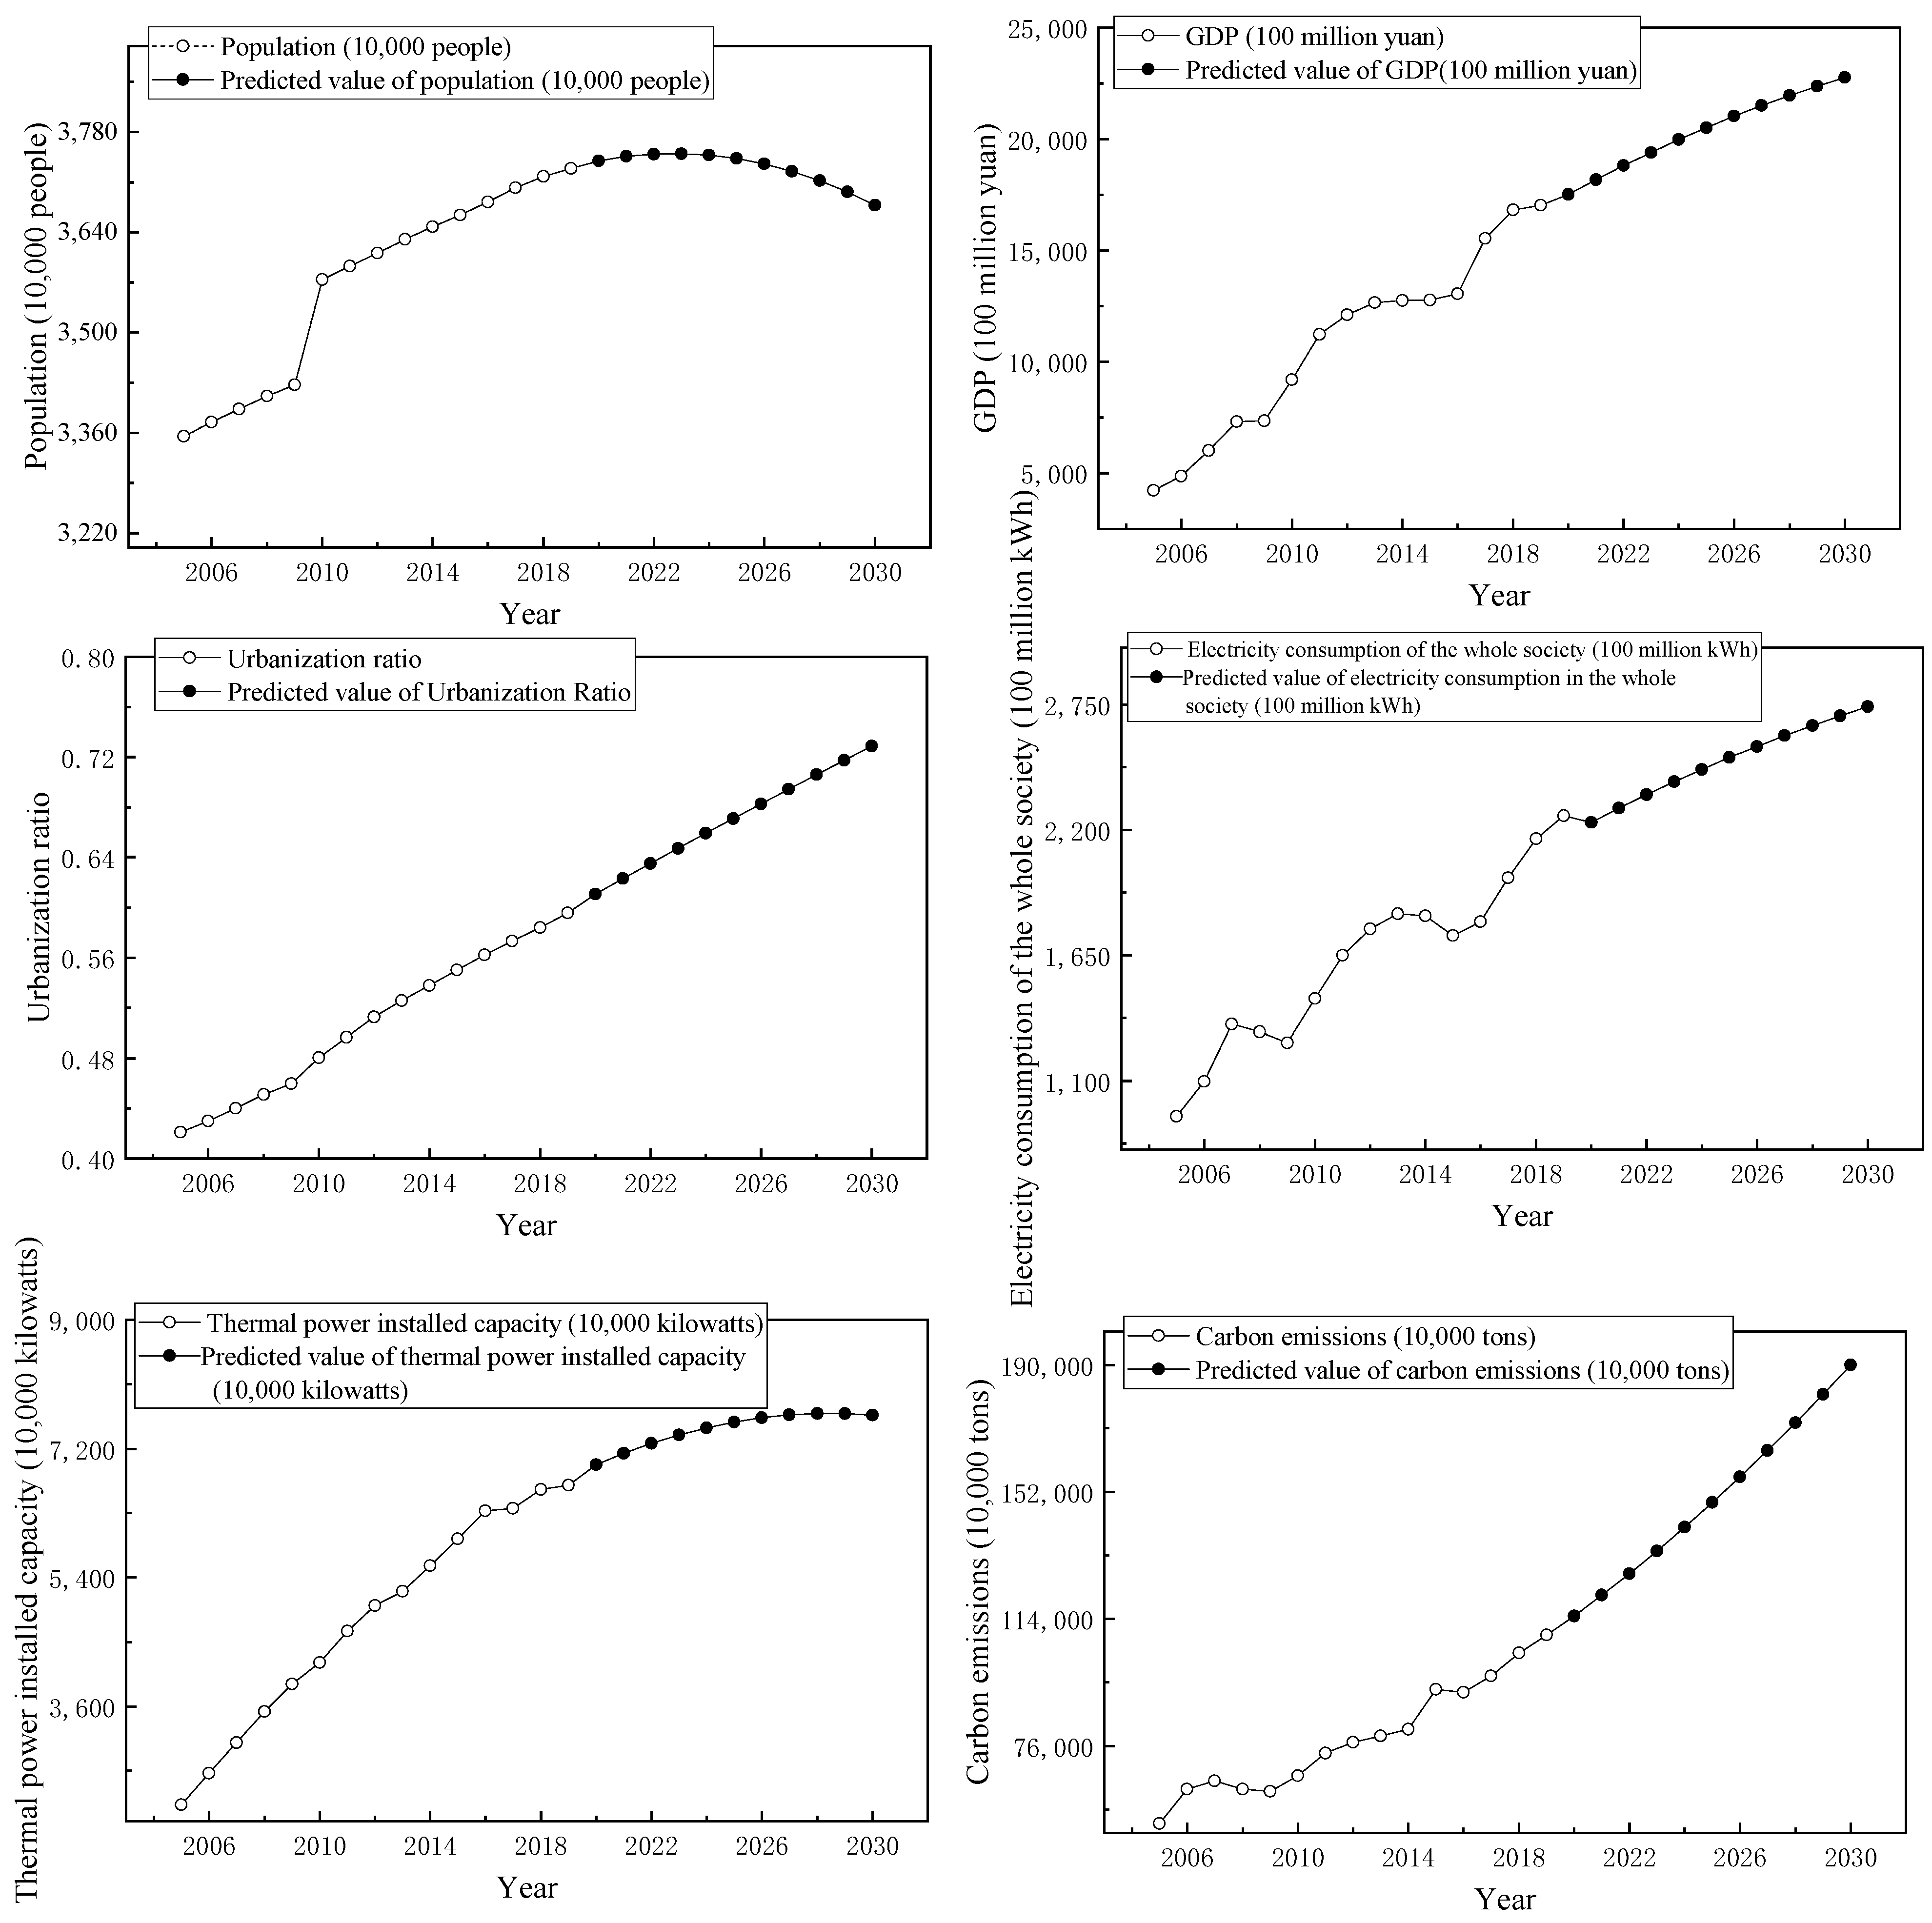
Six factors, such as GDP, population, urbanization ratio, electricity consumption in the whole society, thermal power installed capacity, and carbon emissions, have a strong correlation with the demand for thermal coal, among which GDP, population, urbanization ratio, and the electricity consumption of the whole society are economic-related variables, and the installed thermal power capacity and carbon emissions are environmental-related variables.
(2)
After analyzing the constructed GA–LSSVM thermal coal demand prediction model, it is found that the error of the modified model is small, and the calculation simple, giving high convergence accuracy, less subjective impact, and objective results; the algorithm has superiority in predicting thermal coal demand.
(3)
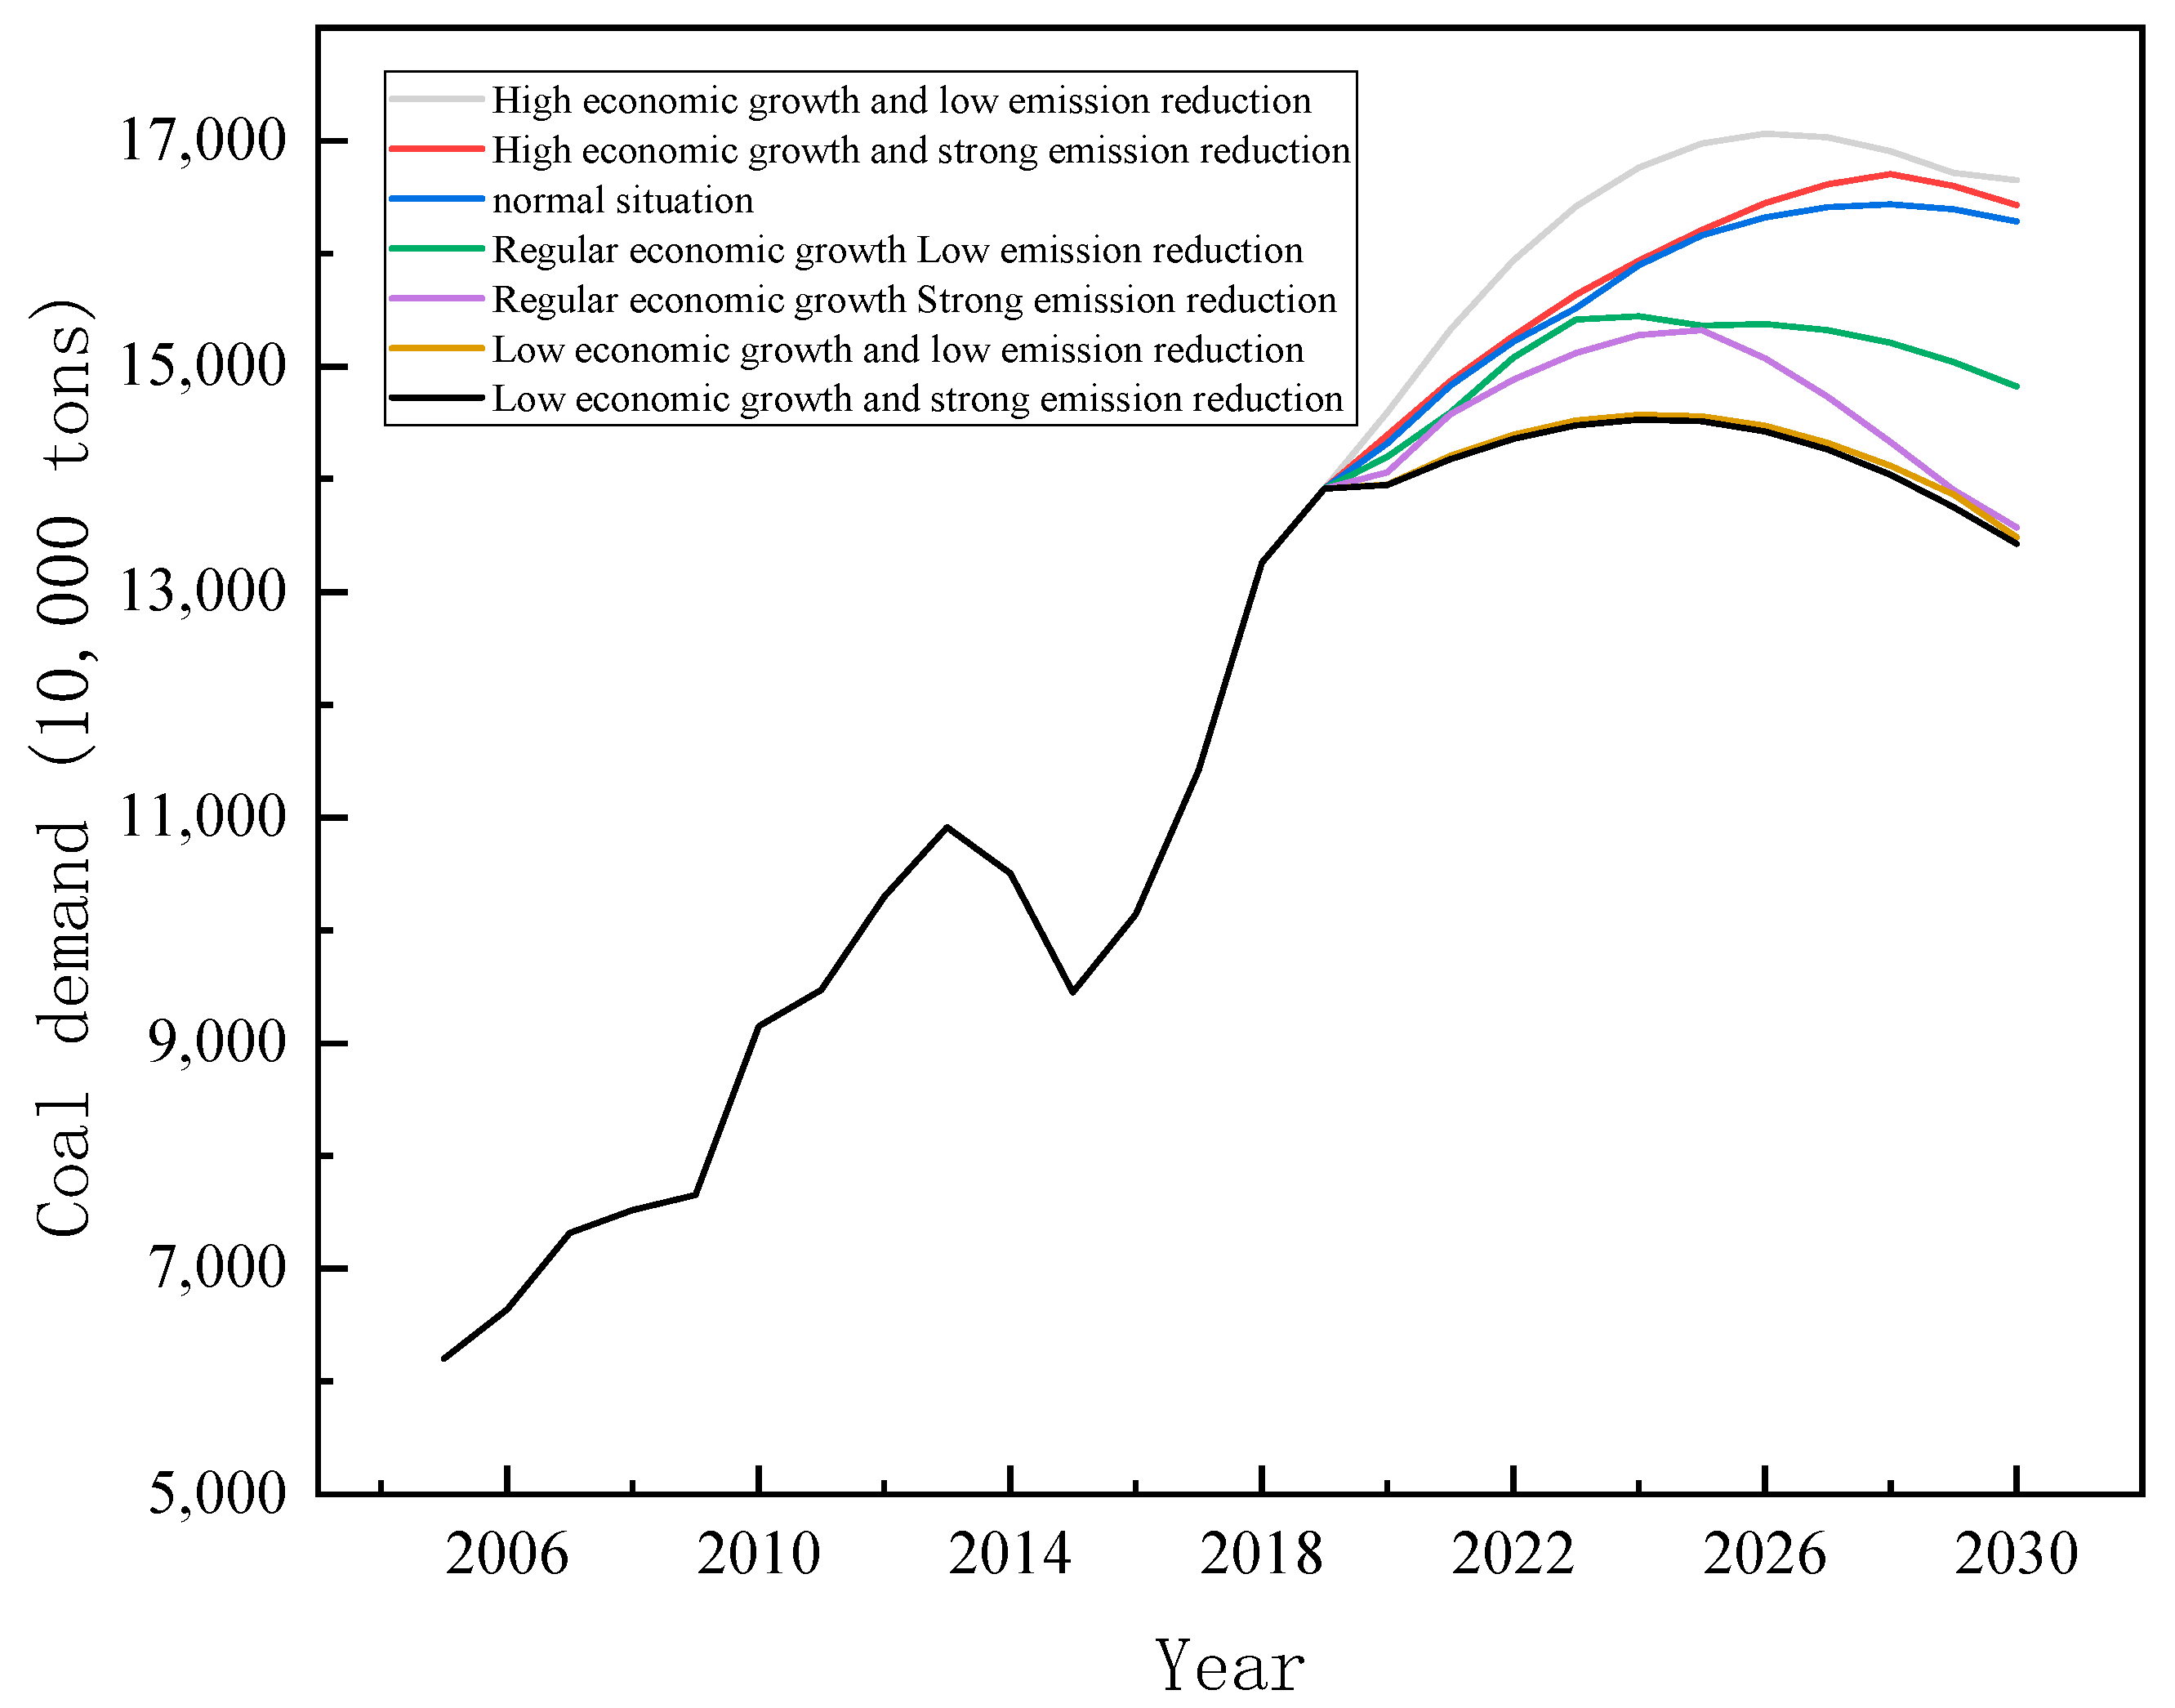
The thermal coal demand in Shanxi Province shows a trend of increasing first and then decreasing. Under the mode of high-speed economic development and low emission reduction, Shanxi Province has the largest demand for thermal coal, and under the mode of low-speed economic development and strong emission reduction, Shanxi Province has the lowest demand for thermal coal. Economic development is positively correlated with the demand for thermal coal, and carbon emission reduction efforts are negatively correlated with the demand for thermal coal. The combined effect of restrictions on the scale of economic development and the implementation of carbon emission reduction measures will keep the demand for thermal coal at a low level.

5.2. Suggestions

In view of the influencing factors of coal demand forecast proposed in this paper and the construction of related models, combined with the specific situation of Shanxi Province, this paper proposes the following policy suggestions:
(1)
Coordinate economic and low-carbon development. At the same time of rapid economic development, we must adhere to the concept of green and low-carbon development, reasonably encourage the development of environmental protection and green industries, optimize the industrial structure and high-polluting industrial structure, improve the efficiency of coal use, and increase the role of low-emission industries in the national economy proportion.
(2)
Promote upgrading and transformation and accelerate the transformation of coal-fired power. As a national energy and heavy chemical industry base, Shanxi Province has made great contributions to the development of the country. Shanxi Province should promote the standardization of green coal mining, and further enhance the support and guarantee capacity of coal. At the same time, it is necessary to vigorously promote the implementation of measures such as energy-saving and carbon reduction transformation, flexibility transformation, and heating transformation of coal-fired power units.
(3)
Optimize the power generation structure and promote the utilization of clean energy. Under the “dual carbon goals”, Shanxi Province should adhere to the concept of green development, optimize and adjust the energy consumption structure of power generation, and promote the green and efficient development and utilization of non-renewable energy. At the same time, it is necessary to flexibly use the power market mechanism, further play the coordinating role of the carbon trading market, promote the use of renewable and clean energy, insist on the substitution of electric energy, and make energy consumption more diversified.

Author Contributions

Conceptualization, Y.L. and D.N.; methodology, R.D.; software, Y.L.; validation, Y.L. and D.N.; formal analysis, R.D.; investigation, Y.L.; resources, Y.L.; data curation, R.D.; writing—original draft preparation, Y.L.; writing—review and editing, R.D.; visualization, D.N.; supervision, D.N.; project administration, Y.L.; funding acquisition, D.N. All authors have read and agreed to the published version of the manuscript.

Funding

This research was funded by the 2018 Key Projects of Philosophy and Social Sciences Research, Ministry of Education, China (18JZD032).

Institutional Review Board Statement

Not applicable.

Informed Consent Statement

Informed consent was obtained from all subjects involved in the study.

Data Availability Statement

All data, models, or code that support the findings of this study are available from the corresponding author upon reasonable request.

Acknowledgments

The authors would like to thank the editor and anonymous reviewers for their valuable comments.

Conflicts of Interest

The authors declare no conflict of interest.

References

  1. Huo, T.; Cao, R.; Du, H.; Zhang, J.; Liu, B. Nonlinear influence of urbanization on China’s urban residential building carbon emissions: New evidence from panel threshold model. Sci. Total Environ. 2021, 772, 145058. [Google Scholar] [CrossRef] [PubMed]
  2. Mengshu, S.; Yuansheng, H.; Xiaofeng, X.; Dunnan, L. China’s coal consumption forecasting using adaptive differential evolution algorithm and support vector machine. Resour. Policy 2021, 74, 102287. [Google Scholar] [CrossRef]
  3. Hao, Y.; Zhang, Z.-Y.; Liao, H.; Wei, Y.-M. China’s farewell to coal: A forecast of coal consumption through 2020. Energy Policy 2015, 86, 444–455. [Google Scholar] [CrossRef]
  4. Yan, W.; Jingwen, L. China’s Present Situation of Coal Consumption and Future Coal Demand Forecast. China Popul. Resour. Environ. 2008, 18, 152–155. [Google Scholar] [CrossRef]
  5. Wang, J.; Dong, Y.; Wu, J.; Mu, R.; Jiang, H. Coal production forecast and low carbon policies in China. Energy Policy 2011, 39, 5970–5979. [Google Scholar] [CrossRef]
  6. Li, Y.; Li, Z. Forecasting of Coal Demand in China Based on Support Vector Machine Optimized by the Improved Gravitational Search Algorithm. Energies 2019, 12, 2249. [Google Scholar] [CrossRef]
  7. Wang, B.; Wang, L.M.; Zhong, S.; Xiang, N.; Qu, Q.S. Low-Carbon Transformation of Electric System against Power Shortage in China: Policy Optimization. Energies 2022, 15, 1574. [Google Scholar] [CrossRef]
  8. Chen, H.; Wang, J.; Tang, B.; Xiao, K.; Li, J. An integrated approach to planetary gearbox fault diagnosis using deep belief networks. Meas. Sci. Technol. 2017, 28, 025010. [Google Scholar] [CrossRef]
  9. Felling, T. Development of a genetic algorithm and its application to a bi-level problem of system cost optimal electricity price zone configurations. Energy Econ. 2021, 101, 105422. [Google Scholar] [CrossRef]
  10. Teng, M.; Burke, P.J.; Liao, H. The demand for coal among China’s rural households: Estimates of price and income elasticities. Energy Econ. 2019, 80, 928–936. [Google Scholar] [CrossRef]
  11. Zhao, Z.-Y.; Zhu, J.; Xia, B. Multi-fractal fluctuation features of thermal power coal price in China. Energy 2016, 117, 10–18. [Google Scholar] [CrossRef]
  12. Yu, S.W.; Zhu, K.J. A hybrid procedure for energy demand forecasting in China. Energy 2012, 37, 396–404. [Google Scholar] [CrossRef]
  13. Yu, S.; Wei, Y.M.; Wang, K. China’s primary energy demands in 2020: Predictions from an MPSO-RBF estimation model. Energy Convers. Manag. 2012, 61, 59–66. [Google Scholar] [CrossRef]
  14. Uenler, A. Improvement of energy demand forecasts using swarm intelligence: The case of Turkey with projections to 2025. Energy Policy 2008, 36, 1937–1944. [Google Scholar] [CrossRef]
  15. Kourentzes, N. Intermittent demand forecasts with neural networks. Int. J. Prod. Econ. 2013, 143, 198–206. [Google Scholar] [CrossRef]
  16. Crompton, P.; Wu, Y. Energy consumption in China: Past trends and future directions. Energy Econ. 2005, 27, 195–208. [Google Scholar] [CrossRef]
  17. Mirjat, N.H.; Uqaili, M.A.; Harijan, K.; Walasai, G.D.; Mondal, M.; Sahin, H. Long-Term Electricity Demand Forecast and Supply Side Scenarios for Pakistan (2015-2050): A LEAP Model Application for Policy Analysis. Energy 2018, 165, 512–526. [Google Scholar] [CrossRef]
  18. Fayin, Z. Thermal Coal Demand Forecasting Model and Empirical Research Based on Improved X-12-ARIMA. Electr. Power 2014, 47, 140–145. [Google Scholar]
  19. He, Y.; Jinping, L.; Rui, N. Research on Necessity and Feasibility for Emergency Reserve of Electric Coal in China. Econ. Probl. 2012, 2, 66–69. [Google Scholar]
  20. Mar, A.; Klk, A.; Ai, B.; Miuh, B.; Ma, B.; Kr, C.; Ass, D. Energy demand and production forecasting in Pakistan. Energy Strategy Rev. 2022, 39, 100788. [Google Scholar]
  21. Li, H.; Zhang, R.; Mahmud, M.A.; Hredzak, B. A novel coordinated optimization strategy for high utilization of renewable energy sources and reduction of coal costs and emissions in hybrid hydro-thermal-wind power systems. Appl. Energy 2022, 320, 119019. [Google Scholar] [CrossRef]
  22. Alameer, Z.; Fathalla, A.; Li, K.; Ye, H.; Jianhua, Z. Multistep-ahead forecasting of coal prices using a hybrid deep learning model. Resour. Policy 2020, 65, 101588. [Google Scholar] [CrossRef]
  23. Bao-De, L.; Xin-Yang, Z.; Mei, Z.; Hui, L.; Guang-Qian, L. Improved genetic algorithm-based research on optimization of least square support vector machines: An application of load forecasting. Soft Comput. 2021, 25, 11997–12005. [Google Scholar] [CrossRef]
  24. Kalteh, A.M. Improving Forecasting Accuracy of Streamflow Time Series Using Least Squares Support Vector Machine Coupled with Data-Preprocessing Techniques. Water Resour. Manag. 2016, 30, 747–766. [Google Scholar] [CrossRef]
  25. Kaytez, F.; Taplamacioglu, M.C.; Cam, E.; Hardalac, F. Forecasting electricity consumption: A comparison of regression analysis, neural networks and least squares support vector machines. Int. J. Electr. Power Energy Syst. 2015, 67, 431–438. [Google Scholar] [CrossRef]
  26. Jung, H.C.; Kim, J.S.; Heo, H. Prediction of building energy consumption using an improved real coded genetic algorithm based least squares support vector machine approach. Energy Build. 2015, 90, 76–84. [Google Scholar] [CrossRef]
  27. Lee, C.-W.; Lin, B.-Y. Applications of the Chaotic Quantum Genetic Algorithm with Support Vector Regression in Load Forecasting. Energies 2017, 10, 1832. [Google Scholar] [CrossRef]
  28. Pan, X.; Xing, Z.; Tian, C.; Wang, H.; Liu, H. A method based on GA-LSSVM for COP prediction and load regulation in the water chiller system. Energy Build. 2021, 230, 110604. [Google Scholar] [CrossRef]
  29. Wang, J.; Hu, J. A robust combination approach for short-term wind speed forecasting and analysis—Combination of the ARIMA (Autoregressive Integrated Moving Average), ELM (Extreme Learning Machine), SVM (Support Vector Machine) and LSSVM (Least Square SVM) forecasts using a GPR (Gaussian Process Regression) model. Energy 2015, 93, 41–56. [Google Scholar]
  30. Pai, P.F.; Hong, W.C. Forecasting regional electricity load based on recurrent support vector machines with genetic algorithms. Electr. Power Syst. Res. 2005, 74, 417–425. [Google Scholar] [CrossRef]
  31. Kante, M.; Li, Y.; Deng, S. Scenarios Analysis on Electric Power Planning Based on Multi-Scale Forecast: A Case Study of Taoussa, Mali from 2020 to 2035. Energies 2021, 14, 8515. [Google Scholar] [CrossRef]
  32. Li, H.; Ren, Z.; Fan, M.; Li, W.; Xu, Y.; Jiang, Y.; Xia, W. A review of scenario analysis methods in planning and operation of modern power systems: Methodologies, applications, and challenges. Electr. Power Syst. Res. 2022, 205, 107722. [Google Scholar] [CrossRef]
  33. Wang, X.; Liu, X.; Jian, S.; Peng, X.; Yuan, H. A distribution network reconfiguration method based on comprehensive analysis of operation scenarios in the long-term time period. Energy Rep. 2021, 7, 369–379. [Google Scholar] [CrossRef]
  34. Pinto, T.; Praca, I.; Vale, Z.; Morais, H.; Sousa, T.M. Strategic bidding in electricity markets: An agent-based simulator with game theory for scenario analysis. Integr. Comput. Aided Eng. 2013, 20, 335–346. [Google Scholar] [CrossRef] [Green Version]
  35. Song, Z.; Niu, D.; Dai, S.; Xiao, X.; Wang, Y. Incorporating the influence of China’s industrial capacity elimination policies in electricity demand forecasting. Util. Policy 2017, 47, 1–11. [Google Scholar] [CrossRef]
  36. Cai, L.; Duan, J.; Lu, X.; Luo, J.; Yi, B.; Wang, Y.; Jin, D.; Lu, Y.; Qiu, L.; Chen, S.; et al. Pathways for electric power industry to achieve carbon emissions peak and carbon neutrality based on LEAP model: A case study of state-owned power generation enterprise in China. Comput. Ind. Eng. 2022, 170, 108334. [Google Scholar] [CrossRef]
  37. Wei, Y.-M.; Chen, K.; Kang, J.-N.; Chen, W.; Wang, X.-Y.; Zhang, X. Policy and Management of Carbon Peaking and Carbon Neutrality: A Literature Review. Engineering 2022, 14, 52–63. [Google Scholar] [CrossRef]
Figure 1. The structure of the paper.
Energies 15 06475 g001
Figure 2. GA–LSSVM algorithm flow chart.
Energies 15 06475 g002
Figure 3. Flow chart of scenario prediction model based on GA–LSSVM.
Energies 15 06475 g003
Figure 4. Comparison of predicted and actual results.
Energies 15 06475 g004
Figure 5. Trend forecast of influencing factors of coal demand in Shanxi Province.
Energies 15 06475 g005
Figure 6. Forecast results of thermal coal demand in Shanxi Province from 2020 to 2030.
Energies 15 06475 g006
Table 1. Pearson coefficient correlation analysis results.
IndexEconomic VariablesEnvironment Variable
GDPPopulationUrbanization
Ratio
Electricity Consumption of the Whole
Society
Thermal Power Installed CapacityCarbon Emissions
Pearson correlation0.971 **0.925 **0.919 **0.939 **0.980 **0.919 **
Sig. (two-tailed)0.0000.0000.0000.0000.0000.000
Note: ** indicates that the correlation is significant at the 0.01 level (two-tailed).
Table 2. Model error analysis results.
Evaluation IndicatorsLSSVM ModelGA–LSSVM Model
MSE (mean squared error)450,121.5115,107.43
RMSE (root mean Square error)225,060.757553.72
MAE (mean absolute error)507.1096.87
MAPE (mean absolute percentage error)4.93%0.87%
Table 3. Parameter estimation of fitting function for influencing factors of thermal coal demand in Shanxi Province.
Input VariableR SquareConstantFirst-Order CoefficientQuadratic Coefficient
GDP0.9702857.1001156.200−15.022
Population0.9573271.20051.139−1.366
Urbanization ratio0.9960.4010.014−0.00005
Electricity consumption of the whole society0.934916.410101.820−1.219
Thermal power installed capacity0.9981724.600487.510−9.959
Carbon emissions0.97255,662.0001358.300146.450
Table 4. Economic variable growth rate of electricity and coal demand in Shanxi Province in multiple scenarios.
YearHigh Economic Growth ModelNormal Economic GrowthLow Economic Growth
G/%P/%U/%E/%G/%P/%U/%E/%G/%P/%U/%E/%
20204.841.293.55−0.262.840.292.55−1.260.84−0.711.55−2.26
20215.771.163.013.763.770.162.012.761.77−0.841.011.76
20225.471.092.953.583.470.091.952.581.47−0.910.951.58
20235.191.022.903.413.190.021.902.411.19−0.980.901.41
20244.940.942.853.252.94−0.061.852.250.94−1.060.851.25
20254.710.872.803.102.71−0.131.802.100.71−1.130.801.10
20264.490.802.752.962.49−0.201.751.960.49−1.200.750.96
20274.280.722.712.832.28−0.281.711.830.28−1.280.710.83
20284.090.652.662.702.09−0.351.661.700.09−1.350.660.70
20293.910.582.622.581.91−0.421.621.58−0.09−1.420.620.58
20303.740.502.582.471.74−0.501.581.47−0.26−1.500.580.47
Average Growth Rate4.680.872.852.762.68−0.131.851.760.68−1.130.850.76
Note: G in the table stands for GDP, P in the table stands for population, U in the table stands for urbanization ratio, and E in the table stands for electricity consumption of the whole society.
Table 5. Growth rate of environmental variables of thermal coal demand in Shanxi Province in multiple scenarios.
YearNormal Development ModelLow Emission Reduction ModeStrong Emission Reduction Mode
T/%C/%T/%C/%T/%C/%
20204.314.311.310.24−0.69−4.76
20212.282.28−0.720.39−2.72%−4.61
20221.951.95−1.050.36−3.05−4.64
20231.641.64−1.360.31−3.36−4.69
20241.341.34−1.660.26−3.66−4.74
20251.061.06−1.940.21−3.94−4.79
20260.780.78−2.220.15−4.22−4.85
20270.520.52−2.480.08−4.48−4.92
20280.250.25−2.750.01−4.75−4.99
2029−0.01−0.01−3.01−0.06−5.01−5.06
2030−0.27−0.27−3.27−0.13−5.27−5.13
Average Growth Rate1.261.26−1.740.17−0.69−4.76
Note: T in the table stands for thermal power installed capacity, C in the table stands for carbon emissions.
Publisher’s Note: MDPI stays neutral with regard to jurisdictional claims in published maps and institutional affiliations.

