

Comparative Analysis on the Performance and Exhaust Gas Emission of Cars with Spark-Ignition Engines


 ,
,  , ,
, ,
Abstract
:1. Introduction
- from the energy industry = 51.51%
- from manufacturing and construction = 9.58%
- with transport = 14.06%
- from other sectors = 16.65%
2. Literature Review
3. Research Method
4. Methodological Assumptions
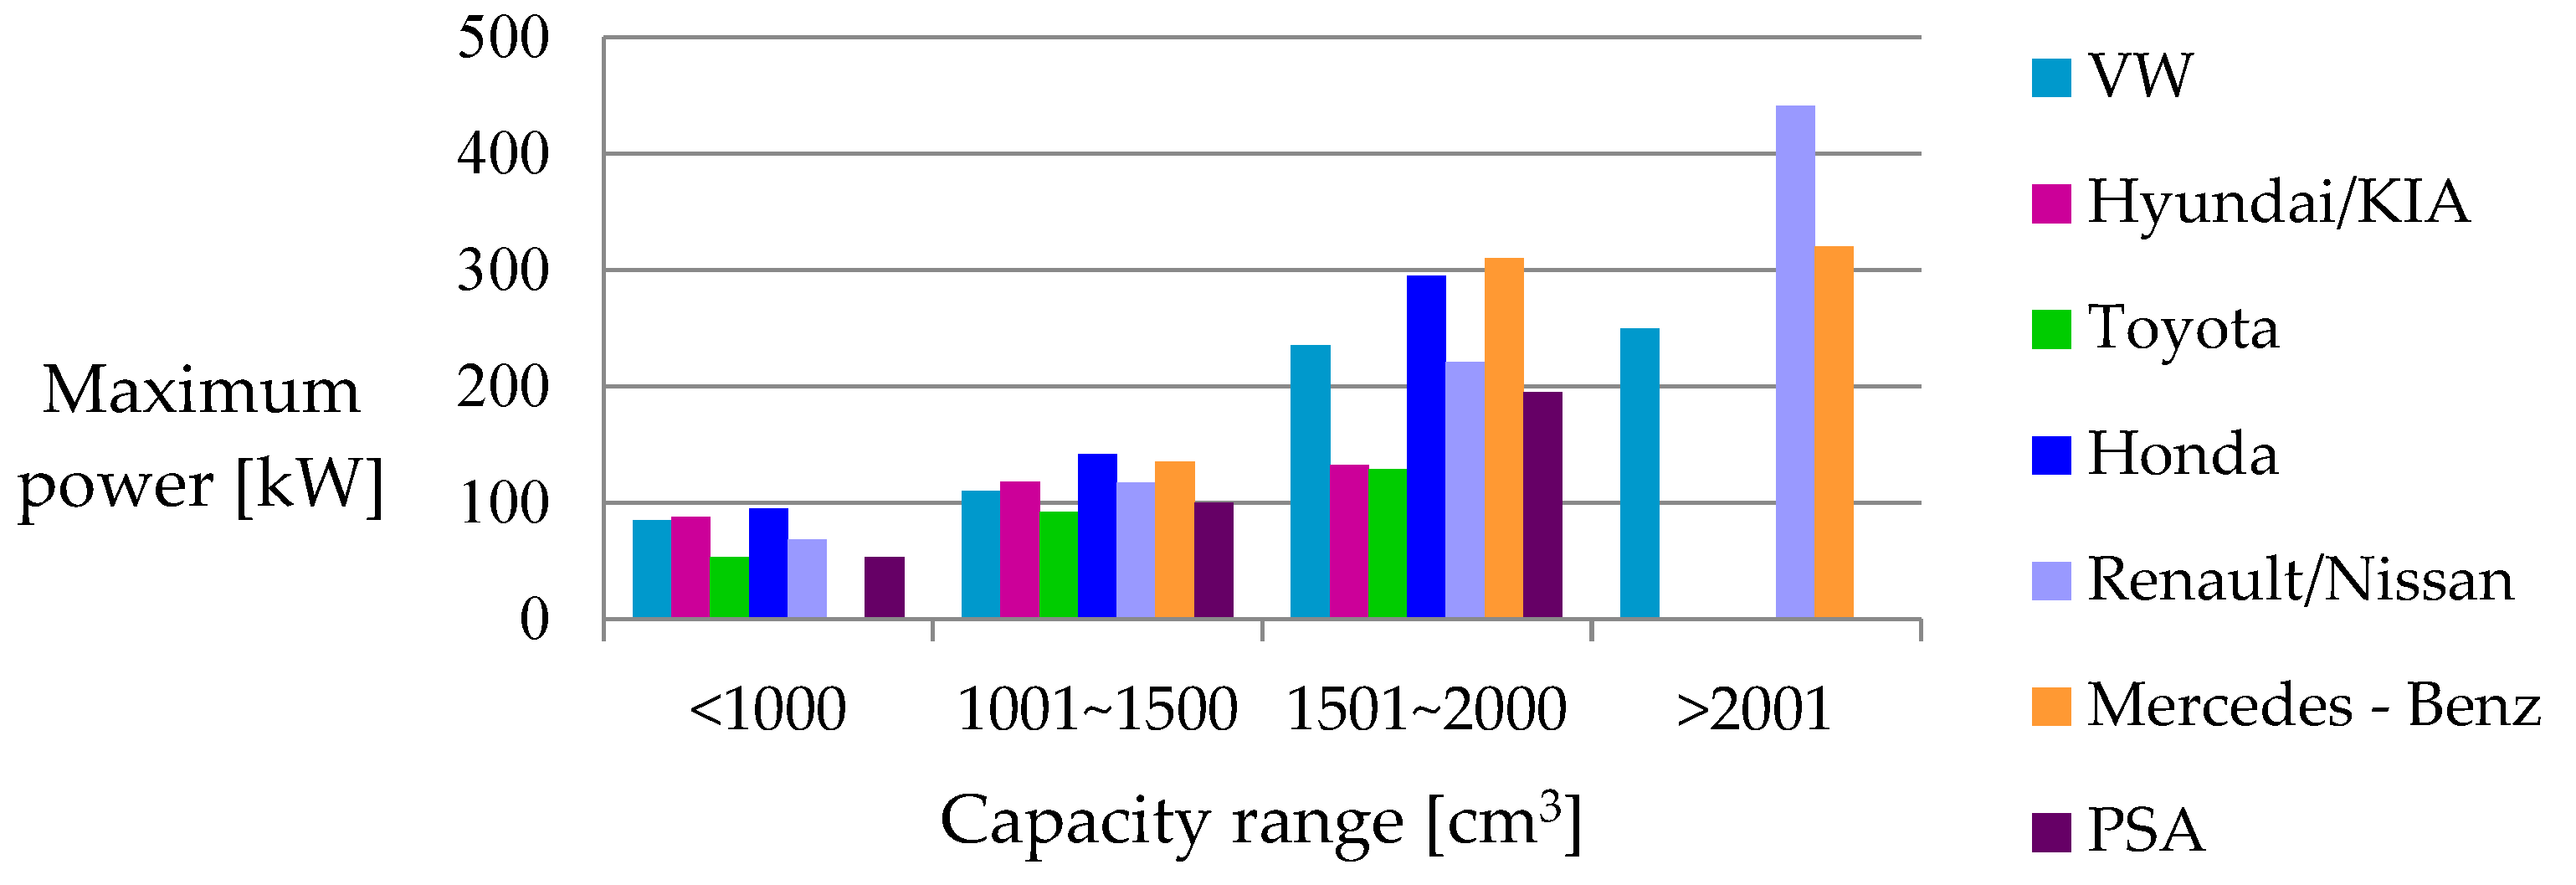
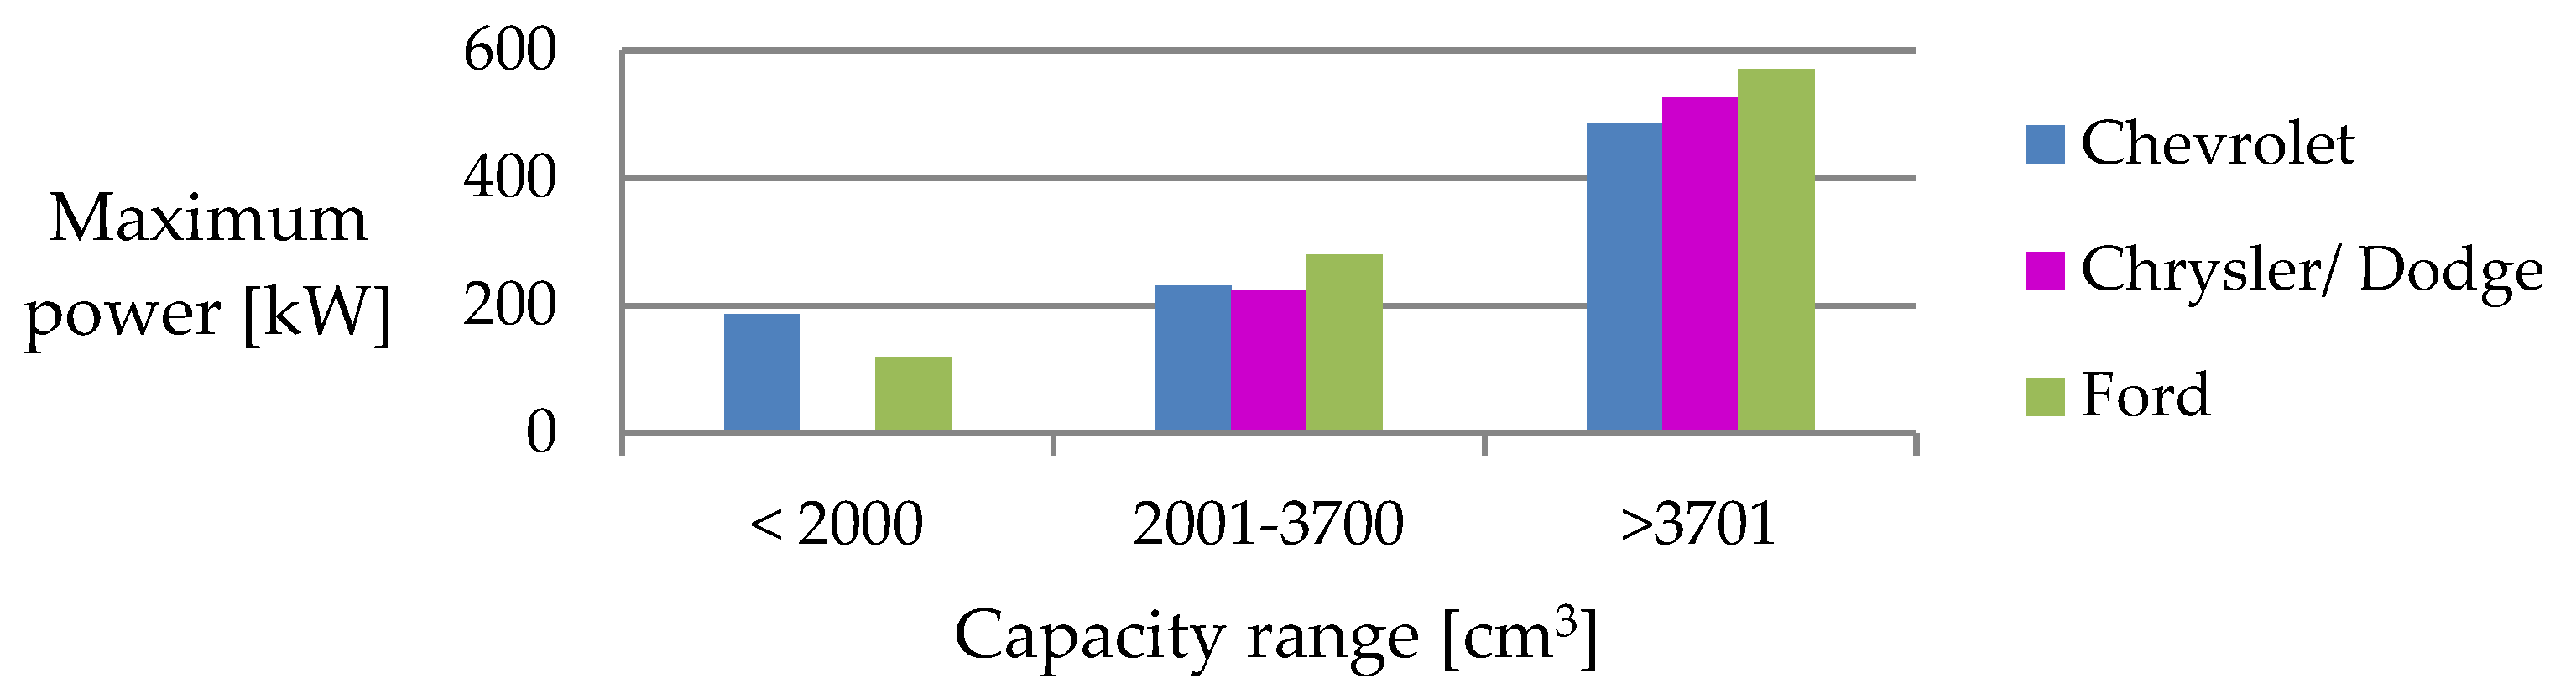
- Engine power in individual capacity compartments;
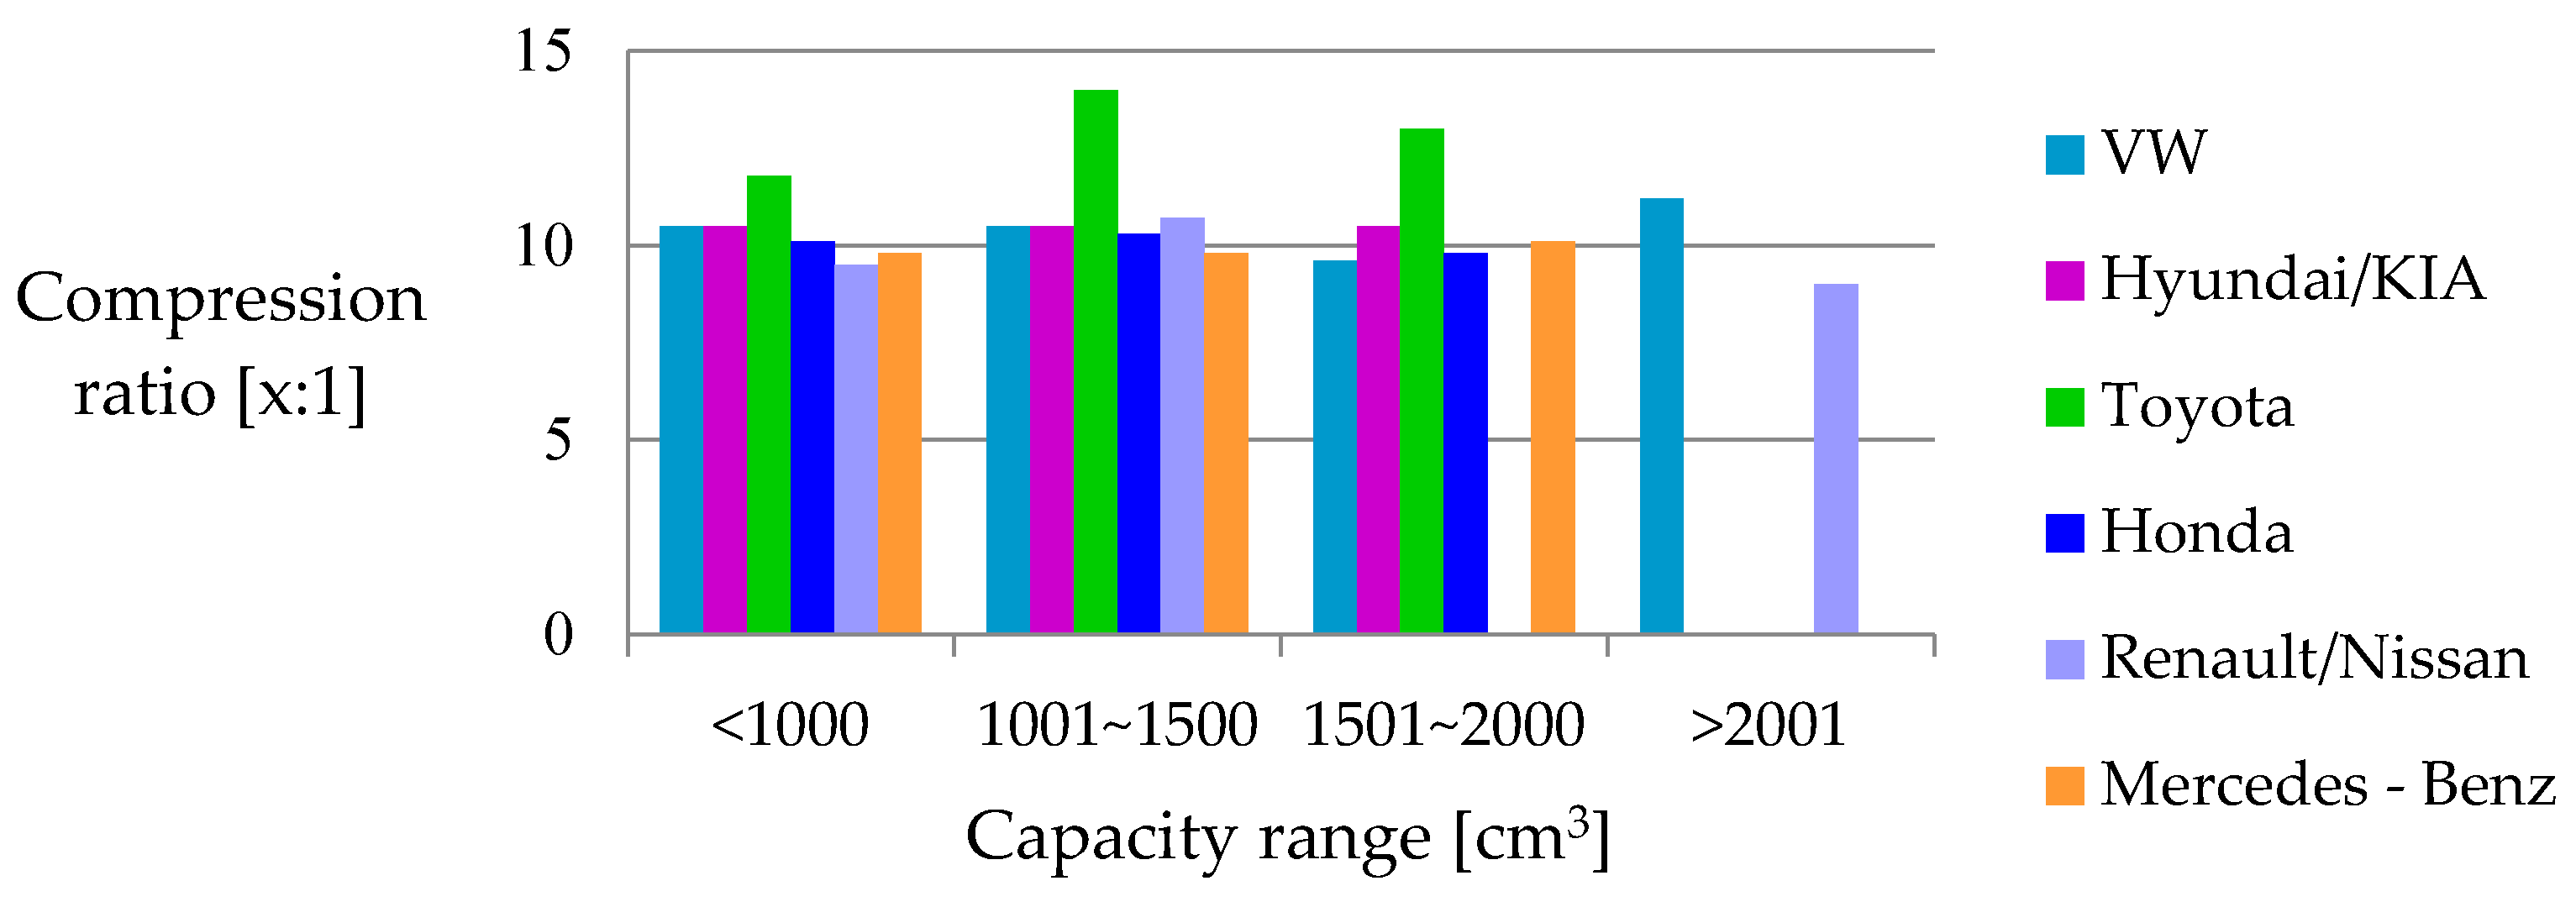
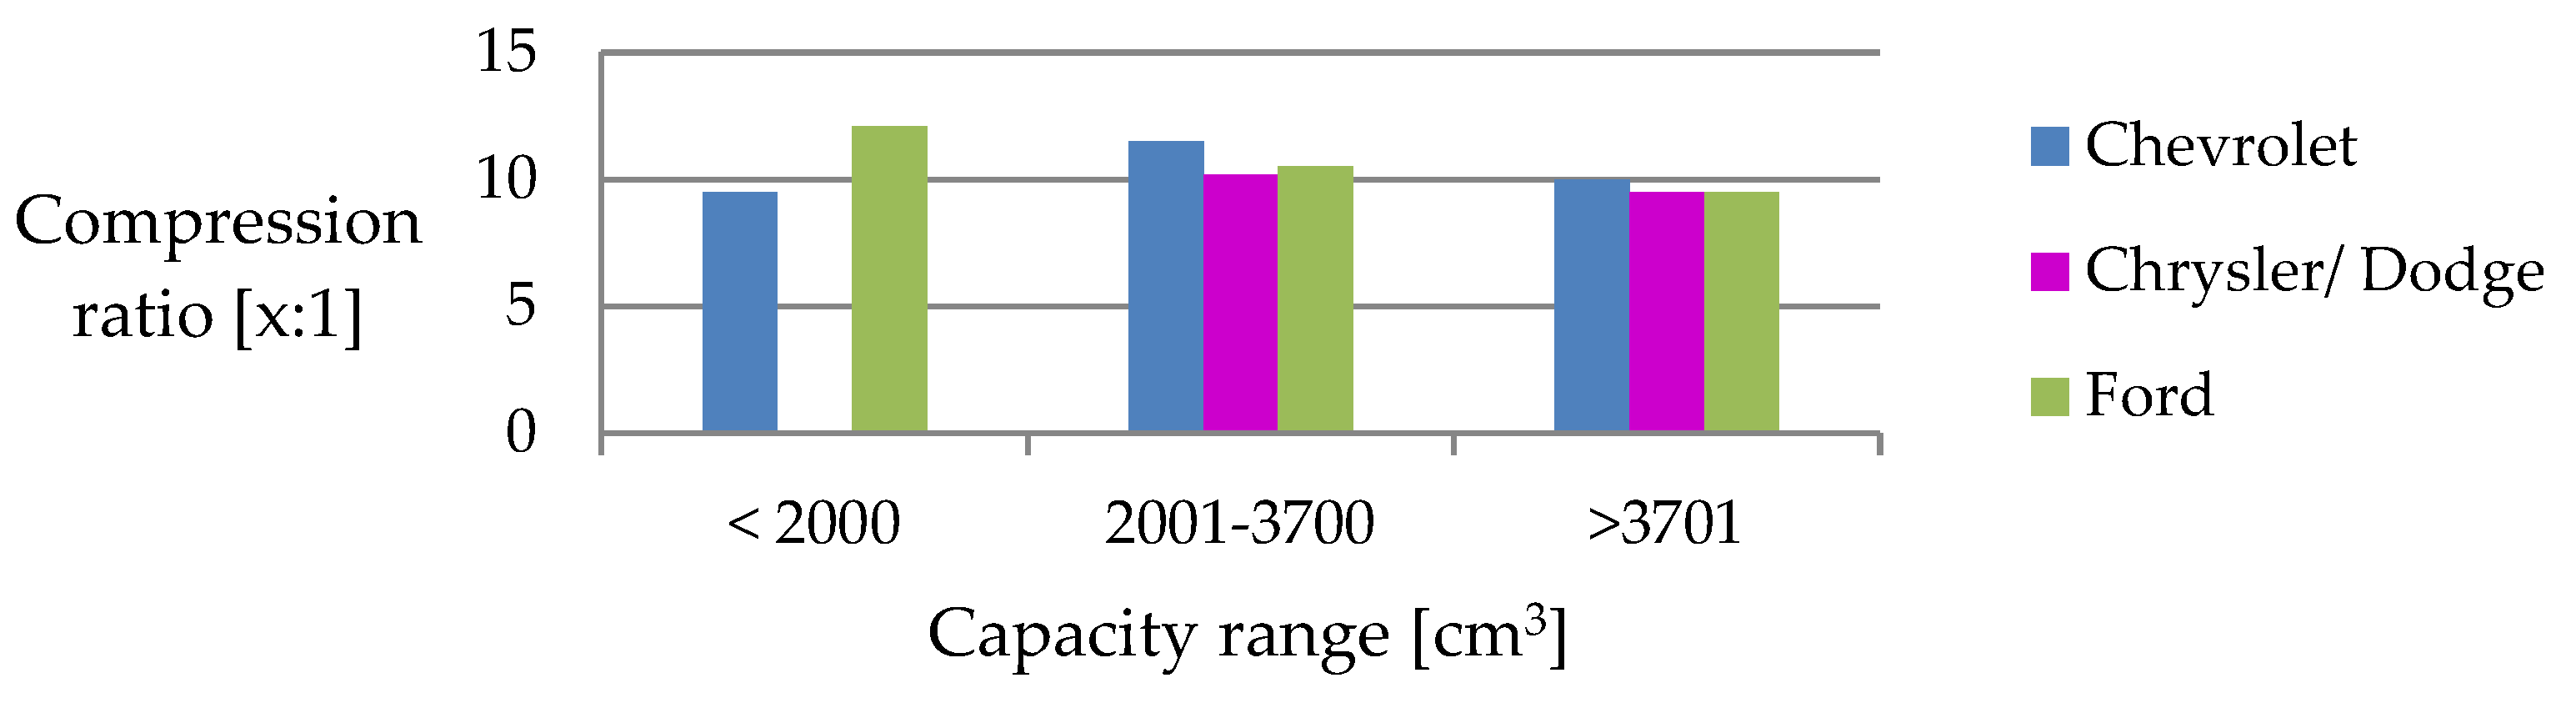
- Compression ratio;
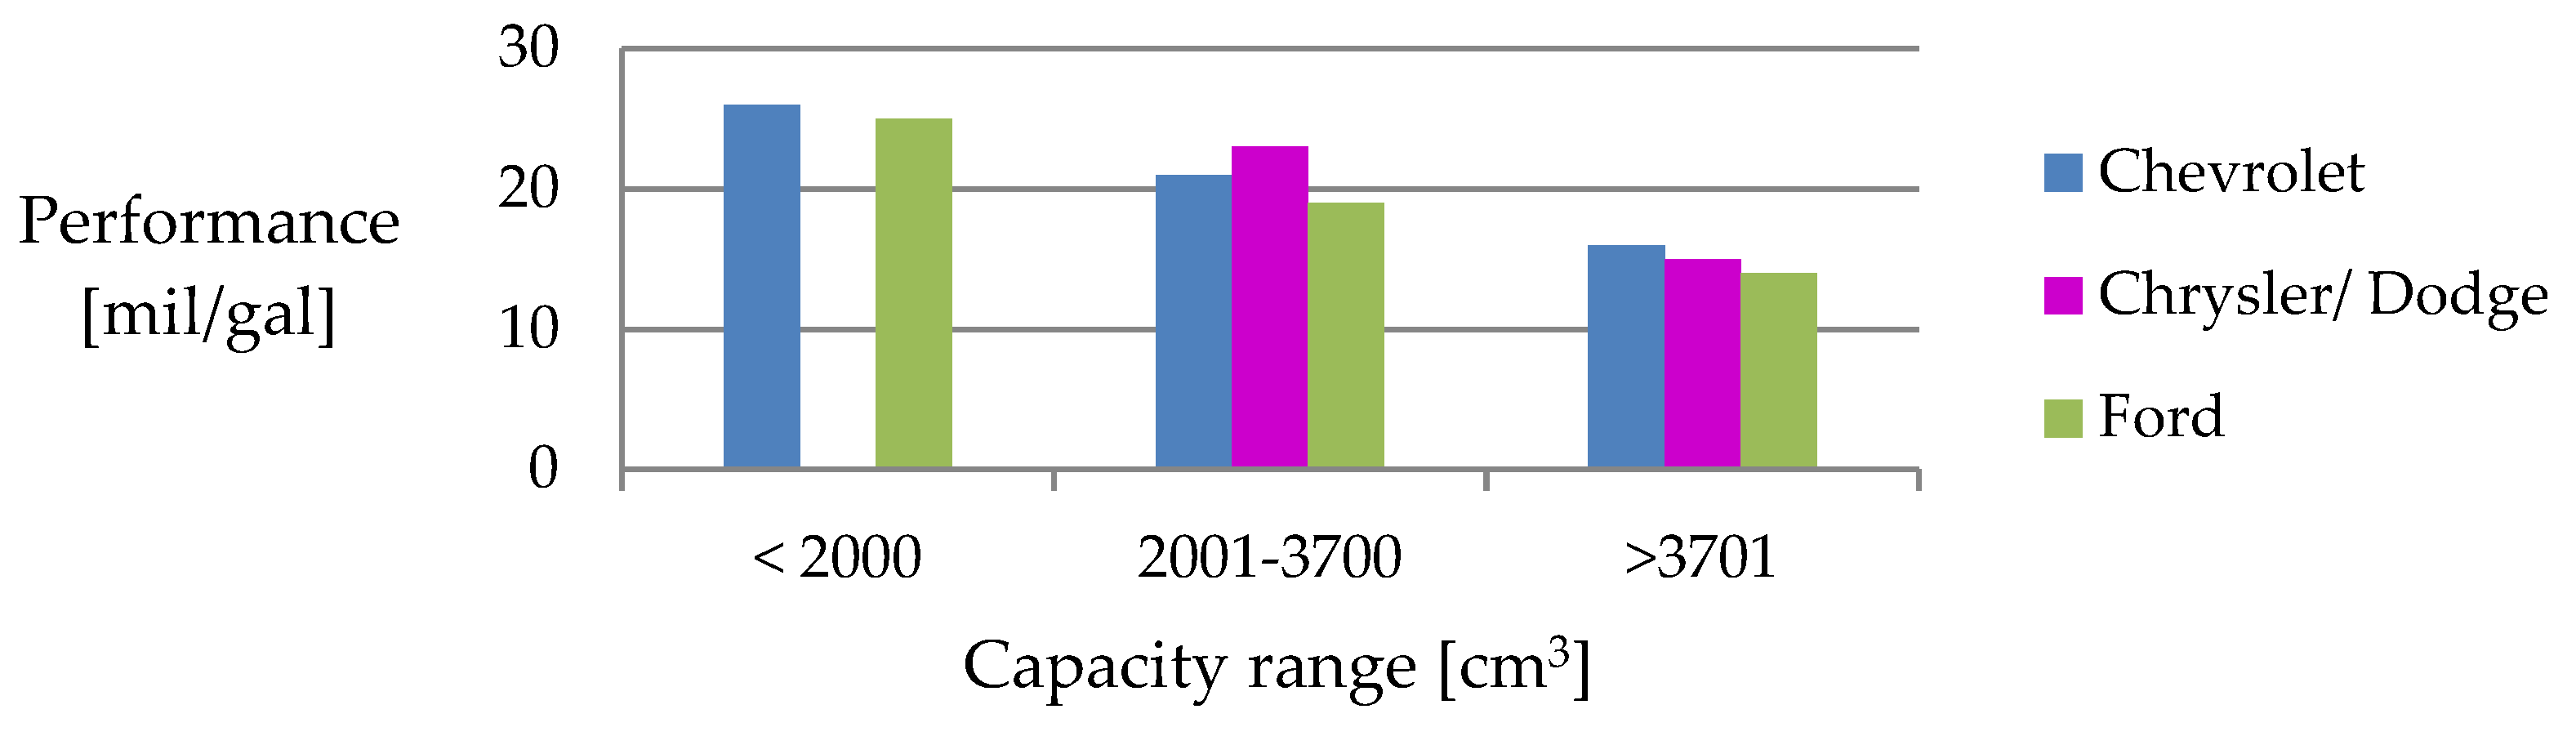
- Medium combustion (in figures it is expressed in l/100 km);
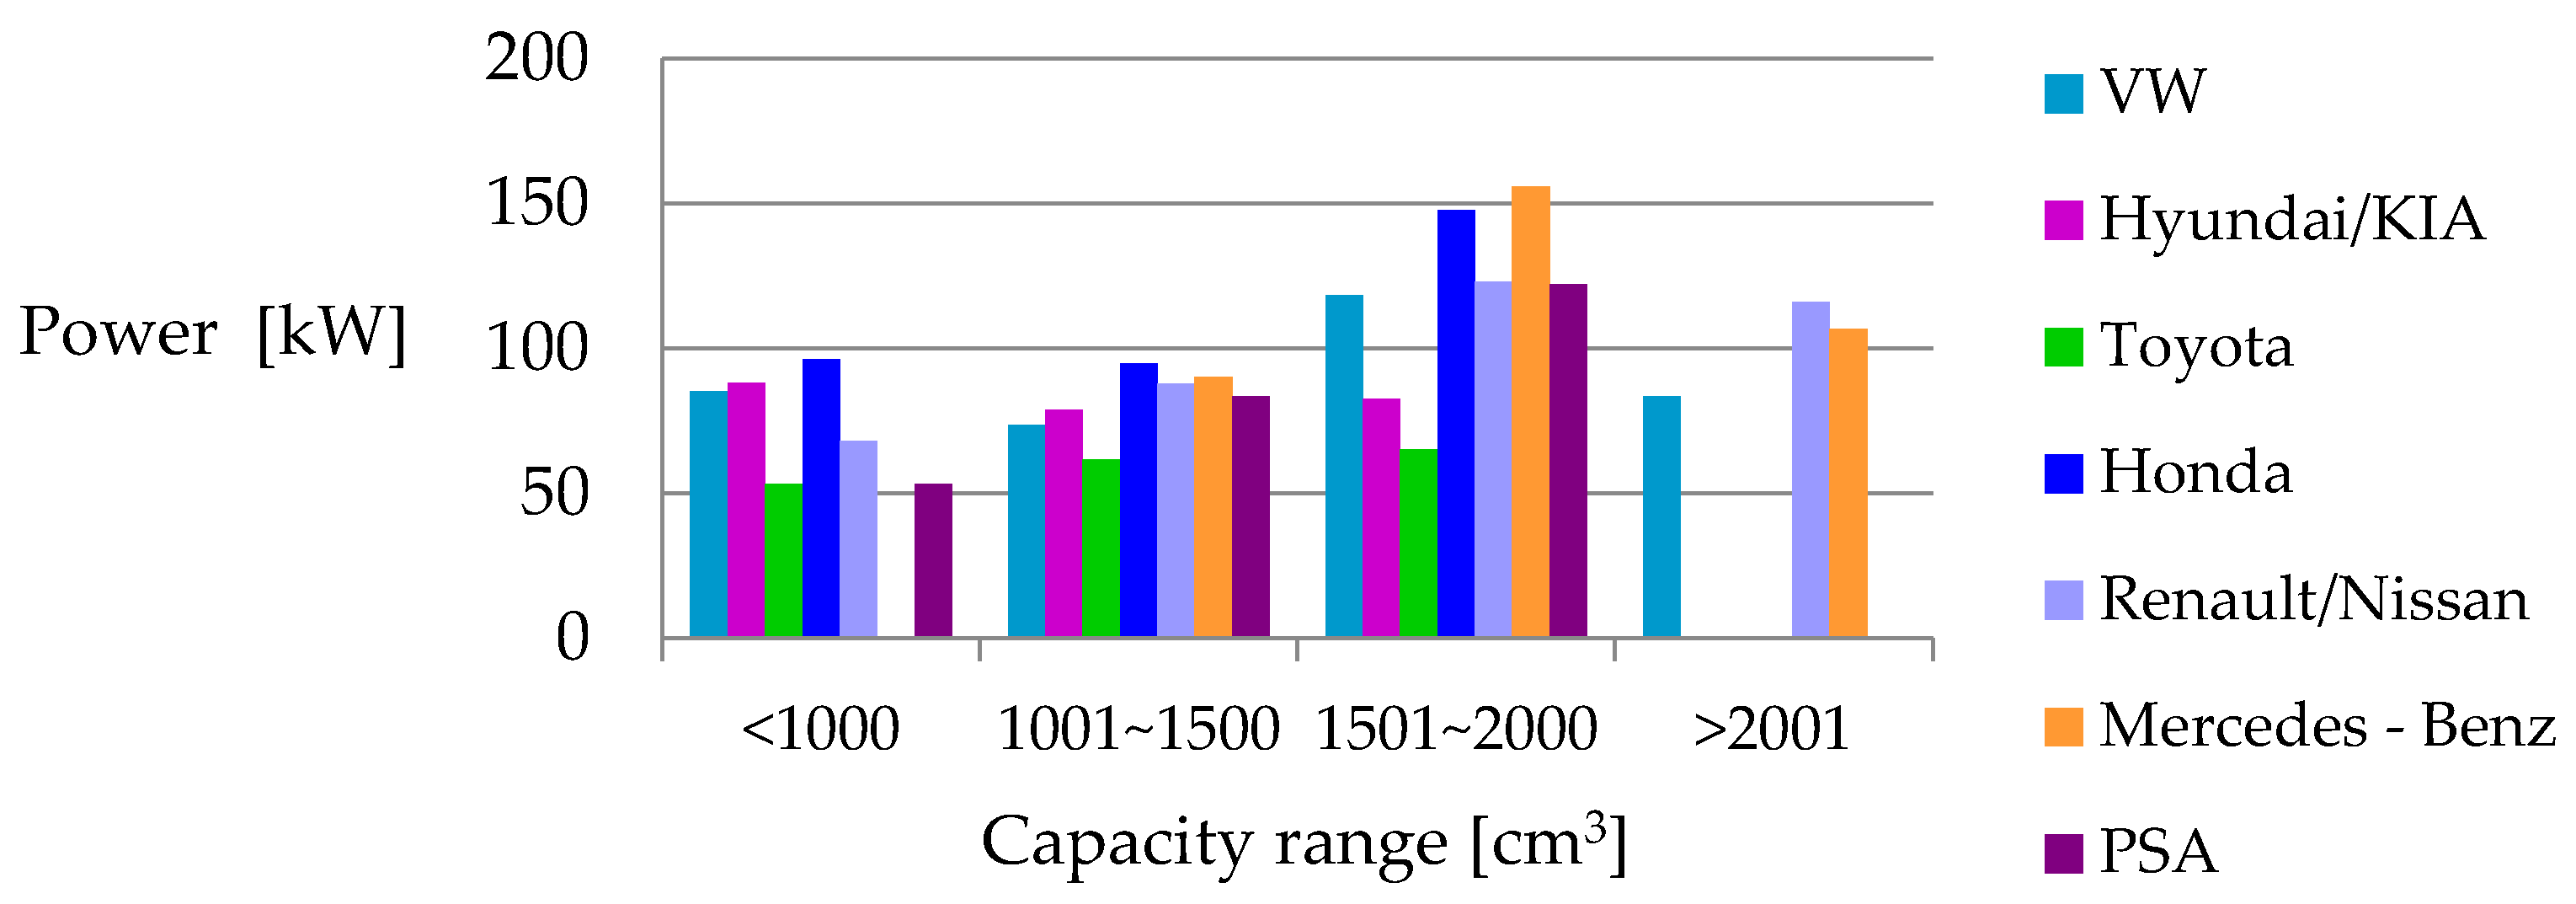
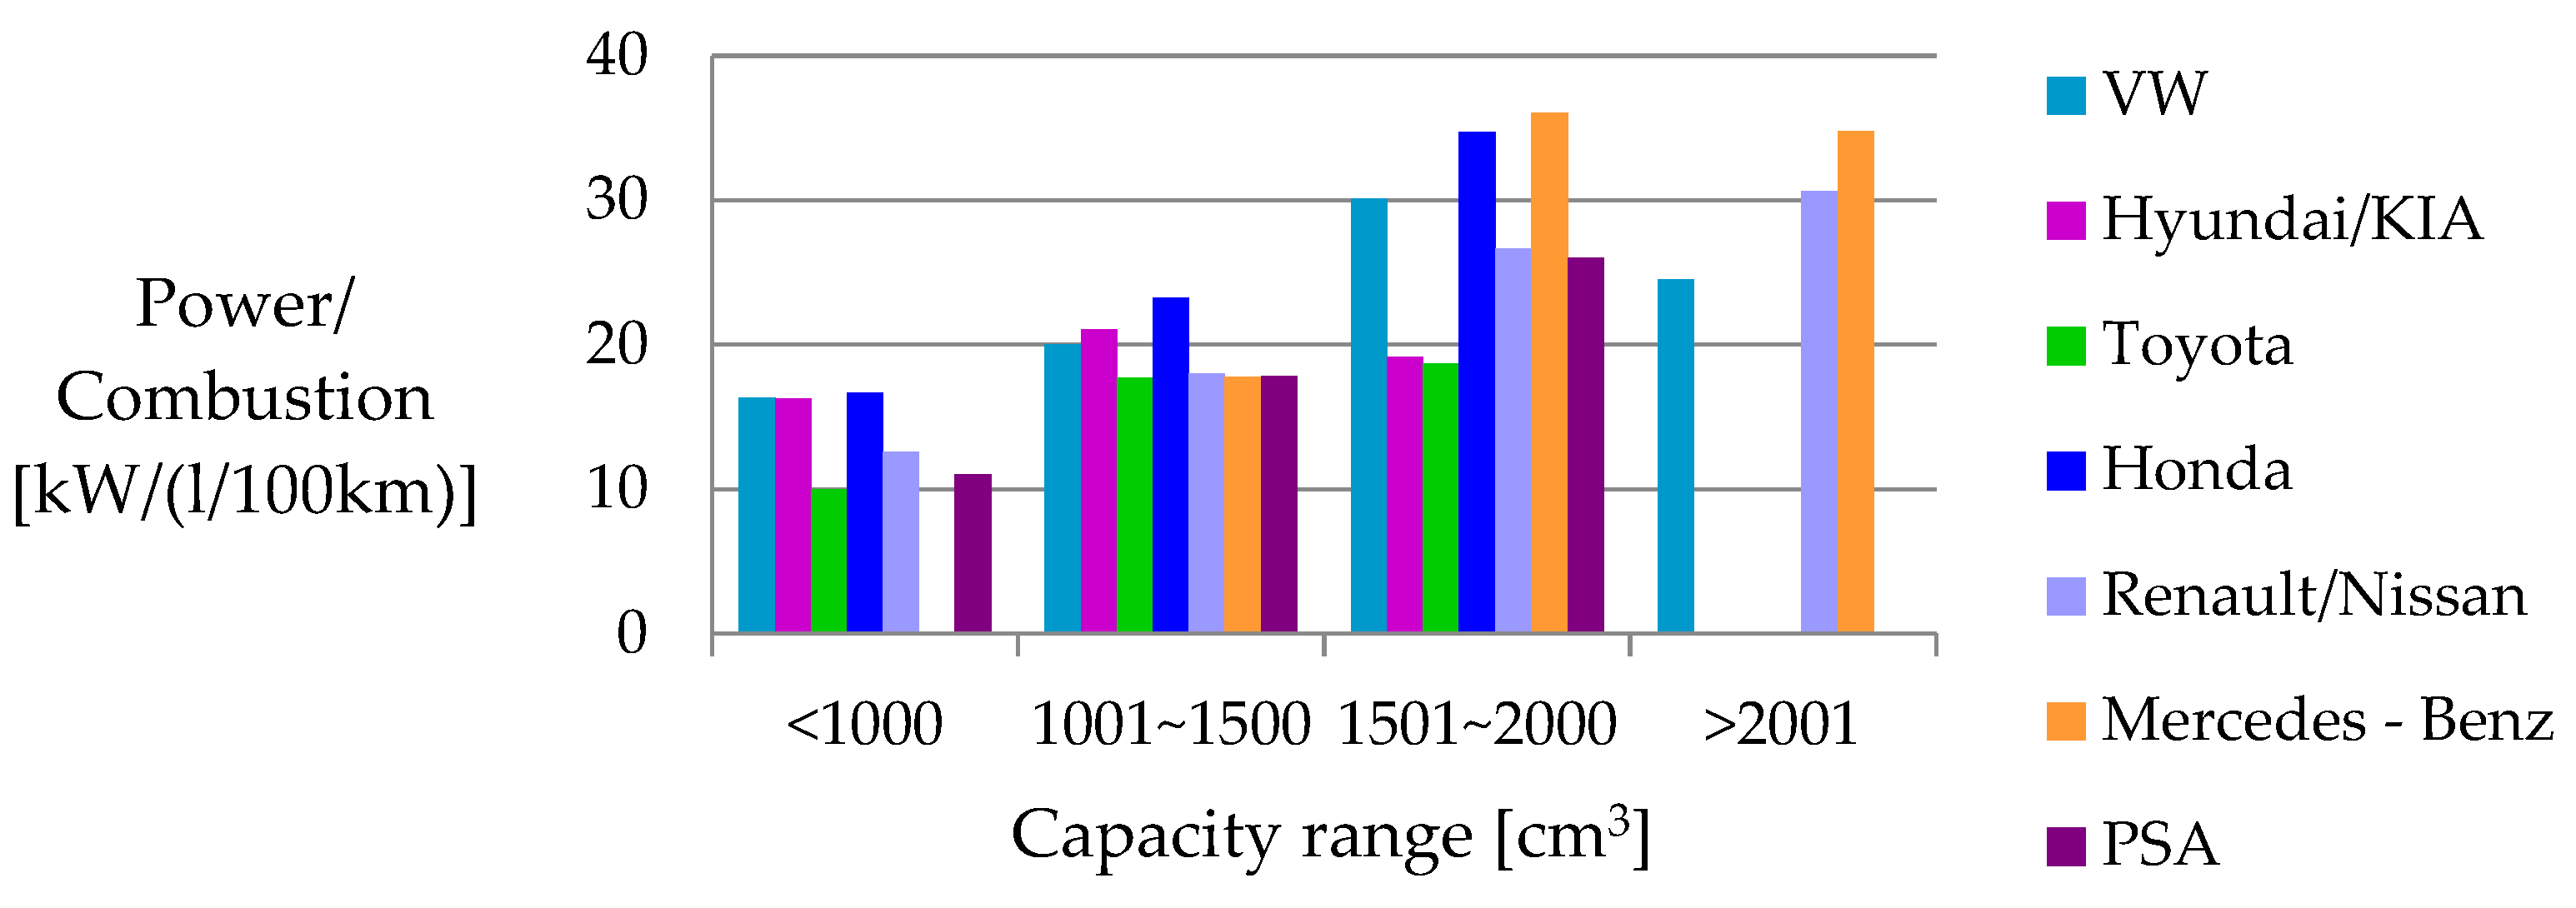
- Power dependence on engine capacity;
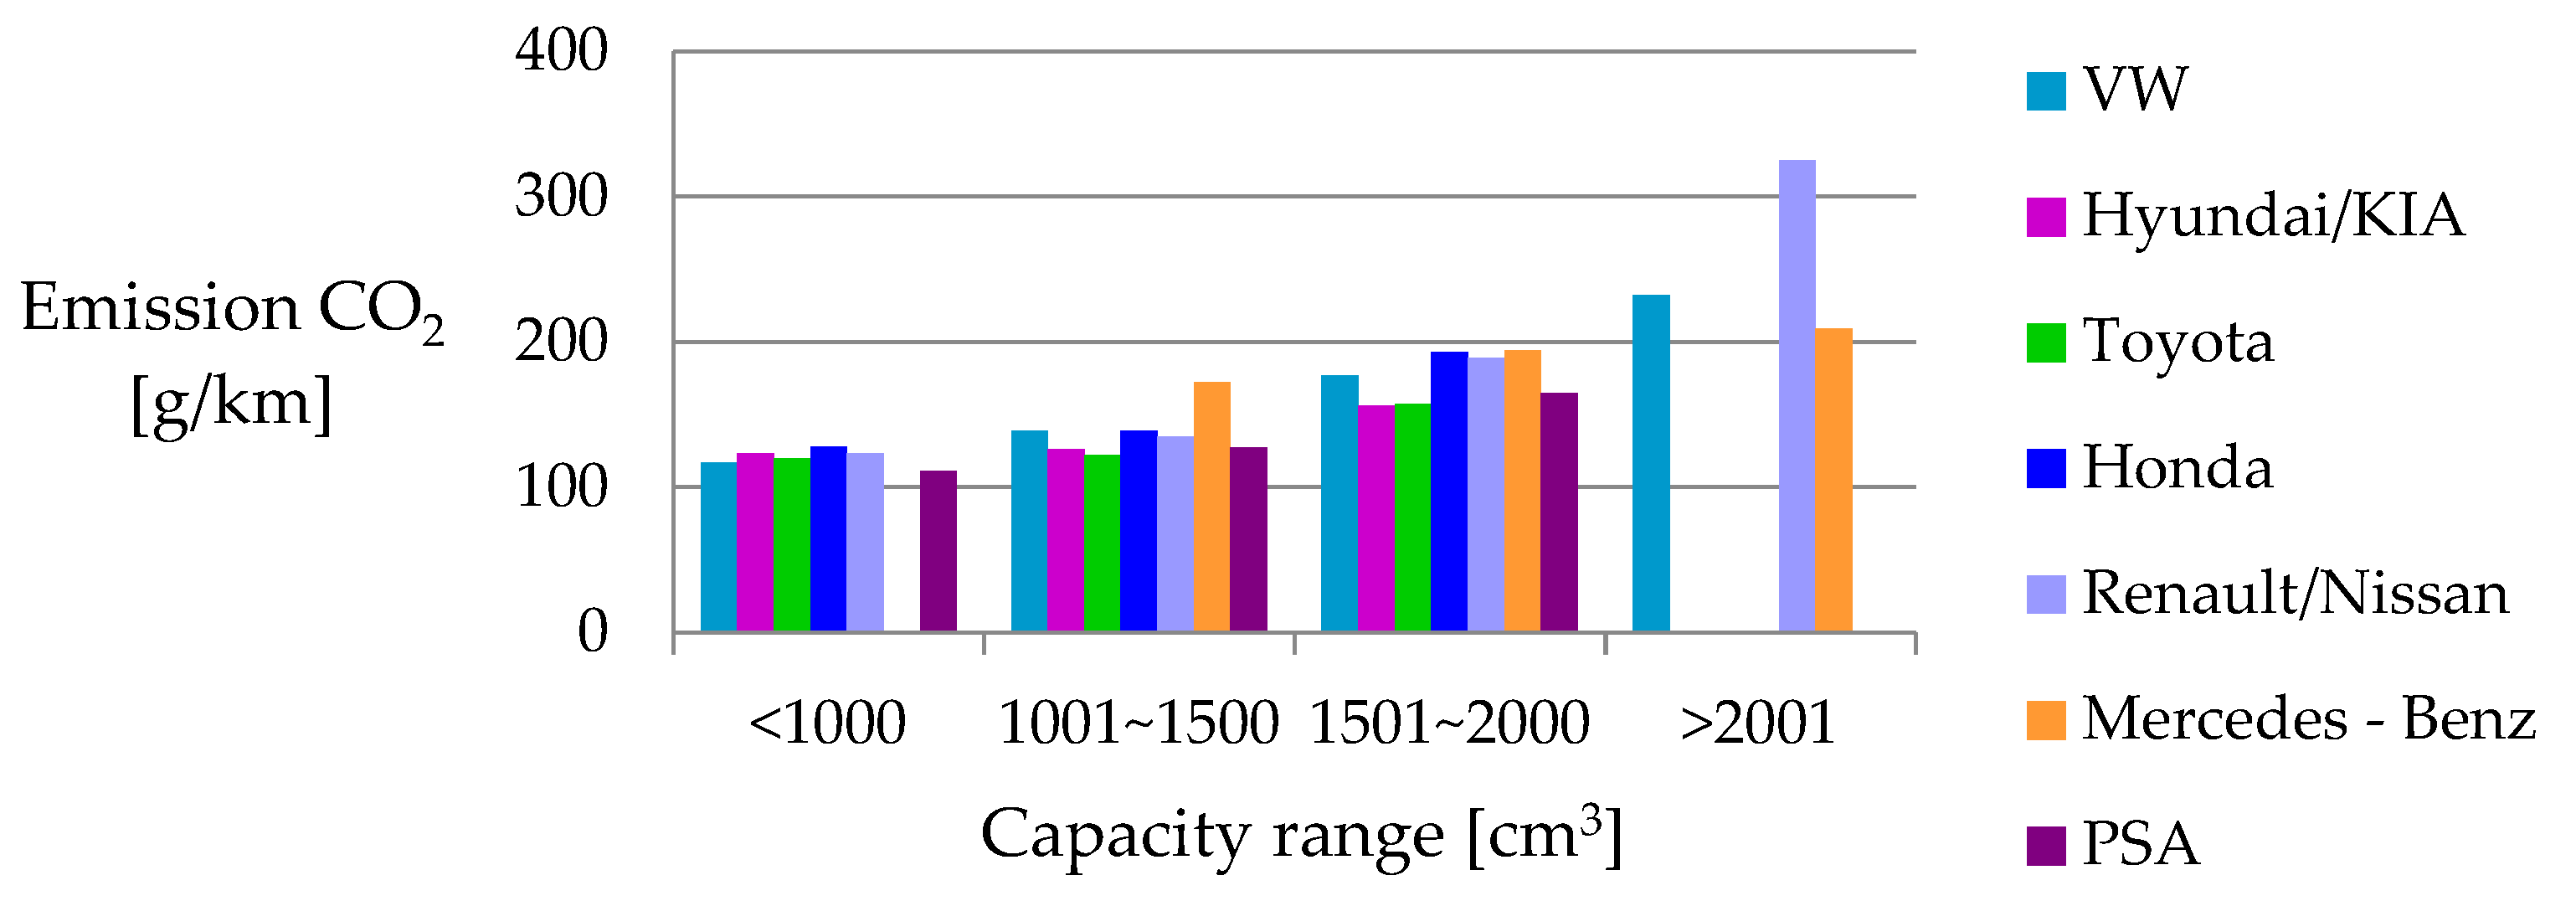
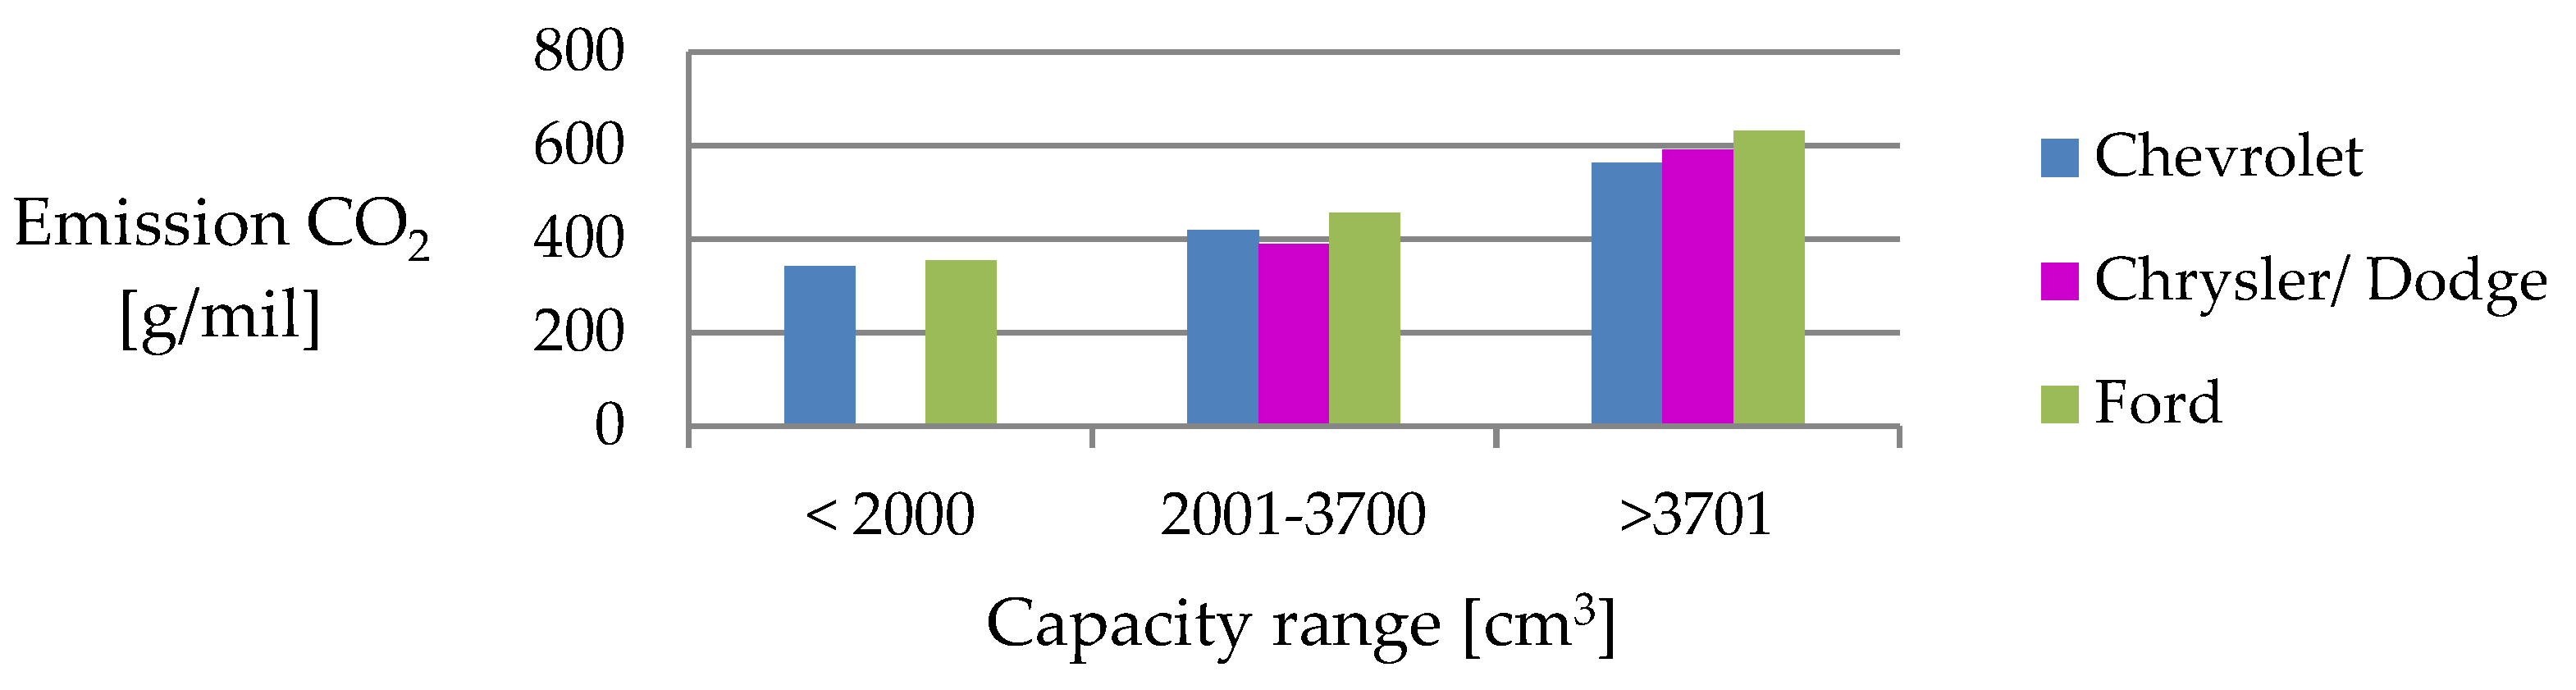
- CO2 emissions;
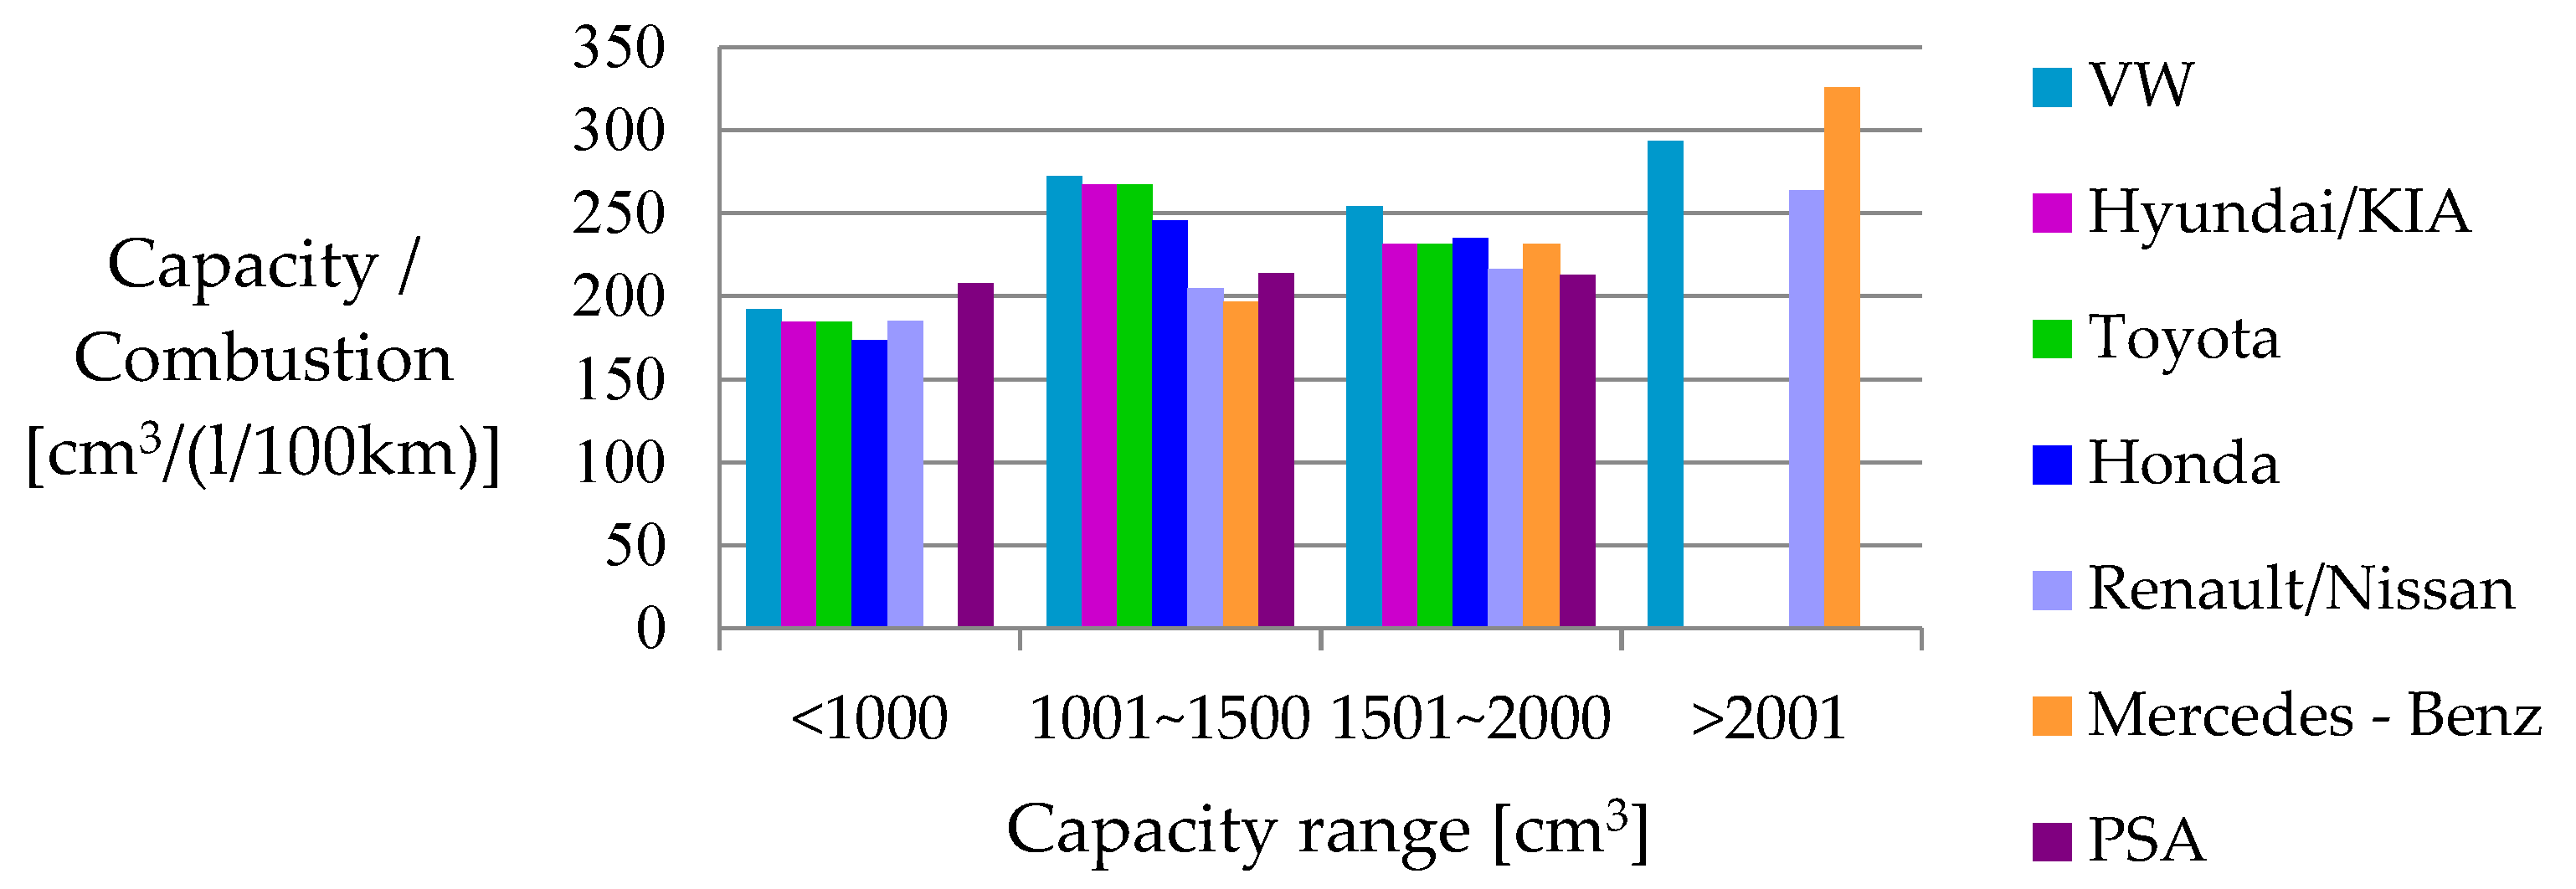
- Combustion dependence on engine capacity;
- CO2 emissions dependence on engine capacity;
- Combustion dependence on engine power;
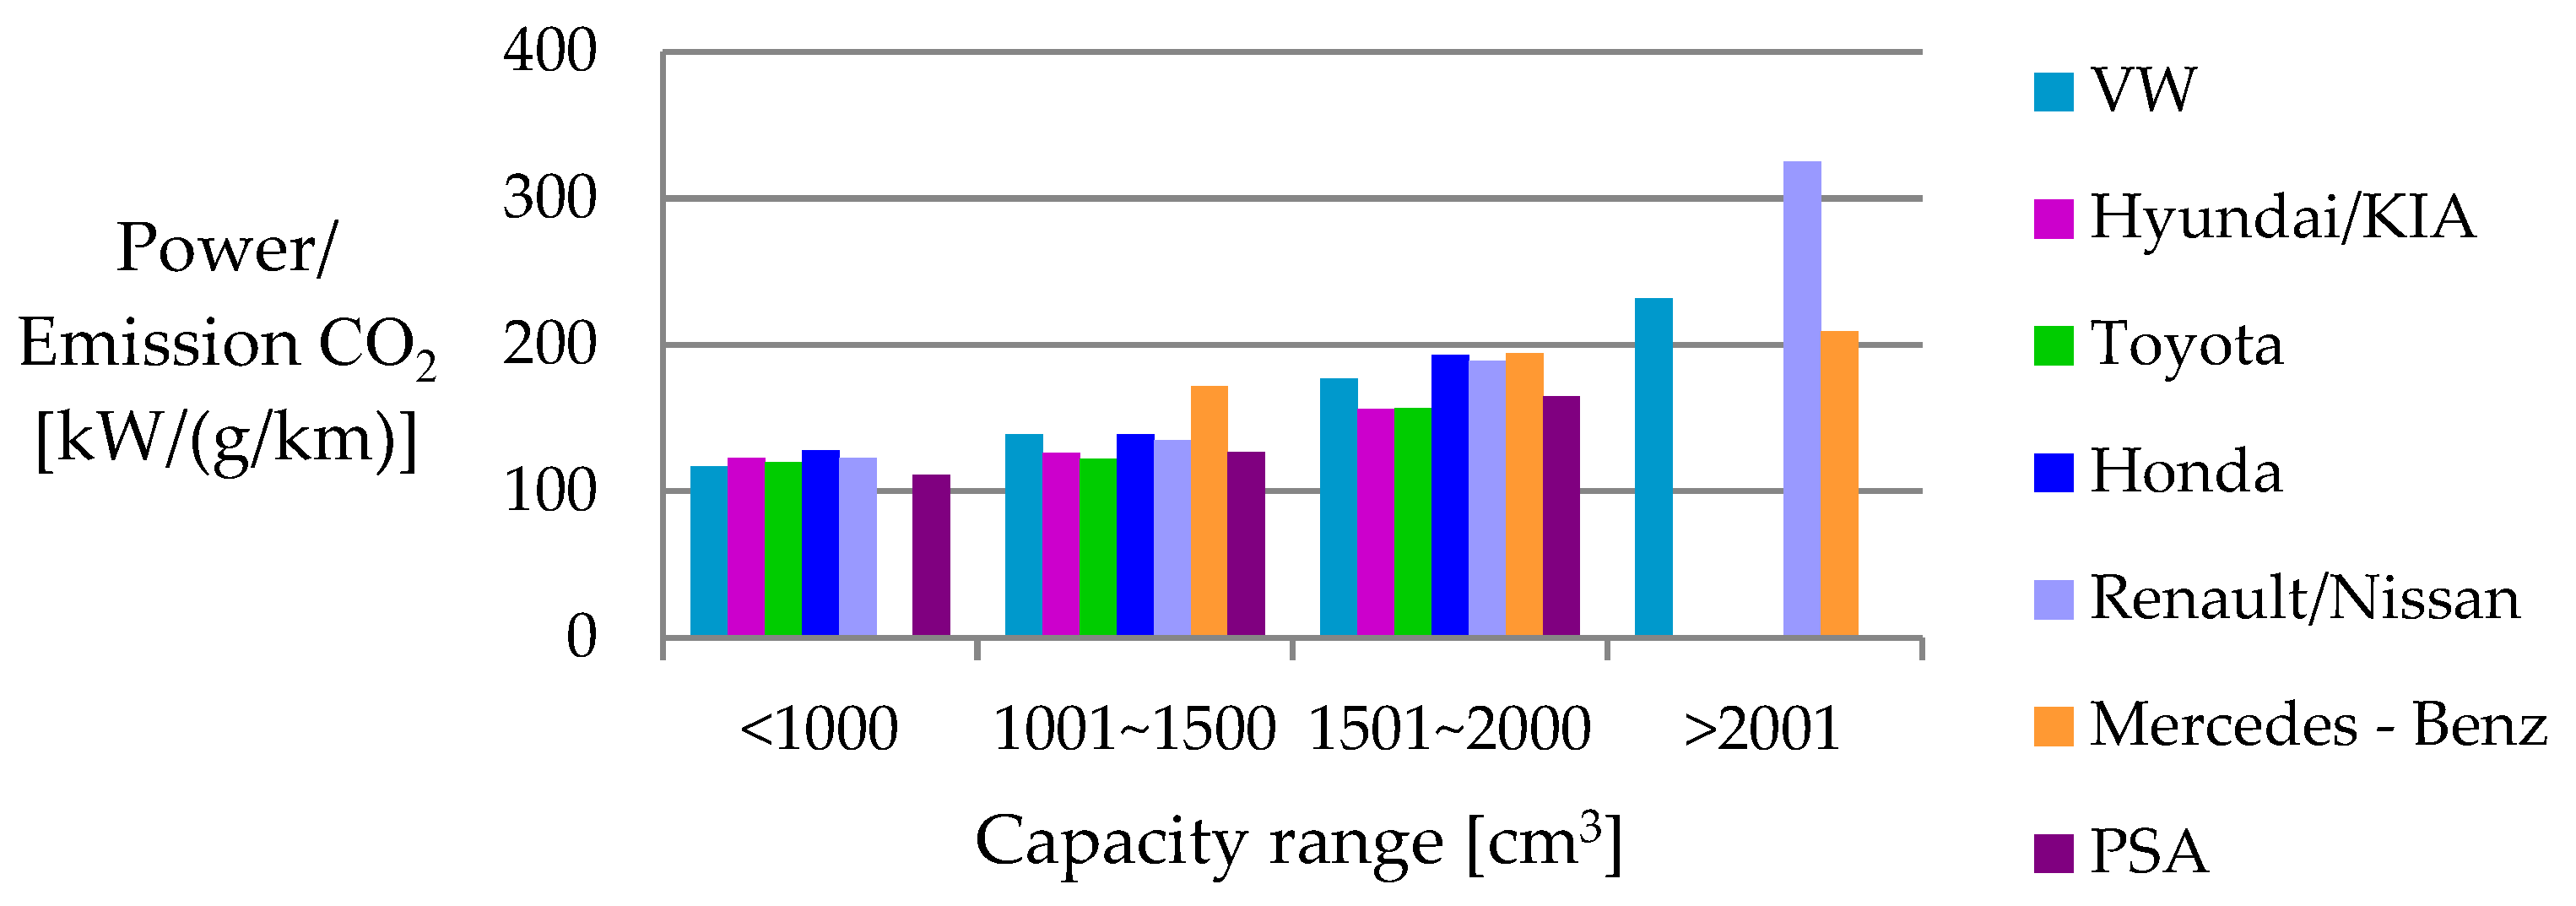
- Dependence of CO2 emissions on engine power.
- The largest possible and latest technical engine in the range (for >2001 the engine closest to the capacity of 3000 cm3 was chosen);
- If the engine had multiple power variants, the most powerful one was chosen;
- If a version with a given power was offered in many models, the performance and emissions refer to the smallest car with this engine variant.
5. Test Result
6. Discussion
7. Conclusions
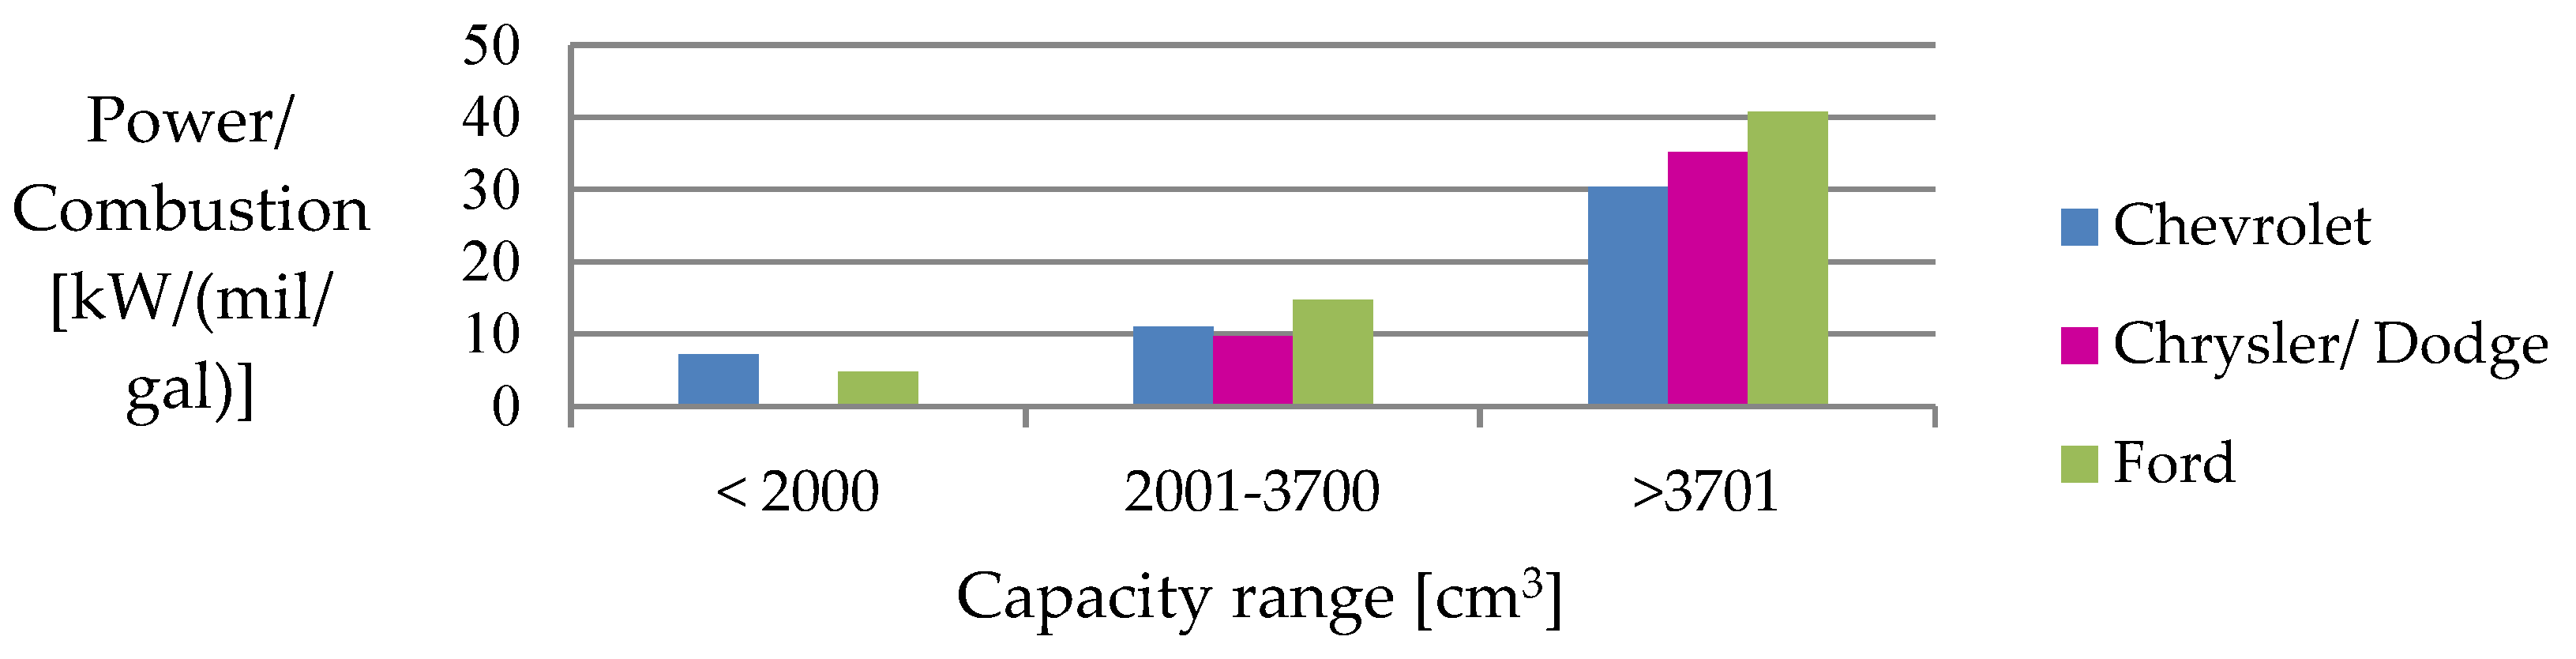
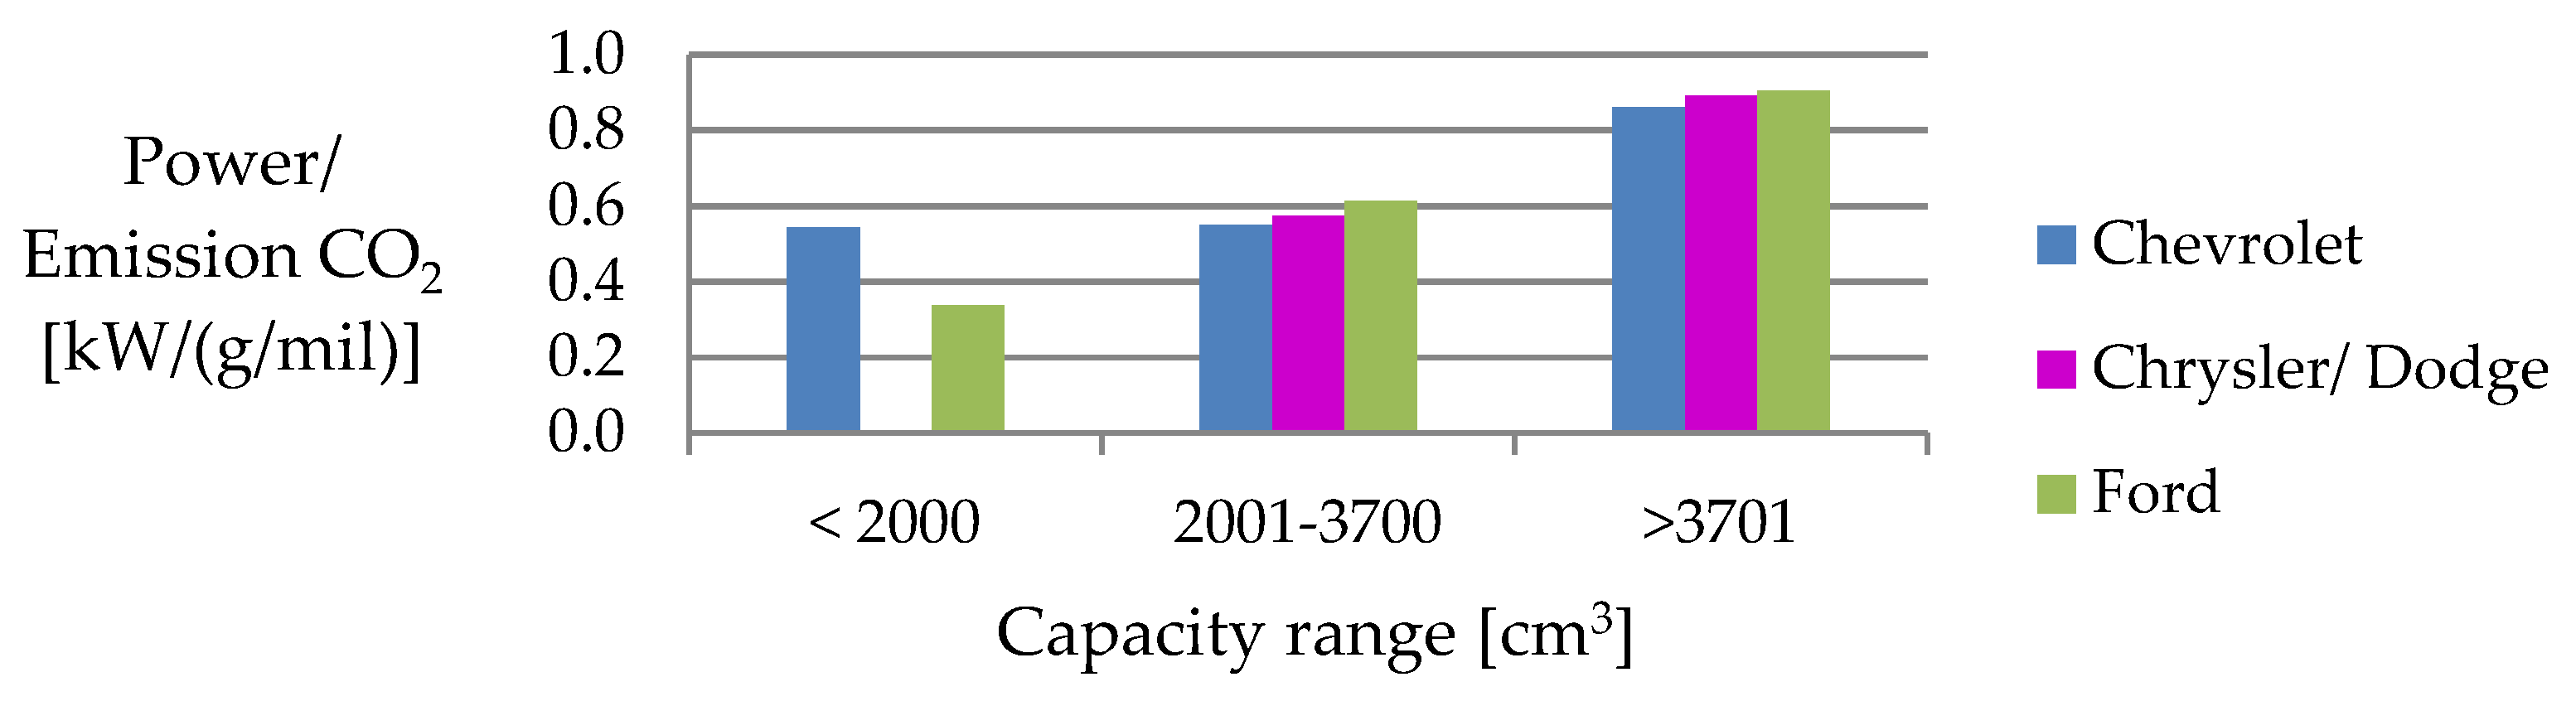
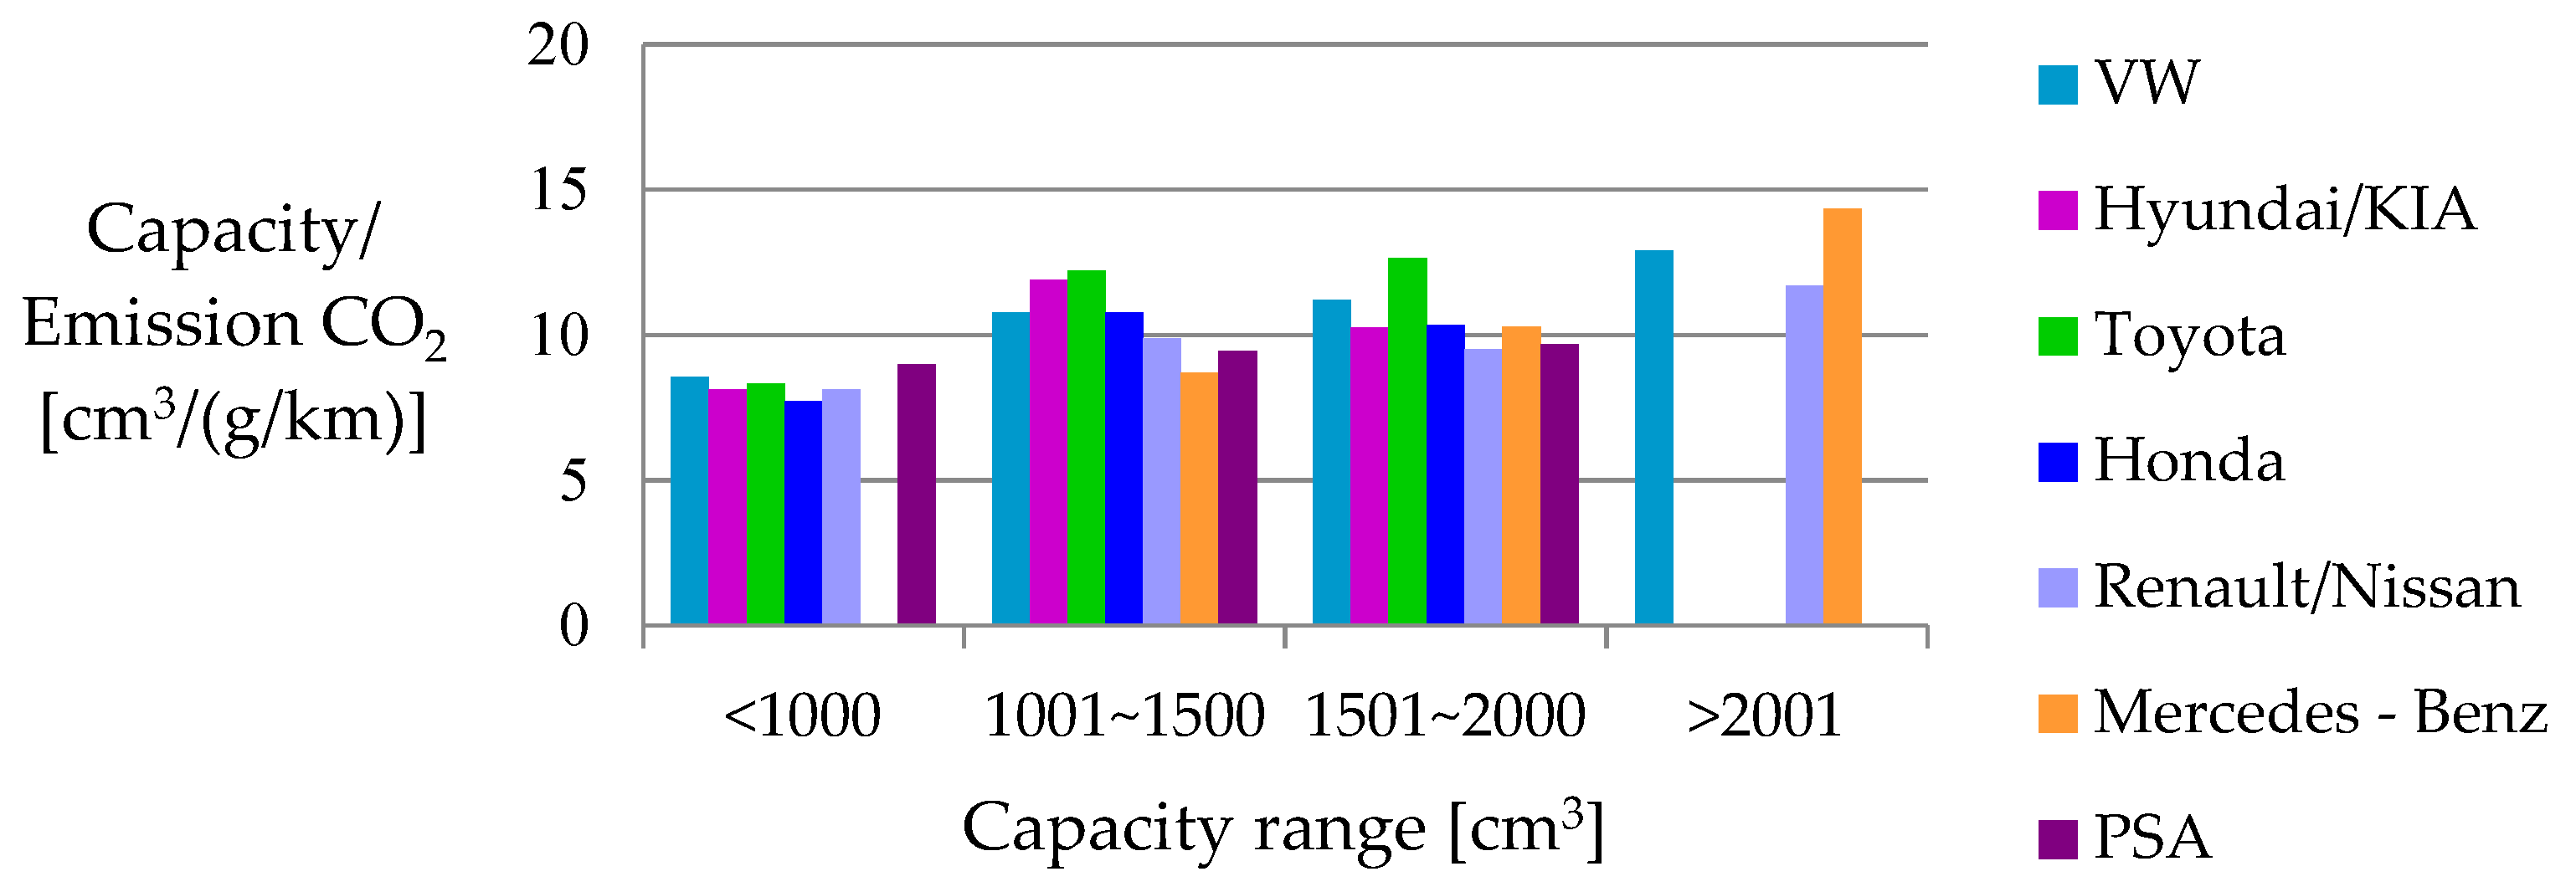
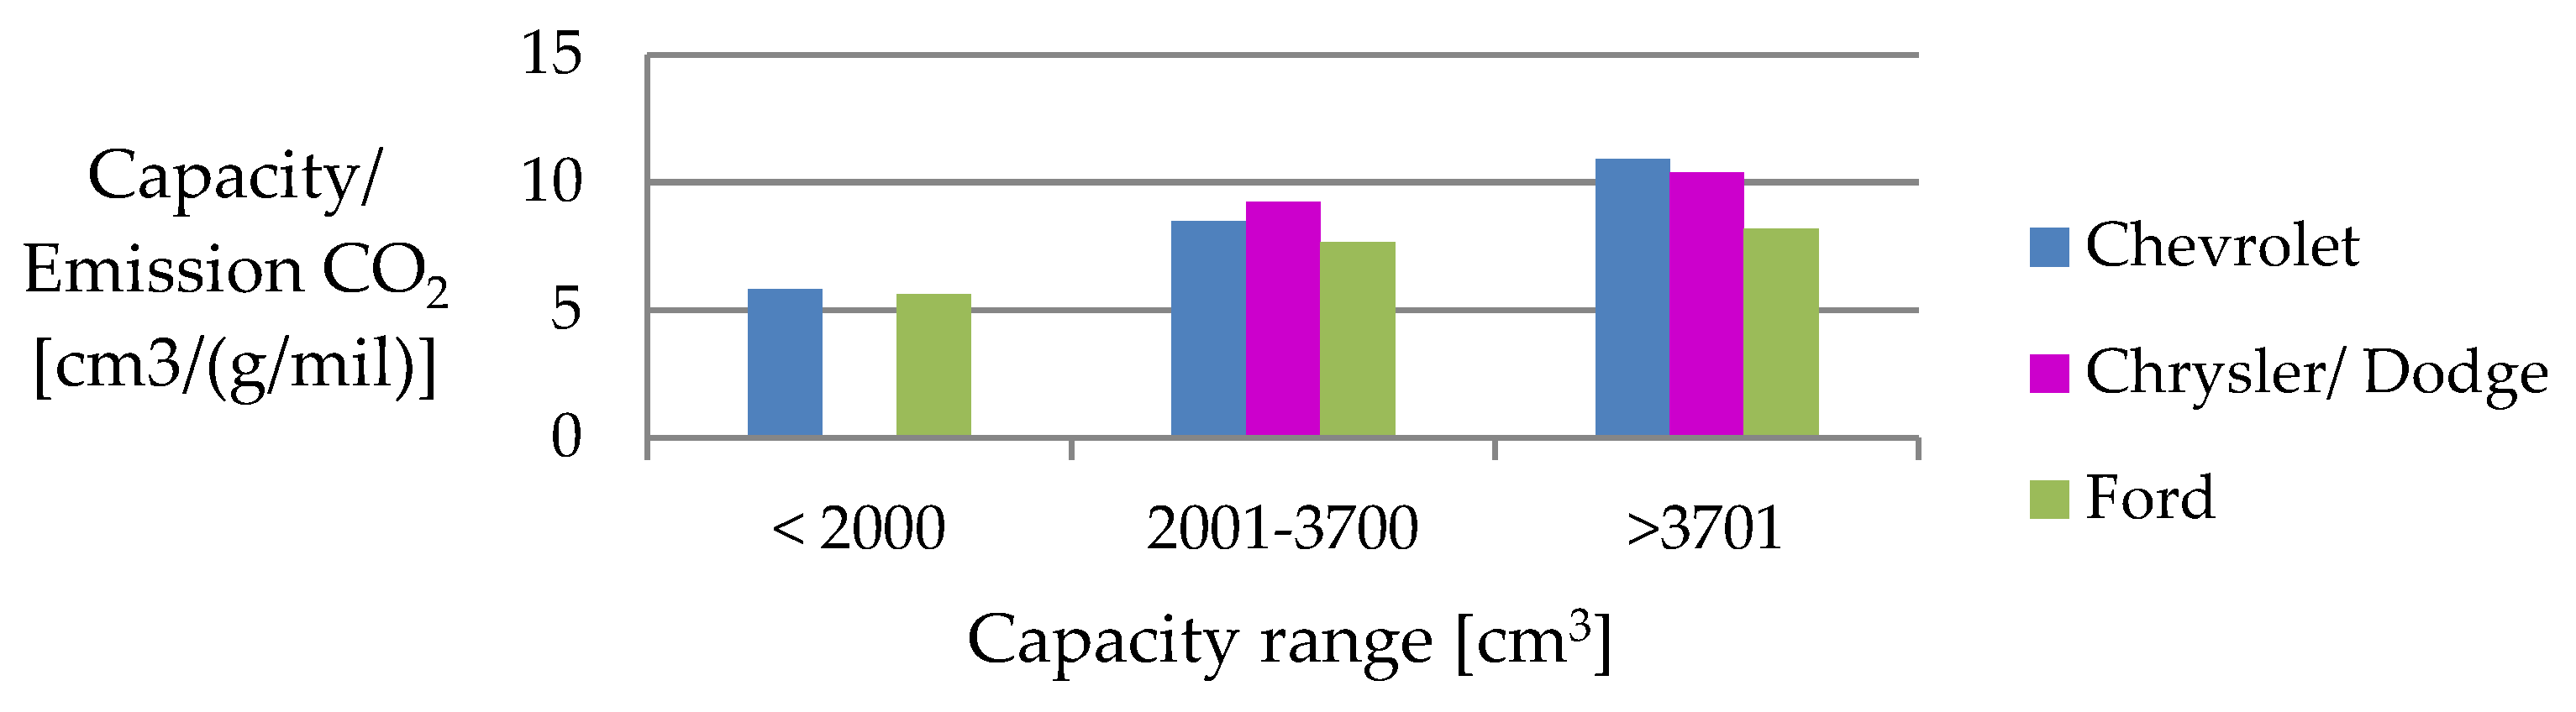
- Based on the Figure 2, Figure 3, Figure 4, Figure 5, Figure 6, Figure 7, Figure 8, Figure 9, Figure 10, Figure 11, Figure 12, Figure 13, Figure 14, Figure 15, Figure 16, Figure 17, Figure 18 and Figure 19 above, it can be concluded that:
- Toyota engines are as economical as engines from other manufacturers, but they have little power;
- Mercedes-Benz engines have the highest fuel consumption, but they are adequately strong;
- in the range below 1000 cm3, CO2 emissions and combustion, and therefore also the ratio of engine capacity-combustion-CO2 emissions, is at a very even level, while the difference in power is due to the use of a turbocharger;
- in the range from 1001 cm3 to 1500 cm3, VW, Hyundai/KIA and Honda have a high power-to-combustion ratio;
- in the range from 1501 cm3 to 2000 cm3, Mercedes-Benz and Honda have the highest power-to-combustion ratio;
- in the range above 2001 cm3, few manufacturers have engines with this capacity, but they have better power-to-emission ratios;
- based on the above data, it can be concluded that the Ford brand has the most optimized engines.
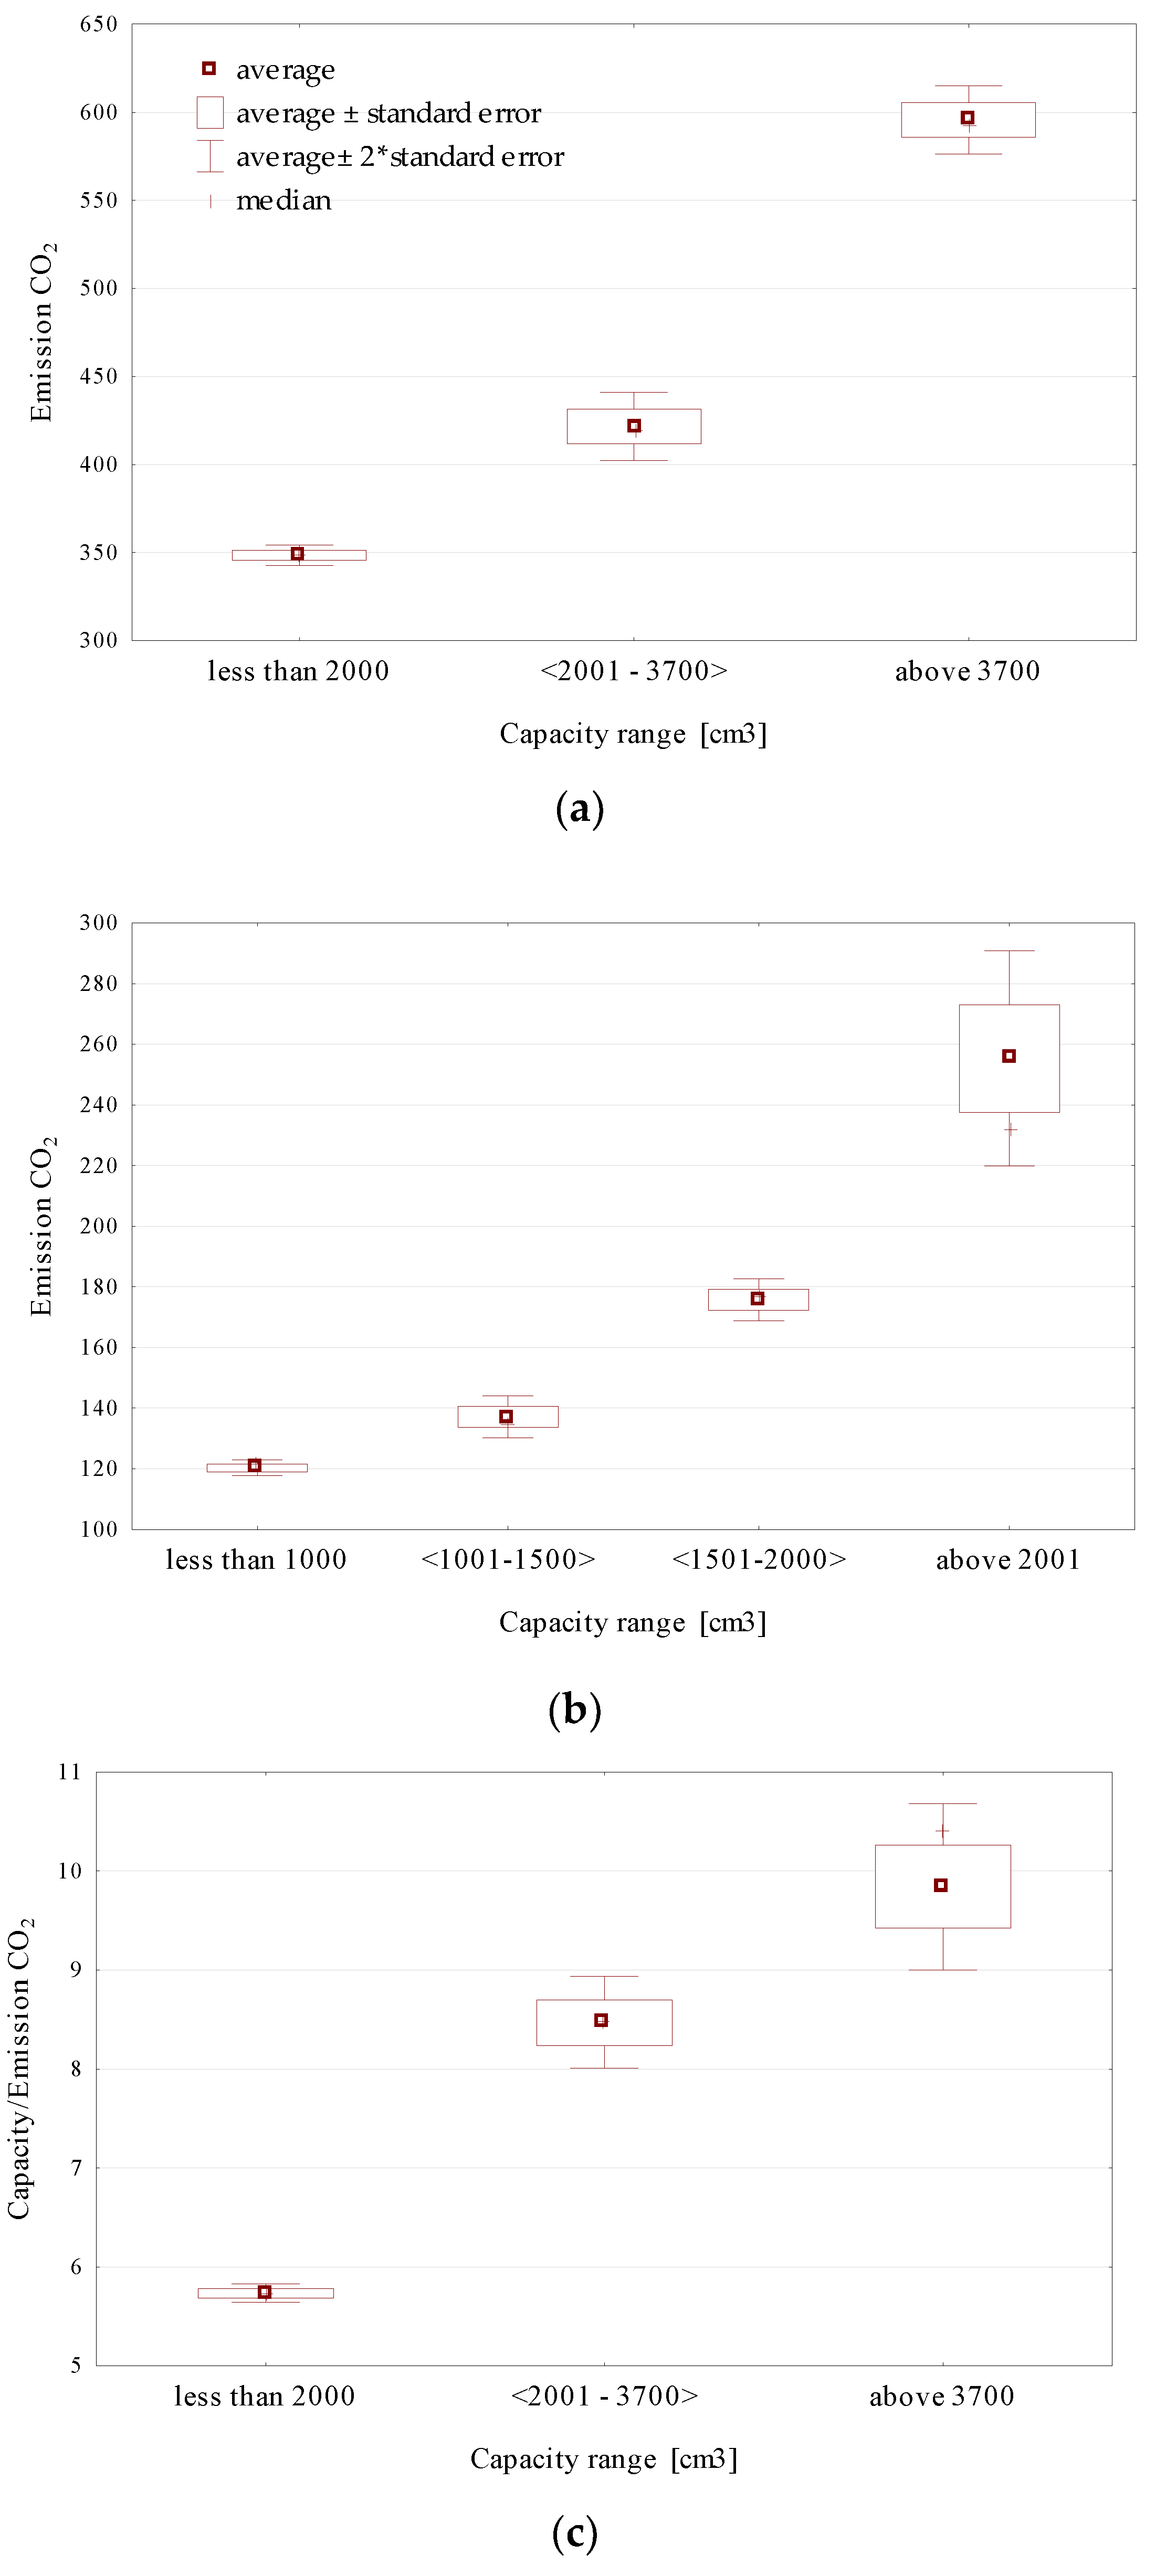
- When analyzing Figure 20a,c,e and Table 5, it can be noticed that there are no statistically significant differences in the levels of the variable (p-value > 0.05):
- Emission CO2 and Power/Emission CO2 between cars with the smallest (less than 2000) and average (<2001–3700>) engine displacement;
- Capacity/Emission CO2 between cars with medium (<2001–3700>) and highest (above 3701) engine displacement.
- On the other hand, the analysis of Figure 20b,d,f and Table 6 proves that there are no statistically significant differences in the levels of the variable:
- Emission CO2 and Power/Emission CO2 between cars with the smallest (less than 2100) and category <2001–3700> engine displacement and between the highest (above 2001) and category <1501–2000> engine displacement;
- Capacity/Emission CO2 between cars of category (<1001–1500>) and <1501–2000> of engine displacement.
8. Summary
Author Contributions
Funding
Institutional Review Board Statement
Informed Consent Statement
Conflicts of Interest
References
- KOBiZE. National Emission Balance of SO2, NOx, CO, NH3, NMVOC, Dust, Heavy Metals and POPs for the Years 2013–2014; KOBiZE: Warsaw, Poland, 2016. [Google Scholar]
- Łyko, P.; Śliwka, M.; Pomykała, R. The use of CNG and biomethane in transport-good practices from selected European Union countries. Logistics 2014, 4, 4628–4632. [Google Scholar]
- Kyć, K. Clean urban transport-implementation and testing of integrated technology packages and strategies in the field of energy and transport on the example of the Caravel/Civitas II project. In Proceedings of the Materials of the Krakow Conference of Young Scholars 2007, Krakow, Poland, 23 May 2007; pp. 125–134. [Google Scholar]
- Chłopek, Z. Motor Vehicles. In Environmental Protection; Wydawnictwa Komunikacji i Łączności: Warsaw, Poland, 2002. [Google Scholar]
- Kuranc, A.; Wasilewski, J. Proecological Trends In Development of Piston Combustion Engines. Diesel Engines–New Chall. 2010, 2, 34–39. [Google Scholar]
- Merkisz, J.; Piekarski, W.; Nightingale, T. Automotive Environmental Pollution; Publishing House of the Agricultural Academy in Lublin: Lublin, Poland, 2005. [Google Scholar]
- Ajanovic, A.; Haas, R. Technological, ecological and economic perspectives for alternative automotive technologies up to 2050. In Proceedings of the 2012 IEEE Third International Conference on Sustainable Energy Technologies (ICSET), Kathmandu, Nepal, 24 September 2012; pp. 129–134. [Google Scholar]
- Fuć, P.; Merkisz, J.; Lijewski, P.; Bajerlein, M.; Ziółkowski, A.; Rymaniak, Ł.; Dobrzyński, M. Exhaust emission in NEDC test simulated at a dynamic engine test bed. Combust. Engines 2013, 154, 701–707. [Google Scholar]
- Trzensik, E.; Światłoń, M. The impact of the implementation of Euru 5 and Euro 6 emission standards on the automotive industry, in the aspect of implementing new technologies and increasing the cost of vehicle operation. Sci. Noteb. Sil. Univ. Technol. Transp. Ser. 2011, 72, 27–45. [Google Scholar]
- International Council on Clean Transport ICCT. NOX Emissions from Heavy-Duty and Light-Duty Diesel Vehicles in the EU: Comparison of Real-World Performance and Current Type-Approval Requirements; International Council on Clean Transport ICCT: São Paulo, Brazil, 2016. [Google Scholar]
- Franco, V.; Kousoulidou, M.; Muntean, M.; Ntziachristos, L.; Hausberger, S.; Dilara, P. Road Vehicle Emission Factors Development: A Review. Atmos. Environ. 2013, 70, 84–97. [Google Scholar] [CrossRef]
- Kousoulidou, M.; Fontaras, G.; Ntziachristos, L.; Bonnel, P.; Samaras, Z.; Dilara, P. Use of Portable Emissions Measurement System (PEMS) for the Development and Validation of Passenger Car Emission Factors. Atmos. Environ. 2013, 64, 329–338. [Google Scholar] [CrossRef]
- Pielecha, J.; Merkisz, J.; Stojecki, A. Measurements of Particles Mass, Number and Size Distribution from Light-Duty Vehicles in Conditions of Variable Terrain Topography. In Proceedings of the 19th ETHConference on Combustion Generated Nanoparticles, Zürich, Switzerland, 29 June–1 July 2015. [Google Scholar]
- Weiss, M.; Bonnel, P.; Hummel, R.; Provenza, A.; Manfredi, U. On-Road Emissions of Light-Duty Vehicles in Europe. Environ. Sci. Technol. 2011, 45, 8575–8581. [Google Scholar]
- Suarez-Bertoa, R.; Kousoulidou, M.; Clairotte, M.; Giechaskiel, B.; NuottimĂki, J.; Sarjovaara, T.; Lonza, L. Impact of HVO blends on modern diesel passenger cars emissions during real world operation. Fuel 2019, 235, 1427–1435. [Google Scholar]
- Car Catalog-Specifications, Tests, Reviews. Available online: https://www.autokult.pl/ (accessed on 10 July 2022).
- Radlińska, K.; Klonowska-Matynia, M.; Jakubowska, A.; Kwiatkowski, G. Labor hoarding: An old phenomena in modern times? Case study for EU countries. J. Bus. Econ. Manag. 2020, 21, 872–889. [Google Scholar] [CrossRef]
- Regulation of the Minister of Infrastructure on the scope and manner of conducting technical tests and templates of documents used in these tests. J. Laws 2003, 227, 2250.
- European Union. Commission Regulation (EU) 2016/427 of 10 March 2016 Amending Regulation (EC) No 692/2008 as Regards Emissions from Light Passenger and Commercial Vehicles (Euro 6), 2016; European Union: Mestreech, The Netherlands, 2016. [Google Scholar]
- European Union. Commission Regulation (EU) 2016/646 of 20 April 2016 Amending Regulation (EC) No 692/2008 as Regards Emissions from Light Passenger and Commercial Vehicles (Euro 6), 2016; European Union: Mestreech, The Netherlands, 2016. [Google Scholar]
- European Union. Commission Regulation (EC) 692/2008 of 18 July 2008 Implementing and Amending Regulation (EC) No 715/2007 of the European Parliament and of the Council on Type-Approval of Motor Vehicles with Respect to Emissions from Light Passenger and Commercial Vehicles (Euro 5 and Euro 6) and on Access to Vehicle Repair and Maintenance Information, 2008; European Union: Mestreech, The Netherlands, 2008. [Google Scholar]
- European Union. Regulation (EU) 2018/842 of the European Parliament and of the Council of 30 May 2018 on Binding Annual Greenhouse Gas Emission Reductions by Member States from 2021 to 2030 Contributing to Climate Action to Meet Commitments under the Paris Agreement and Amending Regulation (EU) No 525/2013; European Union: Mestreech, The Netherlands, 2018. [Google Scholar]
- UNECE. UNECE Regulation No. 83–Revision 5. Uniform Provisions Concerning the Approval of Vehicles with Regard to the Emission of Pollutants According to Engine Fuel Requirements; UNECE: Geneva, Switzerland, 2015. [Google Scholar]
- Merkisz, J. Methods of reducing emission from HDV Euro VI engines. Combust. Engines 2015, 162, 480–486. [Google Scholar]
- EU Commission. Report from the EU Commission to the European Parliament and the Council pursuant to Article 9 of Directive 98/70/EC Relating to the Quality of Petrol and Diesel Fuels; EU Commission: Brussels, Belgium, 2017.
- European Union. Regulation (EU) 2019/631 of the European Parliament and of the Council of 17 April 2019 Setting CO2 Emission Performance Standards for New Passenger Cars and for New Light Commercial Vehicles and Repealing Regulations (EC) No 443/2009 and (EU) No 510/2011; European Union: Mestreech, The Netherlands, 2019. [Google Scholar]
- Merkisz, J. Ecological Problems of Internal Combustion Engines; Wydawnictwo Politechniki Poznańskiej: Poznań, Poland, 1998; Volume I. [Google Scholar]
- European Union. Regulation (EC) No 443/2009 of the European Parliament and of the Council of 23 April 2009 Setting Emission Performance Standards for New Passenger Cars as Part of the Community’s Integrated Approach to Reduce CO2 Emissions from Light Commercial Vehicles; European Union: Mestreech, The Netherlands, 2009. [Google Scholar]
- Król, E.; Skęczek, W. City bus with diesel-electric drive. Results of road tests. Electr. Mach.–Probl. Noteb. 2015, 2, 123. [Google Scholar]
- Drozdż, W.; Lewicki, W.; Wróblewski, P.; Miązek, P. Methodology for Assessing the Impact of Aperiodic Phenomena on the Energy Balance of Propulsion Engines in Vehicle Electromobility Systems for Given Areas. Energies 2021, 14, 2314. [Google Scholar]
- Popp, J.; Kot, S.; Lakner, Z.; Oláh, J. Biofuel use: Peculiarities and implications. J. Secur. Sustain. Issues 2018, 7, 477–493. [Google Scholar]
- Mishchuk, H.; Grishnova, O. Empirical study of the comfort of living and working environment–Ukraine and Europe: Comparative assessment. J. Int. Stud. 2015, 8, 67–80. [Google Scholar] [CrossRef]
- Kwarciński, T.; Ulman, P. Quality of life paradox. Well-being ranking of the selected European countries based on hybrid well-being approach. Econ. Sociol. 2020, 13, 160–180. [Google Scholar] [CrossRef]
- Tvaronavičienė, M.; Mazur, N.; Mishchuk, H.; Bilan, Y. Quality of life of the youth: Assessment methodology development and empirical study in human capital management. Econ. Res.-Ekon. Istraživanja 2021, 35, 1088–1105. [Google Scholar] [CrossRef]
- Zielińska, A. A comparative analysis of reverse logistics implementation for waste management in Poland and other European Union countries. J. Int. Stud. 2020, 13, 171–183. [Google Scholar] [CrossRef]
- López Calle, P.; Rísquez Ramos, M.; Ruiz-Gálvez, M.E. Analysis of the effects of the modular design model of car production on working conditions: The cases of VW Navarra and PSA Vigo. Econ. Sociol. 2020, 13, 90–101. [Google Scholar] [CrossRef]
- Streimikiene, D. Energy poverty and impact of COVID-19 pandemics in Visegrad (V4) countries. J. Int. Stud. 2022, 15, 9–25. [Google Scholar] [CrossRef]
- Owczarski, T.; Rakowski, P. Analysis of Possible National Legal Solutions in Relation to the Applicable European Union Law and Proposed Directions of Action; Unii Europejskiej: Warsaw, Poland, 2021. [Google Scholar]
- Merkisz, J.; Radzimirski, S. Current state and anticipated changes in European regulations on pollutant emissions from trucks and buses. Road Transp. 2009, 3, 45–56. [Google Scholar]
- Merkisz, J.; Pielecha, J.; Radzimirski, S. Pragmatic Foundations of Atmospheric Air Protection in Road Transport; Poznan University of Technology Publishing House: Poznan, Poland, 2009. [Google Scholar]
- ECE/TRAN/2005/124/4, ECE/TRAN/2005/124/4/ Amend.1, ECE/TRAN/2005/124/4/ Amend.2; GTR No. 4-Test Procedure for Compression-Ignition (C.I.) Engines and Positive-Ignition (P.I.) Engines Fuelled with Natural Gas (NG) or Liquefied Petroleum Gas (LPG) with Regard to the Emission of Pollutants (WHDC). Economic Commission for Europe: Geneva, Switzerland, 2005.
- ECE/TRAN/2005/124/5; GTR No. 5–Technical Requirements for On-Board Diagnostic Systems (OBD) for Road Vehicles. Economic Commission for Europe: Geneva, Switzerland, 2022.
- Łyszczarz, B.; Sowa, K. Production losses due to mortality associated with modifiable health risk factors in Poland. Eur. J. Health Econ. 2022, 23, 33–45. [Google Scholar] [CrossRef]
- Engine & Emission Technology Online–Sine 1997. Available online: https://www.dieselnet.com/ (accessed on 22 July 2021).
- Wróblewski, P.; Lewicki, W. A Method of Analyzing the Residual Values of Low-Emission Vehicles Based on a Selected Expert Method Taking into Account Stochastic Operational Parameters. Energies 2021, 14, 6859. [Google Scholar] [CrossRef]
- Romaniszyn, K.M. Alternative Fuel Supply for Cars with Petrol, LPG and CNG Gases; Wydawnictwa Naukowo-Techniczne: Warsaw, Poland, 2007. [Google Scholar]
- Rychter, T.; Teodorczyk, A. Theory of Piston Engines; Wydawnictwa Komunikacji i Łączności: Warsaw, Poland, 2006. [Google Scholar]
- Ubysz, A. Współczesne Silnik Samochodowe; Wydawnictwo Politechniki Śląskiej: Gliwice, Poland, 2003. [Google Scholar]
- Wajand, J.A.; Wajand, J.T. Piston Internal Combustion Engines Medium and High Speed; Wydawnictwa Naukowo-Techniczne: Warsaw, Poland, 2005. [Google Scholar]


| Standard | Entry into Force | Carbon Monoxide Emissions [g/km] | Emissions of Hydrocarbons [g/km] | Emission of Volatile Organic Compounds [g/km] | Emissions of Nitrogen Oxides [g/km] | NOx Emissions + Hydrocarbons [g/km] | Particulate Emissions [g/km] | Solid Particle Number [1/km] |
|---|---|---|---|---|---|---|---|---|
| Euro 1 | July 1992 | 2.72 | 0.97 | |||||
| Euro 2 | January 1996 | 2.2 | 0.5 | |||||
| Euro 3 | January 2000 | 2.3 | 0.20 | 0.15 | (0.35) | |||
| Euro 4 | January 2005 | 1.0 | 0.10 | 0.08 | (0.35) | |||
| Euro 5a | September 2009 | 1.0 | 0.10 | 0.068 | 0.060 | (0.18) | 0.005 | |
| Euro 5b | September 2011 | 1.0 | 0.10 | 0.068 | 0.060 | (0.16) | 0.0045 | |
| Euro 6b | September 2014 | 1.0 | 0.10 | 0.068 | 0.060 | (0.16) | 0.0045 | 6 × 10¹¹ |
| Euro 6c | 1.0 | 0.10 | 0.068 | 0.060 | (0.16) | 0.0045 | 6 × 10¹¹ | |
| Euro 6d −Temp | September 2017 | 1.0 | 0.10 | 0.068 | 0.060 | (0.16) | 0.0045 | 6 × 10¹¹ |
| Euro 6d | January 2020 | 1.0 | 0.10 | 0.068 | 0.060 | (0.16) | 0.0045 | 6 × 10¹¹ |
| Euro 7 | (2025) | (1.0) | (0.030) | (0.13) |
| Parameters | UDC | EUDC | NEDC |
|---|---|---|---|
| Distance (km) | 0.99 | 6.96 | 10.93 |
| Total time (s) | 195.00 | 400.00 | 1180.00 |
| Idle speed(s) | 57.00 | 39.00 | 267.00 |
| Average speed (km/h) | 18.35 | 62.59 | 33.35 |
| Average travel speed (km/h) | 25.93 | 69.36 | 43.10 |
| Maximum speed (km/h) | 50.00 | 120.00 | 120.00 |
| Category | Power/Weight Ratio (W/kg) | Maximum Speed (km/h) | Speed Tests |
|---|---|---|---|
| Class 3b | more than 34 | from 120 | Low 3 + Average 3–2 + High 3–2 + Very high 3 |
| Class 3a | less than 120 | Low 3 + Average 3–1 + High 3–1 + Very high 3 | |
| Class 2 | above 22 to 34 | - | Low 2 + Average 2 + High 2 + Very high 2 |
| Class 1 | up to 22 | - | Low 1 + Average 1 |
| Variables | Personal Cars | |||
|---|---|---|---|---|
| European and Asian | American | |||
| Test Kruskal-Wallisa | ||||
| Value of the Statistic | p-Value | Value of the Statistic | p-Value | |
| Emission CO2 | 56.197 | 0.0000 | 20.536 | 0.0000 |
| Capacity/Emission CO2 | 46.892 | 0.0000 | 15.424 | 0.0004 |
| Power/Emission CO2 | 56.197 | 0.0000 | 20.536 | 0.0000 |
| Category | Less than 2000 | <2001–3700> | Above 3701 | Variables |
|---|---|---|---|---|
| less than 2000 | 0.1325 | 0.0000 | Emission CO2 | |
| <2001–3700> | 0.1325 | 0.0208 | ||
| above 3701 | 0.0000 | 0.0208 | ||
| less than 2000 | 0.0324 | 0.0003 | Capacity/Emission CO2 | |
| <2001–3700> | 0.0324 | 0.4008 | ||
| above 3701 | 0.0003 | 0.4008 | ||
| less than 2000 | 0.1325 | 0.0000 | Power/Emission CO2 | |
| <2001–3700> | 0.1325 | 0.0208 | ||
| above 3701 | 0.0000 | 0.0208 |
| Category | Less than 1000 | <1001–1500> | <1501–2000> | Above 2001 | Variables |
|---|---|---|---|---|---|
| less than 1000 | 0.0735 | 0.0000 | 0.0000 | Emission CO2 | |
| <1001–1500> | 0.0735 | 0.0054 | 0.0000 | ||
| <1501–2000> | 0.0000 | 0.0054 | 0.2496 | ||
| above 2001 | 0.0000 | 0.0000 | 0.2496 | ||
| less than 1000 | 0.0000 | 0.0000 | 0.0000 | Capacity/Emission CO2 | |
| <1001–1500> | 0.0000 | 1.0000 | 0.0318 | ||
| <1501–2000> | 0.0000 | 1.0000 | 0.0375 | ||
| above 2001 | 0.0000 | 0.0318 | 0.0375 | ||
| less than 1000 | 0.0735 | 0.0000 | 0.0000 | Power/Emission CO2 | |
| <1001–1500> | 0.0735 | 0.0054 | 0.0000 | ||
| <1501–2000> | 0.0000 | 0.0054 | 0.2496 | ||
| above 2001 | 0.0000 | 0.0000 | 0.2496 |
Publisher’s Note: MDPI stays neutral with regard to jurisdictional claims in published maps and institutional affiliations. |
© 2022 by the authors. Licensee MDPI, Basel, Switzerland. This article is an open access article distributed under the terms and conditions of the Creative Commons Attribution (CC BY) license (https://creativecommons.org/licenses/by/4.0/).
Share and Cite
Rabe, M.; Jakubowska, A.; Draskovic, V.; Widera, K.; Pudło, T.; Łopatka, A.; Kuźmiński, Ł. Comparative Analysis on the Performance and Exhaust Gas Emission of Cars with Spark-Ignition Engines. Energies 2022, 15, 6361. https://doi.org/10.3390/en15176361
Rabe M, Jakubowska A, Draskovic V, Widera K, Pudło T, Łopatka A, Kuźmiński Ł. Comparative Analysis on the Performance and Exhaust Gas Emission of Cars with Spark-Ignition Engines. Energies. 2022; 15(17):6361. https://doi.org/10.3390/en15176361
Chicago/Turabian StyleRabe, Marcin, Agnieszka Jakubowska, Veselin Draskovic, Katarzyna Widera, Tomasz Pudło, Agnieszka Łopatka, and Łukasz Kuźmiński. 2022. "Comparative Analysis on the Performance and Exhaust Gas Emission of Cars with Spark-Ignition Engines" Energies 15, no. 17: 6361. https://doi.org/10.3390/en15176361
APA StyleRabe, M., Jakubowska, A., Draskovic, V., Widera, K., Pudło, T., Łopatka, A., & Kuźmiński, Ł. (2022). Comparative Analysis on the Performance and Exhaust Gas Emission of Cars with Spark-Ignition Engines. Energies, 15(17), 6361. https://doi.org/10.3390/en15176361