Article

Foam-Assisted Capillary Trapping in Saline Aquifers—An Initial–Residual Saturation Analysis

Center for Integrative Petroleum Research, College of Petroleum Engineering and Geosciences, King Fahd University of Petroleum & Minerals, Dhahran 31261, Saudi Arabia
*
Author to whom correspondence should be addressed.
Energies 2022, 15(17), 6305; https://doi.org/10.3390/en15176305
Submission received: 15 May 2022 / Revised: 14 June 2022 / Accepted: 20 June 2022 / Published: 29 August 2022
(This article belongs to the Section H: Geo-Energy)

Abstract

:
Capillary trapping of gas in porous media is important for many processes such as oil recovery and gas geo-sequestration. Foam can mitigate gravity override and viscous fingering of gas by reducing its relative permeability through gas trapping. However, there are limited studies dedicated to understanding how foam assists in gas trapping, the best mode of foam injection for trapping, and its application in geo-sequestration. This paper uses an initial–residual saturation analysis to investigate foam-assisted capillary trapping during the surfactant alternating gas (SAG) injection process in saline aquifers. More specifically, we studied the effects of pore geometric properties, in situ generated foam, and surfactant concentration on gas trapping efficiency and final residual gas saturation, Sgr. First, NMR surface relaxometry measurements were carried out on the rock samples to indicate the mean pore sizes of the rocks. A series of core flooding tests, equipped with resistivity measurements, were then conducted using single-cycle gas injection followed by water injection, water alternating gas (WAG), and SAG injection methods to identify which mode of injection results in the most trapped gas. The results showed that the SAG method had a better sweep efficiency and trapped more gas than other methods. The initial–residual (IR) gas saturation relationships from SAG data measured from several rock samples were then analyzed using Land’s trapping model. Gas trapping efficiency (indicated by Land’s coefficient, C) and residual gas were also found to increase in rocks with large average pore sizes and with increasing surfactant concentration. However, increasing the surfactant concentration above a certain limit did not cause further improvement in the trapping coefficient but only increased the Sgr. The results also showed that high values of surfactant concentrations might cause a slight reduction in the foam’s apparent viscosity, which then reduces the initial gas saturation, and consequently, Sgr. Finally, a linear relationship between the Sgr and the measured log mean of surface relaxation times (T2LM) was obtained, and two correlations were proposed. Therefore, the NMR measurements can be considered a reliable prediction method for Sgr in porous media.

1. Introduction

Gas injection in underground formations has several potential applications that have proven successful over the decades. The injection of gases such as carbon dioxide, nitrogen, and methane, in oil reservoirs as a gas-enhanced oil recovery (gas EOR) method has shown significant improvements in oil recovery when compared to primary and secondary recovery methods [1]. Among the gas EOR methods, CO2-EOR provides an additional advantage as CO2 is stored in subsurface geological units during the oil recovery process [2,3]. Since CO2 is the main greenhouse gas that causes global warming, which leads to a noticeable increase in the temperature of the Earth, carbon capture and storage (CCS) projects are of wide interest to permanently store CO2 in geological porous media and reduce anthropogenic CO2 concentrations in the atmosphere [4]. CO2 can be safely stored in various underground reservoirs such as hydrocarbon reservoirs, saline aquifers, unminable coal beds, and shale formations. Among the available geological formations for CO2 sequestration, saline aquifers have the highest storage capacity. Furthermore, the depth of saline aquifers, which is usually greater than 800 m, makes the injected CO2 take on a supercritical state; hence, CO2 will have a high solubility in brine and occupy a less volume compared to its volume under atmospheric conditions [5]. In addition to CO2-geosequestration, hydrogen injection into geological formations (H2 geo-storage) is currently proposed for storing large quantities of hydrogen gas in suitable reservoirs, including salt caverns, saline aquifers, and depleted oil and gas reservoirs [6]. However, the main difference between the storage process of the two gases, i.e., CO2 and H2, is that hydrogen is stored for mid to long periods during H2 geo-storage and then withdrawn again at any time based on the demand [7]. On the other side, the main target of CO2 sequestration projects is to permanently store CO2 underground through various trapping mechanisms.
The gas storage process in underground formations is mainly controlled by various trapping mechanisms that are dependent on rock and fluid properties [8]. Hence, it is essential to understand the gas trapping mechanisms that occur in a specific reservoir to be able to accurately predict the performance of gas storage projects. Structural trapping of the injected gas is the primary trapping mechanism that is responsible for gas storage. The low gas density, compared to reservoir fluids, causes the upward migration of the injected gas to the top part of the reservoir. The gas continues to migrate upward by the effect of buoyancy forces until being trapped by an impermeable cap rock. Therefore, the structural trapping depends on cap rock properties, injected fluid properties, and operating conditions. The injected gas can have a high solubility into reservoir fluids. For instance, during CO2 sequestration, the diffusion and dissolution of the injected CO2 into the reservoir fluids leads to safe CO2 storage which is known as the solubility trapping mechanism [9,10,11]. Mineral trapping is also an important trapping mechanism in highly reactive reservoirs as the injected gas reacts with both reservoir fluids and rock components to generate solid minerals over a large time scale. Mineral trapping is more pronounced during CO2 sequestration in saline aquifers. The injected CO2 will diffuse and dissolve into the reservoir brine, which causes the formation of carbonic acid. Subsequently, the carbonic acid dissociates and reacts with the reservoir rock. This process will end up storing the injected CO2 in the form of solid minerals. The injected gas can also become immobile after being injected into an underground reservoir by the effect of capillary forces, which is known as the capillary or residual trapping process. The capillary trapping process is known to be an effective and quick gas trapping method [12]. During CO2 injection, the propagating CO2 plume can be displaced by natural groundwater, which causes gas capillary trapping. The injection of chase water after CO2 was injected was also found to be effective in terms of gas storage due to the residual trapping mechanism [13].
Capillary trapping was found to be a significant physical trapping mechanism that controls not only the dynamics of gas injection in porous media but also the efficiency of gas storage in underground reservoirs [14,15]. Several laboratory, simulation, and field studies have shown that pore-scale saturation of the residually trapped gas in a porous medium after the imbibition process, Sgr, is proportional to the maximum initial gas saturation, Sgi, that could be achieved during the gas injection, i.e., the drainage process [16,17,18,19]. However, no clear trend can describe the relationship between initial and residual gas saturations for various types of rocks under different operating conditions [20,21]. Previous studies investigating the residual trapping of gases in porous media have shown that the residual saturation of gas, Sgr, is controlled by numerous factors, including the wetting phase injection method, i.e., forced or spontaneous imbibition [20], type and injection rate of wetting phase [19], operating pressure and temperature [19], interfacial tensions and wettability of the rock [17,21], rock type, pore sizes and structure, and petrophysical properties of the system [18,22,23], i.e., initial gas saturation, and rock porosity and permeability [24]. Several models have been developed to describe the relationship between the initial gas and the trapped gas saturations [25,26,27,28,29]. Among the available initial–residual (I-R) saturation relationships in the literature, Land’s model is one of the earliest and most applied models to accurately predict this relationship [25], as described by Equation (1).
S gr = S gi 1 +   C   S gi
where C is an empirical constant termed Land’s coefficient and is used to quantify the trapping strength of a rock–fluid system. In other words, a higher C coefficient indicates less trapping efficiency and vice versa. The Land’s coefficient is always greater than or equal to zero, and its typical range is mainly dependent on rock properties and rock–fluid interactions as well. Hence, each reservoir has a different range of the C coefficient [30].
Gas injection in oil field applications, e.g., gas-EOR, has some drawbacks that limit its application and reduce its efficiency in terms of improving the oil recovery. These drawbacks include gravity override due to the relatively low gas density if compared to reservoir fluids and viscous fingering as a result of the adverse mobility ratio of the injected gas. To improve the performance of the gas injection process in porous media and enhance its displacement efficiency, foam flooding has been proposed as an alternative to gas injection in different types of reservoirs. Foaming of the gas was found to reduce the gas mobility and increases the viscous force, i.e., increases pressure drop in the flow direction, that act against the adverse impact of gravity segregation, i.e., gravity force [31,32,33]. In general, foam can be generated with two main injection strategies, namely ex situ and in situ foam generation. Ex situ involves generating foam outside the porous medium before the process of injection, while in situ involves either co-injecting liquid and gas in a porous medium or by surfactant alternating gas (SAG) injection strategy [34,35]. It is worth mentioning here that the SAG injection strategy avoids some of the drawbacks of the co-injection method, such as minimizing the contact between water and gas in surface facilities that may lead to corrosion in some cases and avoiding the total blockage of porous media that may happen under the co-injection foam strategy [36]. As previously mentioned, foam reduces the mobility of gas in the porous media. This occurs because foam causes the trapping of the gas phase in the intermediate size pores in the case of water wet reservoirs, while the small pores are occupied by the wetting phase, i.e., the water phase [37]. The capillary forces in the porous medium are responsible for immobilizing large fractions of the foam bubbles. Previous studies demonstrated that the efficiency of foam injection mainly depends on the generation and stability of foam inside the porous medium that is mainly controlled by the physicochemical characteristics of the reservoir rock and the surfactant used to generate the foam [38,39]. Furthermore, the limiting capillary pressure, Pc*, of the foam influences foam texture and coalescence rate. The Pc* value is dependent on the surfactant concentration and rock properties [31]. It was found that above Pc*, foam films become unstable, and foam lamellae coalescence is noticeable. Consequently, the mobility of gas increases. Pc* value was found to increase with higher surfactant concentration [31,40]. Therefore, the concentration of the used surfactant in foam generation highly controls the performance of foam flooding. In summary, foam can cause a better liquid sweep efficiency when compared to gas injection in porous media and also causes gas trapping that extends foam injection to gas storage application. As it was previously discussed, better sweep efficiency leads to a higher initial gas saturation, and subsequently a higher residual gas saturation after an imbibition process.
The application of foam injection for gas storage purposes is not comprehensively investigated in the literature. Bernard [41] investigated the effect of foam injection on gas trapping and effective water permeability using various rock samples with different properties. His results showed that foam decreased the permeability to water due to the increase in the trapped gas saturation. Jones et al. [42] used a 2D glass microfluidic chip to study gas trapping during foam injection in a model porous medium. The foam was generated in their tests by co-injection of nitrogen gas and surfactant solution at various flow velocities. It was found that trapped gas saturation decreased with increasing both flow velocity and foam quality. They linked this conclusion to the observed foam structure at various flow rates. The same results were previously shown by Tang and Kovscek [43] during steady-state foam injection in a highly permeable Berea sandstone. Almajid and Kovscek [44] investigated foam generation mechanisms in porous media using a statistical pore network model. The snap-off and lamella division foam generation mechanisms were investigated in the pore network. Their results showed that the lamella division does not exist in 2D lattices but occurs in 3D lattices. Nevertheless, the probability of the snap-off is always greater than that of the lamella division in the 3D lattices. Their study provides a better understanding of gas trapping during foam injection. Recently, Adebayo [18,22] investigated the relationship between trapped foam saturation and various rock properties using different rock samples. His results showed that the trapped foam saturation is inversely proportional to the pore aspect ratio.
As illustrated above, the role of capillary trapping of injected gas is of key importance for gas sequestration projects. However, studies investigating the application of foam injection for gas storage purposes are very rare in the literature. Some previous studies investigated capillary trapping of gas in foam injection, i.e., co-injection of gas and surfactant, in porous media [38,42]. Nevertheless, there is a lack of understanding of factors affecting gas trapping during surfactant alternating gas (SAG) injection in porous media. Therefore, it is our objective to investigate foam-assisted capillary trapping in different types of rocks and using various surfactant concentrations during SAG injection. More specifically, the effects of rock pore geometric properties, in situ generated foam, and surfactant concentration on the gas trapping efficiency were studied by analyzing initial–residual (IR) saturation curves of SAG and WAG injection. To do so, several core flooding tests were conducted to investigate the capillary trapping of gas during SAG injection, and the results were compared to a single cycle surfactant alternating gas, and water alternating gas (WAG) injection processes, to highlight the effect of the generated foam on the gas trapping. Furthermore, the impact of the surfactant concentration on both final trapped gas saturation and the trend of initial–residual (IR) saturation curves was studied using Land’s model. The core flooding tests were performed using a core flooding system equipped with electrical resistivity measurements to detect dynamic changes in the in-situ saturation of fluids. Additionally, NMR T2 measurements were carried out for the rock samples used in the core flooding tests to indicate the mean pore sizes of the rocks. Section 2 in this paper describes the materials used in the tests, experimental setup, and procedures of the conducted tests. Additionally, the non-wetting phase trapping model, i.e., Land’s model, is briefly described in Section 2. In Section 3, the results of the conducted core flooding tests and NMR measurements are presented. The analyses of the IR saturation curves and factors affecting residual gas saturations in various types of rocks are also explained in detail in Section 3. Finally, Section 4 highlights the main findings and conclusions of this study.

2. Materials and Methods

2.1. Materials

A total of four core samples of different lithologies, porosity, and permeability were used in the core flooding tests. Table 1 show the dimensions and core properties of the used cylindrical outcrop rock samples. A detailed petrographic and digital rock analysis of these rock samples is provided elsewhere [18,22,45]. A synthetic brine, with compositions shown in Table 2, was prepared in the laboratory and used in the tests in the form of brine saturating the porous medium or used in preparing the surfactant solution. The surfactant solution was prepared by dissolving a nonionic ethoxylated fluorocarbon surfactant in the brine. Figure 1 show the chemical structure of the surfactant used in this study. The surfactant concentration varies between 0.05 wt% and 2.5 wt% in the core flooding tests. The gas used in generating foam during gas flooding is a nitrogen (N2) gas with 99.9% purity.

2.2. NMR Relaxometry

All the core samples were saturated with brine and prepared for NMR T2 measurements using a low magnetic field (2 MHz) benchtop NMR rock core analyzer. The scanning parameters of the NMR for τ, signal/noise ratio, and a recycle delay were 0.1 ms, 100, and 11,250 ms, respectively.

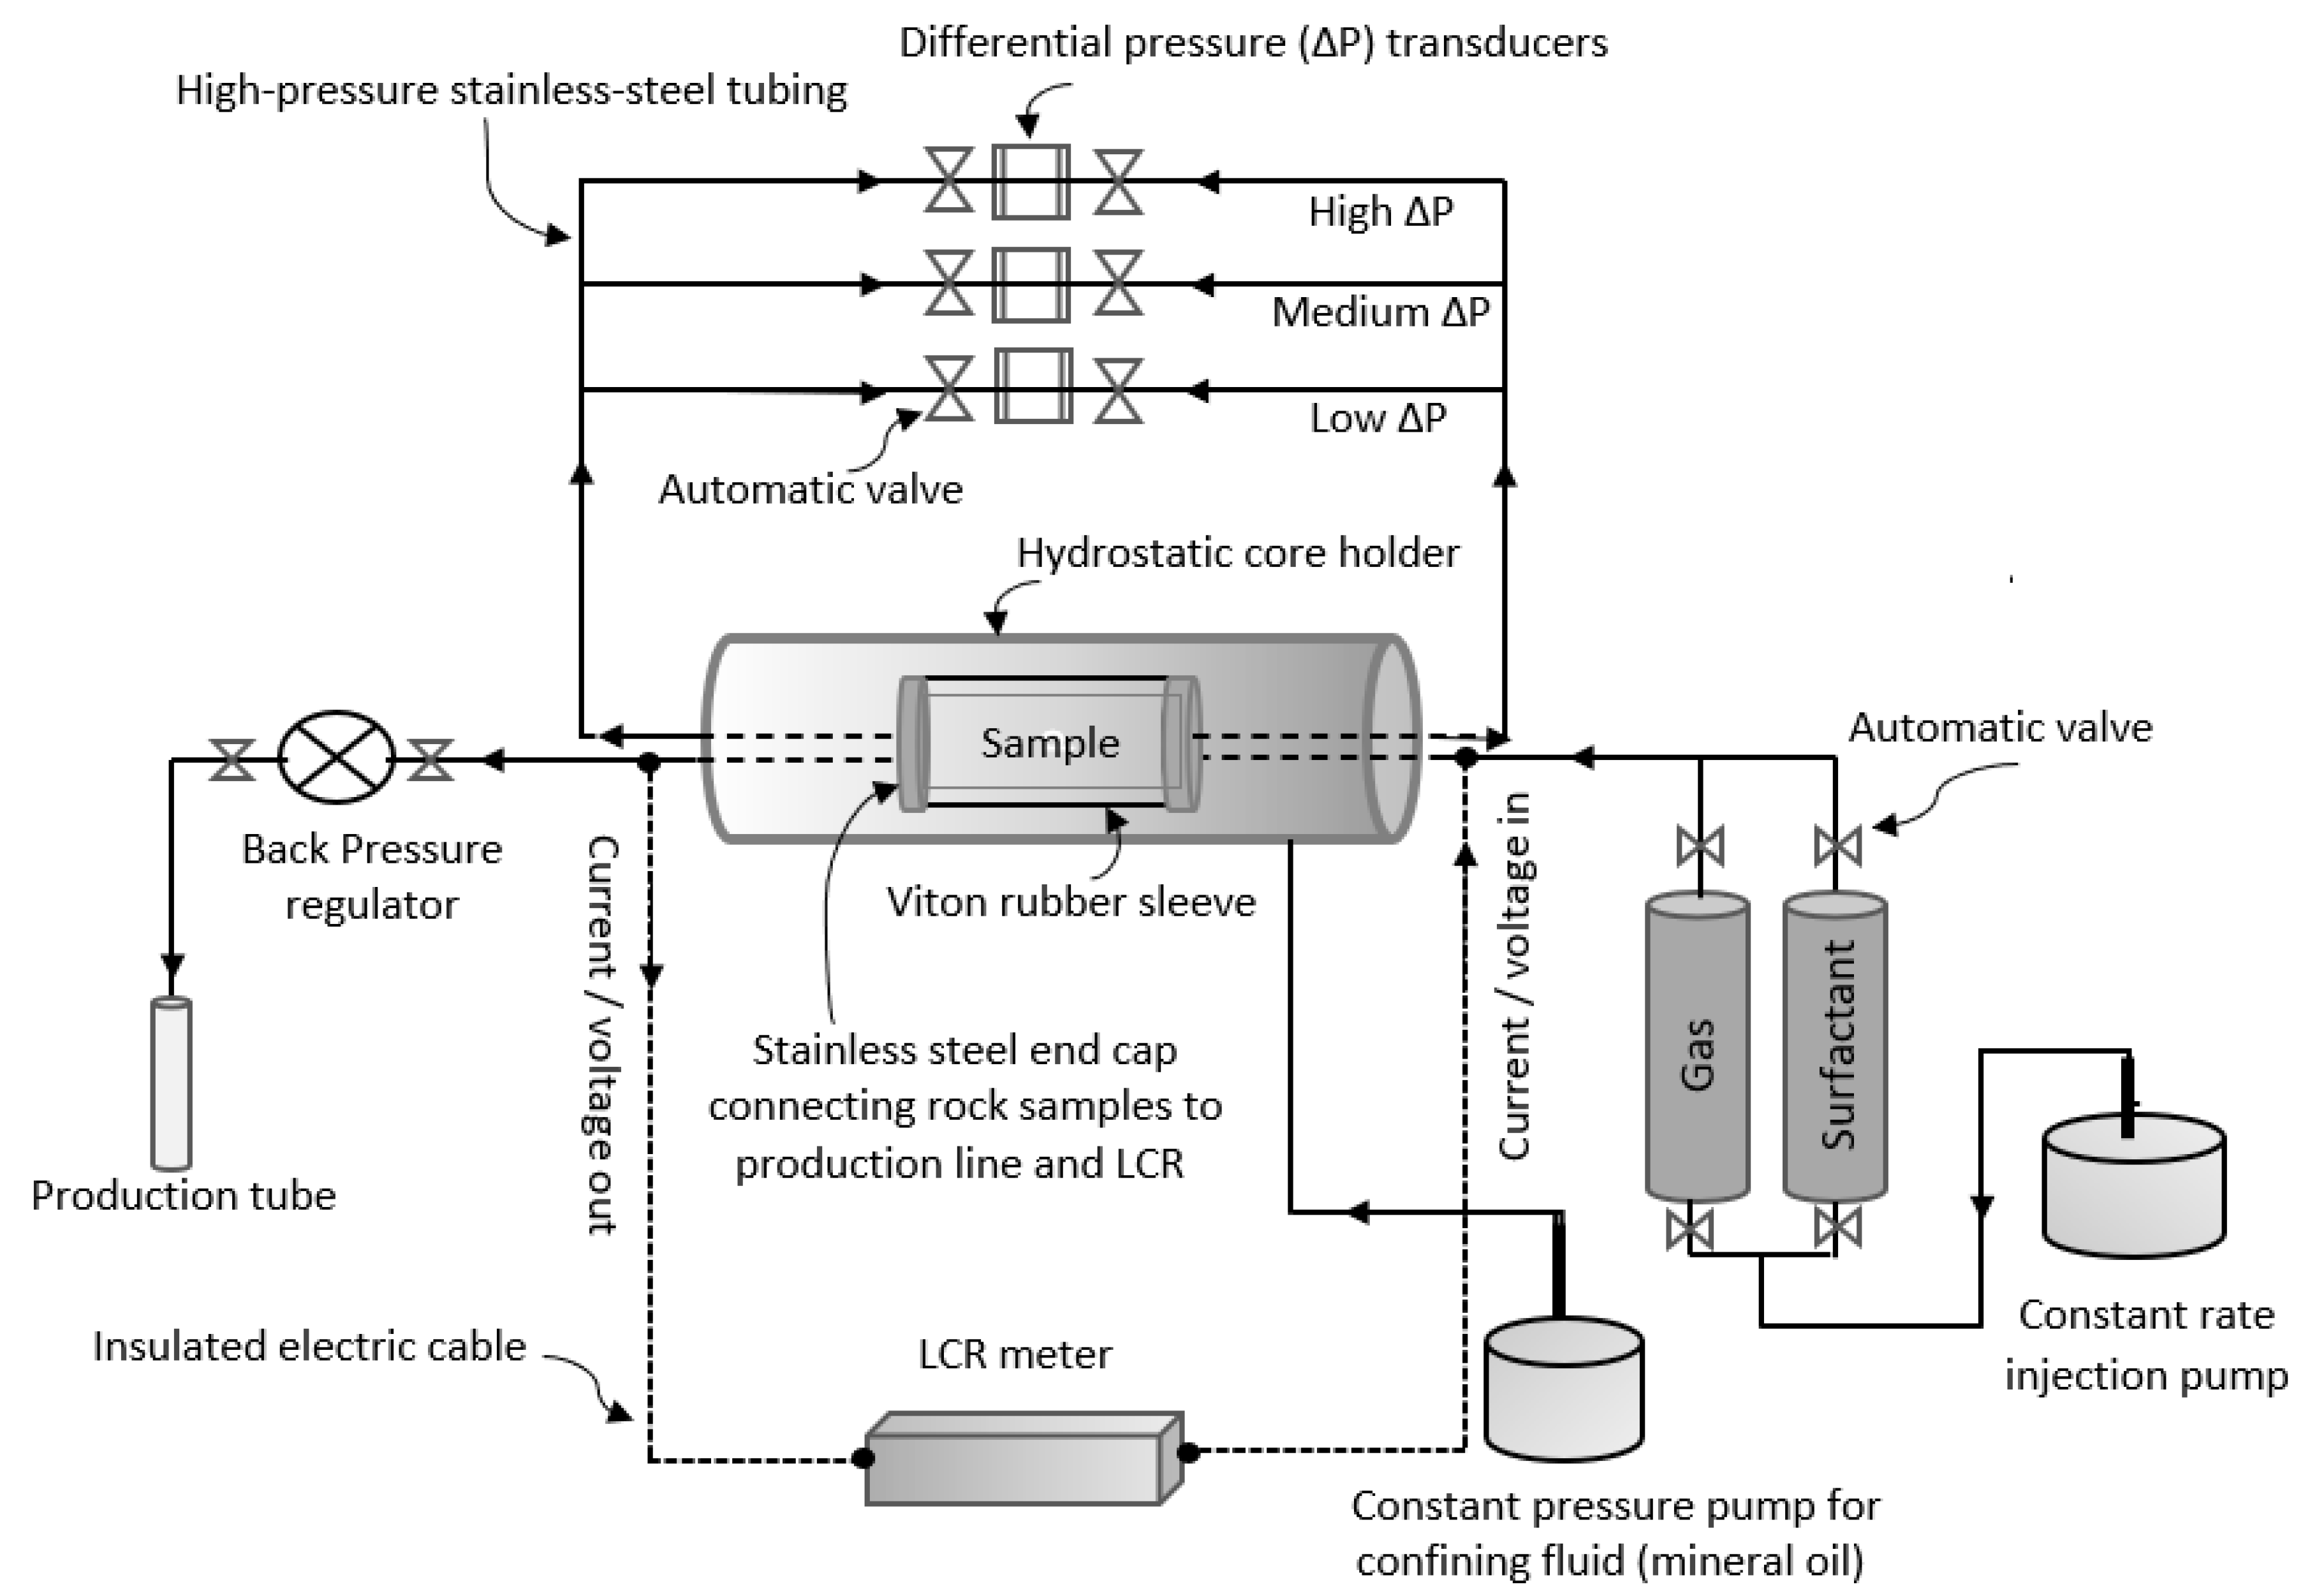
2.3. Core Flooding Setup

The core flooding system used to monitor in situ saturation changes during gas injection in a porous medium saturated with brine is depicted in Figure 2. The core flooding system is equipped with a four-pole electrical resistivity system to detect dynamic saturation changes during the injection process. The resistivity was measured by supplying an electric current through the core sample using the inductance-capacitance-resistance (LCR) meter shown in Figure 2. An injection pump was used to inject the stored fluids into two accumulators, i.e., nitrogen gas and surfactant, through the rock sample at the constant rate of 0.5 cc/min. The pressure of the system was controlled at 1450 psi using a back-pressure regulator, while a constant pressure pump was used to keep the confining pressure at 2200 psi by injecting a confining fluid, i.e., mineral oil, in the annular space between the core holder and a rubber sleeve where the core sample was fitted inside. The differential pressures across the sample were measured during the test using differential pressure transducers. All the data, including pressures, injection rates, injected fluid volumes, and electrical resistivities, were measured and recorded on a personal computer.

2.4. Experimental Procedure

After cleaning and drying the core samples, the porosity and the permeability of each sample were measured using helium gas (poro–perm measurements). The obtained values of porosities and permeabilities were previously shown in Table 1. The dried sample was then placed inside the core holder, and the pressure of the system was gradually built up by injecting the surfactant solution at the rate of 0.05 cc/min until the target pressure was achieved. It is important to highlight here that all the experiments were conducted at room temperature (T = 25 °C). The surfactant solution injection continued for several hours, with a low rate, to allow the adsorption of surfactant to take place before running the tests. The injection rate of surfactant was then increased to 0.5 cc/min and continued until the differential pressure and resistivity measurements showed constant values, i.e., a steady-state was reached. At this stage, the electrical resistivity of 100% saturated rock with the surfactant solution was measured and recorded, named as Ro value. It is important to mention here that the steady-state at 100% surfactant solution saturation is termed the “global steady state”, while the steady-state periods at partial surfactant solution saturations are termed “local steady states”. After reaching the global steady-state flow period, a slug of gas (between 0.1–0.2 PV) was flooded into the porous rock at the same constant rate. Thereafter, surfactant solution was injected until the local steady-state was achieved. This cyclic injection process lasted until a final steady-state (named here the second global steady-state) was achieved before termination of the test. The second global steady state was reached when the measured resistivity and pressure drop values in the last two consecutive cycles were similar; otherwise, the test would be continued until the second global steady-state was achieved. It should be noted that the gas saturation profiles were calculated from the recorded resistivity measurements. At first, the Archie equation [46], shown in Equation (2), was used to obtain the water saturation values at various pore volumes injected. Then, the gas saturation profiles were obtained from the calculated values of water saturations (Sg = 1 − Sw) as only two fluids were flowing through the porous medium, i.e., gas and water.
S w n = R o R t
where Sw is the water saturation, Ro is the resistivity of the core sample when fully saturated with water, Rt is the true resistivity reading, and n is the saturation exponent. The saturation exponent, n, was determined from electrical resistivity experiments conducted on each sample. Saturation exponents were measured twice on each sample, first for a gas displacing brine and secondly for foam displacing brine. The appropriate saturation exponents were then used for WAG and SAG, respectively. More details about n measurements and saturation profile determination can be found in our previous papers [18,22,47].

2.5. Trapping Model

Since the core samples we used in this study are consolidated rock samples and the rock wettability was found to be towards water–wet for the used gas–liquid–rock system, Land’s trapping relationship was proposed to fit the measured initial–residual saturation curves. Land’s trapping model was previously shown in Equation (1). Figure 3 show an illustration of the various factors controlling the initial–residual (IR) non-wetting (gas) saturation relationship. It is clear from Figure 3 that higher values of Land’s trapping coefficient (C) indicate lower trapping efficiencies. The 45° straight line, shown by C = 0, represents the 100% trapping efficiency of the porous medium. By considering any specific IR curve characterized by a certain value of the Land coefficient C, one can observe that by increasing the initial gas saturation (through enhanced sweep efficiency), the residual saturation of the injected gas increases. In designing any gas storage project, several factors can be optimized to improve the sweep efficiency and hence increase the initial gas saturation. For instance, foaming the injected gas instead of continuous gas injection can improve sweep efficiency in porous media, as we discussed earlier in this paper. The injection strategy, e.g., SAG, WAG or continuous gas injection, can affect sweep efficiency and hence the initial gas saturation, especially in heterogeneous reservoirs. Therefore, increasing the initial gas saturation and, consequently, the residual saturation of the gas, is considered to be dependent on the operational conditions. There is, however, no specific study that compares all of these injection methods on the residual trapping of gas.
As shown in Figure 3, the change from a higher trapping coefficient (less gas trapping) to a lower trapping coefficient (better gas trapping efficiency) is strongly controlled by the rock pore sizes, pore geometry, capillary trapping heterogeneity, rock wettability, and interfacial tensions. Hence, it seems that Land’s trapping coefficient can vary from one reservoir to another due to the change in pore characteristics. Furthermore, other characteristics of the injected fluid or operating system conditions, i.e., operating pressure and temperature, can have a significant impact on the rock wettability and fluid trapping mechanism and, consequently, the capillary trapping efficiency.

3. Results and Discussion

The results of the experiments presented are discussed in four main parts. First, the core flooding results of the single-cycle SAG injection, multi-cycle SAG injection, and the continuous gas injection, followed by water imbibition, are presented for one of the rock samples (sample BH) to illustrate the most effective foam injection strategy that caused most gas trapping. The factors affecting residual gas saturations obtained after the imbibition process in each injection strategy are also discussed. This is followed by analyzing the IR saturation curves obtained from SAG and WAG injection in various rock samples. Thereafter, a relationship between the volume of residual gas saturation and T2 relaxation times measured through the rock samples using NMR is illustrated. Finally, the results of the effect of surfactant concentration on gas trapping efficiency during SAG injection and on the final trapped gas saturation at the end of the injection process are discussed.

3.1. Core Flooding Results

Three core flooding results are reported and discussed in this section. The sandstone sample (sample BH—properties previously shown in Table 1) was used to highlight the effect of the gas injection strategy on the gas trapping process. The dynamic changes in gas saturations, shown in Figure 4, are plotted at various pore volumes injected (calculated as the ratio of the cumulative volume of the injected fluid to the pore volume of the porous medium). The black curve shows the N2 gas injection process followed by water injection. It is important to mention here that the core sample was fully saturated with brine before starting the gas injection process and the same fluid, i.e., saturating brine, was used as a chasing fluid. The blue curve shows the performance of foamed N2 gas injection in the core sample previously fully saturated with the surfactant fluid (surfactant dissolved in brine that helps in situ foam generation). This injection process was followed by a chase fluid injection until reaching the residual gas saturation. The red curve shows the results of multiple cycles of the surfactant alternating gas (SAG) injection process. As it was previously discussed in the experimental procedure section, the cyclic injection process continued until minor gas saturation changes were detected by the resistivity measurements. Similar to the continuous gas injection strategies discussed above, a chase fluid (surfactant dissolved in brine) was injected to reach the residual gas saturation point.
It is clear from Figure 4 that continuous gas injection followed by water injection resulted in a relatively lower initial gas saturation, i.e., low gas saturation achieved at the end of the gas injection period when a steady state was reached, compared to foam injection by single and multi-cycles of alternate injection of gas and surfactant solution (SAG). Since a low gas displacement efficiency was obtained by continuous gas injection, the second water injection (imbibition) process also resulted in a low residual gas saturation (Sgr) when compared to other cases. That is due to the better sweep efficiency of the foam flooding when compared to gas injection. Additionally, it can be observed from Figure 4 that although the single and multi-cycles of SAG showed similar displacement efficiency (initial gas saturation), the resultant residual gas saturation (Sgr) after the imbibition process was much higher for the multi-cycles SAG injection case. This can be due to the more efficient trapping mechanisms, i.e., snap-off mechanism and pore plugging activities of foam bubbles, that were obtained by having many cycles of alternate injections, as will be further discussed in the below sections.

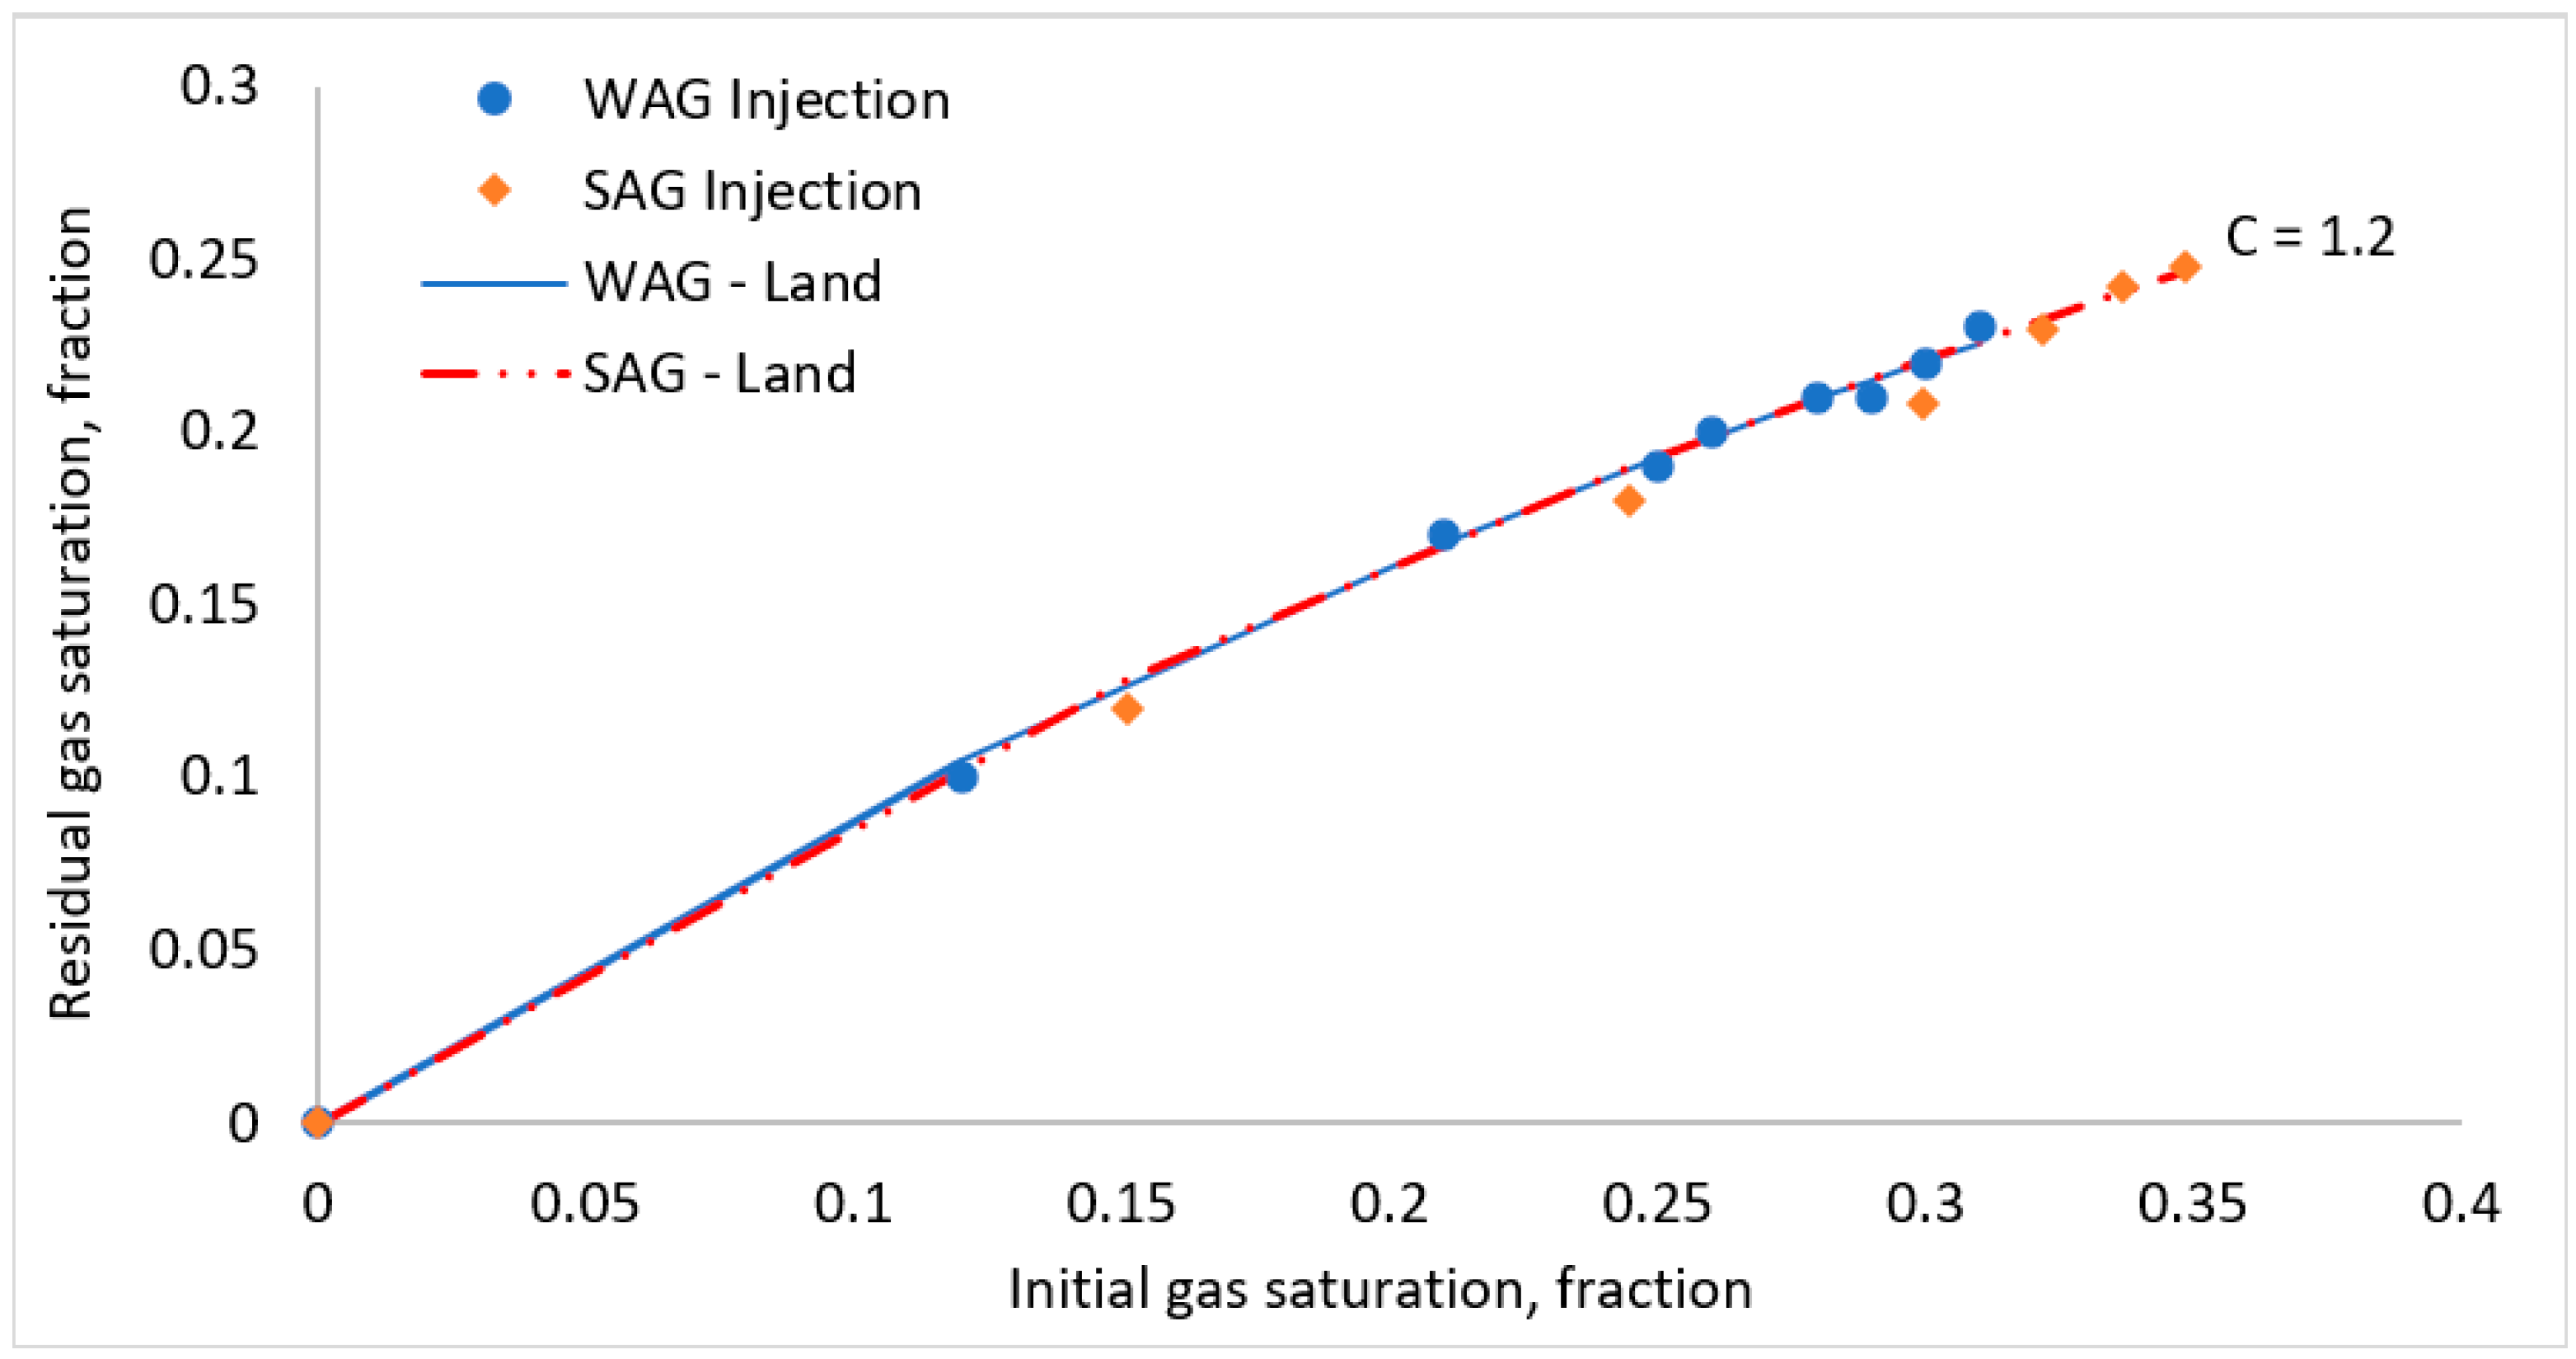
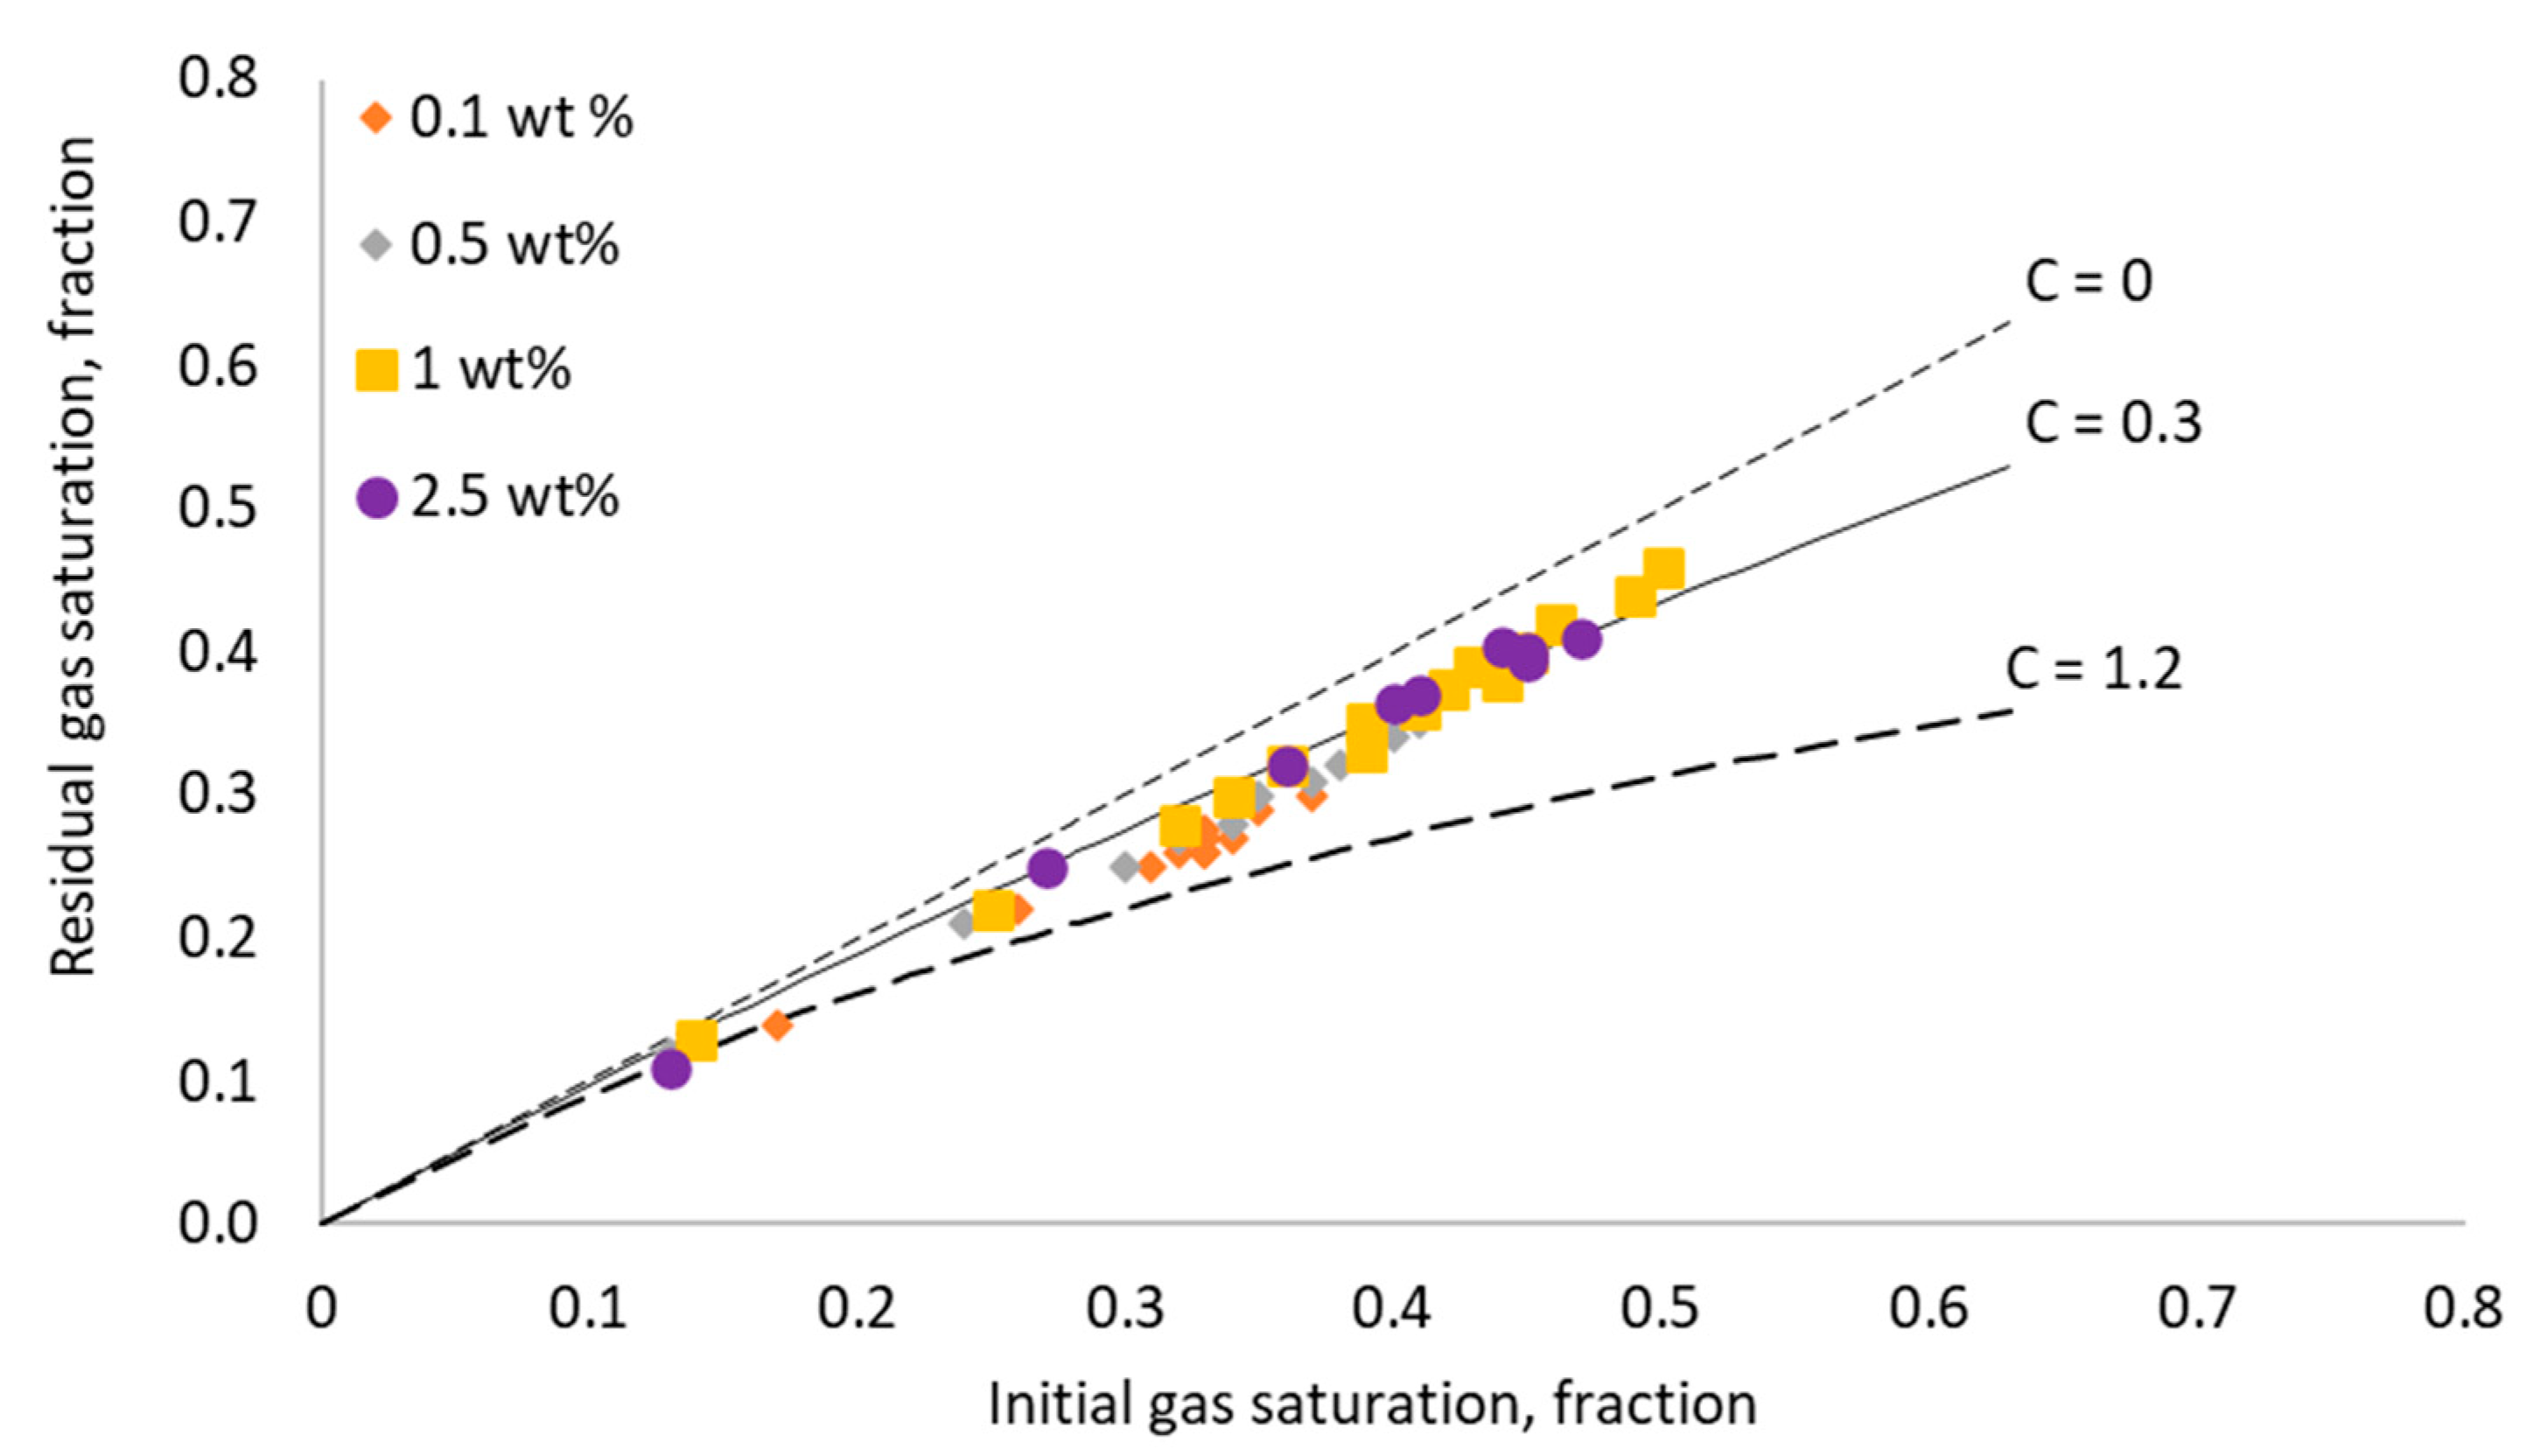
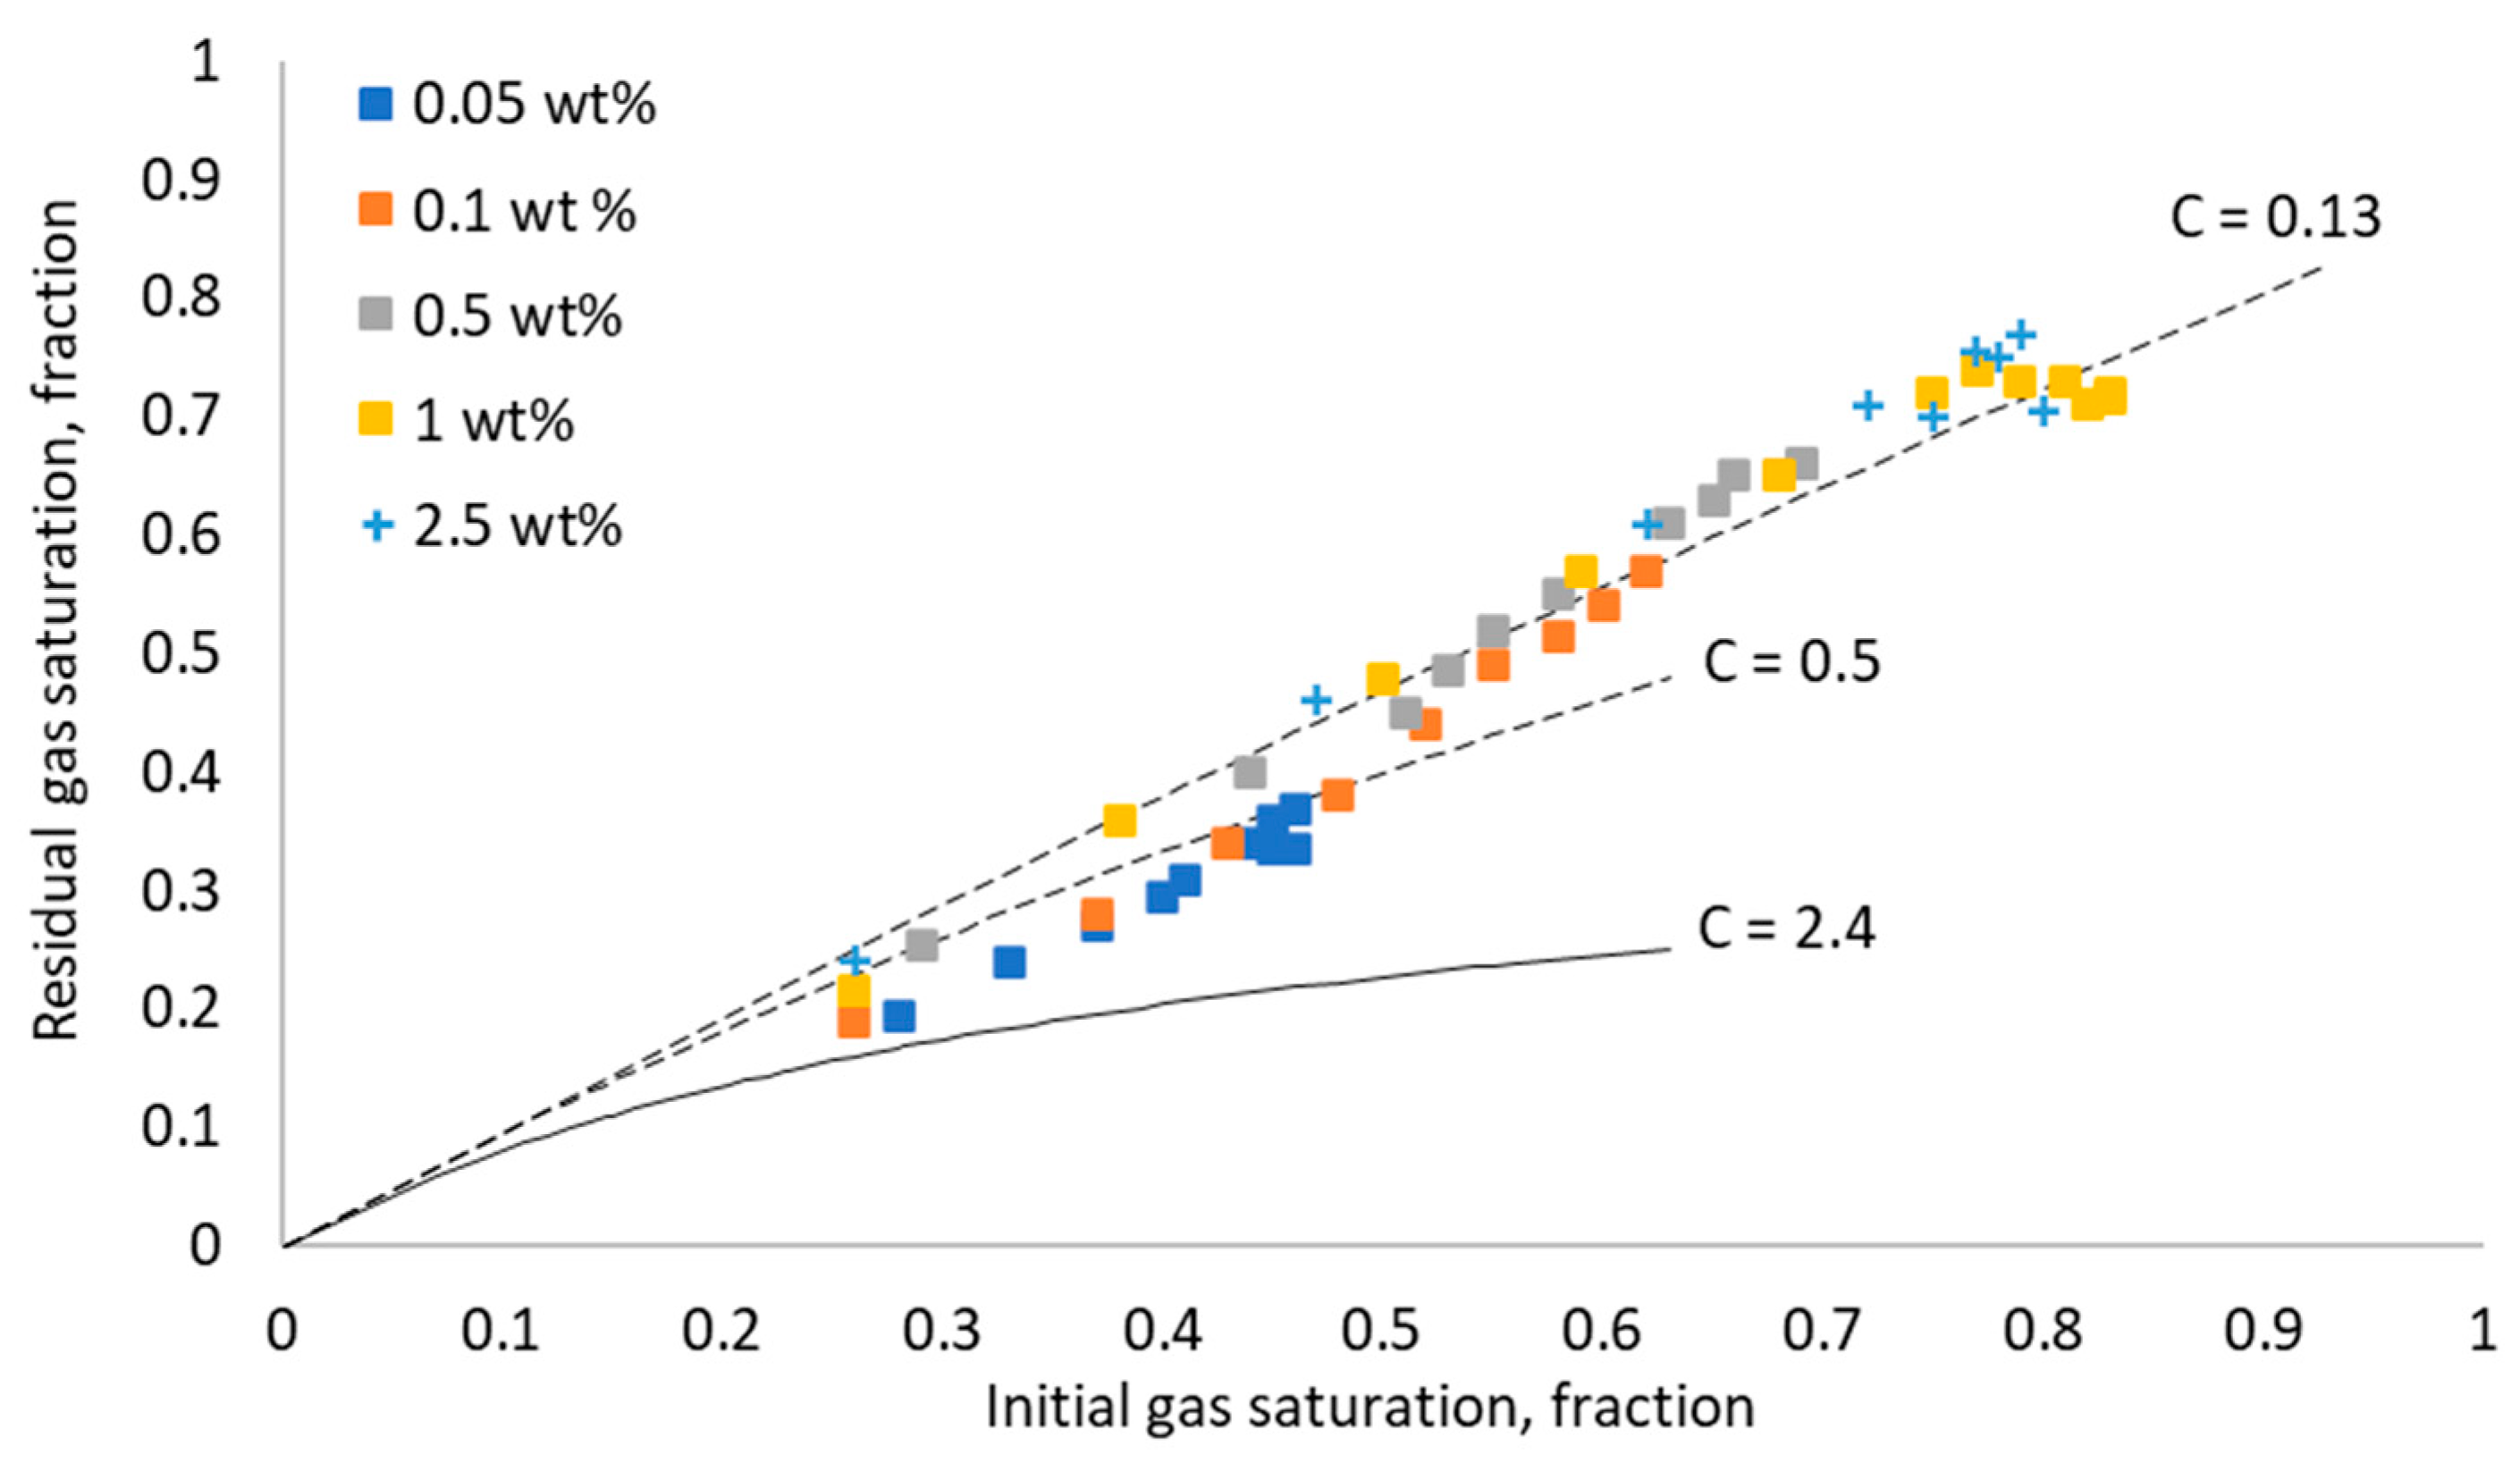
3.2. Initial–Residual (IR) Saturation Curves

Figure 5, Figure 6 and Figure 7 show initial–residual (IR) saturation curves, measured during water alternating gas (WAG) and surfactant alternating gas (SAG) injection in samples AC, BH, and GD, respectively. Land’s trapping model was used to fit the measured IR data by adjusting the C coefficient, as shown in the IR plots. It should be noted that a surfactant concentration of 0.05 wt% was used in all the SAG experiments reported in this section. It is clear from the IR curves reported here that the higher the initial gas saturation achieved, the higher the residual gas remained in the porous medium. Nevertheless, Land’s model fitted the measured curves with a wide range of C coefficients in the different rock samples tested. Here, in this section, we will focus on investigating and analyzing the trend of the IR curves (C coefficient values for the fitted curves) for the mentioned three core samples under both WAG and SAG injection processes. One can notice that the gas trapping during WAG and SAG injection in sample AC was indistinguishable, as shown in Figure 5. In other words, both curves can be fitted with the same value of Land’s coefficient. This is probably due to the high capillary pressure regime present in the rock sample, which exceeds the limiting capillary pressure of foam in the rock. However, Figure 6 and Figure 7 show a more significant effect of foam in improving the trapping efficiency of the two samples, i.e., samples BH and GD, for the SAG injection relative to the WAG injection process. As depicted previously in Figure 3, the trapping coefficient, C, mainly depends on the pore geometry and rock–fluid interactions such as rock wettability and IFT. Hence, the C coefficient values are expected to change for different samples due to the changes in the pore structure and wettability, even when the injected fluids and the operating conditions are similar [15]. We expect minor differences in the wettability of the tested samples as water wet samples were used; therefore, the pore structure is the source of difference in the C coefficients used to fit the data. By observing the C coefficient values in Figure 6 and Figure 7, it is clear that the in situ foam generation improved the trapping efficiency by lowering the value of Land’s trapping coefficient. This is a consequence of the effect of foam in enhancing gas trapping when compared to gas injection with no foam, i.e., only gas injected [48]. In general, two main processes, i.e., pore-filling or piston-like displacement and the snap-off processes, compete during the process of displacing a non-wetting phase with a wetting phase. The snap-off process is the one responsible for trapping the non-wetting phase in the porous medium [23]. Snap-off occurs due to the expulsion of the non-wetting phase from a throat, and the wetting phase layers in the throat corners swell until they snap off, causing the non-wetting phase to be trapped in the pore center [23]. Hence, the snap-off process is a function of rock wettability and geometrical parameters of the porous medium, such as aspect ratio (ratio of pore body diameter to pore throat diameter), the coordination number (number of throats connected to a single pore), and pore radius [49,50]. In a recent study, Singh et al. [51] investigated the relationship between the geometrical parameters of a porous medium and the snap-off and pore-filling mechanisms. Among the studied parameters, the results showed that a large pore radius favored the snap-off trapping mechanism.
In this current study, towards a better understanding of the gas trapping behavior, we measured the NMR T2 for all the core samples to be able to have estimates for the average pore sizes. The core sample AC was found to have the smallest average pore size, which was indicated by a low value of log mean of surface relaxation time (T2LM). Hence, the lowest trapping efficiency of gas was found in this sample, as depicted in Figure 5. On the other hand, samples BH and GD have larger pore sizes that can improve the snap-off trapping during in situ foam generation. Consequently, the trapping coefficient is relatively high after SAG flooding in these samples. The NMR measurement and T2LM correlation with the final residual gas saturations will be discussed in detail in the next section.

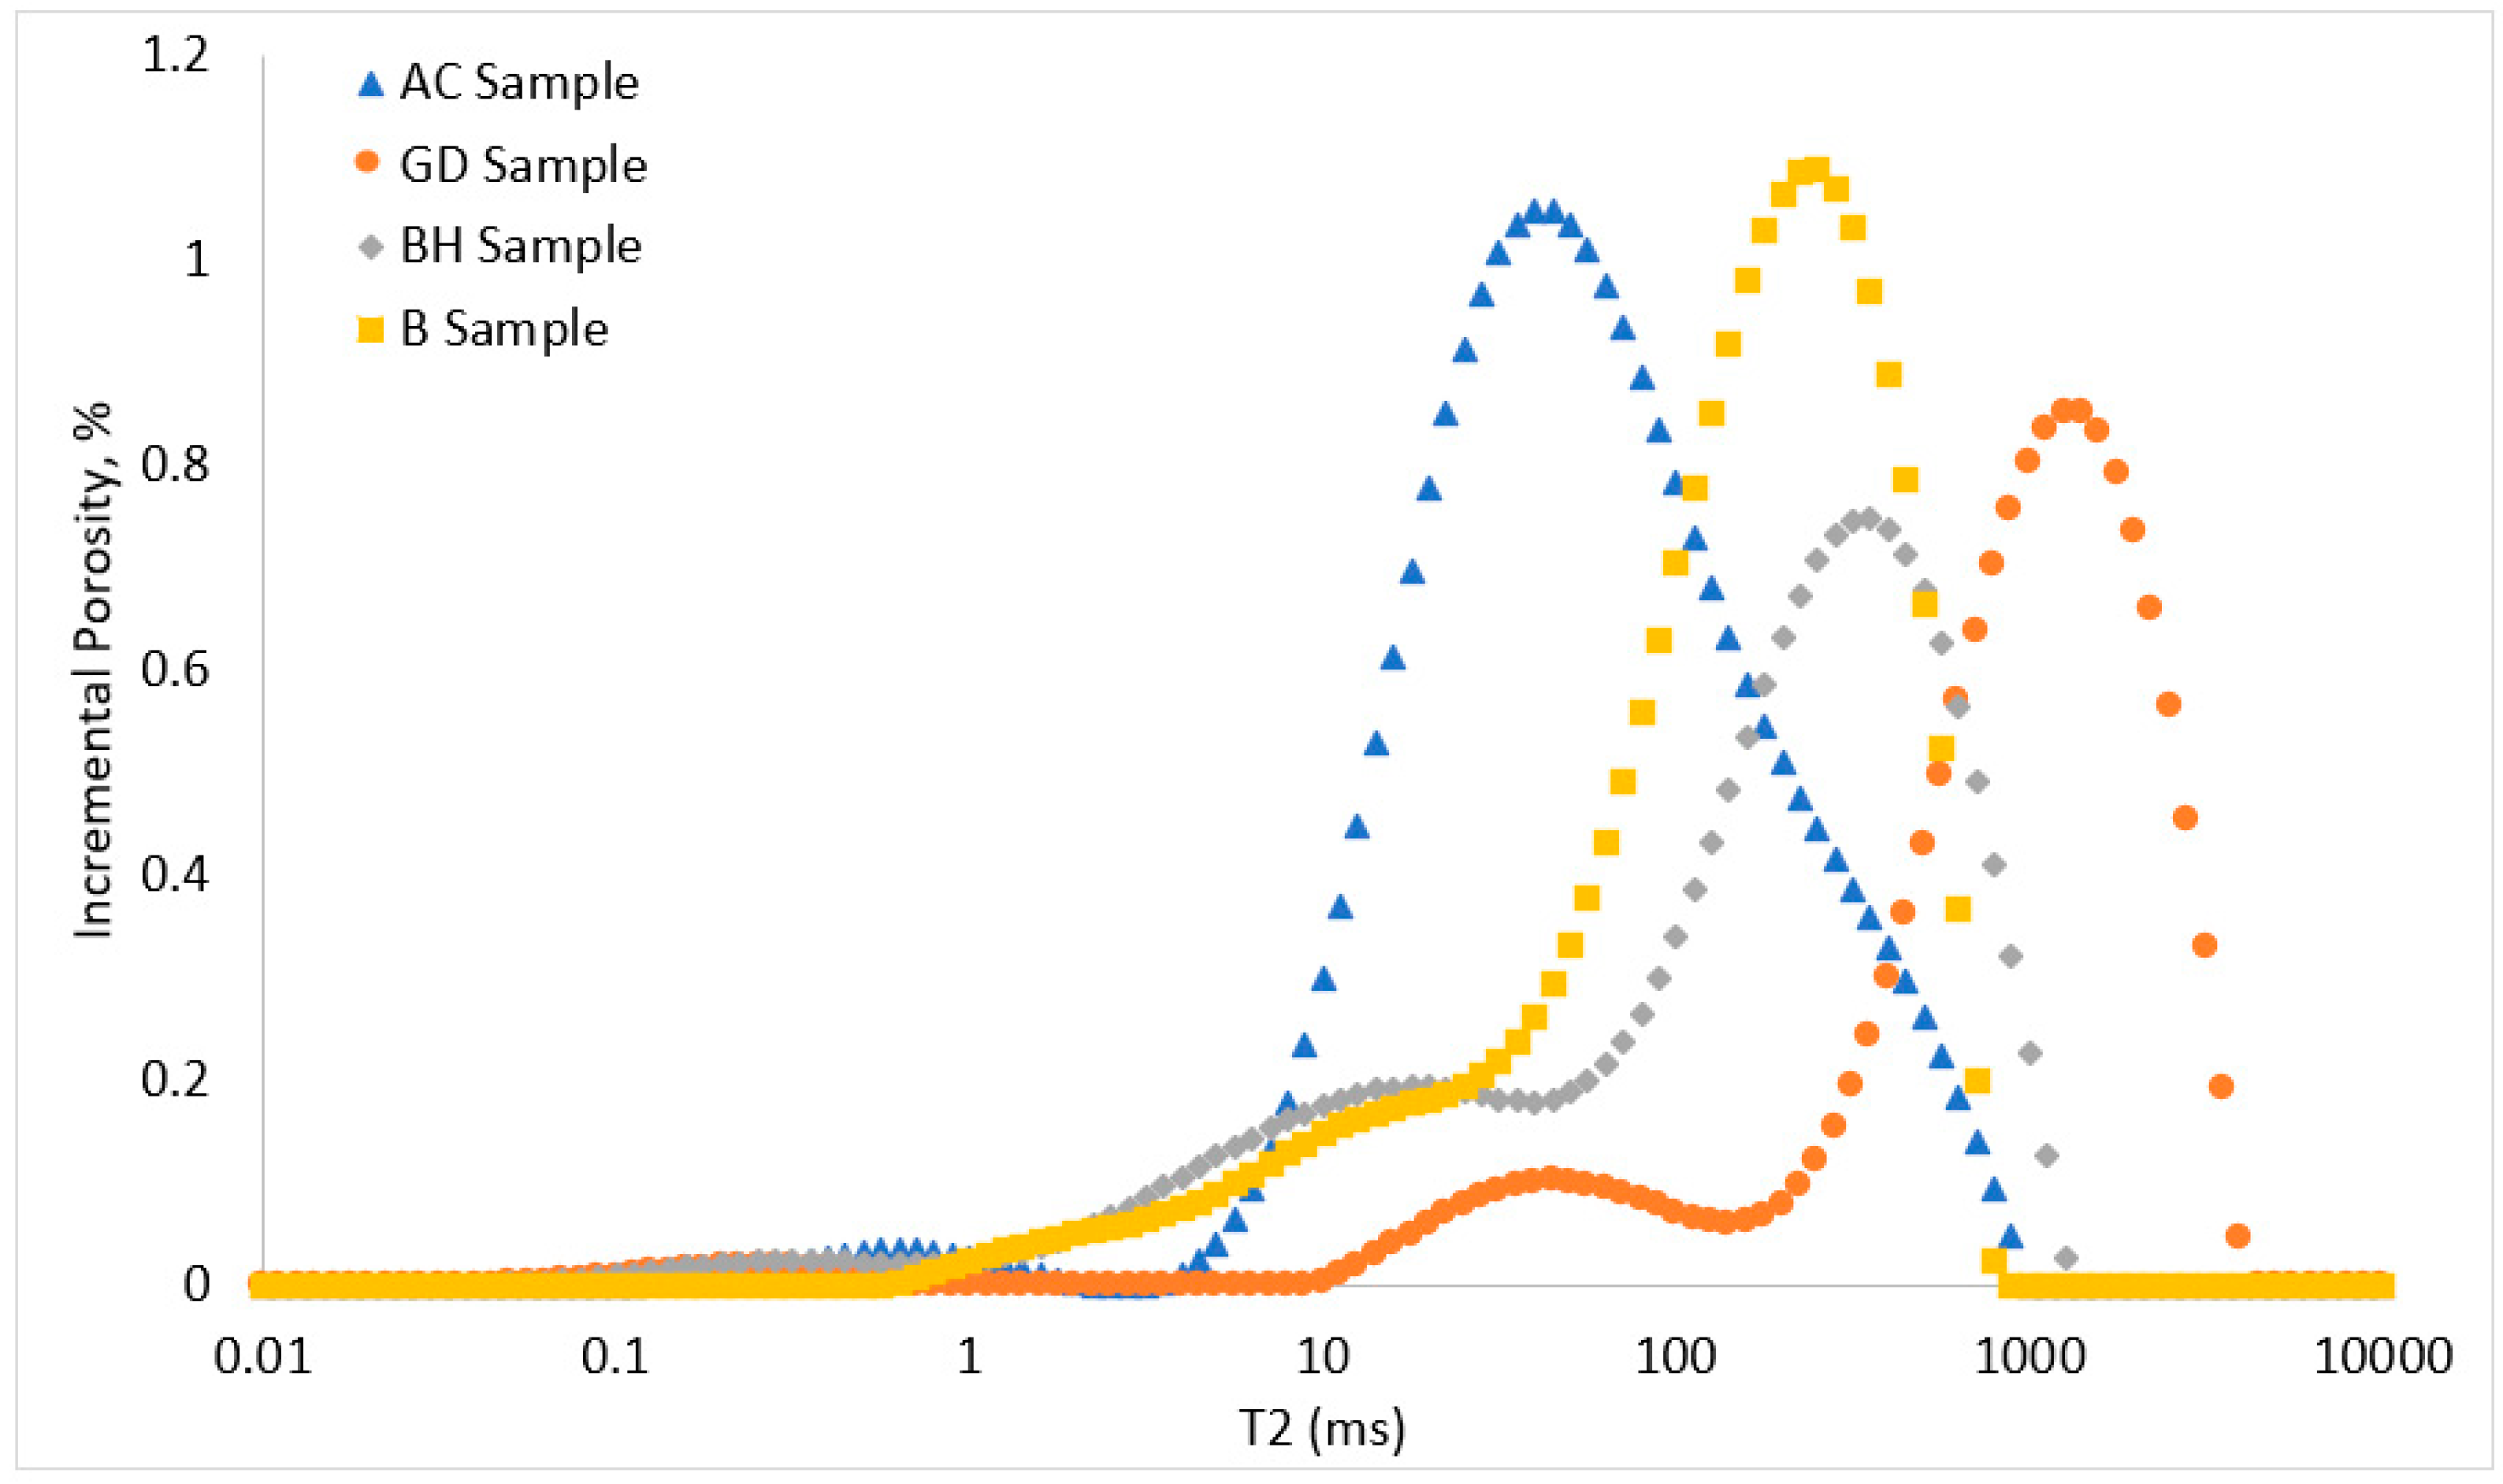
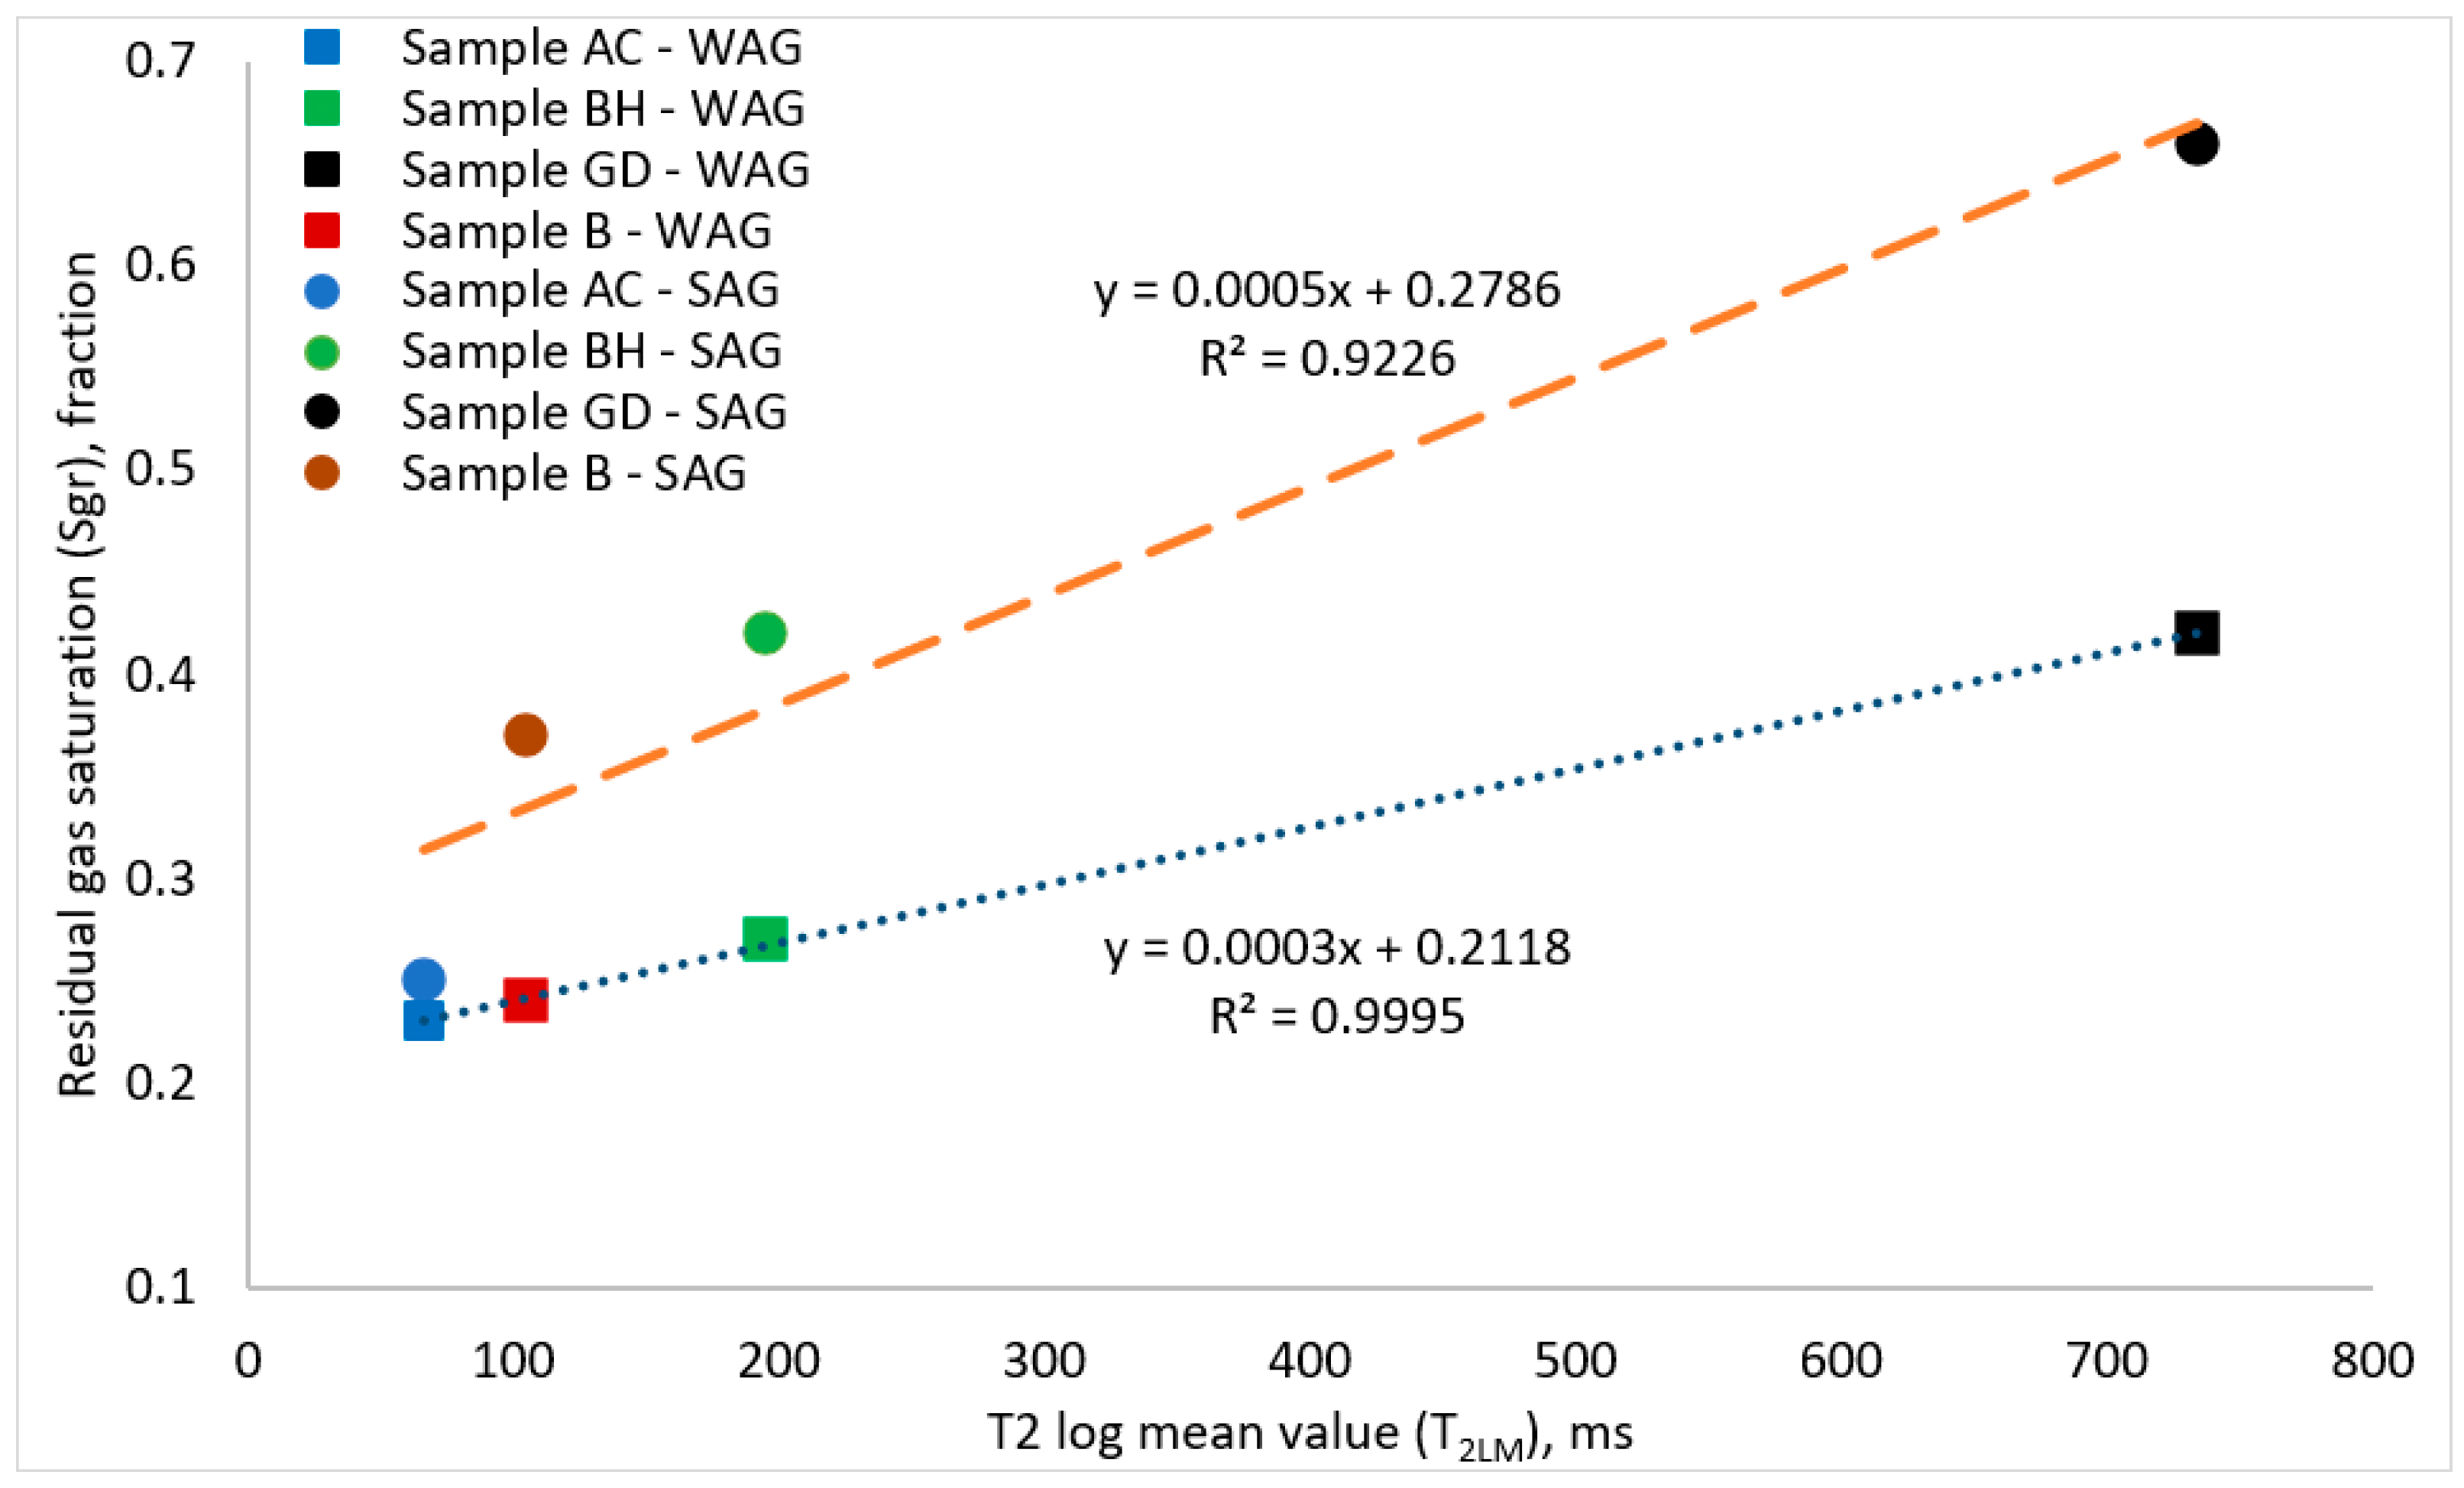
3.3. NMR T2 Relaxation Times and Residual Gas Saturations

The relaxation time, T2, is the time associated with the decay of the net proton magnetization in the fluid saturating a porous rock. The T2 was measured in the direction perpendicular to the applied static magnetic field. By assuming that the pores have cylindrical shapes, T2 can be directly related to pore radius [52]. Figure 8 show the NMR T2 spectrum measured for all the core samples. One can easily observe from Figure 8 that the log-mean value of surface relaxation times (T2LM) is the highest for the GD sample and the lowest for the AC sample. These T2LM values have a one-to-one correlation with the average pore size of the rock samples.
In this section, we aim to relate the rock properties to the measured gas trapping and residual gas saturation of the porous media obtained during the imbibition process after the WAG or SAG injection. It is worth mentioning here that neither the rock porosity nor the rock permeability shows good fitting correlations with the residual gas saturations measured for the various rock samples. Nevertheless, we tried to correlate the residual gas saturations of all the samples to the log mean value of NMR T2 relaxation (T2LM). Hence, we plotted the final residual saturation, Sgr, point obtained from the various tests conducted either with WAG or SAG injection followed by water imbibition in the tested rock samples versus T2LM, as shown in Figure 9. As illustrated in the previous section, the SAG injection had a relatively better sweep efficiency when compared to the WAG injection due to the in situ generation of foam that lowers the gas mobility and increases the viscous force during the injection process. Therefore, the residual gas saturations obtained after SAG injection are higher than those obtained using WAG injection for the four tested samples. The direct relation between Sgr and T2LM is clearly observed from Figure 9 for both WAG and SAG injection processes. The results showed that the larger the average pore size of the core sample- indicated by higher T2LM, the higher the residual gas saturation at the end of the imbibition process. Our previous studies [18,22] showed that the large pore sizes in GD (dolomite) might be attributed to diagenesis, and such large pore sizes do not necessarily translate to higher permeability as compared to other samples such as BH, which is sandstone. BH has relatively smaller pore sizes but is higher in permeability because its pores are more connected than GD.
Additionally, as shown in Table 3, linear relationships were found, with very good fitting for the measured data, using the results of the four core samples for both SAG and WAG injection scenarios. Hence, based on the results shown in Figure 9, we can claim that T2LM measured for various rock types can give a reliable prediction of the residual gas saturation in the porous media.

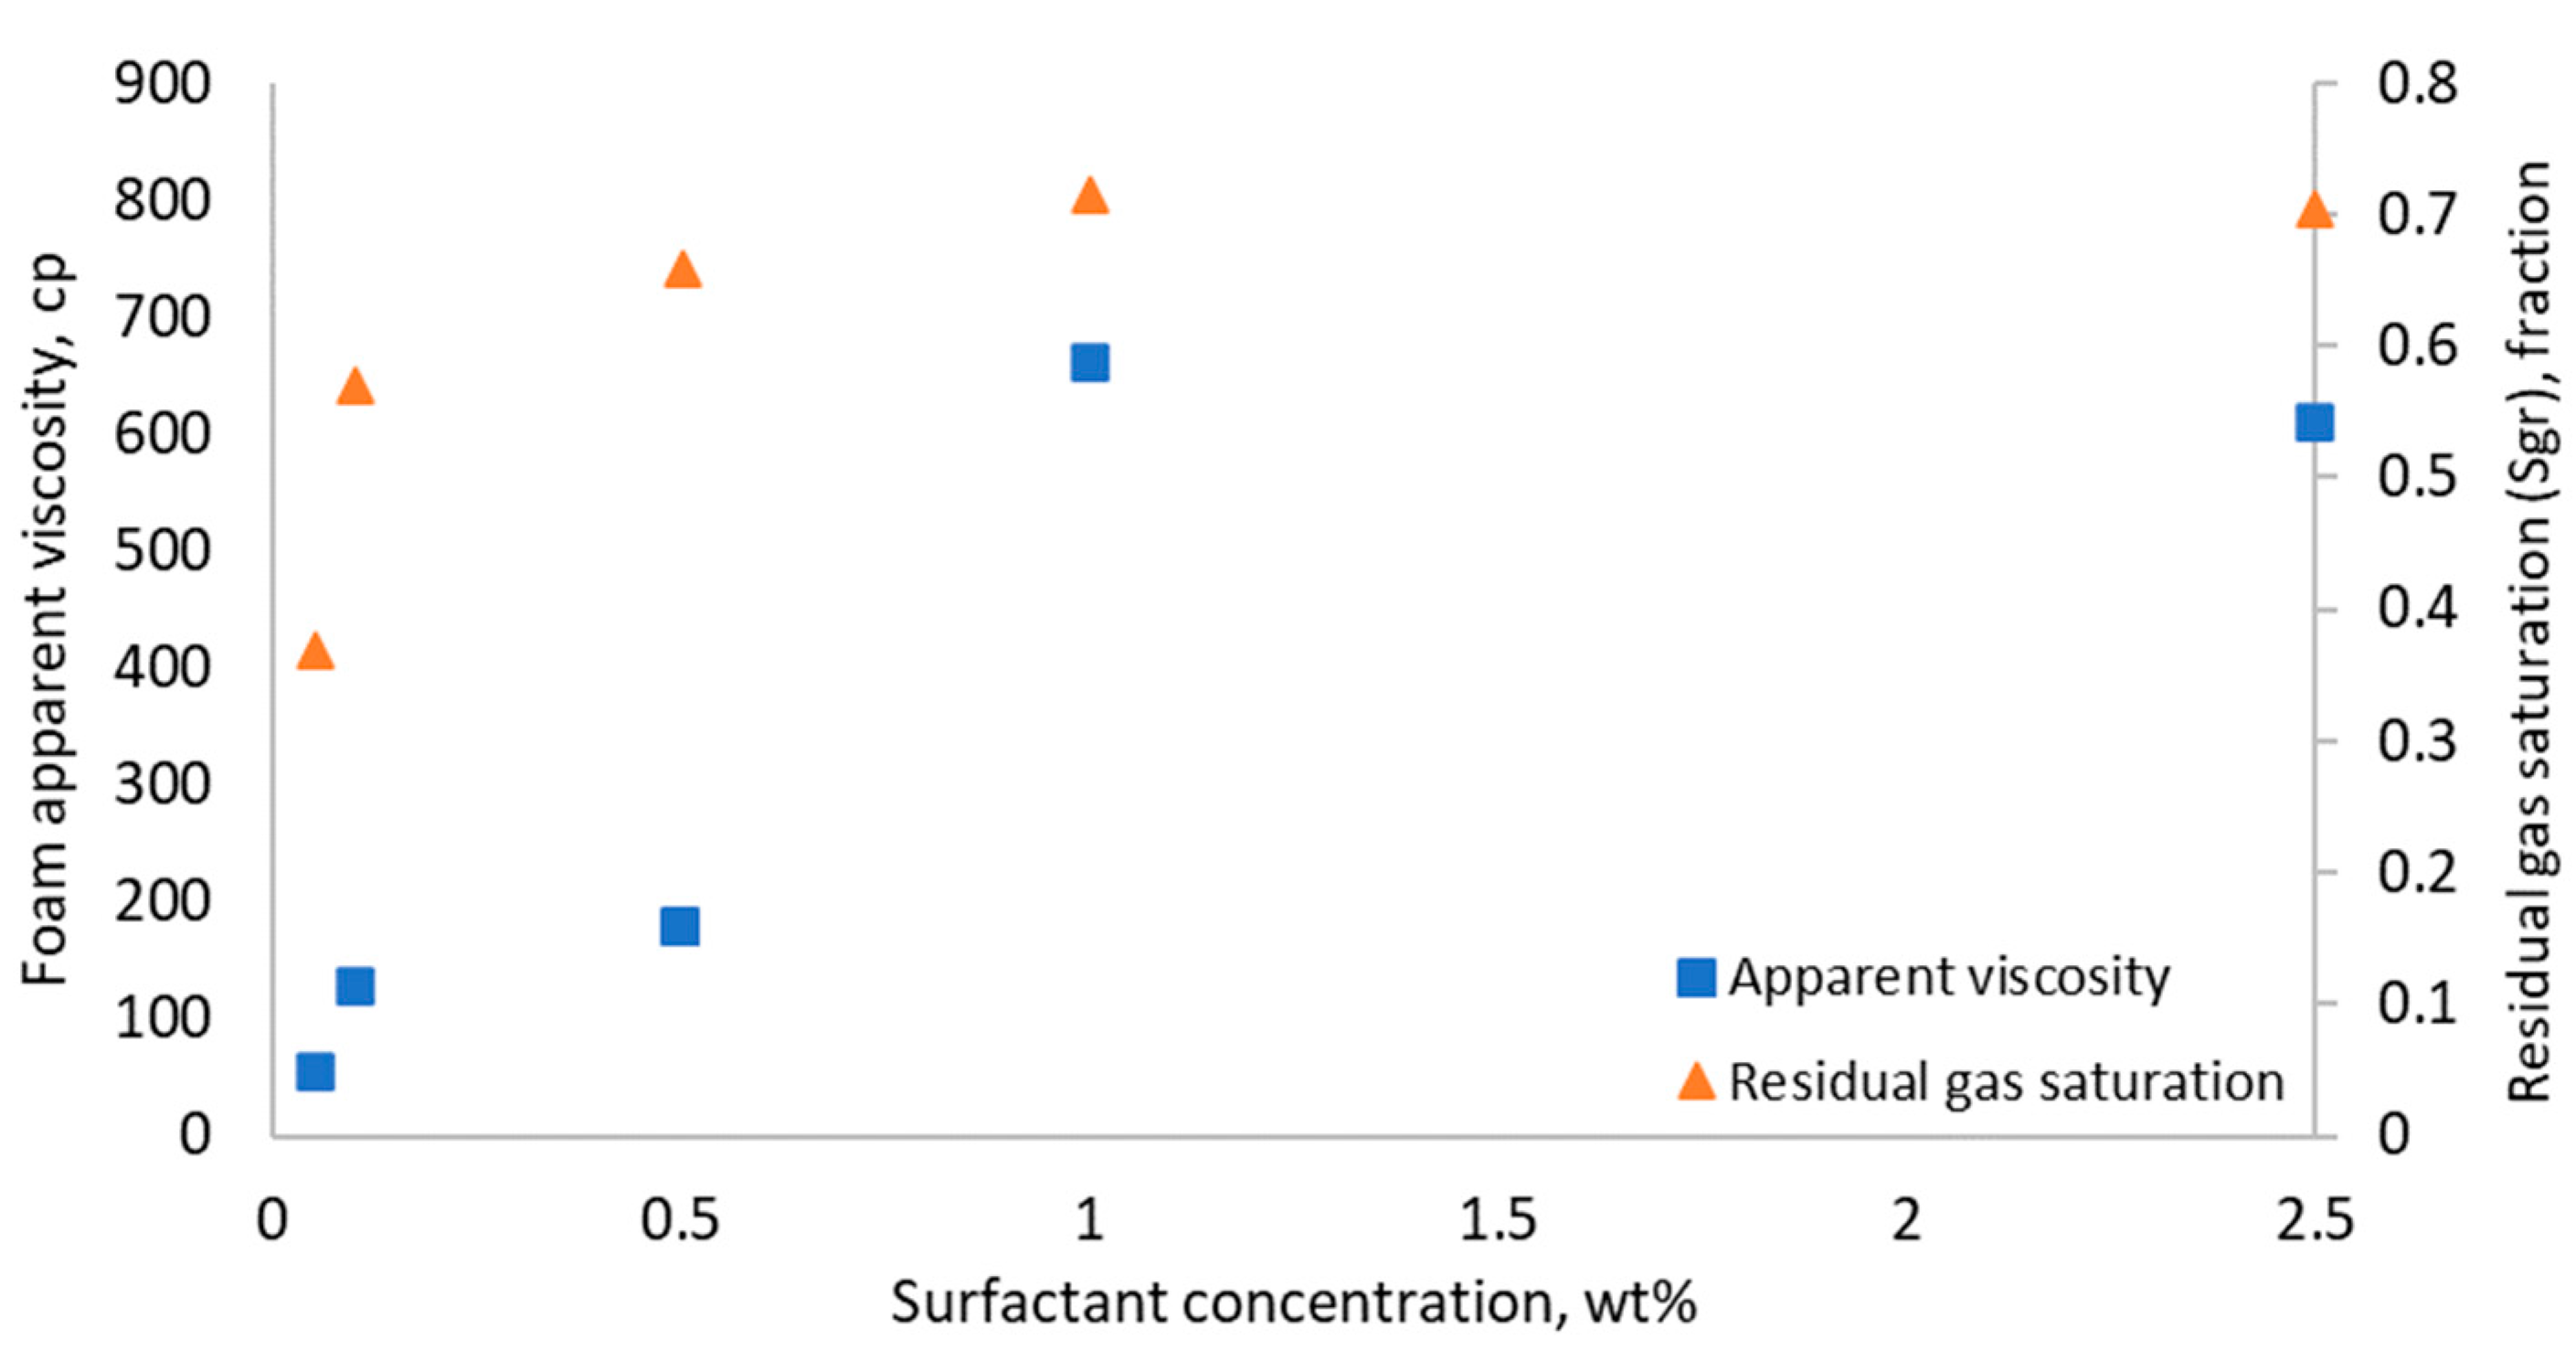
3.4. Effect of Surfactant Concentration on Gas Trapping Efficiency of Foam

In this section, we aim to investigate the effect of surfactant concentration on the initial–residual gas saturation relationship during SAG injection. Hence, we conducted SAG injection in sample AC and sample B using surfactant concentrations that range from 0.05 wt% to 2.5 wt%. Figure 10 and Figure 11 show the initial–residual saturation curves for sample AC and sample B, respectively. It can be observed in Figure 10 and Figure 11 that the IR saturation data of the two samples at various surfactant concentrations have different trapping coefficients. However, above a certain value of surfactant concentrations, the trapping coefficient did not change. More specifically, above 0.5 wt% surfactant concentration, the difference in the values of the C coefficient used to fit the data becomes less pronounced for the tested samples, as can be observed in Figure 10 and Figure 11. This can be related to the various rock-fluid properties that are dependent on the surfactant concentration. The small pore sizes of the AC sample, as it was previously shown in Figure 8, had an adverse effect on the foam generation. Consequently, using different surfactant concentrations did not show a significant effect on the trapping coefficient compared to the B sample. Previous studies have shown that increasing the surfactant concentration had a positive effect on the displacement efficiency of foam [31,38,40]. It was found that increasing the surfactant concentration increases the limiting capillary pressure, Pc*, and apparent foam viscosity, which directly affects foam texture and strength. Nevertheless, Kahrobaei and Farajzadeh [38] found in their study of the surfactant concentration effect on foam flow behavior, that, at concentration values higher than 0.5 wt%, minor improvements in the maximum apparent foam viscosity were observed. Furthermore, even though the snap-off process takes place even at low values of surfactant concentrations, the survival of the generated lamella and foam stability in porous media are highly dependent on the concentration of the used surfactant. To summarize, our results showed that the trapping efficiency, indicated by Land’s coefficient, was improved by increasing the surfactant concentration due to the improvement in the in situ generated foam properties such as foam texture, foam stability, and apparent foam viscosity, in addition to the limiting capillary pressure value. Furthermore, the snap-off trapping mechanism becomes more dominant at high surfactant concentrations. Nevertheless, above a certain range of surfactant concentrations, the improvement in the trapping efficiencies, i.e., C coefficients, becomes indistinguishable. It should also be noted that the rock properties, such as pore size and aspect ratio, play an important role in the foam generation. Figure 12 show the final residual gas saturations, measured at the end of the SAG injection process, as a function of surfactant concentration for sample AC and sample B. It observed in Figure 12 that by increasing surfactant concentration above 1 wt%, the residual gas saturation slightly decreases for both samples. In a previous study, Eftekhari and Farajzadeh [32] reported a slight decrease in the maximum apparent foam viscosity with increasing surfactant concentration above a certain value. They explained that this behavior is due to the capture of some micelles in foam film during the thinning process when the micelle concentration is high in the surfactant solution [53,54]. The slight reduction in the apparent foam viscosity leads to a reduction in the displacement efficiency, and hence, the initial gas saturation is slightly lower at surfactant concentration above this critical value. Since the residual gas saturation is directly proportional to the initial gas saturation, as previously explained by Land’s model, the residual saturation of the gas was slightly reduced at high surfactant concentrations, as depicted in Figure 12. Towards a better understanding of the relationship between the surfactant concentrations, the foam apparent viscosity, and the residual gas saturation, we calculated the apparent foam viscosity from the pressure drop measured while running the tests. Figure 13 show that the apparent foam viscosity and the residual gas saturations follow the same trend with various surfactant concentrations. This proves the direct relationship between the apparent foam viscosity and the residual gas saturation, which is mainly controlled by the used surfactant concentration in foam generation.

4. Conclusions

In this study, the effect of foam on capillary trapping of gas for gas storage purposes was investigated. Several core flooding tests, equipped with resistivity measurements to detect dynamic changes in fluid saturations, were conducted using various core samples. WAG injection and SAG injection with different surfactant concentrations were tested, and the obtained IR saturation curves were analyzed. The effects of pore geometric characteristics of the tested rock samples and the surfactant concentration on the residual gas saturation and gas trapping efficiency were also studied. Based on the experimental results obtained in this study, the following conclusions were drawn:
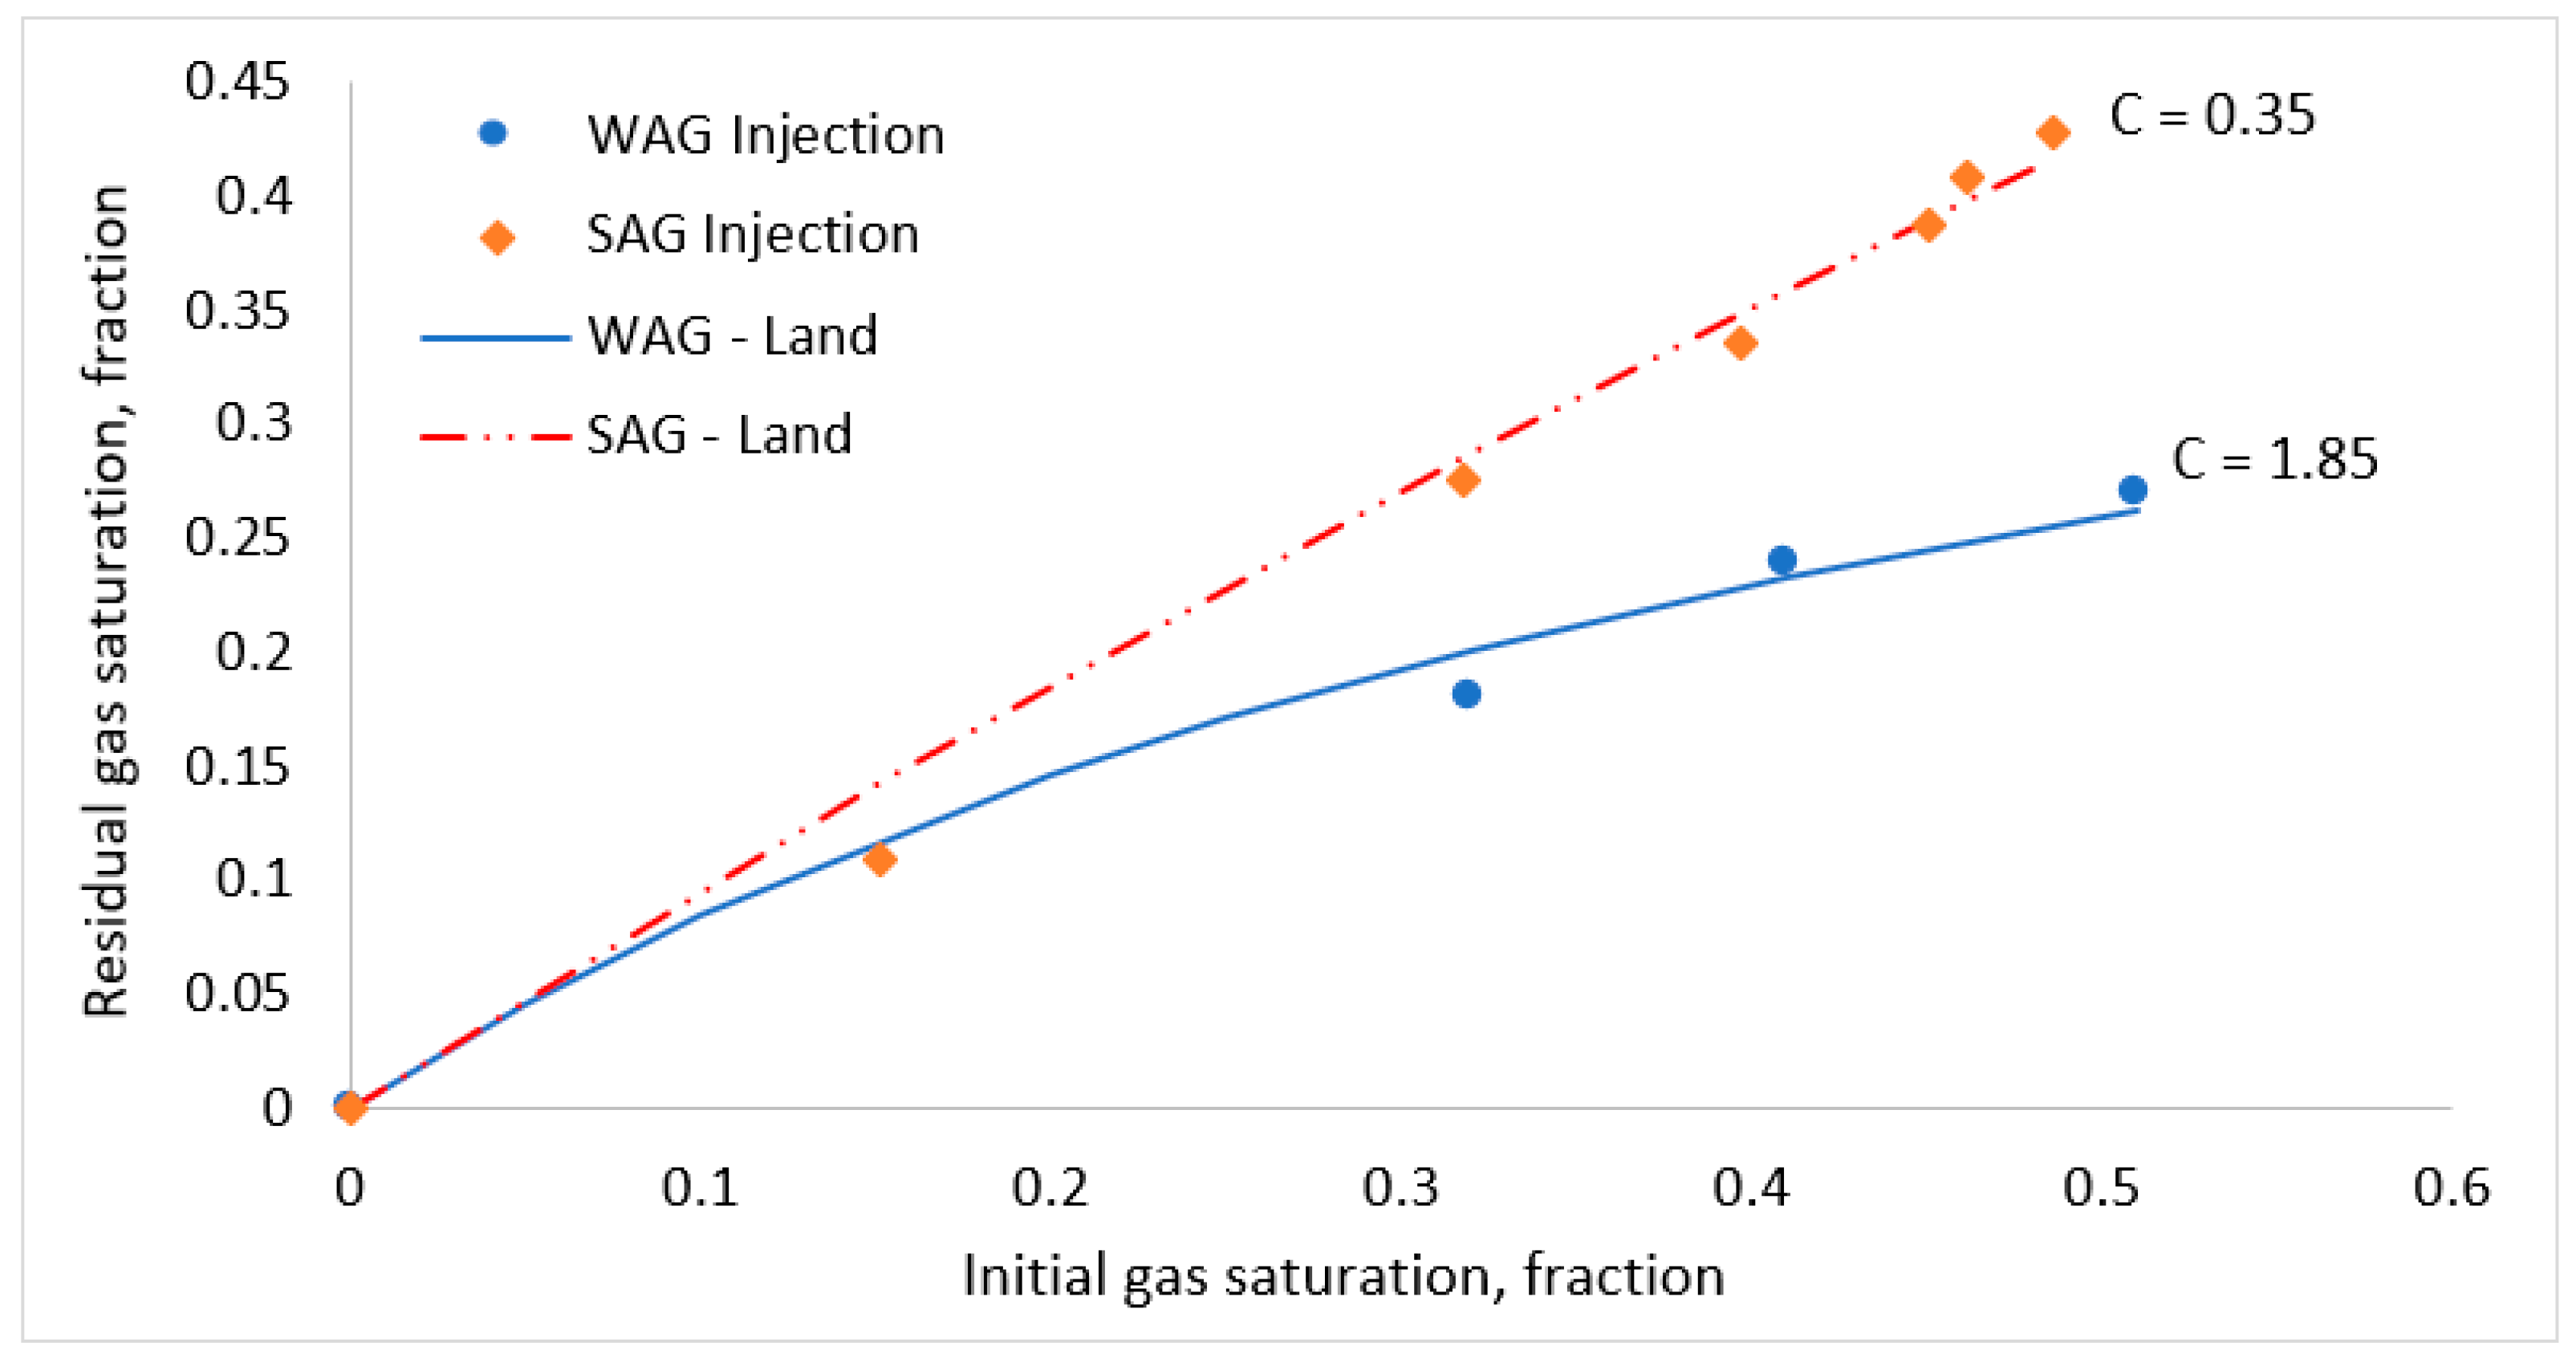
  • Foam significantly enhanced sweep efficiency and capillary trapping during gas injection in a saline aquifer. Residual trapping from foam-assisted gas injection was higher than gas injection without foam. Additionally, the multi-cycle foam injection (SAG) was found to be more effective than the single-cycle foam injection.
  • Although the initial gas saturation obtained from the single cycle and the multi-cycle SAG injection tests were similar, capillary trapping of the gas following water imbibition was higher in the multi-cycle foam injection (SAG) than in the single-cycle foam injection. This may be attributed to the multiple hysteresis effect associated with the cyclic injection.
  • Rock porosity did not show a good-fitted correlation with the measured residual gas saturations in various samples tested. However, residual gas saturation showed an excellent linear relationship with NMR T2 log mean values measured in all the tested cores. The good fittings correlations between the residual gas saturations obtained from various injection scenarios, and the measured T2LM, showed that the T2LM measurements for various rock types can give a reliable prediction method for the residual gas saturations in the porous media.
  • The trapping efficiency of the rock samples, indicated by Land’s coefficient, was significantly improved by increasing the surfactant concentration. This is due to the improvement in the in situ generated foam properties at high surfactant concentrations, such as foam texture, foam stability, and apparent foam viscosity, in addition to the limiting capillary pressure value. Additionally, the snap-off trapping mechanism was more dominant at high surfactant concentrations. Nevertheless, above a certain range of surfactant concentrations (0.5–1 wt% in this study), the improvement in the trapping efficiencies became insignificant. This highlights the importance of selecting an optimum surfactant concentration that leads to a high sweep efficiency during foam injection for sequestration purposes.
  • The experimental results have shown that the apparent foam viscosity increased with increasing the surfactant concentration to a certain range of the surfactant concentration, above which no further improvement in the foam apparent viscosity was observed. Additionally, the changes in the apparent foam viscosity with different surfactant concentrations were directly reflected in the measured residual gas saturation.

Author Contributions

Conceptualization, M.G.R.; Data curation, R.S.B., S.O.B. and A.R.A.; Formal analysis, M.G.R., R.S.B., S.O.B. and A.R.A.; Funding acquisition, A.R.A.; Investigation, M.G.R., S.O.B. and A.R.A.; Methodology, M.G.R., R.S.B., S.O.B. and A.R.A.; Supervision, A.R.A.; Writing—original draft, M.G.R.; Writing—review & editing, M.G.R. and A.R.A. All authors have read and agreed to the published version of the manuscript.

Funding

This research was funded by the College of Petroleum Engineering and Geosciences at KFUPM, grant number SF21005.

Institutional Review Board Statement

Not applicable.

Informed Consent Statement

Not applicable.

Acknowledgments

The authors acknowledge the support of the college of petroleum engineering and geosciences for the research support through grant number SF21005.

Conflicts of Interest

The authors declare no conflict of interest.

References

  1. Fink, J. Chapter 16—Enhanced oil recovery. In Petroleum Engineer’s Guide to Oil Field Chemicals and Fluids, 3rd ed.; Fink, J., Ed.; Gulf Professional Publishing: Houston, TX, USA, 2021; pp. 643–731. [Google Scholar]
  2. Rezk, M.G.; Foroozesh, J.; Zivar, D.; Mumtaz, M. CO2 storage potential during CO2 enhanced oil recovery in sandstone reservoirs. J. Nat. Gas Sci. Eng. 2019, 66, 233–243. [Google Scholar] [CrossRef]
  3. Rezk, M.G.; Foroozesh, J. Uncertainty effect of CO2 molecular diffusion on oil recovery and gas storage in underground formations. Fuel 2022, 324, 124770. [Google Scholar] [CrossRef]
  4. Metz, B.; Davidson, O.; de Coninck, H.; Loos, M.; Meyer, L. Carbon Dioxide Capture and Storage: Intergovernmental Panel on Climate Change Special Report; Cambridge University Press: Cambridge, UK, 2005. [Google Scholar]
  5. International Energy Agency (IEA). Global Energy and CO2 Status Report—2017; IEA: Paris, France, 2018; Available online: https://www.iea.org/publications/freepublications/publication/GECO2017.pdf (accessed on 1 April 2022).
  6. Jha, N.K.; Al-Yaseri, A.; Ghasemi, M.; Al-Bayati, D.; Lebedev, M.; Sarmadivaleh, M. Pore scale investigation of hydrogen injection in sandstone via X-ray micro-tomography. Int. J. Hydrog. Energy 2021, 46, 34822–34829. [Google Scholar] [CrossRef]
  7. Iglauer, S. Optimum geological storage depths for structural H2 geo-storage. J. Pet. Sci. Eng. 2021, 212, 109498. [Google Scholar] [CrossRef]
  8. Foroozesh, J.; Dier, M.A.; Rezk, M.G. A simulation study on CO2 sequestration in saline aquifers: Trapping mechanisms and risk of CO2 leakage. MATEC Web Conf. 2018, 225, 03004. [Google Scholar] [CrossRef]
  9. Iglauer, S. Dissolution trapping of carbon dioxide in reservoir formation brine—A carbon storage mechanism. In Mass Transfer-Advanced Aspects; InTech: London, UK, 2011. [Google Scholar]
  10. Rezk, M.G.; Foroozesh, J. Study of convective-diffusive flow during CO2 sequestration in fractured heterogeneous saline aquifers. J. Nat. Gas Sci. Eng. 2019, 69, 102926. [Google Scholar] [CrossRef]
  11. Rezk, M.G.; Foroozesh, J.; Abdulrahman, A.; Gholinezhad, J. CO2 Diffusion and Dispersion in Porous Media: Review of Advances in Experimental Measurements and Mathematical Models. Energy Fuels 2022, 36, 133–155. [Google Scholar] [CrossRef]
  12. Saadatpoor, E.; Bryant, S.L.; Sepehrnoori, K. Effect of Heterogeneous Capillary Pressure on Buoyancy-Driven CO2 Migration. In Proceedings of the SPE Symp. On Improved Oil Recovery, Tulsa, AK, USA, 20–23 April 2008. [Google Scholar]
  13. Nghiem, L.; Yang, C.; Shrivastava, V.; Kohse, B.; Hassam, M.; Card, C. Risk mitigation through the optimization of residual gas and solubility trapping for CO2 storage in saline aquifers. Energy Procedia 2009, 1, 3015–3022. [Google Scholar] [CrossRef]
  14. Harris, C.; Jackson, S.J.; Benham, G.P.; Krevor, S.; Muggeridge, A.H. The impact of heterogeneity on the capillary trapping of CO2 in the Captain Sandstone. Int. J. Greenh. Gas Control 2021, 112, 103511. [Google Scholar] [CrossRef]
  15. Krevor, S.; Blunt, M.J.; Benson, S.M.; Pentland, C.H.; Reynolds, C.; Al-Menhali, A.; Niu, B. Capillary trapping for geologic carbon dioxide storage – From pore scale physics to field scale implications. Int. J. Greenh. Gas Control 2015, 40, 221–237. [Google Scholar] [CrossRef] [Green Version]
  16. Iglauer, S.; Wulling, W.; Pentland, C.H.; al Mansoori, S.K.; Blunt, M.J. Capillary Trapping Capacity of Rocks and Sandpacks. In Proceedings of the EUROPEC/EAGE Conference and Exhibition, Amsterdam, The Netherlands, 8–11 June 2009. [Google Scholar]
  17. Al-Menhali, A.S.; Krevor, S. Capillary Trapping of CO2 in Oil Reservoirs: Observations in a Mixed-Wet Carbonate Rock. Environ. Sci. Technol. 2016, 50, 2727–2734. [Google Scholar] [CrossRef]
  18. Adebayo, A.R. Foam Flow in Different Pore Systems—Part 1: The Roles of Pore Attributes and Their Variation on Trapping and Apparent Viscosity of Foam. SPE J. 2021, 26, 3908–3925. [Google Scholar] [CrossRef]
  19. Suekane, T.; Nguyen, H.T. Relation between the Initial and Residual Gas Saturations of Gases Trapped by Capillarity in Natural Sandstones. J. Fluid Sci. Technol. 2013, 8, 322–336. [Google Scholar] [CrossRef]
  20. Bull, Ø.; Bratteli, F.; Ringen, J.K.; Melhuus, K.; Bye, A.L.; Iversen, J.E. The Quest for the True Residual Gas Saturation—An Experimental Approach. In Proceedings of the International Symposium of the Society of Core Analysts, Austin, TX, USA, 18–21 September 2011; pp. 1–12. [Google Scholar]
  21. Pentland, C.H.; Al-Mansoori, S.; Iglauer, s.; Bijeljic, B.; Blunt, M.J. Measurement of Non-Wetting Phase Trapping in Sand Packs. In Proceedings of the SPE Annual Technical Conference and Exhibition, Denver, CO, USA, 21–24 September 2008. [Google Scholar]
  22. Adebayo, A.R. Foam Flow in Different Pore Systems—Part 2: The Roles of Pore Attributes on the Limiting Capillary Pressure, Trapping Coefficient, and Relative Permeability of Foamed Gas. SPE J. 2021, 26, 3926–3948. [Google Scholar] [CrossRef]
  23. Singh, K.; Menke, H.; Andrew, M.; Lin, Q.; Rau, C.; Blunt, M.J.; Bijeljic, B. Dynamics of snap-off and pore-filling events during two-phase fluid flow in permeable media. Sci. Rep. 2017, 7, 5192. [Google Scholar] [CrossRef]
  24. Holtz, M.H. Residual Gas Saturation to Aquifer Influx: A Calculation Method for 3-D Computer Reservoir Model Construction. In Proceedings of the SPE Gas Technology Symposium, Calgary, AB, Canada, 30 April–2 May 2002. [Google Scholar]
  25. Land, C.S. Calculation of Imbibition Relative Permeability for Two- and Three-Phase Flow From Rock Properties. Soc. Pet. Eng. J. 1968, 8, 149–156. [Google Scholar] [CrossRef]
  26. Jerauld, G.R. Prudhoe Bay Gas/Oil Relative Permeability. SPE Reserv. Eng. 1997, 12, 66–73. [Google Scholar] [CrossRef]
  27. Kleppe, J.; Delaplace, P.; Lenormand, R.; Hamon, G.; Chaput, E. Representation of Capillary Pressure Hysteresis in Reservoir Simulation. In Proceedings of the SPE Annual Technical Conference and Exhibition, San Antonio, TX, USA, 5–8 October 1997. [Google Scholar]
  28. Aissaoui, A. Etude Théorique et Expérimentale de L’hystérésis des Pressions Capillaires et des Perméabilités Relatives en Vue du Stockage Souterrain de Gaz; Ecole des Mines de Paris: Paris, France, 1983. [Google Scholar]
  29. Spiteri, E.J.; Juanes, R.; Blunt, M.J.; Orr, F.M. A New Model of Trapping and Relative Permeability Hysteresis for All Wettability Characteristics. SPE J. 2008, 13, 277–288. [Google Scholar] [CrossRef]
  30. Dance, T.; Paterson, L. Observations of carbon dioxide saturation distribution and residual trapping using core analysis and repeat pulsed-neutron logging at the CO2CRC Otway site. Int. J. Greenh. Gas Control 2016, 47, 210–220. [Google Scholar] [CrossRef]
  31. Farajzadeh, R.; Lotfollahi, M.; Eftekhari, A.A.; Rossen, W.R.; Hirasaki, G.J.H. Effect of Permeability on Implicit-Texture Foam Model Parameters and the Limiting Capillary Pressure. Energy Fuels 2015, 29, 3011–3018. [Google Scholar] [CrossRef] [Green Version]
  32. Eftekhari, A.A.; Farajzadeh, R. Effect of Foam on Liquid Phase Mobility in Porous Media. Sci. Rep. 2017, 7, 43870. [Google Scholar] [CrossRef]
  33. Farajzadeh, R.; Andrianov, A.; Bruining, H.; Zitha, P.L.J. Comparative Study of CO2 and N2 Foams in Porous Media at Low and High Pressure−Temperatures. Ind. Eng. Chem. Res. 2009, 48, 4542–4552. [Google Scholar] [CrossRef]
  34. Blaker, T.; Aarra, M.G.; Skauge, A.; Rasmussen, L.; Celius, H.K.; Martinsen, H.A.; Vassenden, F. Foam for Gas Mobility Control in the Snorre Field: The FAWAG Project. SPE Reserv. Eval. Eng. 2002, 5, 317–323. [Google Scholar] [CrossRef]
  35. Kamyab, M.; Simjoo, M.; Dejam, M.; Alamatsaz, A. Numerical Study of Immiscible Foam Propagation in Porous Media in the Presence of Oil Using an Implicit-Texture Foam Model. Energy Fuels 2021, 35, 6553–6565. [Google Scholar] [CrossRef]
  36. Heller, J.P. CO2 Foams in enhanced oil recovery. In Foams: Fundamentals and Applications in the Petroleum Industry; AMC: Washington, DC, USA, 1994; Volume 242, pp. 201–234. [Google Scholar]
  37. Meng, B.; Li, Z.; Lu, T.; Du, L.; Wang, Y.; He, X.; Zhang, Y. Experimental Study on the Mechanism of Nitrogen Foam to Improve the Recovery of Bottom-Water Heavy Oil Reservoir. Energy Fuels 2022, 36, 3457–3467. [Google Scholar] [CrossRef]
  38. Kahrobaei, S.; Farajzadeh, R. Insights into Effects of Surfactant Concentration on Foam Behavior in Porous Media. Energy Fuels 2019, 33, 822–829. [Google Scholar] [CrossRef]
  39. Janssen, M.T.G.; Mutawa, A.S.; Pilus, R.M.; Zitha, P.L.J. Foam-Assisted Chemical Flooding for Enhanced Oil Recovery: Effects of Slug Salinity and Drive Foam Strength. Energy Fuels 2019, 33, 4951–4963. [Google Scholar] [CrossRef]
  40. Apaydin, O.G.; Kovscek, A.R. Surfactant Concentration and End Effects on Foam Flow in Porous Media. Transp. Porous Media 2001, 43, 511–536. [Google Scholar] [CrossRef]
  41. Bernard, G.G.; Jacobs, W.L. Effect of Foam on Trapped Gas Saturation and on Permeability of Porous Media to Water. Soc. Pet. Eng. J. 1965, 5, 295–300. [Google Scholar] [CrossRef]
  42. Jones, S.A.; Getrouw, N.; Vincent-Bonnieu, S. Foam flow in a model porous medium: II. The effect of trapped gas. Soft Matter. 2018, 14, 3497–3503. [Google Scholar] [CrossRef] [PubMed]
  43. Tang, G.Q.; Kovscek, A.R. Trapped Gas Fraction During Steady-State Foam Flow. Transp. Porous Media 2006, 65, 287–307. [Google Scholar] [CrossRef]
  44. Almajid, M.M.; Kovscek, A.R. Pore Network Investigation of Trapped Gas and Foam Generation Mechanisms. Transp. Porous Media 2020, 131, 289–313. [Google Scholar] [CrossRef]
  45. Adebayo, A.R. A Graphical Interpretation Technique to Evaluate Strength and Stability of Foam in Porous Media Based on Mobile-Trapped Foam Ratio. Transp. Porous Media 2021, 139, 327–355. [Google Scholar] [CrossRef]
  46. Archie, G.E. Classification of carbonate reservoir rocks and petrophysical considerations. AAPG Bull. 1952, 36, 278–298. [Google Scholar]
  47. Adebayo, A.R.; Isah, A.; Mahmoud, M.; Al-Shehri, D. Effects of Foam Microbubbles on Electrical Resistivity and Capillary Pressure of Partially Saturated Porous Media. Molecules 2020, 25, 3385. [Google Scholar] [CrossRef]
  48. Kovscek, A.R.; Tang, G.Q.; Radke, C.J. Verification of Roof snap off as a foam-generation mechanism in porous media at steady state. Colloids Surf. A: Physicochem. Eng. Aspects. 2007, 302, 251–260. [Google Scholar] [CrossRef]
  49. He, L.; Luo, Z.; Bai, B. Breakup of pancake droplets flowing through a microfluidic constriction. Chem. Eng. Sci. 2020, 220, 115649. [Google Scholar] [CrossRef]
  50. Blunt, M.J. Multiphase Flow in Permeable Media: A Pore-Scale Perspective; Cambridge University Press: Cambridge, UK, 2017. [Google Scholar]
  51. Singh, K.; Bultreys, T.; Raeini, A.Q.; Shams, M.; Blunt, M.J. New type of pore-snap-off and displacement correlations in imbibition. J. Colloid Interface Sci. 2022, 609, 384–392. [Google Scholar] [CrossRef]
  52. Cohen, M.H.; Mendelson, K.S. Nuclear magnetic relaxation and the internal geometry of sedimentary rocks. J. Appl. Phys. 1982, 53, 1127–1135. [Google Scholar] [CrossRef]
  53. Farajzadeh, R.; Krastev, R.; Zitha, P.L.J. Gas Permeability of Foam Films Stabilized by an α-Olefin Sulfonate Surfactant. Langmuir 2009, 25, 2881–2886. [Google Scholar] [CrossRef]
  54. Jones, S.A.; Laskaris, G.; Vincent-Bonnieu, S.; Farajzadeh, R.; Rossen, W.R. Effect of surfactant concentration on foam: From coreflood experiments to implicit-texture foam-model parameters. J. Ind. Eng. Chem. 2016, 37, 268–276. [Google Scholar] [CrossRef] [Green Version]
Figure 1. Chemical structure of the used surfactant.
Energies 15 06305 g001
Figure 2. Core flooding system equipped with electrical resistivity measurement system (LCR: inductance–capacitance–resistance). Adapted with permission from [45]. Copyright 2022 Springer Nature Switzerland AG.
Energies 15 06305 g002
Figure 3. Illustration of factors controlling typical initial–residual (IR) non-wetting, i.e., gas, saturation relationship and various values of Land’s trapping coefficient used to fit the IR curves.
Energies 15 06305 g003
Figure 4. Comparison of the performance of SAG (foam)/gas injection strategies during gas trapping in a sandstone rock sample (BH core sample).
Energies 15 06305 g004
Figure 5. Initial–residual saturation curves of the AC sample under WAG injection (blue symbols) and SAG injection (orange symbols). The solid and dashed lines show the best-fit Land’s model and the corresponding values of the C coefficient for the WAG and SAG injection process, respectively.
Energies 15 06305 g005
Figure 6. Initial–residual saturation curves of the BH sample under WAG (blue symbols) and SAG injection (orange symbols). The solid and dashed lines show the best-fit Land’s model and the corresponding value of the C coefficients for the WAG and SAG injection process, respectively.
Energies 15 06305 g006
Figure 7. Initial–residual saturation curves of the GD sample under WAG (blue symbols) and SAG injection (orange symbols). The solid and dashed lines show the best-fit Land’s model and the corresponding value of the C coefficients for the WAG and SAG injection process, respectively.
Energies 15 06305 g007
Figure 8. NMR T2 spectrum of the used core samples when fully saturated with water (Sw = 100%).
Energies 15 06305 g008
Figure 9. Residual gas saturation versus T2 log mean values measured in the core samples for both the WAG and SAG injection processes.
Energies 15 06305 g009
Figure 10. Initial–residual saturation curves of the AC sample under SAG injection conducted with various surfactant concentrations. The solid and dashed lines show Land’s model fitting using various values of the C coefficients.
Energies 15 06305 g010
Figure 11. Initial–residual saturation curves of the B sample under SAG injection conducted with various surfactant concentrations. The solid and dashed lines show Land’s model fitting using various values of the C coefficients.
Energies 15 06305 g011
Figure 12. Final residual gas saturation (due to SAG injection followed by imbibition) as a function of surfactant concentrations for sample AC and sample B.
Energies 15 06305 g012
Figure 13. Foam apparent viscosity and final residual gas saturation (due to SAG injection followed by imbibition) as a function of surfactant concentrations for sample B.
Energies 15 06305 g013
Table 1. Core samples properties and dimensions.
Sample IDName of OutcropRock LithologyPermeability k (mD)Porosity ϕ (%) Length L (cm)Diameter D (cm)
BHBriarhillSandstone110018.9210.2483.747
BBerea sandSandstone27816.019.3513.783
ACAustin ChalkCarbonate (Calcite)2626.8910.4413.784
GDGuelphCarbonate (Dolomite)63714.8310.2433.787
Table 2. Synthetic brine composition.
Salt CompositionMass (g/L)
Sodium Chloride (NaCl)41.17
Magnesium Chloride (MgCl2·6H2O)17.42
Sodium sulphate (Na2SO4·10H2O)7.93
Calcium Chloride (CaCl2·4H2O)2.97
Sodium Bicarbonate (NaHCO3)0.17
Total dissolved solids (TDS)69.66
Table 3. Correlations of residual gas saturations versus T2 log mean value.
Injection StrategySgr–T2LM CorrelationGoodness-of-Fit, R2
WAG injectionSgr = 0.0003 (T2LM) + 0.21180.9995
SAG injection Sgr = 0.0005 (T2LM) + 0.27890.9226
Publisher’s Note: MDPI stays neutral with regard to jurisdictional claims in published maps and institutional affiliations.

