
Batteries and Hydrogen Storage: Technical Analysis and Commercial Revision to Select the Best Option


Abstract
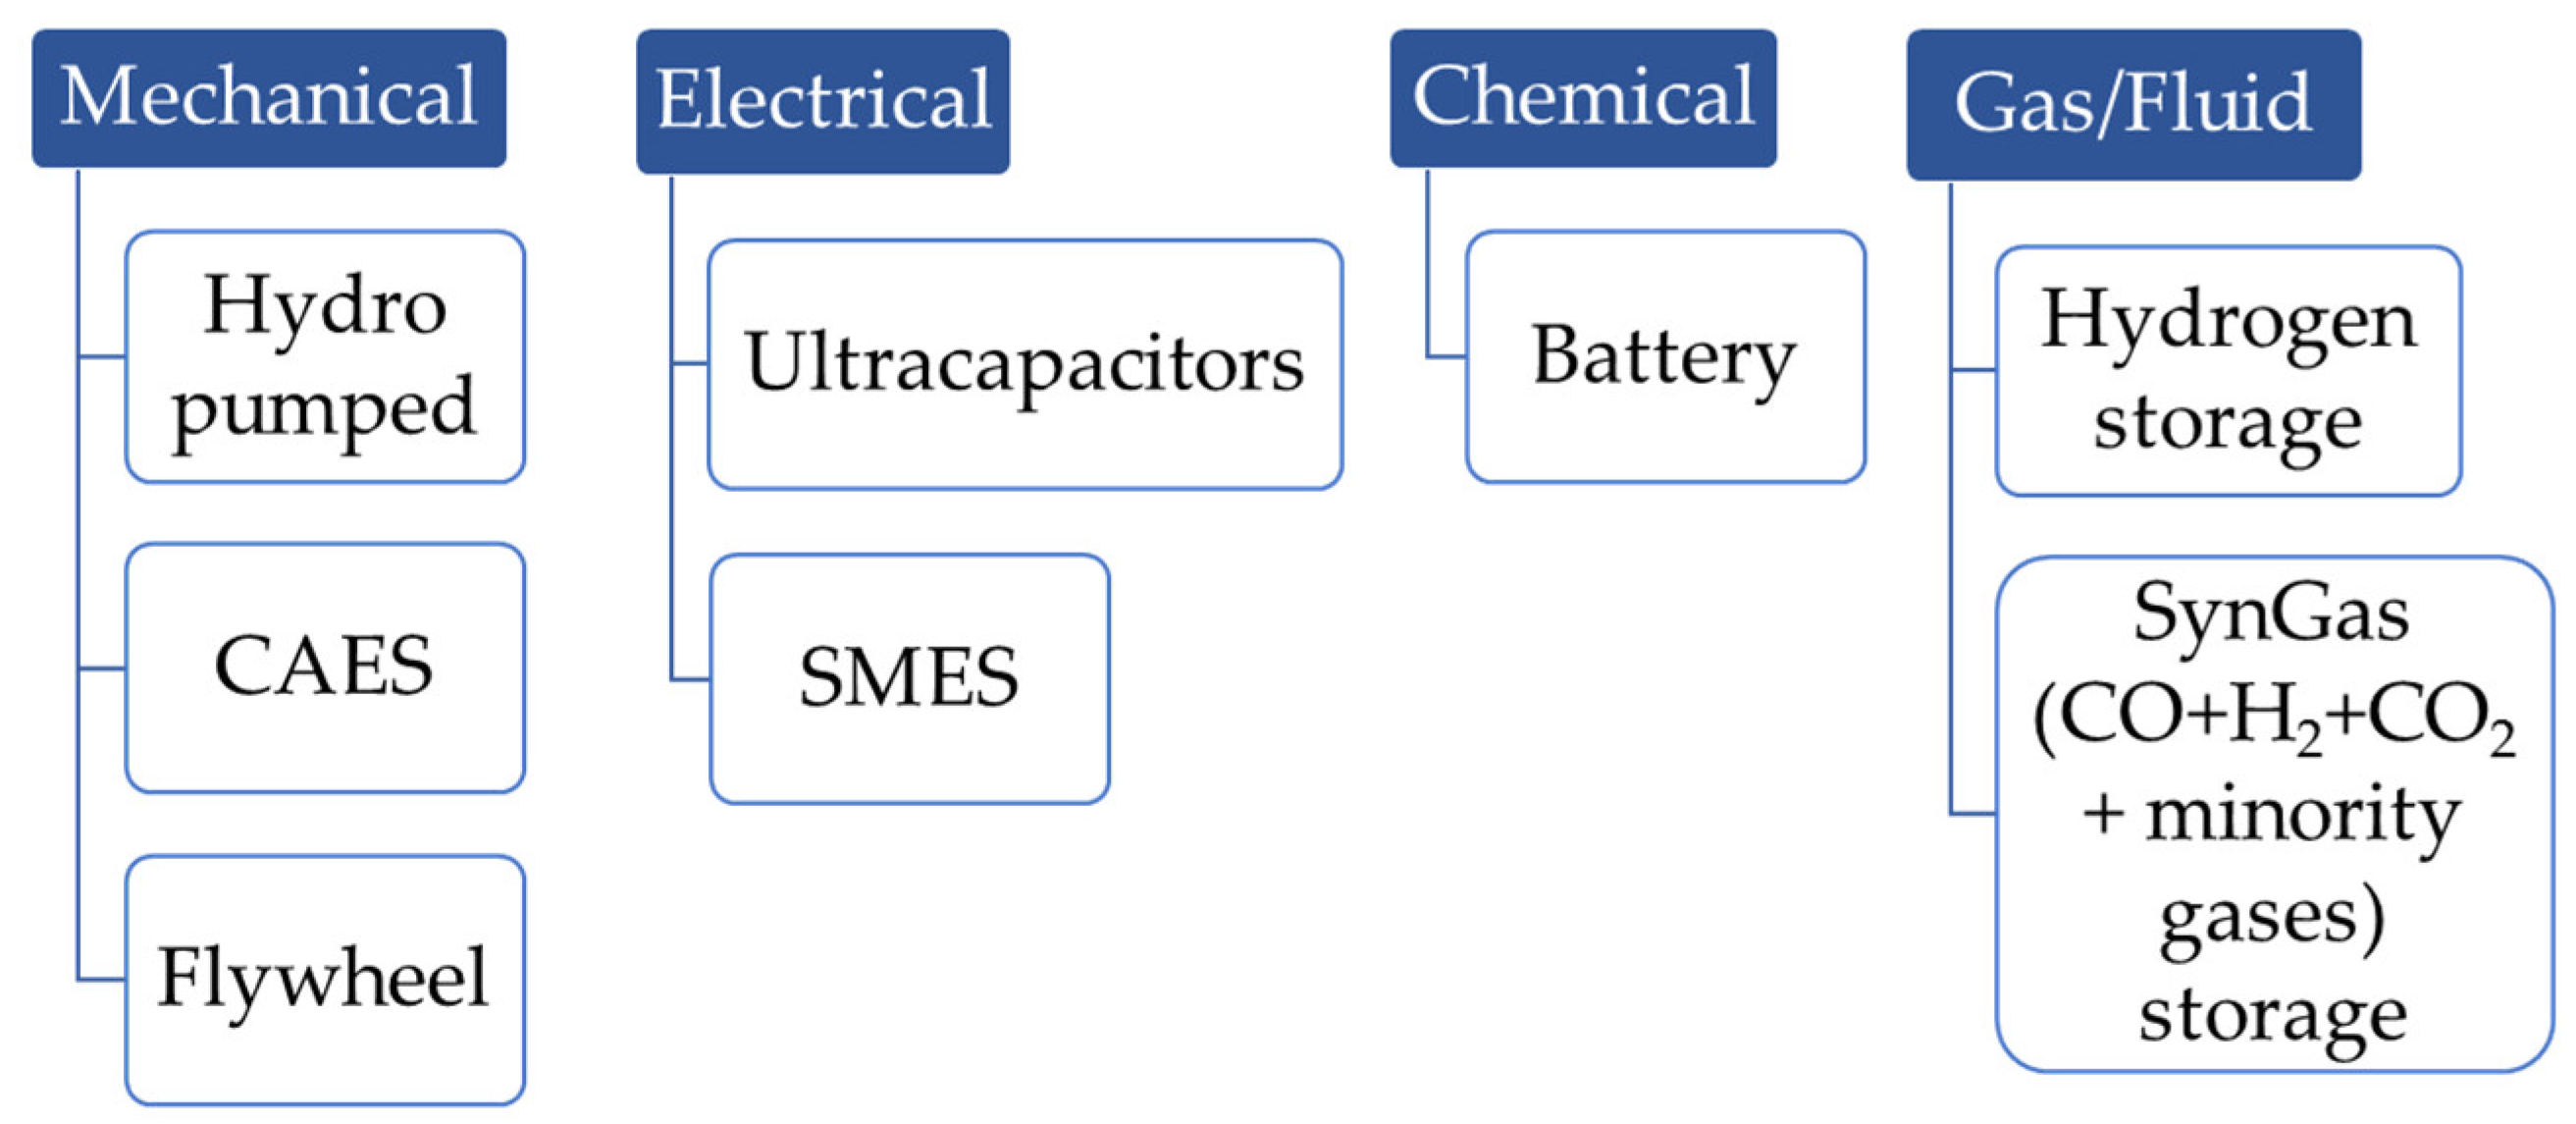
:1. Introduction
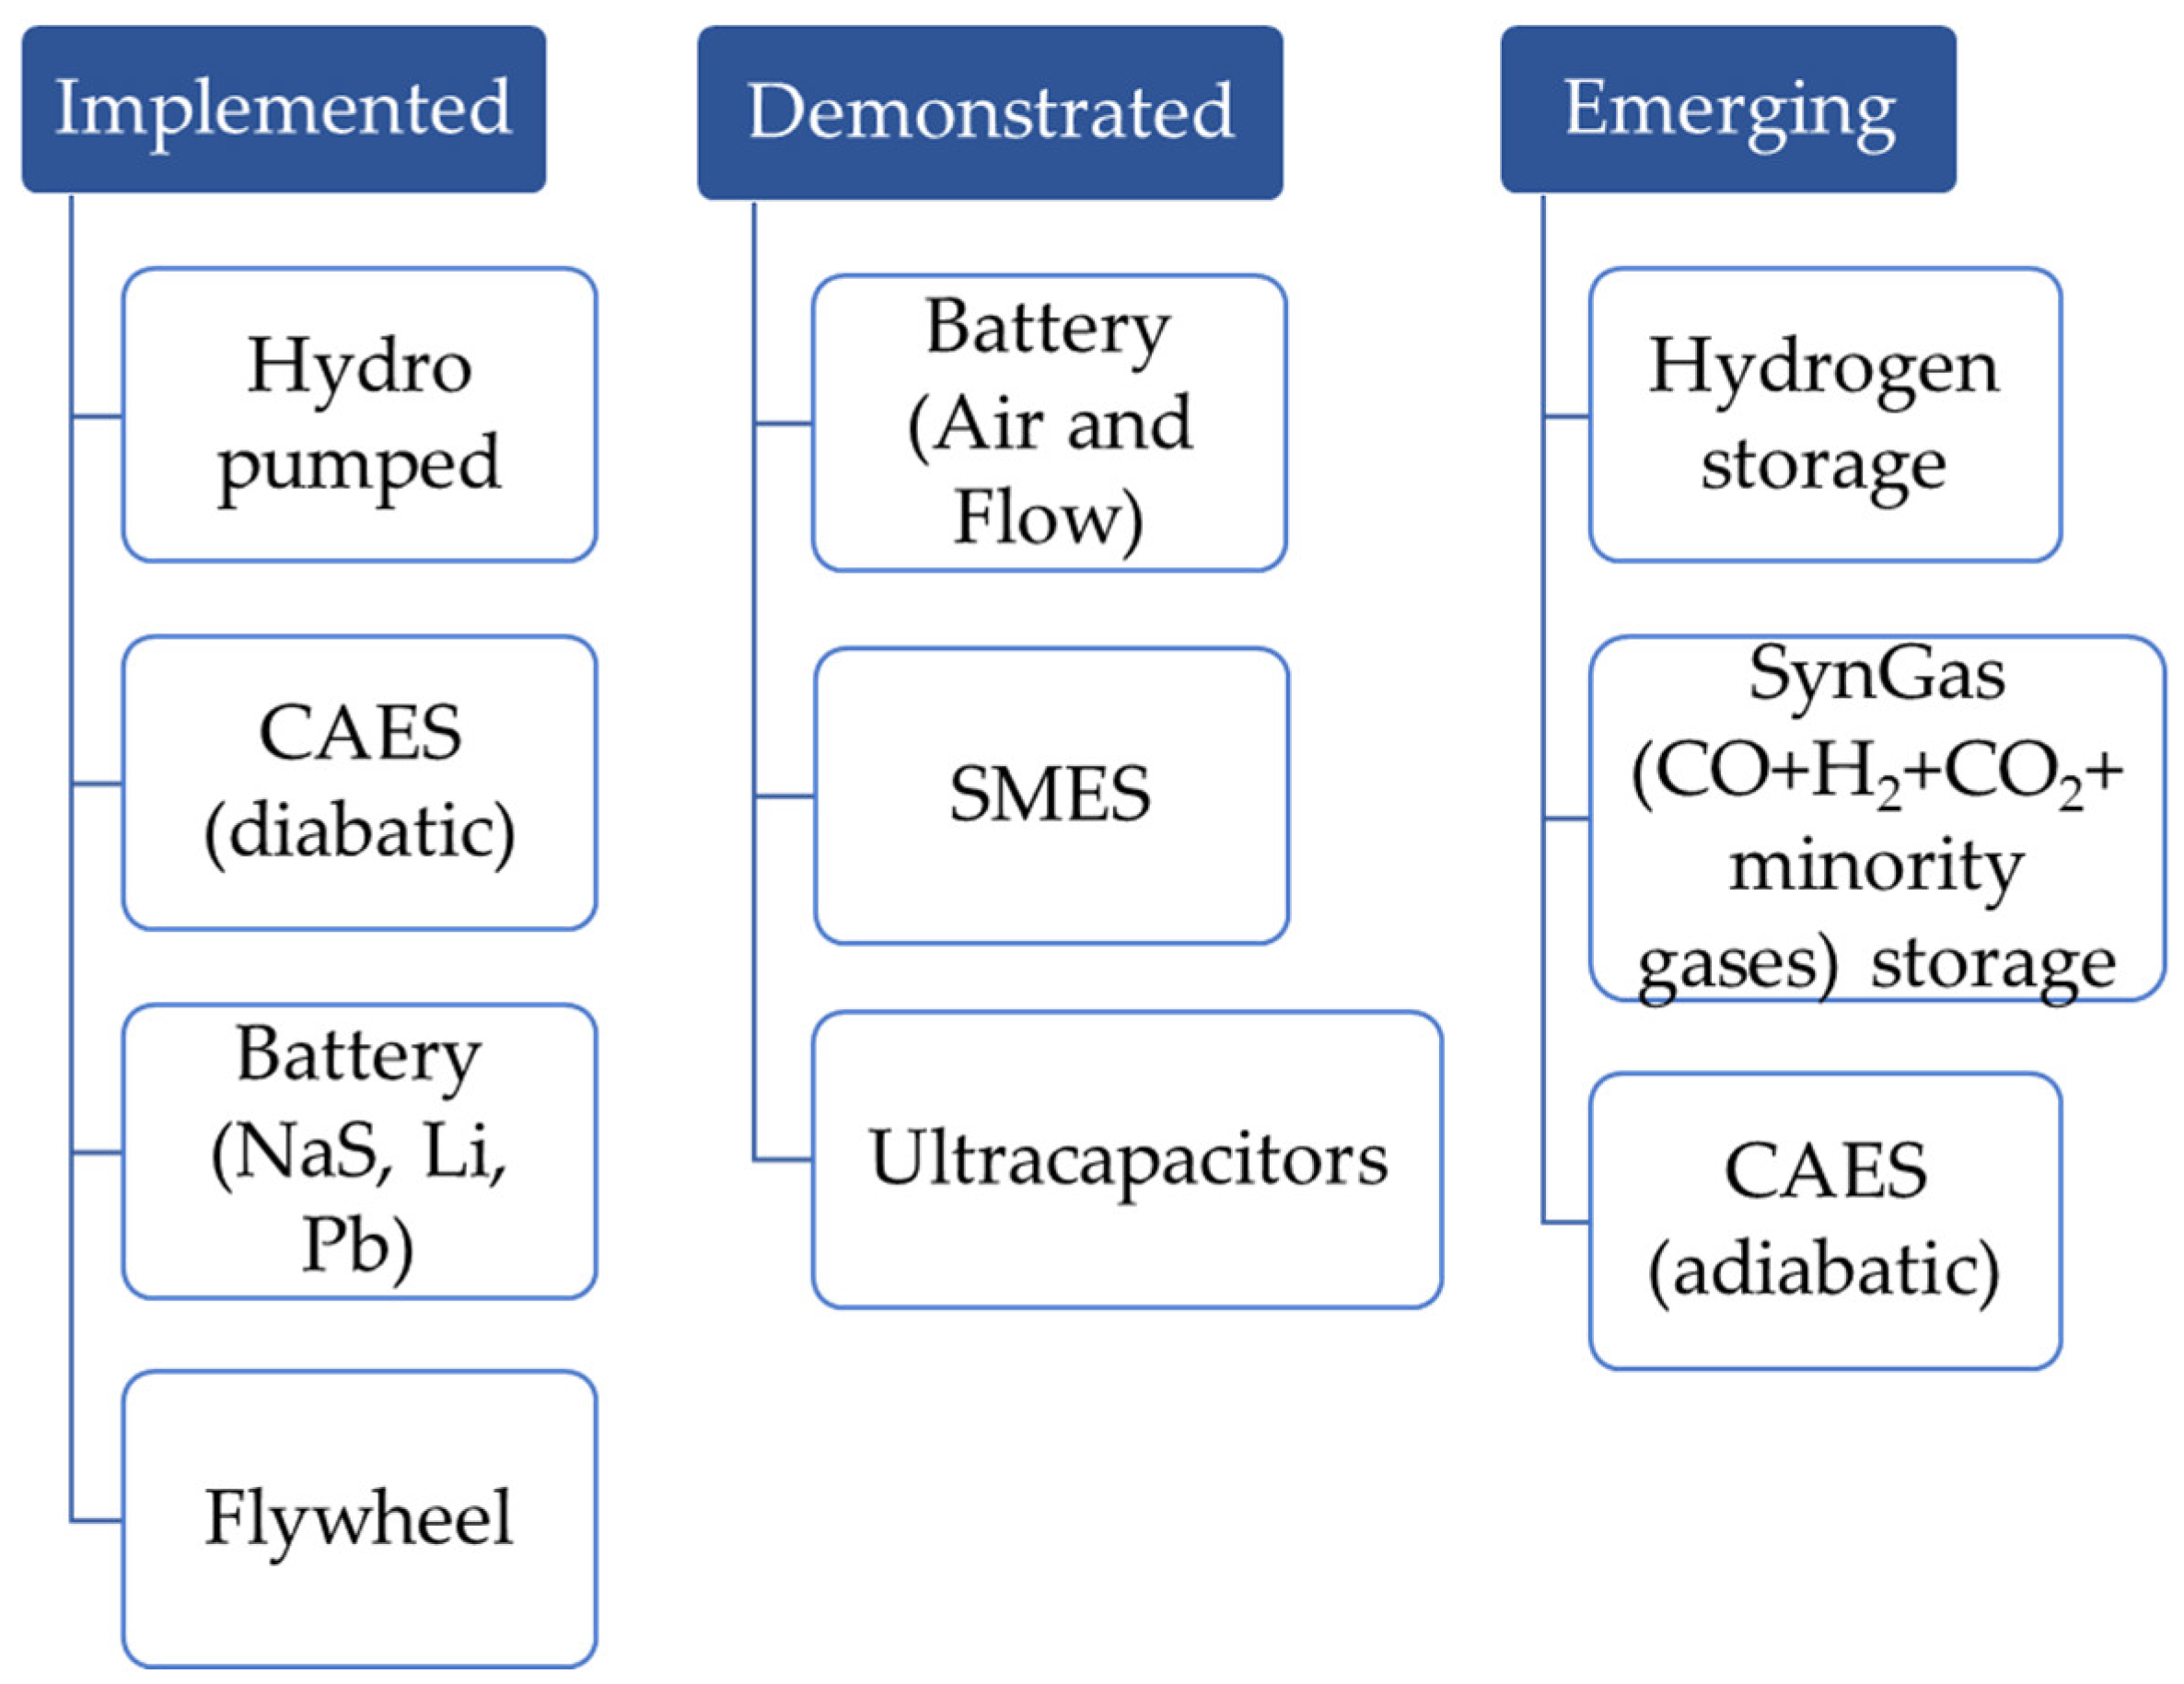
- A detailed study of battery and hydrogen storage technologies. The study includes fundamental principles of operation, classification and degree of technological maturity.
- A mathematical model for each technology, that allows to know the state of charge of the storage system in real time. In this way, it is possible to address energy management strategies in plants that combine storage systems of different nature such as hydrogen storage systems and battery systems.
- A technical analysis of all the studied technologies that allows to understand research trends and future possibilities in an attempt to aid in planning deciding policies.
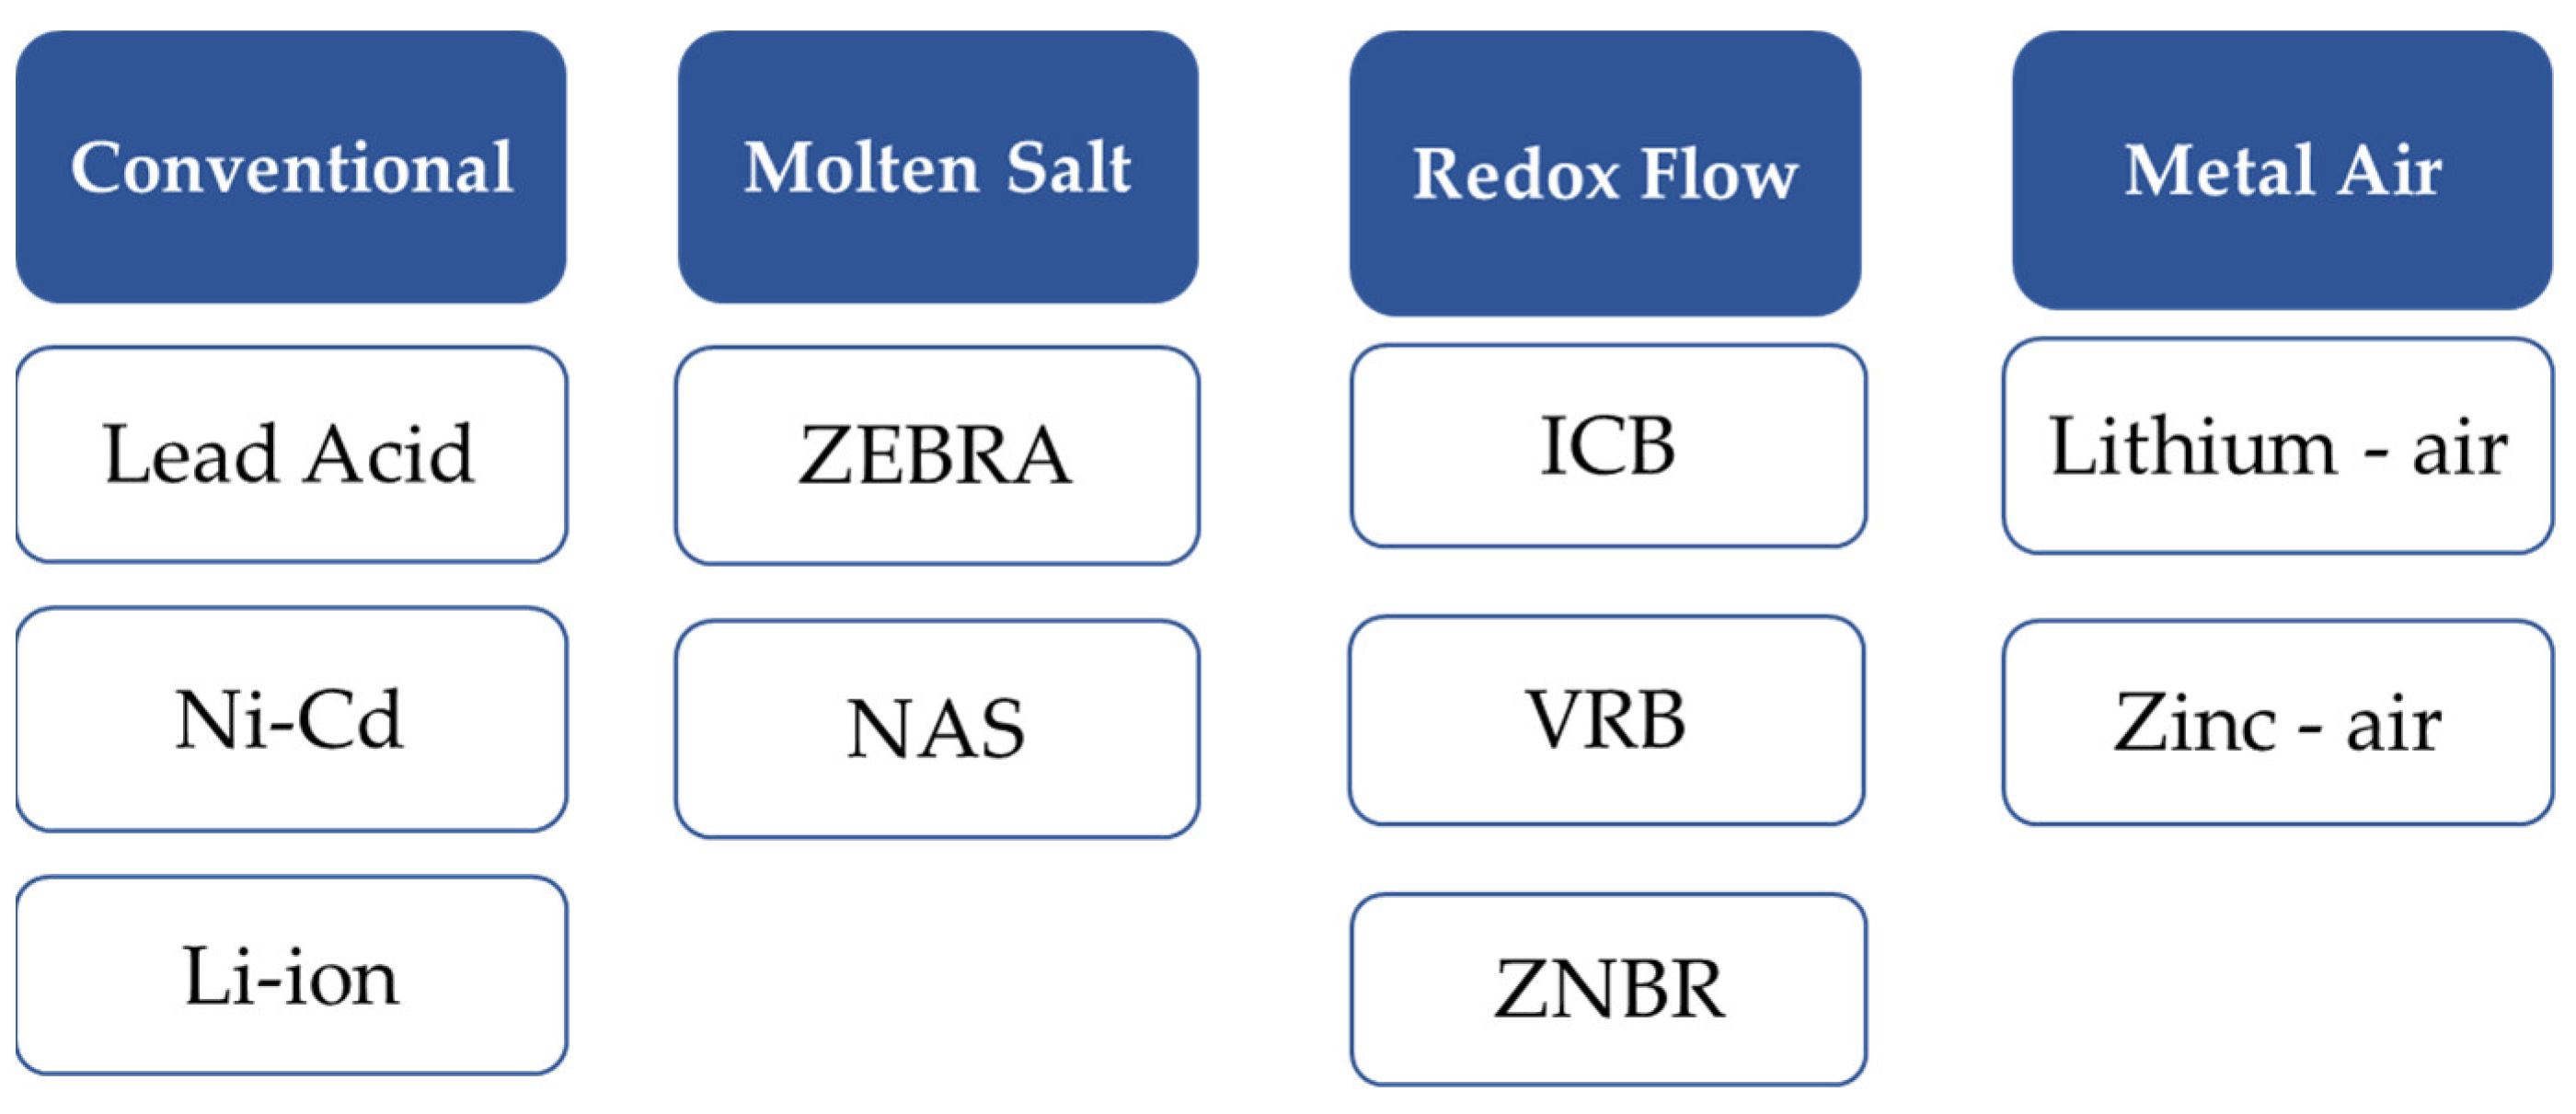
2. Storage in Batteries. As Many Advantages as Varieties
2.1. Conventional Technology
2.1.1. Fundamental Principles
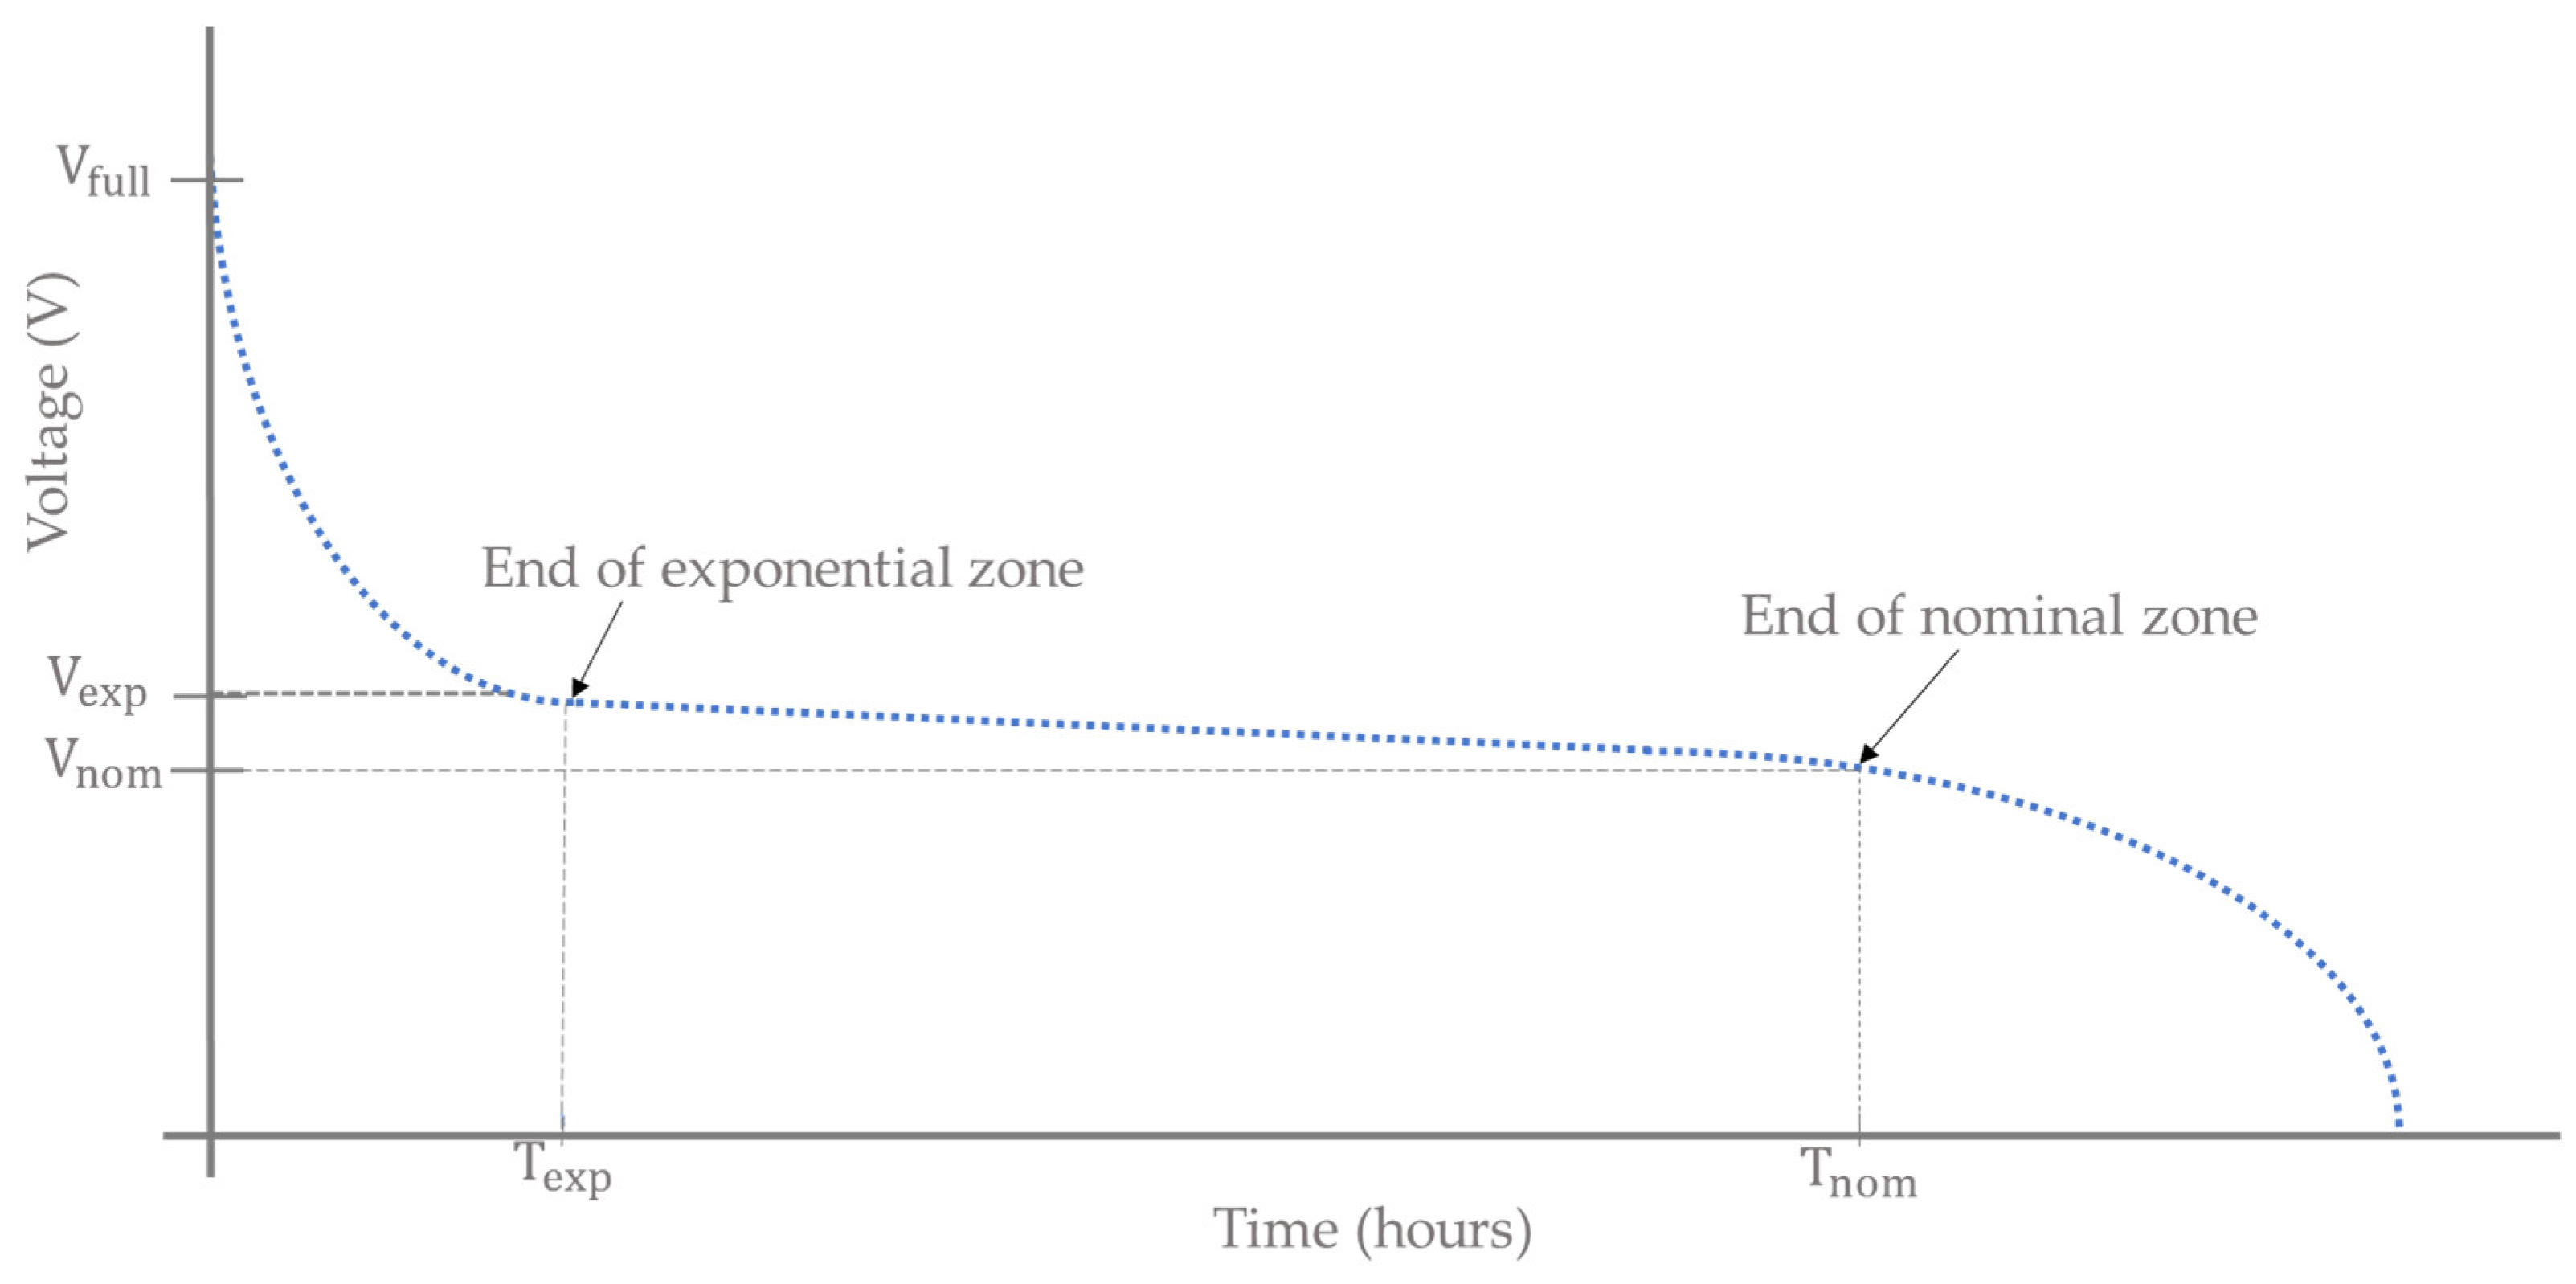
2.1.2. Mathematical Model
- : fully charged battery voltage (V)
- : voltage at the end of exponential zone (V)
- : battery capacity at the end of exponential zone (Ah)
- : voltage at the end of nominal zone (V)
- : battery capacity at the end of nominal zone (Ah).
2.1.3. Technical Comparison
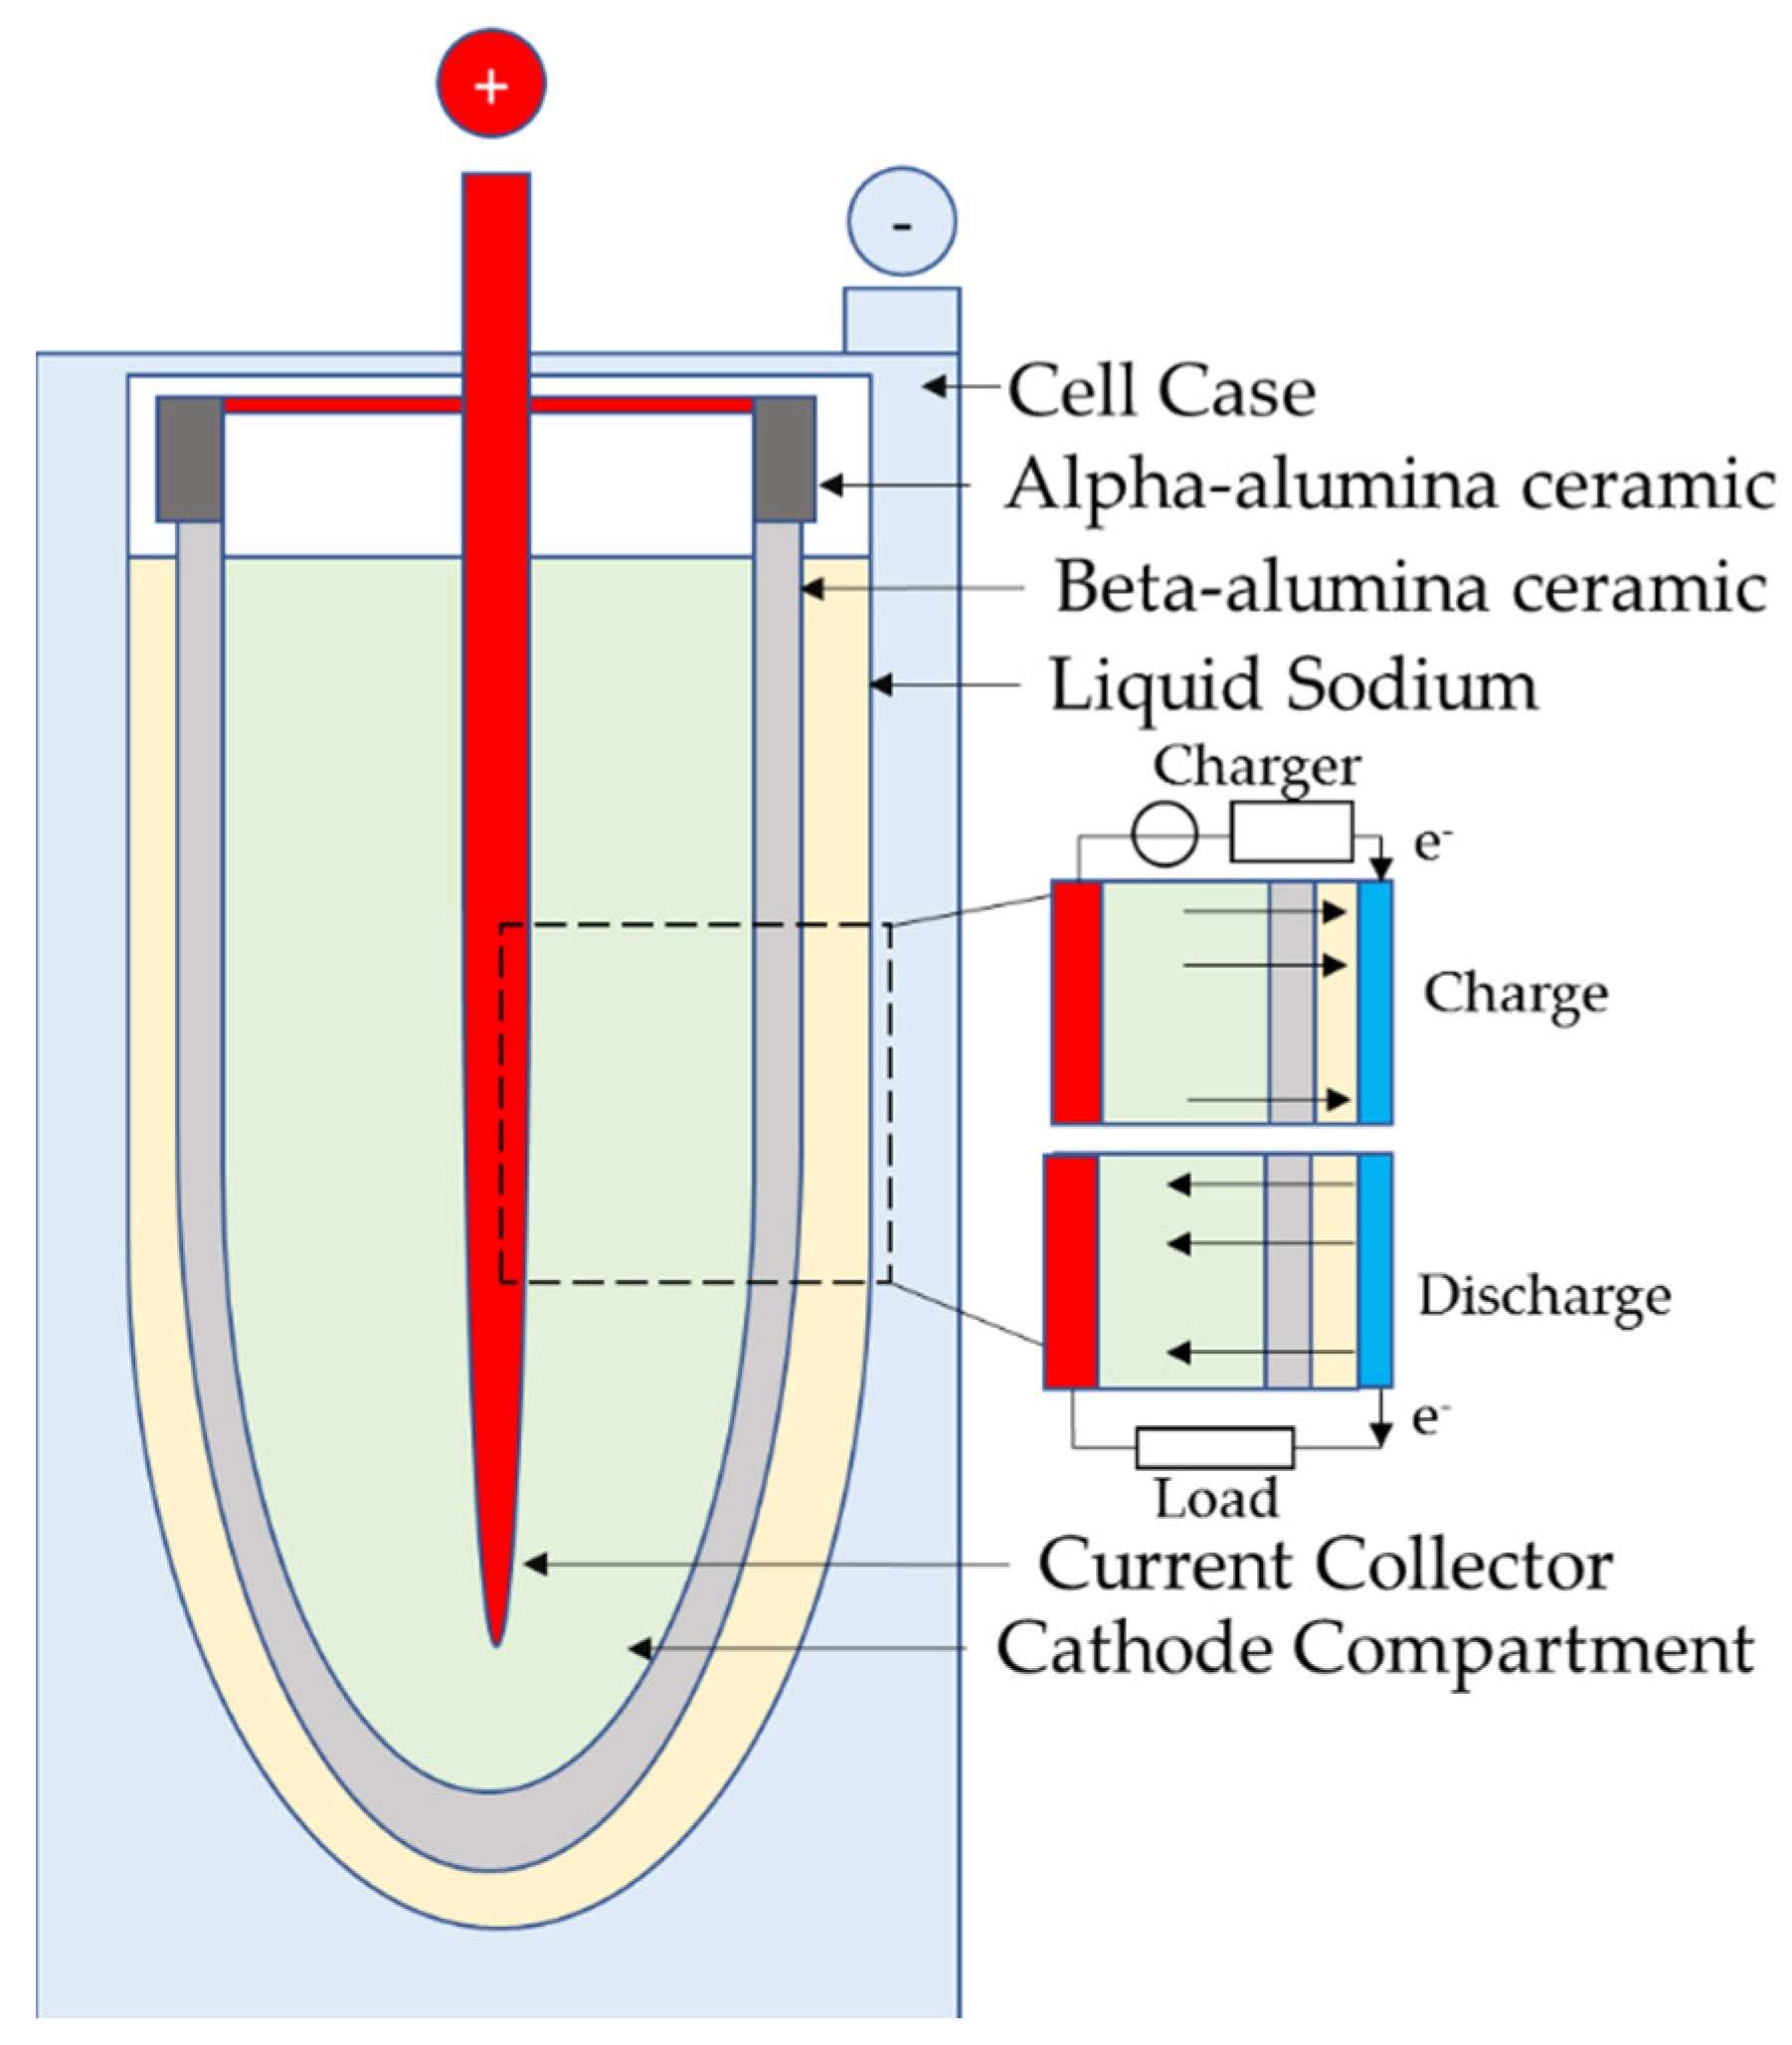
2.2. Molten Salt Batteries
2.2.1. Fundamental Principles
2.2.2. Technical Comparison
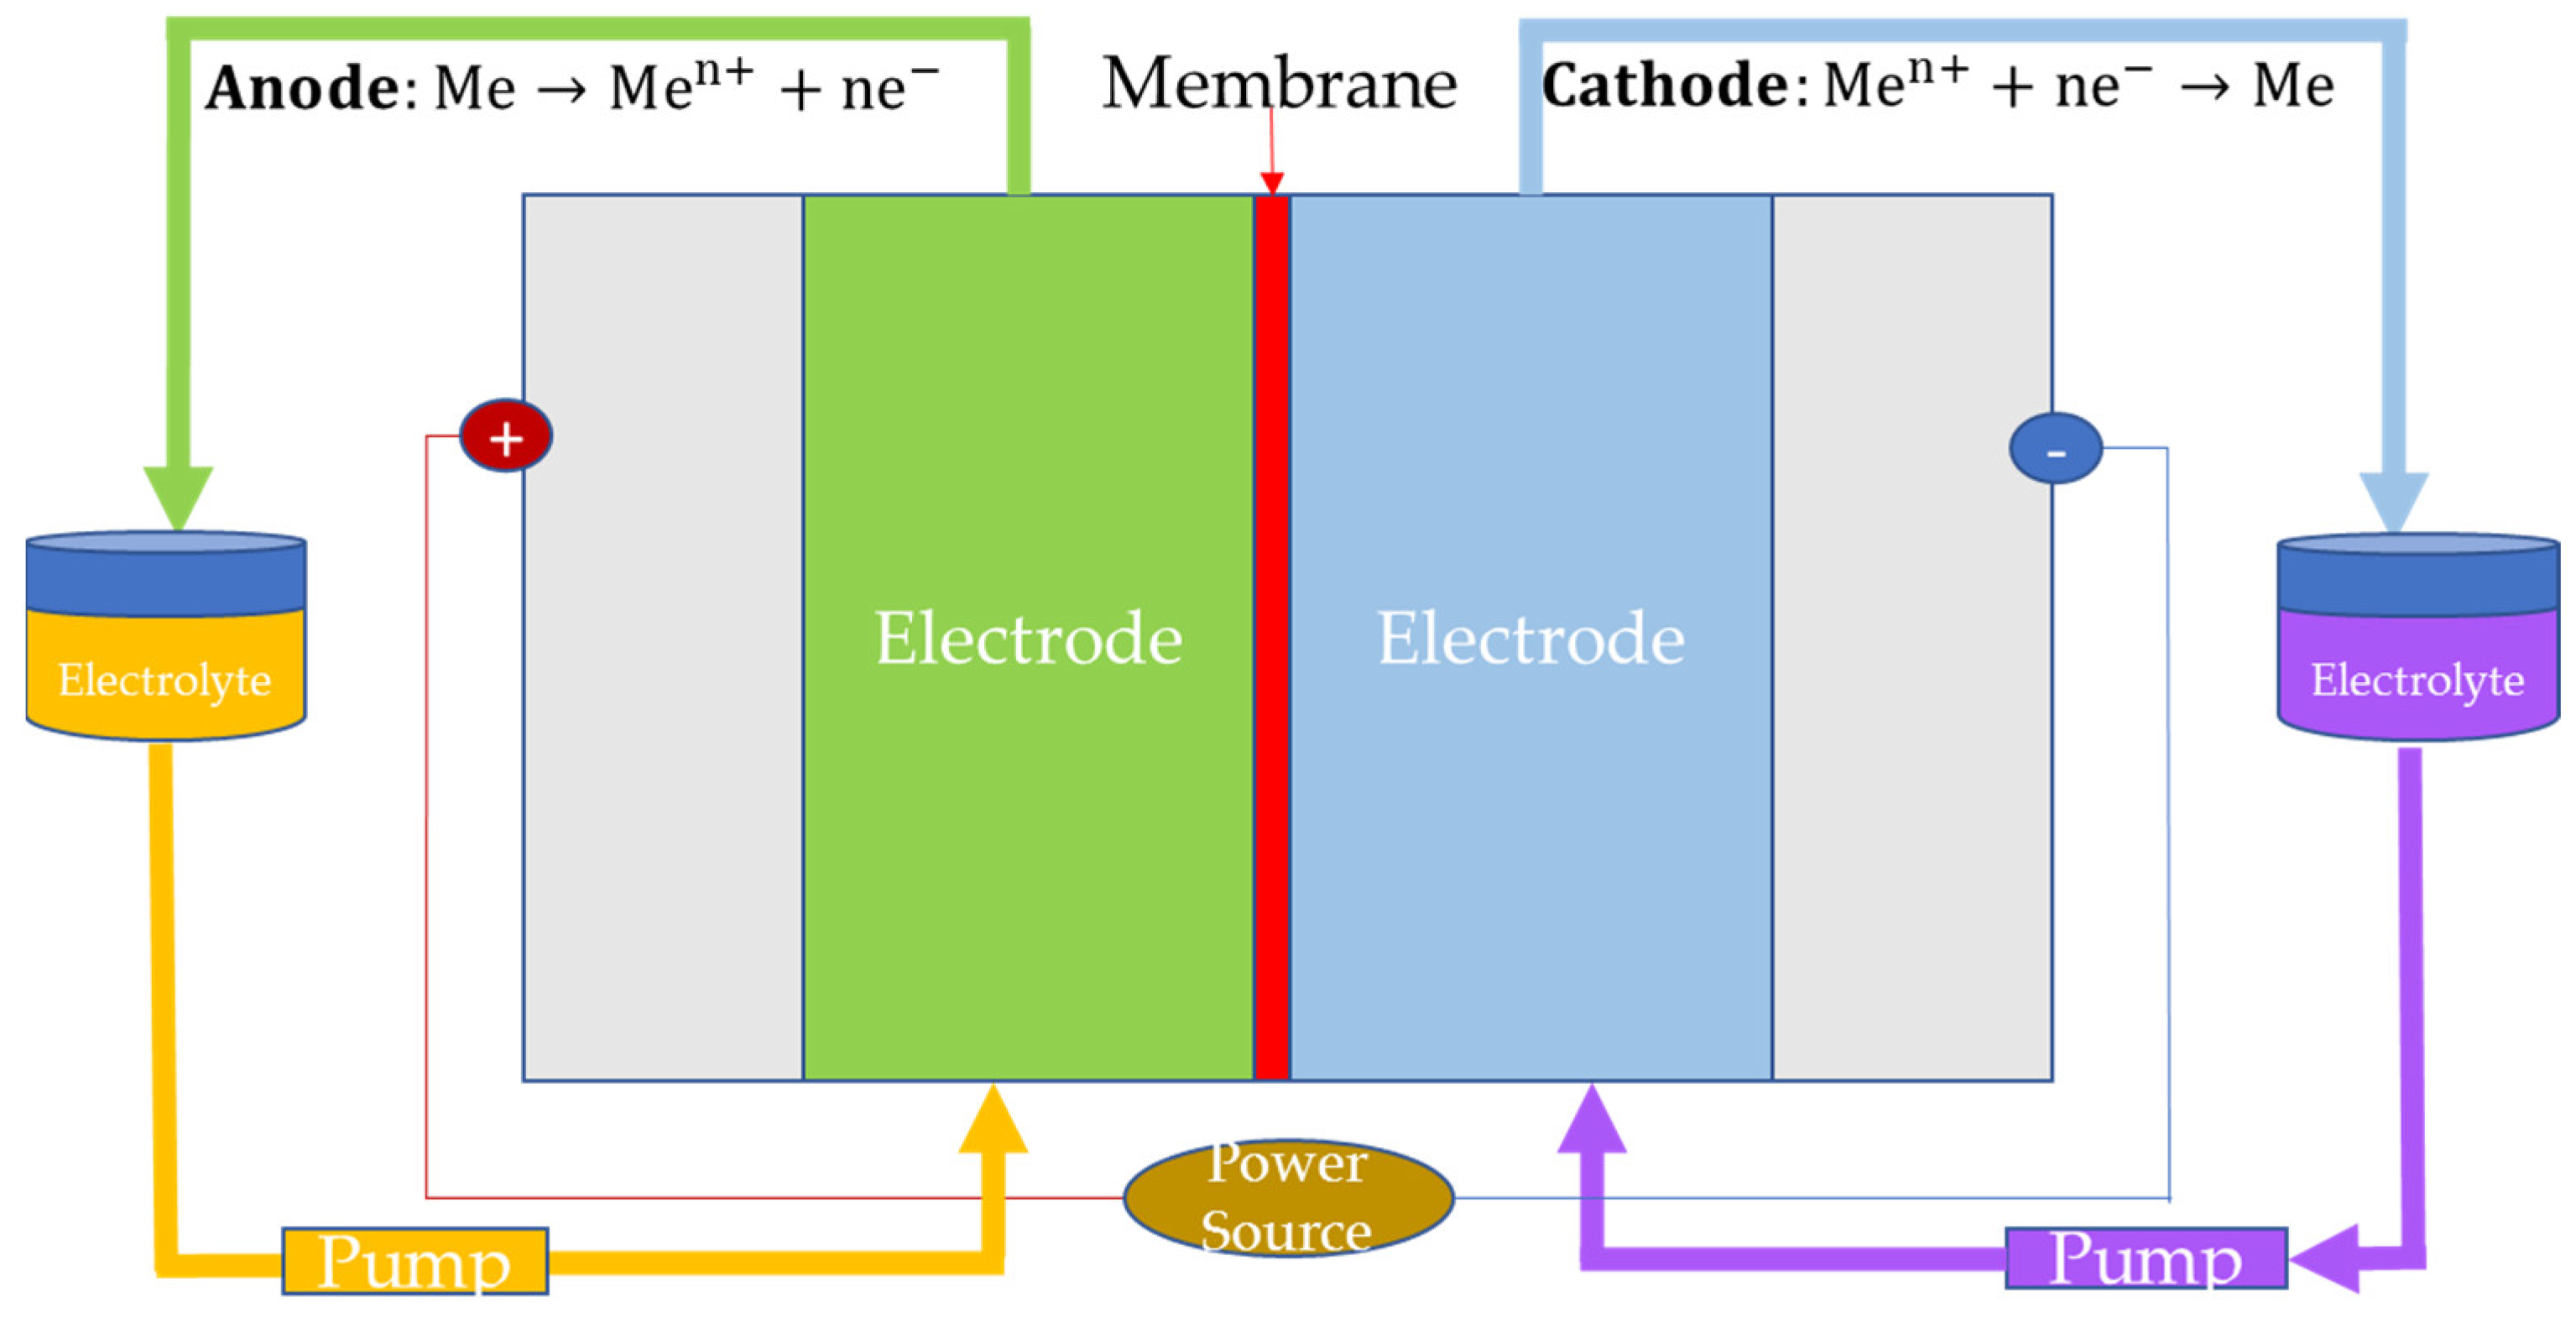
2.3. Redox Flow Batteries
2.3.1. Fundamental Principles
2.3.2. Technical Comparison
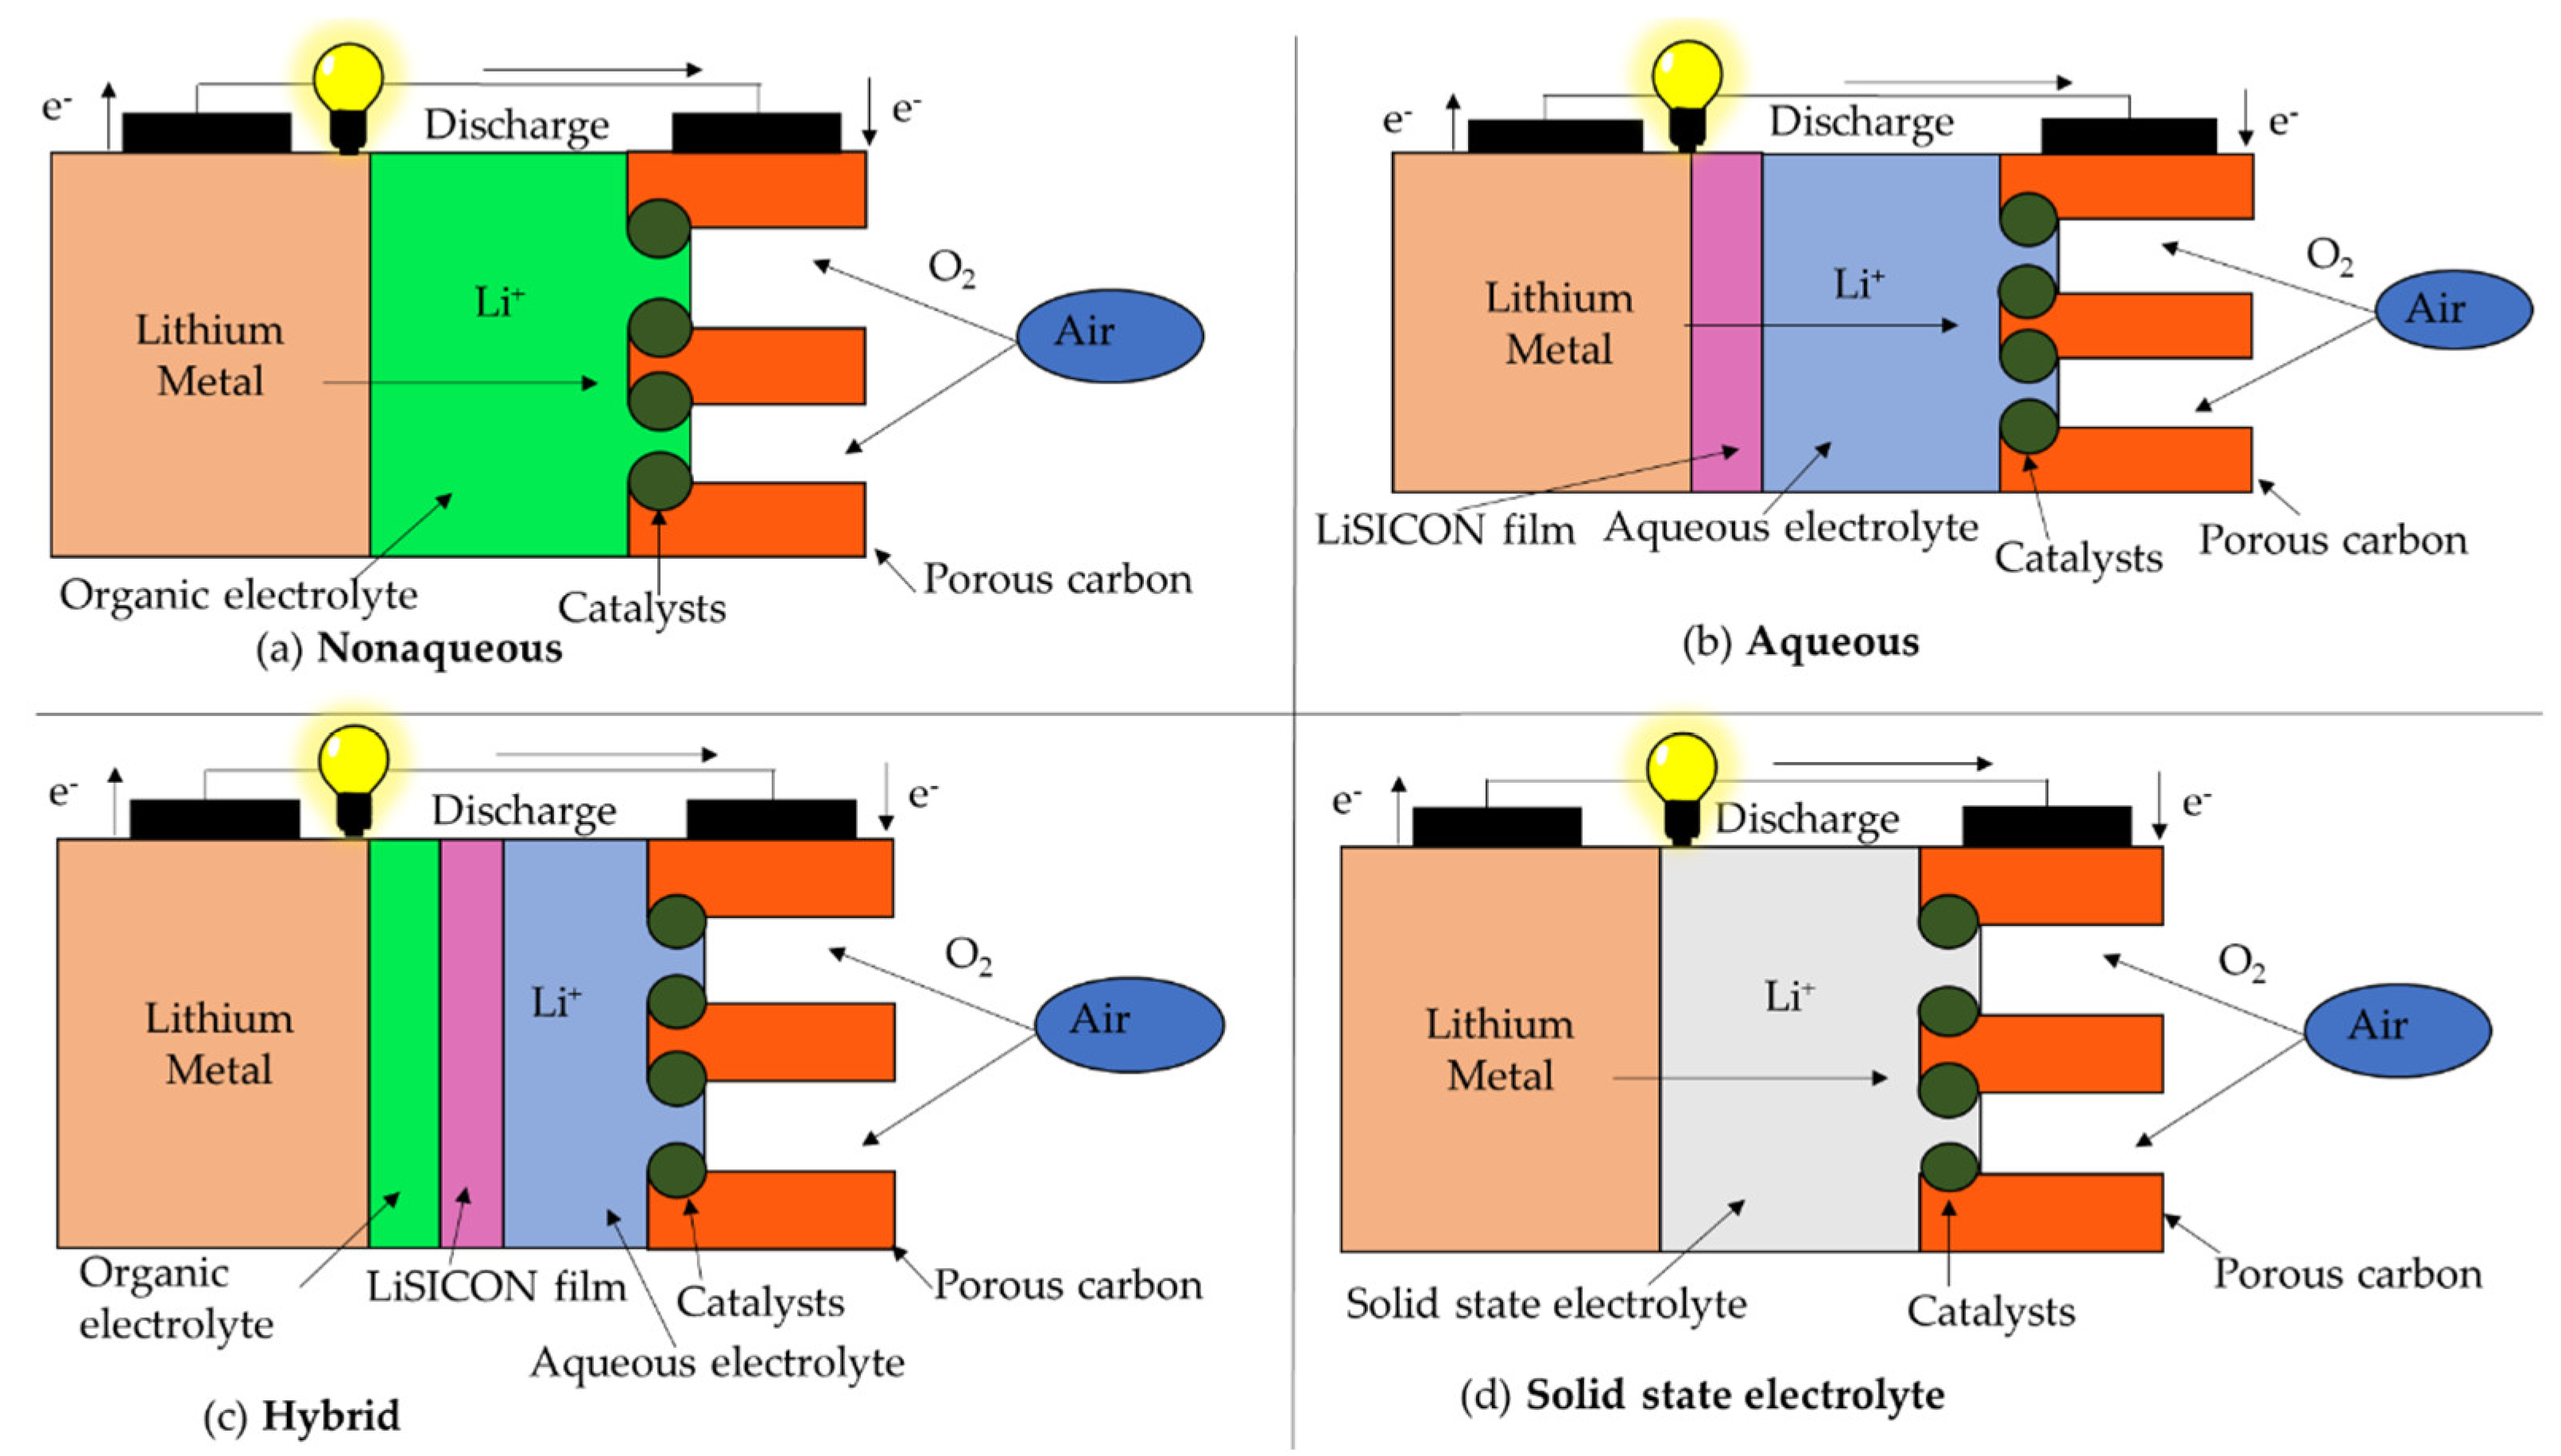
2.4. Metal-Air Batteries
2.4.1. Fundamental Principles
2.4.2. Technical Comparison
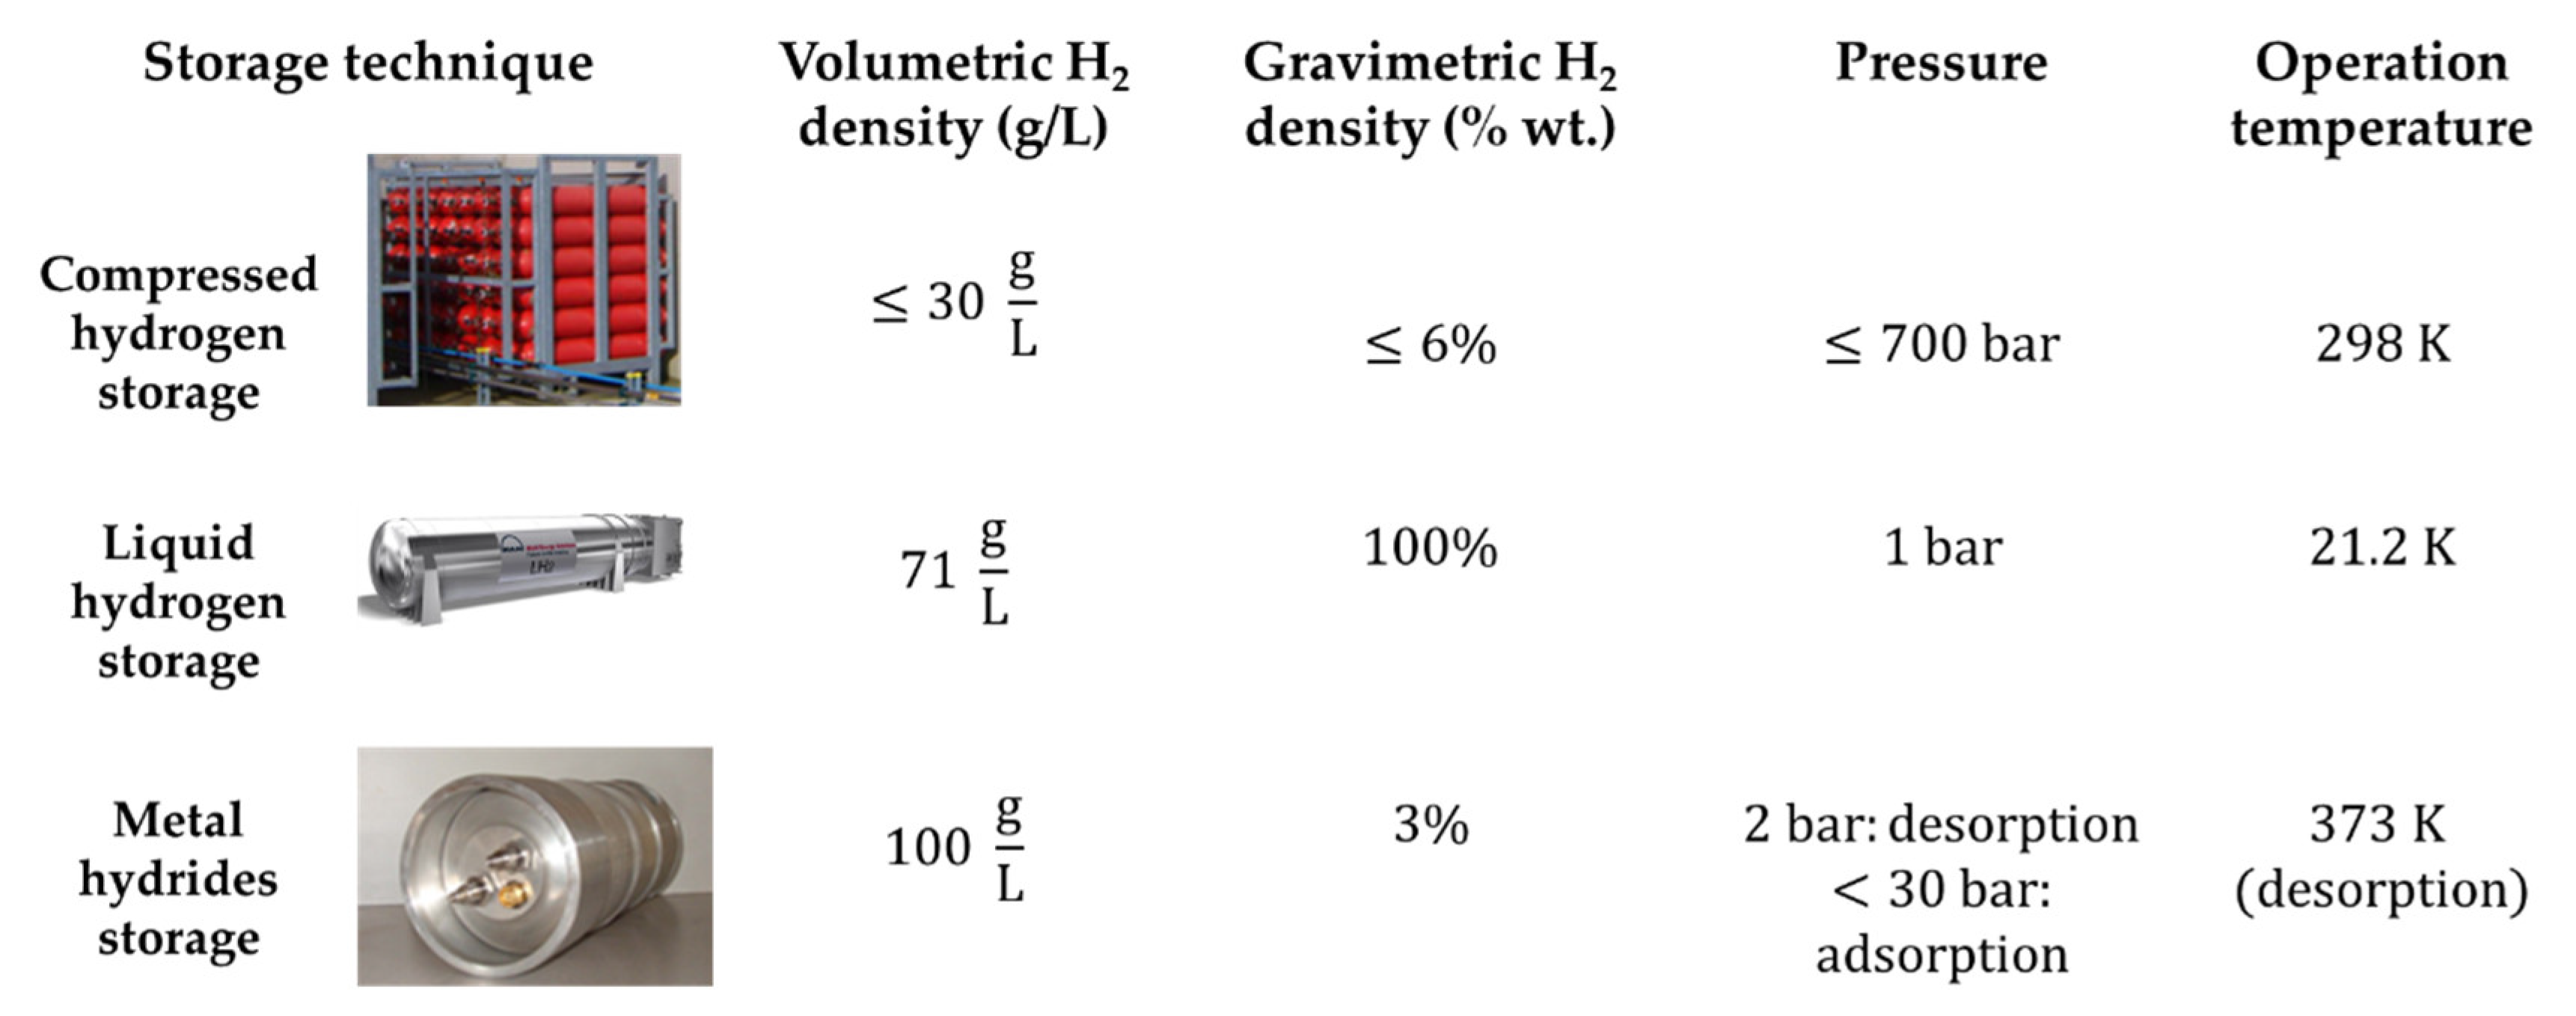
3. Hydrogen Storage. The Power of an Invisible Fuel
3.1. Compressed Hydrogen Storage
3.1.1. Fundamental Principles
3.1.2. Mathematical Model
- : molar mass of gas (g/mol)
- : gas pressure (atm)
- : gas density (g/L)
- : universal gas constant (0.082 (atm·L)/(K·mol))
- : gas temperature (K)
- : Noble-Abel constant (0.007691 L/g for hydrogen gas).
- : state of charge of the hydrogen tank (%)
- : maximum hydrogen tank pressure (atm).
3.2. Liquid Hydrogen Storage
3.2.1. Fundamental Principles
3.2.2. Mathematical Model
- : state of charge of the liquid hydrogen tank (%)
- : hydrogen mass in the tank (g)
- : liquid hydrogen density (71 g/L)
- : total volume of the liquid hydrogen storage tank (L).
3.3. Metal Hydride Storage
3.3.1. Fundamental Principles
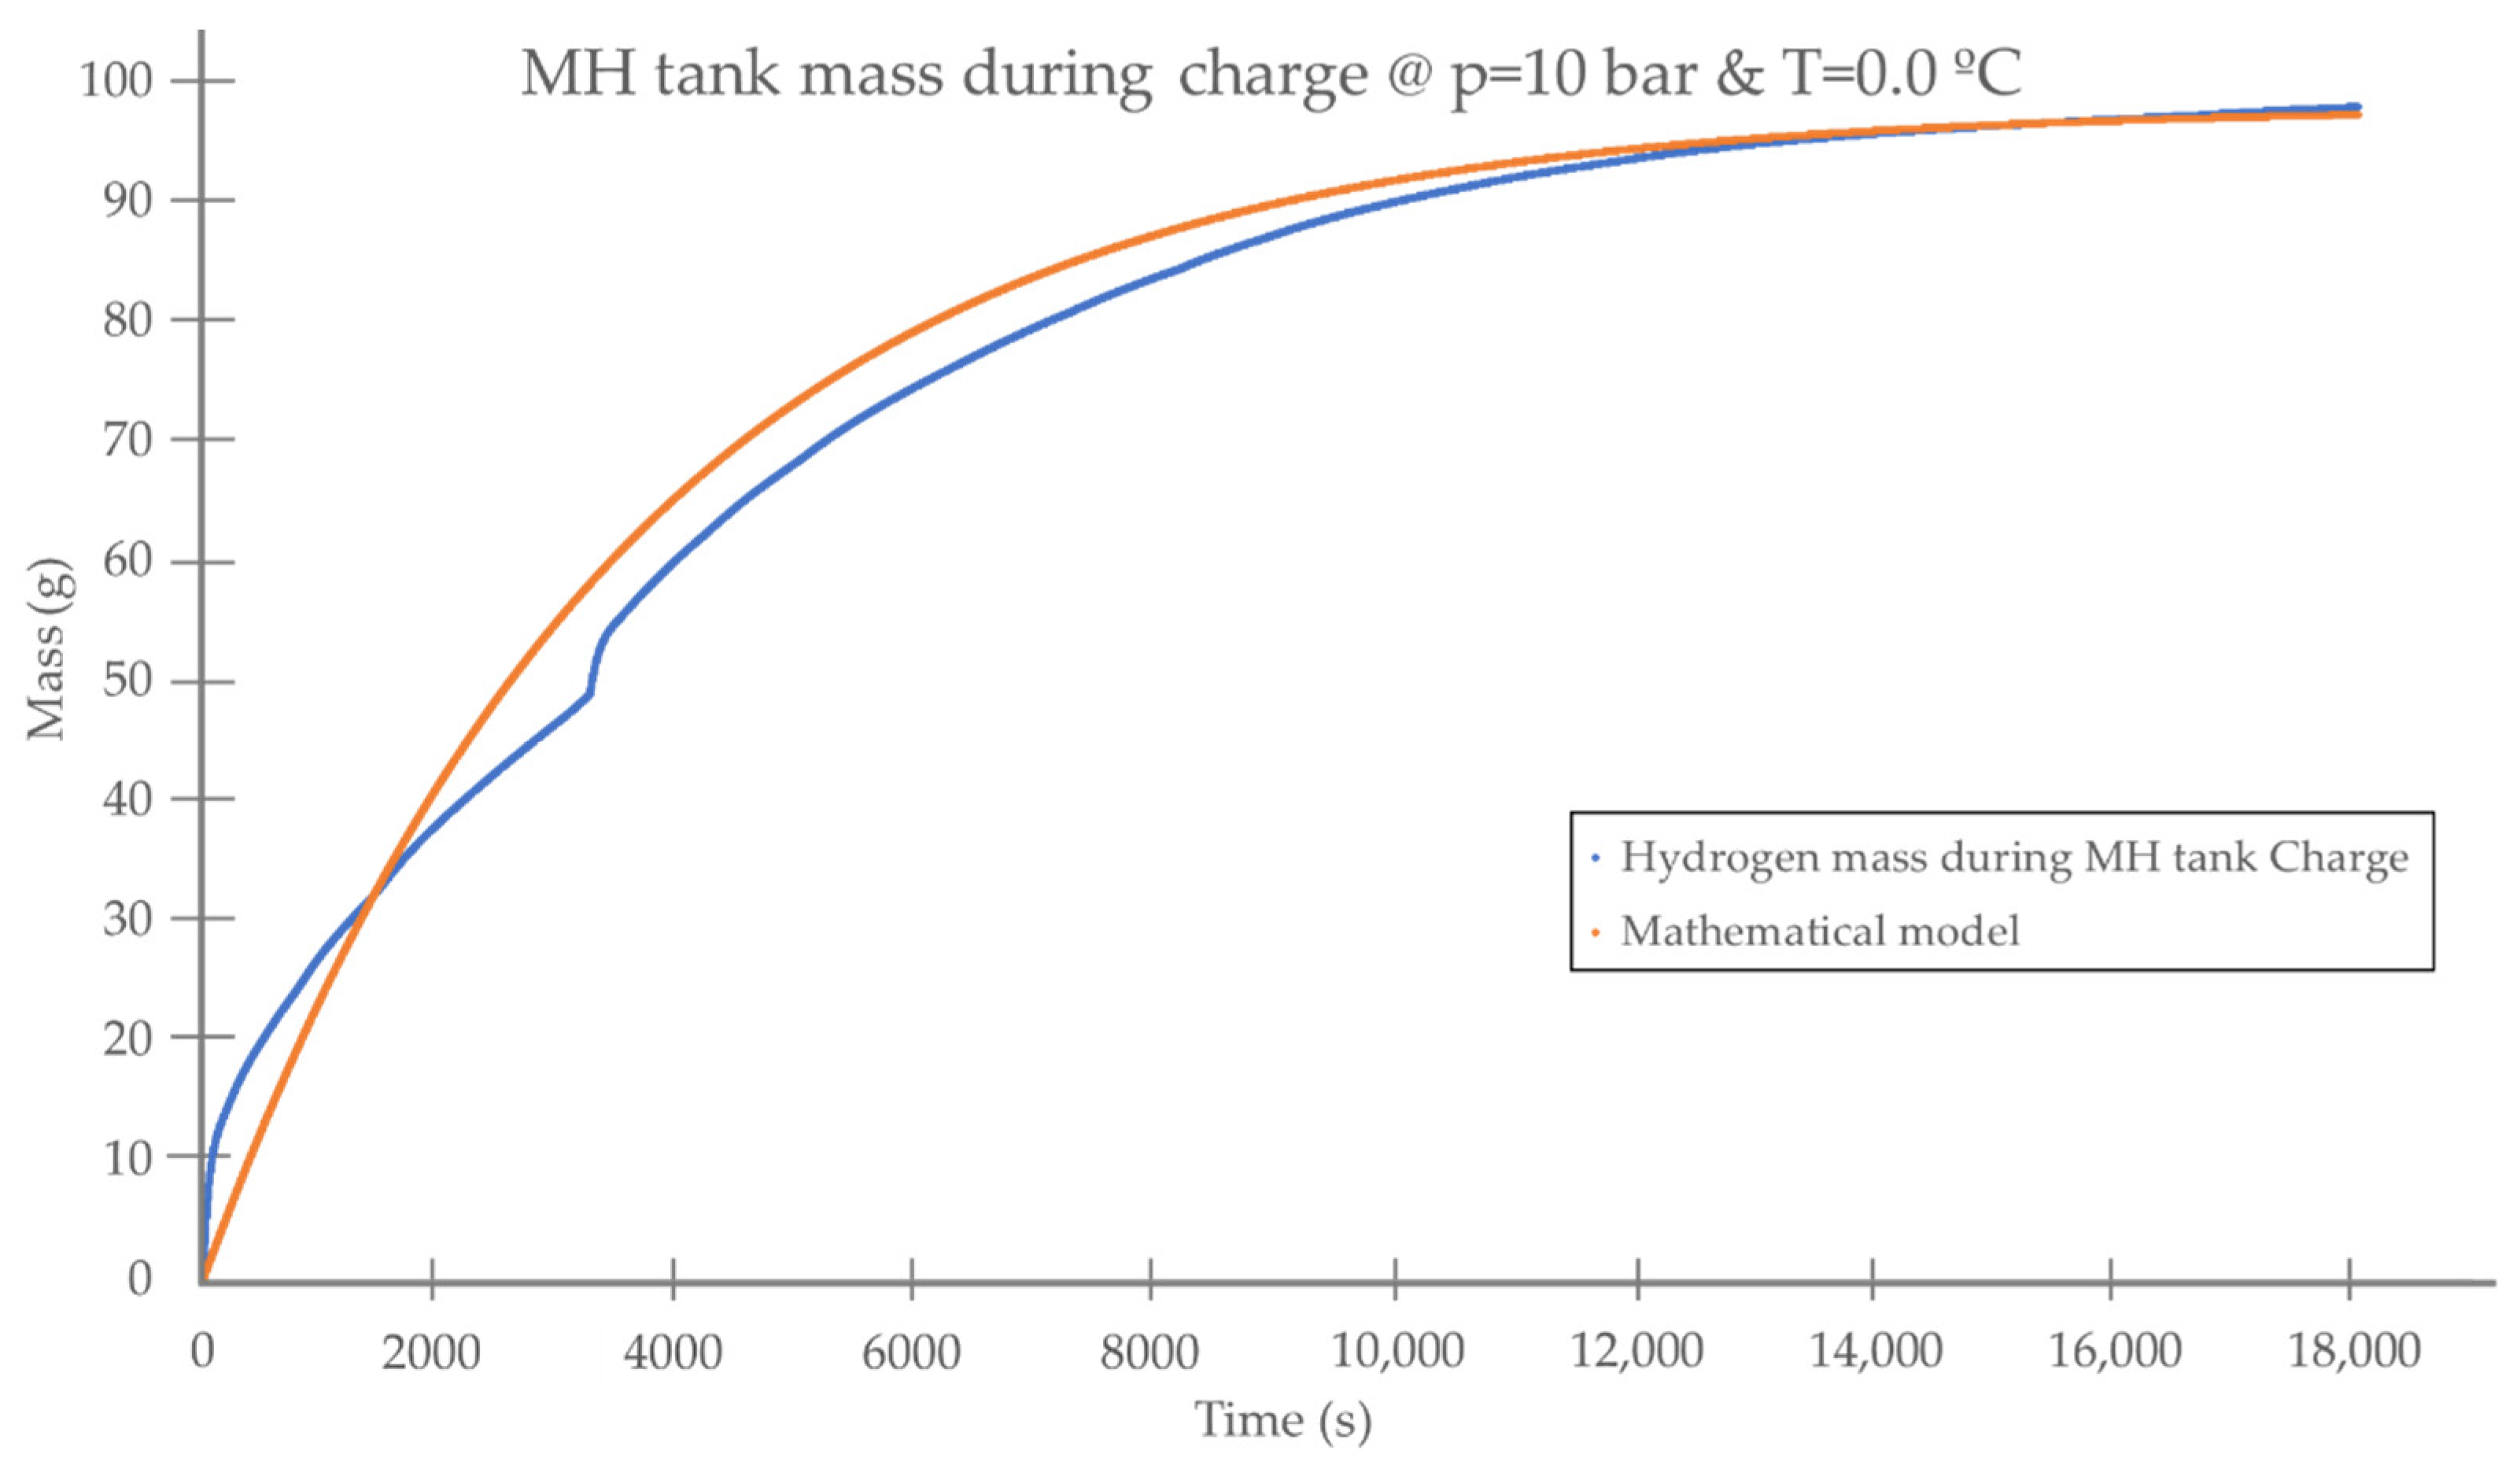
3.3.2. Mathematical Model
- : hydrogenated metal hydride density ()
- : fraction ()
- : atomic ratio of hydrogen to metal (H/M)
- : swelling of the alloy volume during absorption/desorption (%)
- : maximum atomic ratio of hydrogen to metal (H/M)
- : initial metal hydride density ().
- : metal hydride tank packing density (g/L)
- : metal hydride tank mass when not hydrogenated (g)
- : metal hydride tank radius (m)
- : metal hydride tank height (m).
- : metal hydride tank mass (g)
- : nominal MH tank hydrogen mass (g).
- : hydrogen mass in the metal hydride tank (g)
- : final hydrogen mass in the metal hydride tank (g)
- : time (s)
- : initial time (s)
- : dimensionless constant to be adjusted by user (in case of experimental test carried by authors, )
- : total time to charge the metal hydride tank (s).
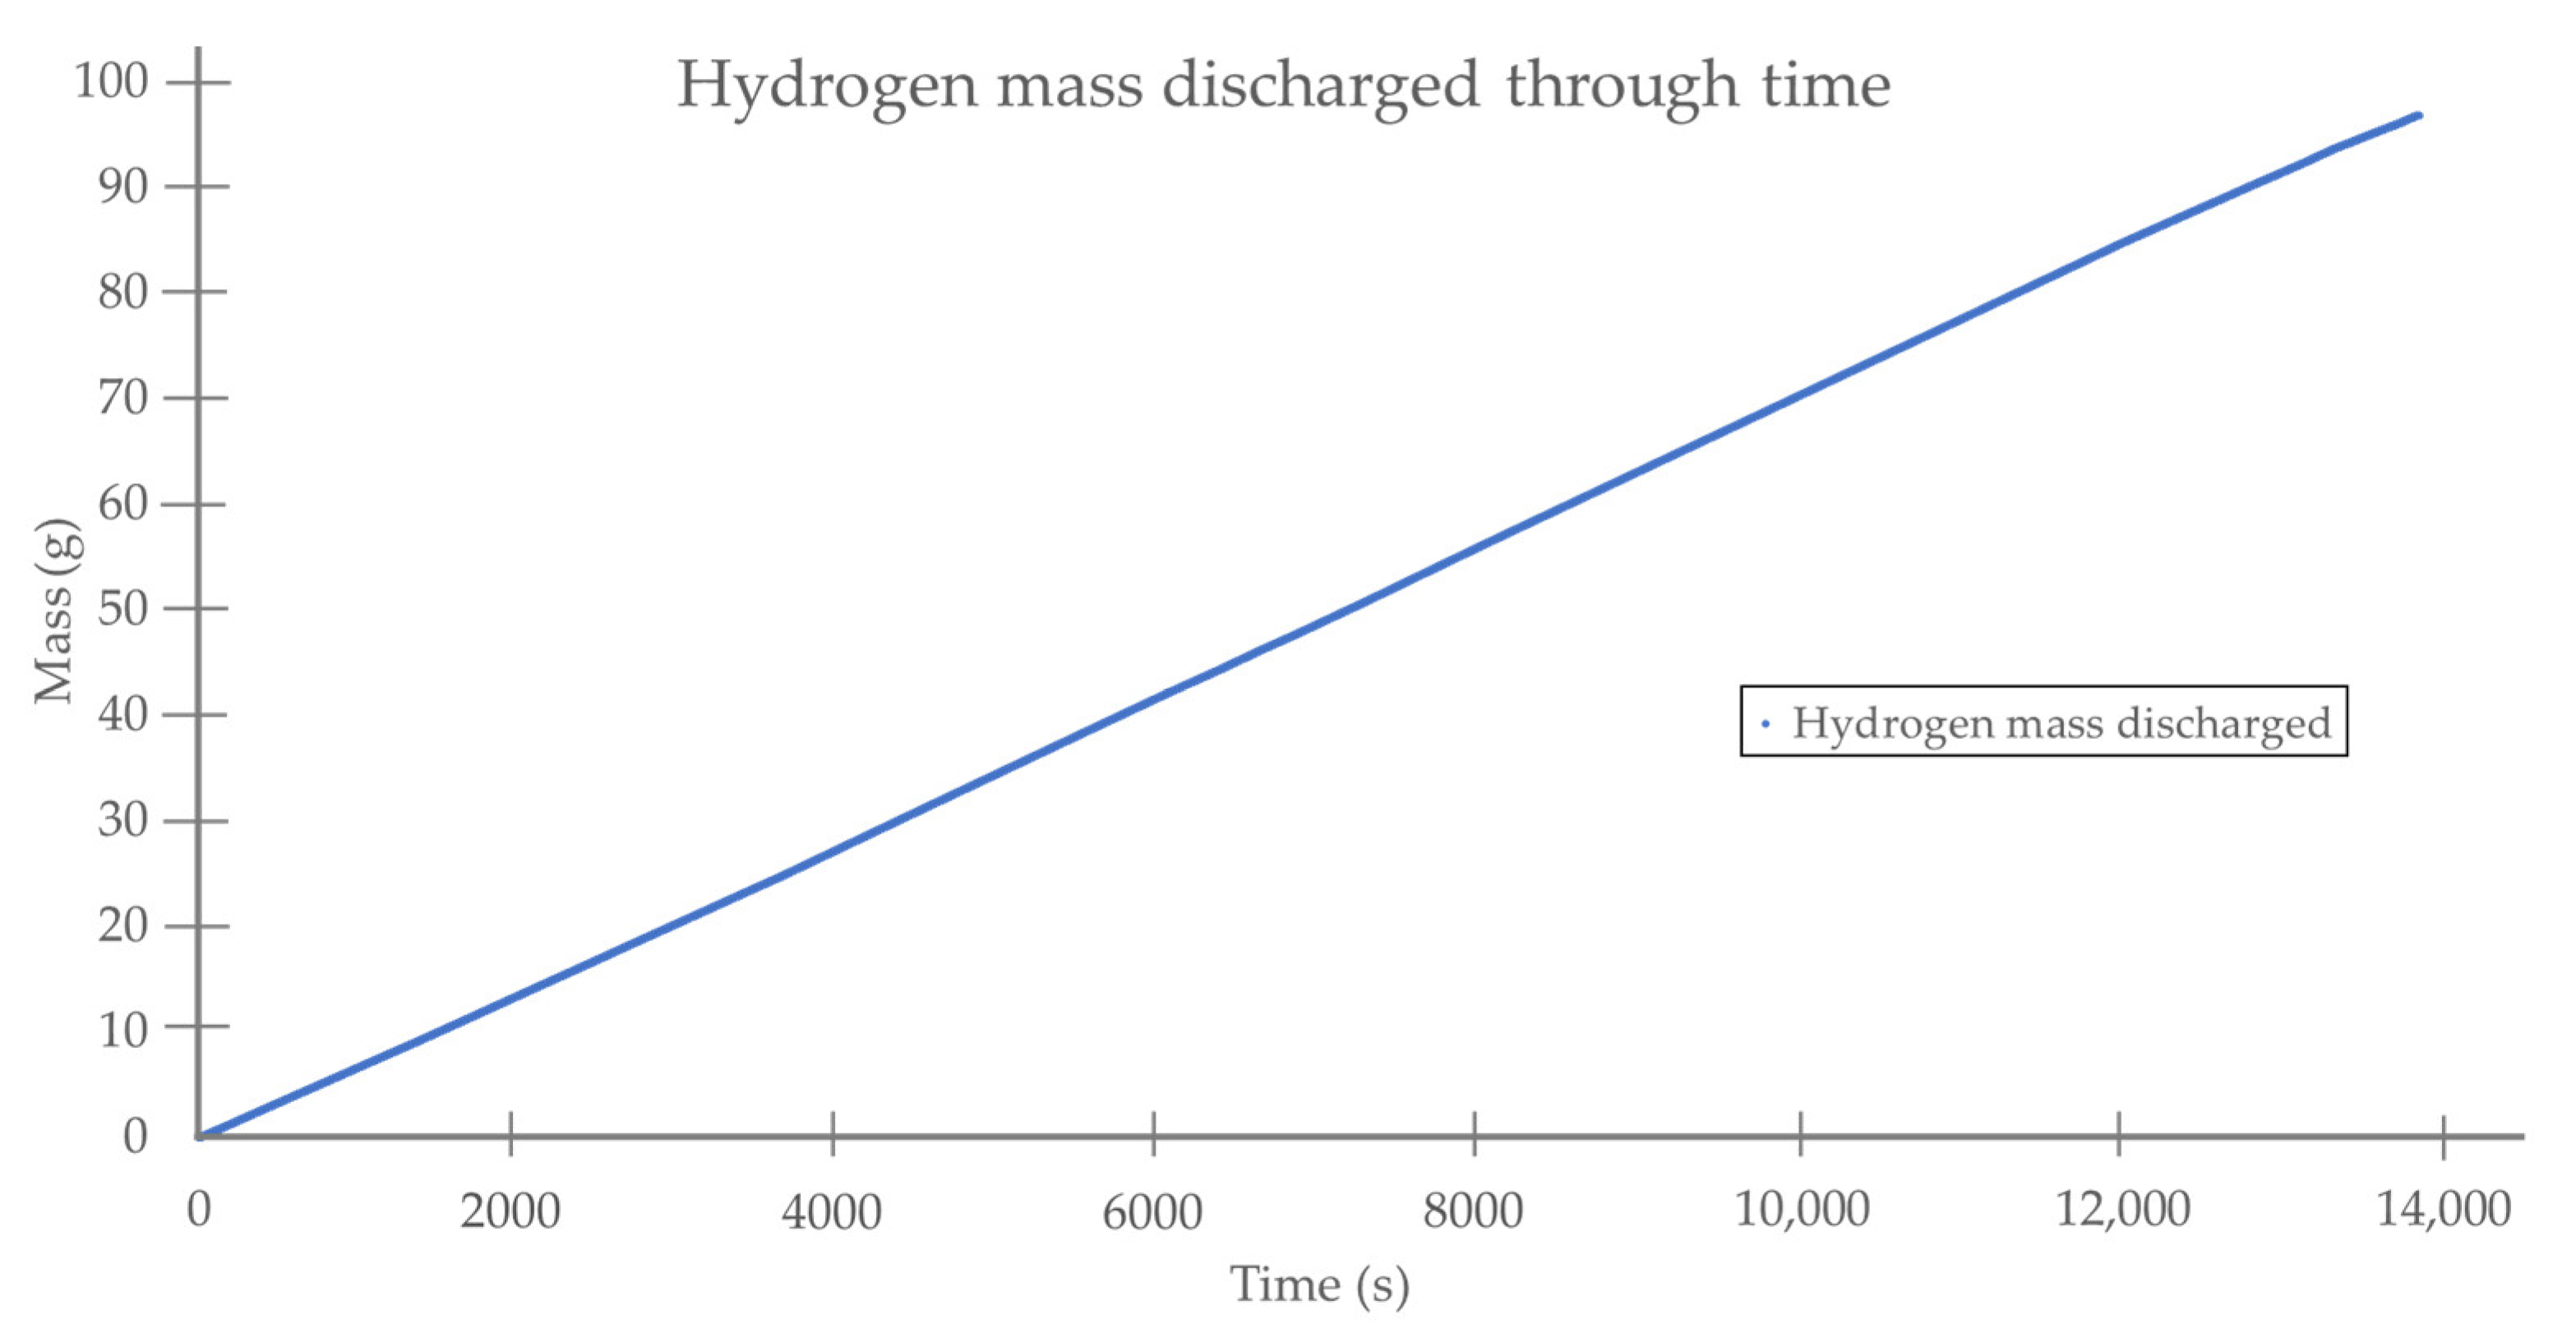
- : hydrogen mass stored in the MH tank (g)
- : hydrogen volumetric flow rate (NL/h)
- : time intervals (1 s)
- : molar mass of hydrogen (2 g/mol)
- : pressure at normal conditions (1 atm)
- : universal gas constant (0.082 (atm·L)/(K·mol))
- : temperature at normal conditions (273 K)
- : hydrogen mass discharged into the MH tank (g)
- : PEM-FC operating voltage (62.13 V)
- : PEM-FC operating current for the period of time i (A)
- : period of time i (h)
- : hydrogen lower heating value (33.36 Wh/g)
- : PEM-FC efficiency (46.5%).
3.3.3. Technical Comparison
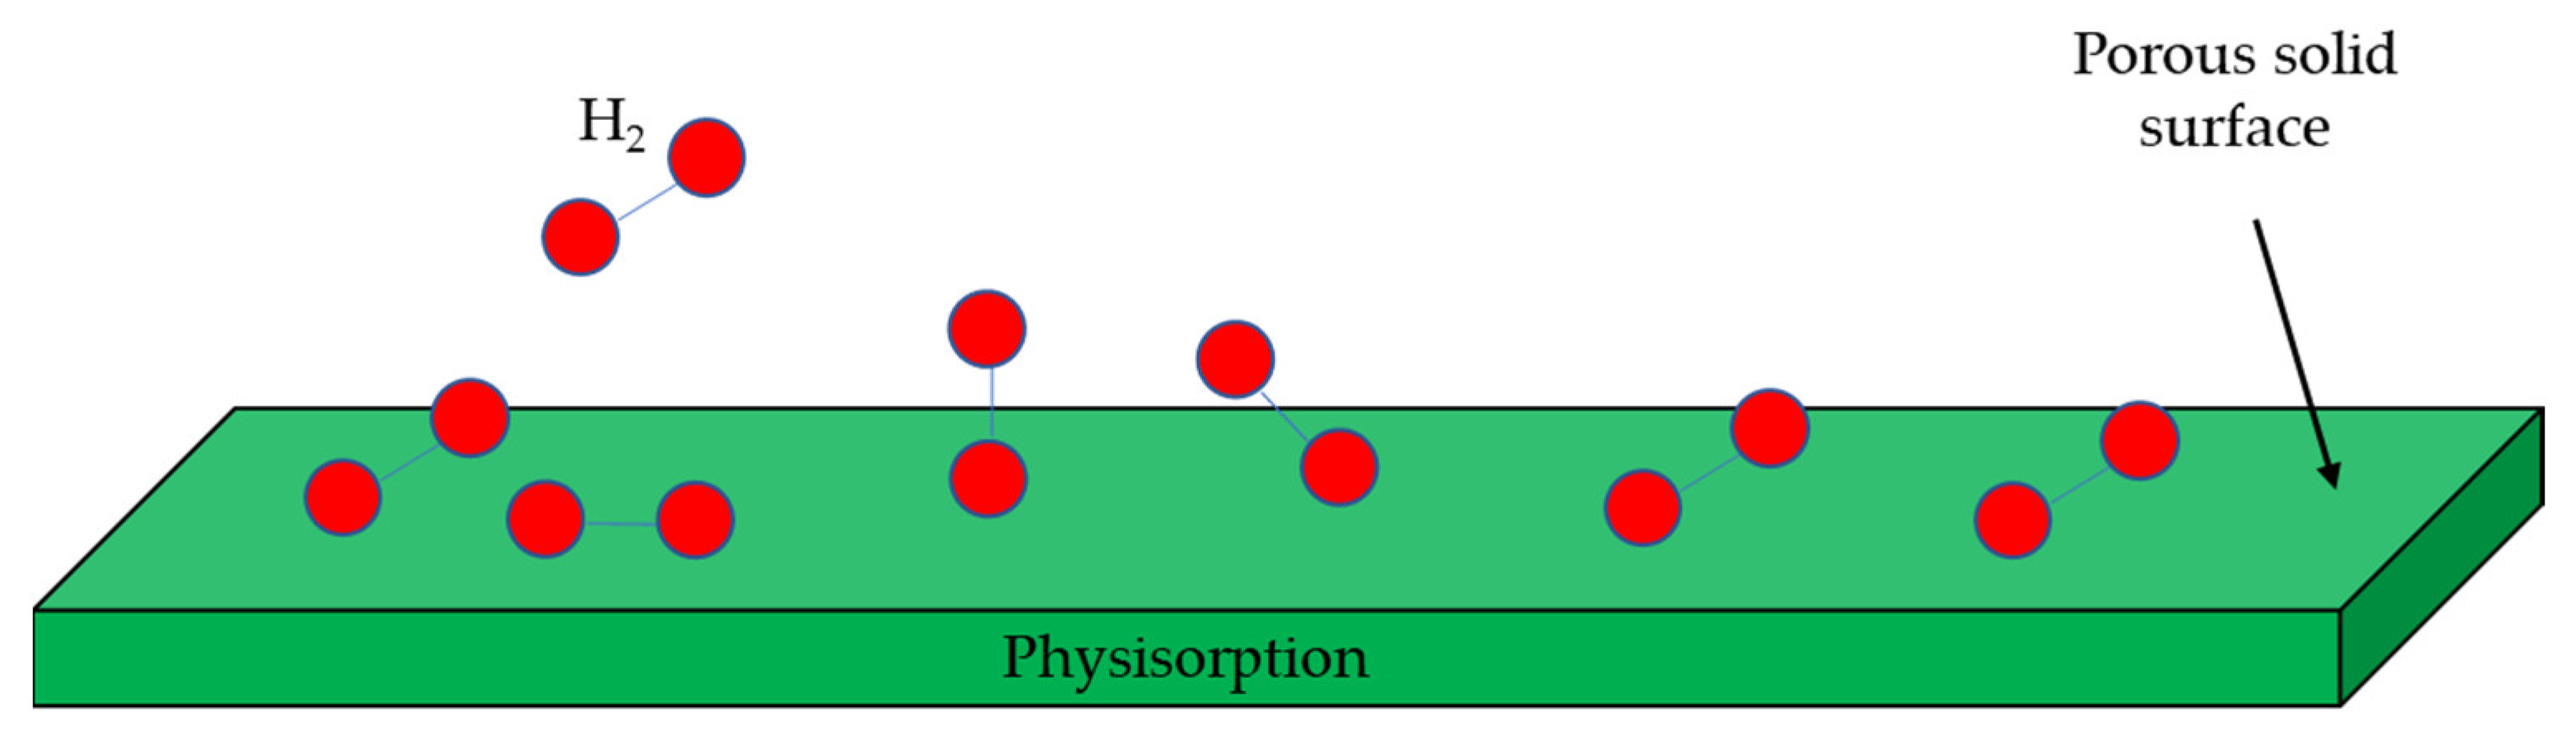
3.4. Physisorption
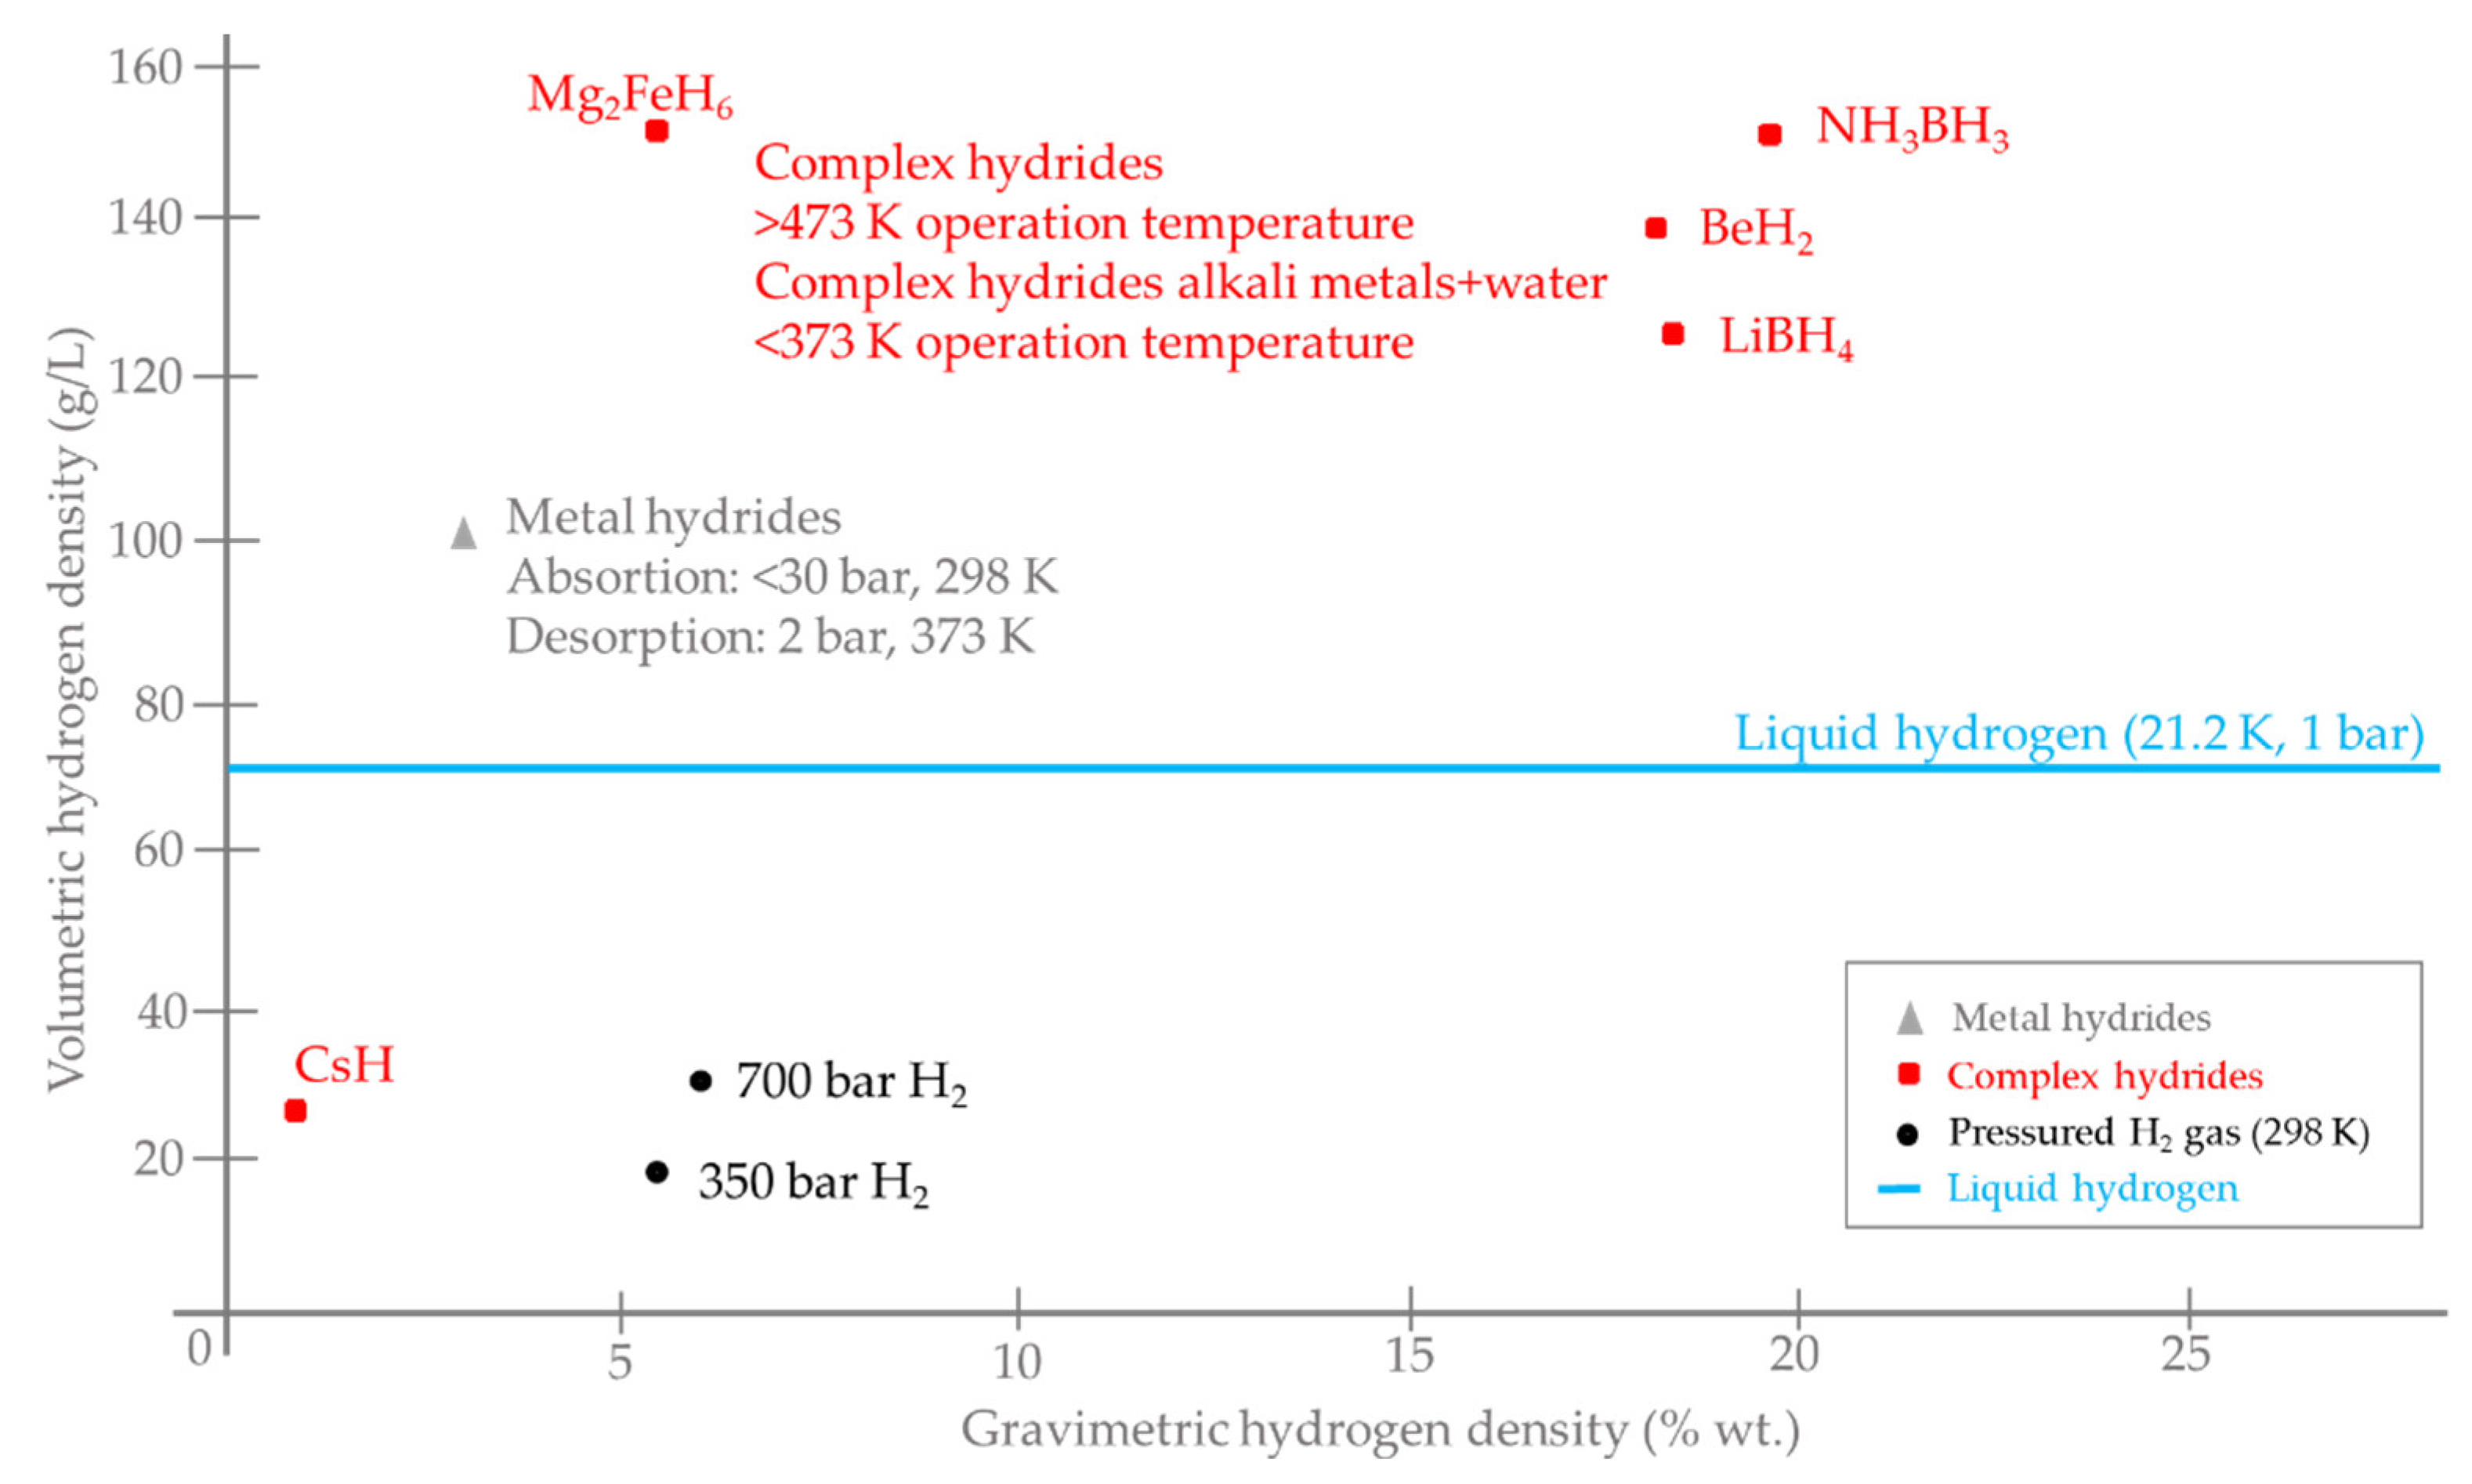
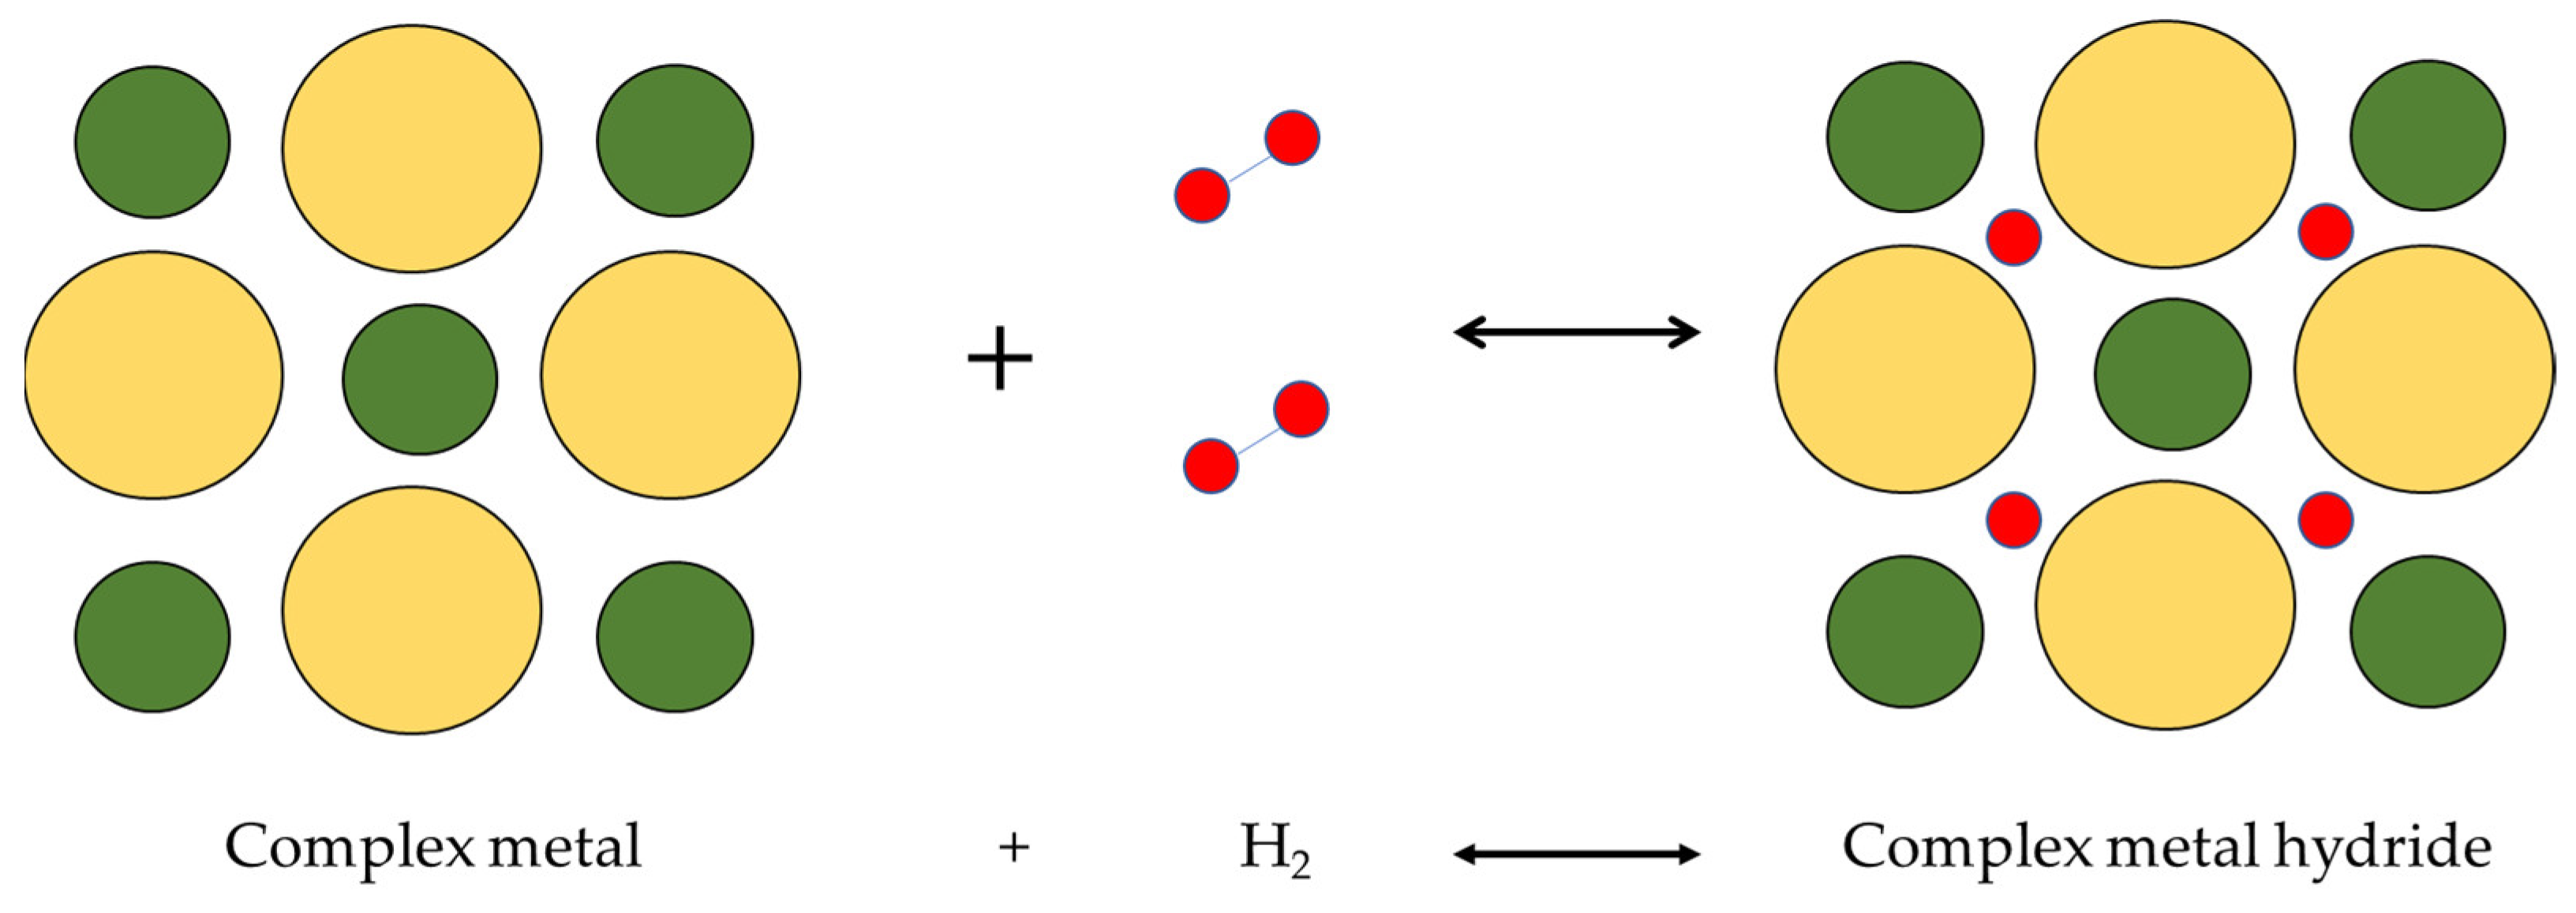
3.5. Complex Hydrides Storage
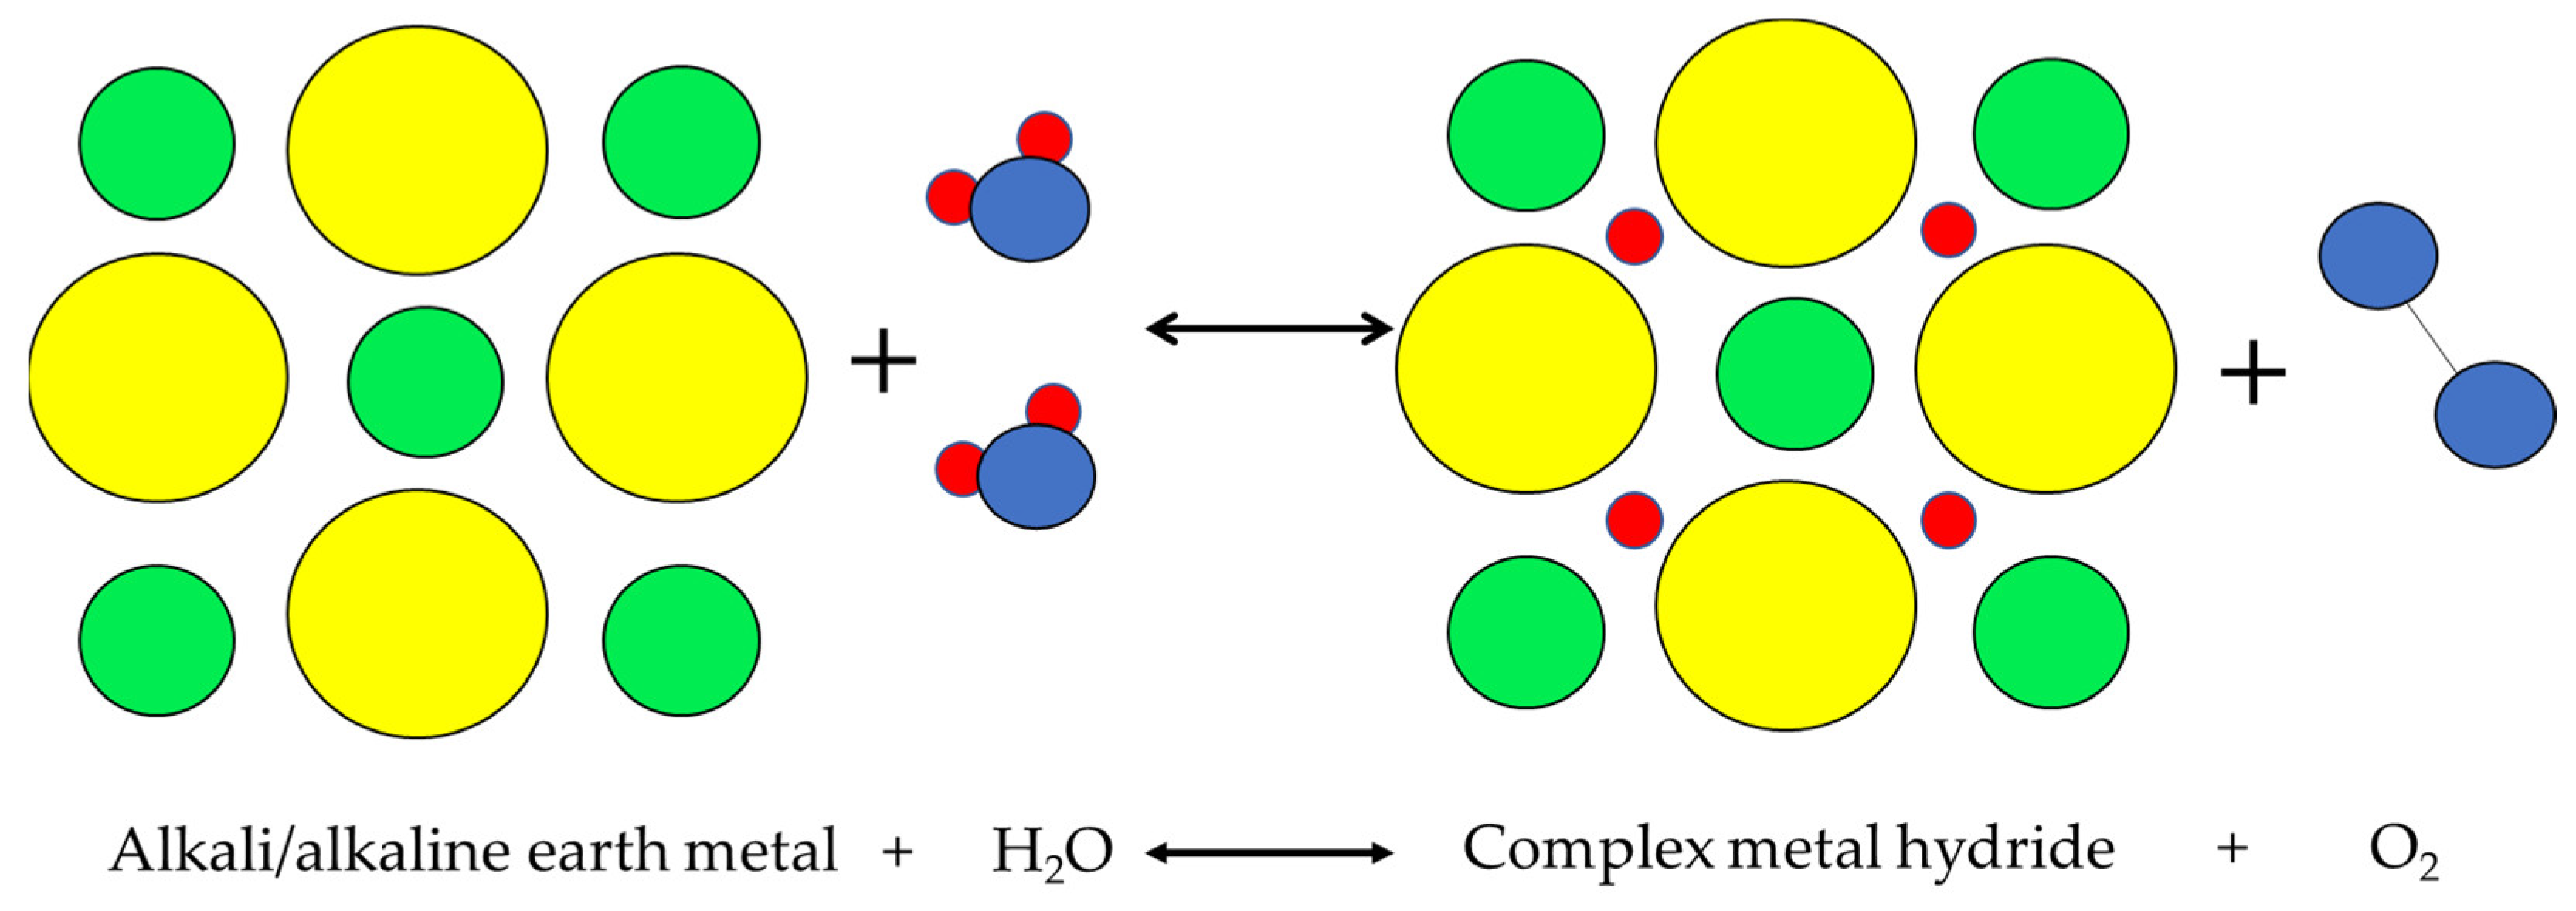
3.6. Alkalimetal + H2O
4. Batteries vs Hydrogen Storage. Substitutes or Complementary
5. Conclusions
Author Contributions
Funding
Institutional Review Board Statement
Informed Consent Statement
Data Availability Statement
Conflicts of Interest
Nomenclature
| CAES | Compressed Air Energy Storage |
| CFRP | Carbon Fibre Reinforced Polymer |
| DOD | Depth Of Discharge |
| DOE | Department Of Energy |
| ESS | Energy Storage Systems |
| IEM | Ion-Exchange Membrane |
| LHV | Lower Heating Value |
| MHx | Metal Hydride |
| O&M | Operation and Maintenance |
| PEM-FC | Polymeric Electrolyte Membrane-Fuel Cell |
| RES | Renewable Energy Sources |
| RFB | Redox Flow Battery |
| SMES | Superconducting Magnetic Energy Storage |
| SOC | State Of Charge |
| ZEBRA | Zero Emission Battery Research Activity |
| List of Symbols | |
| hydrogen mass in the MH tank during charge (g) | |
| time intervals (1 s) | |
| exponential zone amplitude (V) | |
| fraction () | |
| Noble-Abel constant (0.007691 L/g for hydrogen gas) | |
| atomic ratio of hydrogen to metal () | |
| maximum atomic ratio of hydrogen to metal (H/M) | |
| metal hydride tank height (m) | |
| battery current (A) | |
| actual battery charge (Ah) | |
| PEM-FC operating current for a period of time (A) | |
| polarization voltage (V) | |
| hydrogen lower heating value (33.36 Wh/g) | |
| molar mass of gas (g/mol) | |
| molar mass of hydrogen (2 g/mol) | |
| hydrogen mass charged (or discharged) into the MH tank | |
| nominal MH tank hydrogen mass (g) | |
| final hydrogen mass in the MH tank (g) | |
| metal hydride tank mass (g) | |
| hydrogen mass in the tank (g) | |
| metal hydride tank mass when not hydrogenated (g) | |
| yield of the PEM-FC (46.5%) | |
| dimensionless constant to be adjusted by user (in case of experimental test arried 5 by authors, ) | |
| gas density (g/L) | |
| liquid hydrogen density (71 g/L) | |
| hydrogenated metal hydride density () | |
| initial metal hydride density () | |
| metal hydride tank packing density (g/L) | |
| gas pressure (atm) | |
| maximum hydrogen tank pressure (atm) | |
| pressure at normal conditions (1 atm) | |
| battery capacity (Ah) | |
| battery capacity at the end of exponential zone (Ah) | |
| battery capacity at the end of nominal zone (Ah) | |
| universal gas constant (0.082 (atm·L)/(K·mol)) | |
| metal hydride tank radius (m) | |
| swelling of the alloy volume during absorption/desorption (%) | |
| state of charge (%) | |
| t | time (s) |
| gas temperature (K) | |
| total time to charge a MH tank (s) | |
| temperature at normal conditions (273 K) | |
| t0 | initial time (s) |
| no load voltage (V) | |
| battery constant voltage (V) | |
| battery voltage (V) | |
| voltage at end of exponential zone (V) | |
| PEM-FC operating voltage (62.13 V) | |
| fully charged battery voltage (V) | |
| hydrogen volumetric flow rate | |
| voltage at the end of nominal zone (V) | |
| total volume of the hydrogen tank (L) | |
Appendix A. Battery Technology
Appendix A.1. Conventional Technology

| Lead-Acid | |
|---|---|
 | Model: 6GFMJ-65 Battery capacity: 65 Ah/12 V Lifetime: ≥10 years Dimensions: X-350 mm, Y-166 mm, Z-174 mm Weight: 21.4 kg Cost: 57 € |
 | Model: EP200-12 Battery capacity: 200 Ah/12 V Lifetime: 3–5 years Dimensions: X-533 mm, Y-250 mm, Z-240 mm Weight: 62.95 kg Cost: 201.87 € (1 ₹ = 0.012 € (3 August 2022)) |
| Nickel-Cadmium | |
 | Model: N-3000CR Battery capacity: 3000 mAh/1.2 V Lifetime: 1 cycle Dimensions: Diameter-26 mm, Height-50 mm Weight: 86 g Cost: 6.86 € |
 | Model: VNT D U HC Battery capacity: 4500 mAh/1.2 V Lifetime: ≥4 years (55 °C) Dimensions: Diameter-32.15 mm, Height-59.9 mm Weight: 124 g Cost: 25.40 € (1 £ = 1.20 € (3 August 2022)) |
| Lithium-ion | |
 | Model V-LYP400Ah 3.2 V Stored energy: 1.2 kWh Lifetime: 2000 cycles Dimensions: X-460 mm, Y-285 mm, Z-65 mm Weight: 13.5 kg Cost: 550 € |
 | Model: LG Chem RESU10H Energy stored: 9.8 kWh Battery capacity: 189 Ah Lifetime: ≥10 years Dimensions: X-452.12 mm, Y-482.6 mm, Z-226.06 mm Weight: 74.9 kg Cost: 5996.3 € (1 $ = 1.01 € (3 August 2022)) |
Appendix A.2. Molten Salt Technology
| ZEBRA | |
|---|---|
 | Model ZEBRA Z5278-ML3X-64 Stored energy: 17.8 kWh Lifetime: 3500 cycles Dimensions: X-826 mm, Y-530 mm, Z-295 mm Weight: 182 Kg Cost: 1500 € |
 | Model: FZSonick ST523 Battery capacity: 38 Ah/620 V Stored energy: 22.5 kWh Lifetime: >4500 cycles (80% DOD) Dimensions: X-624 mm, Y-406 mm, Z-1023 mm Weight: 256 kg Cost-18,000 € |
| NAS | |
 | Model: BASF NAS® Battery Stored energy: 1450 kWh Lifetime: 20 years; 4000 cycles Dimensions: X-6058 mm, Y-2438 mm, Z-2591 mm Weight: 21 tons Cost: Non available |
Appendix A.3. Redox Flow Technology
| ICB | |
|---|---|
 | Model Enervalut Proyect Nominal power: 250 kW Lifetime: research Weight: tonnes Cost: Investment 4672,900 € |
| ZnBr | |
 | Model: ZBM2 Stored energy: 10 kWh Lifetime: 10 years Dimensions: X-830 mm, Y-823 mm, Z-400 mm Weight: 240 kg Cost: 7921 € (1 $ = 1.01 € (3 August 2022)) |
 | Model: ZBM3 Stored energy: 10 kWh Lifetime: 10 years Dimensions: X-861 mm, Y-747 mm, Z-400 mm Weight: 240 kg Cost: 8713 € (1 $ = 1.01 € (3 August 2022)) |
| VRB | |
 | Model: RFB40X P1. Nominal power: 40 kW Stored energy: 40 kWh Lifetime: >20 years Dimensions: X-2300 mm, Y-1400 mm, Z-1900 mm Weight: 3400 kg Cost: 44,780.6 € (1 ₹ = 0.012 € (3 August 2022)) |
 | Model: E22 VRB Battery. Nominal power: 50 kW Stored energy: 200 kWh Lifetime: >10,000 cycles; >20 years Dimensions: X-6000 mm, Y-2400 mm, Z-2600 mm Weight: 24,000 kg Cost: Non available |
Appendix A.4. Metal-Air Technology
| Li-Air | |
|---|---|
 | Model Li -Air 500 mAh Samsung Electronics Battery capacity: 500 mAh Lifetime: 7 cycles Dimensions: X-70 mm, Y-10 mm, Z-23 mm Weight: 35 mg Cost: Non available |
| Zn-Air | |
 | Model DQFC 24/24-125 Stored energy: 2.88 kWh Lifetime: 300 cycles Dimensions: X-410 mm, Y-220 mm, Z-240 mm Weight: 21.8 kg Cost: 300 € |
Appendix B. Hydrogen Storage
| Compressed Gas Hydrogen Storage | |
|---|---|
 | Model B50 Stored energy: 26.7 kWh Vol. H2: 8900 NL Vol. bottle: 50 L Pressure: 200 bar Dimensions: H-1680 mm, Ø-230 mm Weight: 85 kg Cost: 200 € annual contract |
| Metal Hydride storage | |
 | Model Hbond 5000 L Stored energy: 15 kWh Vol. H2: 5000 NL Vol. bottle: 98.6 L Pressure: 15 bar Dimensions: H-1100 mm, Ø-169 mm Weight: 76 kg Cost: 10,000 € |
References
- Russo, M.A.; Carvalho, D.; Martins, N.; Monteiro, A. Forecasting the inevitable: A review on the impacts of climate change on renewable energy resources. Sustain. Energy Technol. Assess. 2022, 52, 102283. [Google Scholar] [CrossRef]
- Zhang, Z.; Ding, T.; Zhou, Q.; Sun, Y.; Qu, M.; Zeng, Z.; Ju, Y.; Li, L.; Wang, K.; Chi, F. A review of technologies and applications on versatile energy storage systems. Renew. Sustain. Energy Rev. 2021, 148, 111263. [Google Scholar] [CrossRef]
- Communication, L.S. The smart grid: An introduction. Smart Grid Electr. Power Transm. 2011, 1–45. [Google Scholar] [CrossRef]
- Walker, T.J. EPRI Intelligrid/Smart Grid Demonstration Joint Advisory Meeting. System 2010, 1–16. [Google Scholar]
- Eustis, C.; Gyuk, I. Energy Storage Safety Strategic Plan Acknowledgements. 2014. Available online: https://vdocuments.net/energy-storage-safety-strategic-safety-strategic-planenergy-storage-safety-strategic.html?page=1 (accessed on 25 July 2022).
- AL Shaqsi, A.Z.; Sopian, K.; Al-Hinai, A. Review of energy storage services, applications, limitations, and benefits. Energy Rep. 2020, 6, 288–306. [Google Scholar] [CrossRef]
- Pershaanaa, M.; Bashir, S.; Ramesh, S.; Ramesh, K. Every bite of Supercap: A brief review on construction and enhancement of supercapacitor. J. Energy Storage 2022, 50, 104599. [Google Scholar] [CrossRef]
- Fiore, M.; Magi, V.; Viggiano, A. Internal combustion engines powered by syngas: A review. Appl. Energy 2020, 276, 115415. [Google Scholar] [CrossRef]
- Rullo, P.; Braccia, L.; Luppi, P.; Zumoffen, D.; Feroldi, D. Integration of sizing and energy management based on economic predictive control for standalone hybrid renewable energy systems. Renew. Energy 2019, 140, 436–451. [Google Scholar] [CrossRef]
- Piccolino, M. The bicentennial of the Voltaic battery (1800-2000): The artificial electric organ. Trends Neurosci. 2000, 23, 147–151. [Google Scholar] [CrossRef]
- Kurzweil, P. Gaston Planté and his invention of the lead-acid battery-The genesis of the first practical rechargeable battery. J. Power Sources 2010, 195, 4424–4434. [Google Scholar] [CrossRef]
- Kandeeban, R.; Saminathan, K.; Manojkumar, K.; Dilsha, C.G.; Krishnaraj, S. Battery economy: Past, present and future. Mater. Today Proc. 2019, 48, 143–147. [Google Scholar] [CrossRef]
- Mitali, J.; Dhinakaran, S.; Mohamad, A.A. Energy storage systems: A review. Energy Storage Sav. 2022; in press. [Google Scholar] [CrossRef]
- Winter, M.; Brodd, R.J. What are batteries, fuel cells, and supercapacitors? Chem. Rev. 2004, 104, 4245–4269. [Google Scholar] [CrossRef] [PubMed]
- Ghiji, M.; Novozhilov, V.; Moinuddin, K.; Joseph, P.; Burch, I.; Suendermann, B.; Gamble, G. A Review of Lithium-Ion Battery Fire Suppression. Energies 2020, 13, 5117. [Google Scholar] [CrossRef]
- Riaz, A.; Sarker, M.R.; Saad, M.H.M.; Mohamed, R. Review on Comparison of Different Energy Storage Technologies Used in Micro-Energy Harvesting, WSNs, Low-Cost Microelectronic Devices: Challenges and Recommendations. Sensors 2021, 21, 5041. [Google Scholar] [CrossRef]
- Valve-Regulated Lead-Acid (VRLA) Gelled Electrolyte (gel) and Absorbed Glass Mat (AGM) Batteries. Available online: https://www.mkbattery.com/application/files/9615/3374/2592/Valve_Regulated_Lead-Acid_VRLA_Gel_and_AGM_batteries.pdf (accessed on 25 July 2022).
- Asghar, R.; Rehman, F.; Ullah, Z.; Qamar, A.; Ullah, K.; Iqbal, K.; Aman, A.; Nawaz, A.A. Electric vehicles and key adaptation challenges and prospects in Pakistan: A comprehensive review. J. Clean. Prod. 2021, 278, 123375. [Google Scholar] [CrossRef]
- Tucker, C. Battery Information Sheet. FlashCAV 2010, 49, 1–8. [Google Scholar]
- Nickel—Cadmium Batteries Operating and Nickel—Cadmium Airborne Batteries. Available online: https://www.enersys.com/493bb4/globalassets/documents/product-documentation/_enersys/emea/legacy/batteries/hawker/aviation/enersys_ni-cad_aircraft_maint_manual_may-2013_version1_en.pdf (accessed on 25 July 2022).
- Technical Manual Lomain Ni-Cd Pocket Plate Battery, n.d. Available online: https://www.gaz-gmbh.com/UserFiles/Image/1575292176GAZ-Manual-lomain-2019.pdf (accessed on 25 July 2022).
- Liu, Y.; Zhang, R.; Wang, J.; Wang, Y. Current and future lithium-ion battery manufacturing. iScience 2021, 24, 102332. [Google Scholar] [CrossRef]
- Ruetschi, P. Review on the lead-acid battery science and technology. J. Power Sources 1977, 2, 3–120. [Google Scholar] [CrossRef]
- Pavlov, D. Lead-Acid Batteries: Science and Technology: A Handbook of Lead-Acid Battery Technology and Its Influence on the Product; Elsevier: Amsterdam, The Netherlands, 2011; p. 722. [Google Scholar]
- Industrial Batteries 101. Available online: http://site.ieee.org/fw-pes/files/2018/07/Industrial-Batteries-101-IEEE-PES-Ft-Worth.pdf (accessed on 25 April 2022).
- Johnson, S.C.; Todd Davidson, F.; Rhodes, J.D.; Coleman, J.L.; Bragg-Sitton, S.M.; Dufek, E.J.; Webber, M.E. Selecting Favorable Energy Storage Technologies for Nuclear Power. Storage Hybrid. Nucl. Energy Techno-Econ. Integr. Renew. Nucl. Energy 2019, 119–175. [Google Scholar] [CrossRef]
- Sarma, D.D.; Shukla, A.K. Building better batteries: A travel back in time. ACS Energy Lett. 2018, 3, 2841–2845. [Google Scholar] [CrossRef]
- Xie, J.; Lu, Y.C. A retrospective on lithium-ion batteries. Nat. Commun. 2020, 11, 9–12. [Google Scholar] [CrossRef] [PubMed]
- Scrosati, B. History of lithium batteries. J. Solid State Electrochem. 2011, 15, 1623–1630. [Google Scholar] [CrossRef]
- Tremblay, O.; Dessaint, L.; Dekkiche, A. A Generic Battery Model for the Dynamic Simulation of Hybrid Electric Vehicles. In Proceedings of the IEEE Vehicle Power and Propulsion Conference, Arlington, TX, USA, 9–12 September 2007; pp. 284–289. [Google Scholar]
- Lutgens, F.K.; Tarbuck, E.J.; Tasa, D.G. Essentials of Geology, Global Edition; Pearson: London, UK, 2015. [Google Scholar]
- Scrosati, B.; Garche, J. Lithium batteries: Status, prospects and future. J. Power Sources 2010, 195, 2419–2430. [Google Scholar] [CrossRef]
- Wang, W.; Yuan, B.; Sun, Q.; Wennersten, R. Application of energy storage in integrated energy systems—A solution to fluctuation and uncertainty of renewable energy. J. Energy Storage 2022, 52, 104812. [Google Scholar] [CrossRef]
- Choudhury, S. Review of energy storage system technologies integration to microgrid: Types, control strategies, issues, and future prospects. J. Energy Storage 2022, 48, 103966. [Google Scholar] [CrossRef]
- Zakeri, B.; Syri, S. Electrical energy storage systems: A comparative life cycle cost analysis. Renew. Sustain. Energy Rev. 2015, 42, 569–596. [Google Scholar] [CrossRef]
- Liu, J.; Hu, C.; Kimber, A.; Wang, Z. Uses, Cost-Benefit Analysis, and Markets of Energy Storage Systems for Electric Grid Applications. J. Energy Storage 2020, 32, 101731. [Google Scholar] [CrossRef]
- Elio, J.; Phelan, P.; Villalobos, R.; Milcarek, R.J. A review of energy storage technologies for demand-side management in industrial facilities. J. Clean. Prod. 2021, 307, 127322. [Google Scholar] [CrossRef]
- Banerjee, A.; Ziv, B.; Shilina, Y.; Levi, E.; Luski, S.; Aurbach, D. Single-wall carbon nanotube doping in lead-acid batteries: A new horizon. ACS Appl. Mater. Interfaces 2017, 9, 3634–3643. [Google Scholar] [CrossRef]
- Gangaja, B.; Nair, S.; Santhanagopalan, D. Reuse, Recycle, and Regeneration of LiFePO4Cathode from Spent Lithium-Ion Batteries for Rechargeable Lithium- and Sodium-Ion Batteries. ACS Sustain. Chem. Eng. 2021, 9, 4711–4721. [Google Scholar] [CrossRef]
- Energy Storage Technology Descriptions-EASE-European Associaton for Storage of Energy. Available online: www.ease-storage.eu (accessed on 11 April 2022).
- Dustmann, C.H. Advances in ZEBRA batteries. J. Power Sources 2004, 127, 85–92. [Google Scholar] [CrossRef]
- Wen, Z.; Cao, J.; Gu, Z.; Xu, X.; Zhang, F.; Lin, Z. Research on sodium sulfur battery for energy storage. Solid State Ion. 2008, 179, 1697–1701. [Google Scholar] [CrossRef]
- Capasso, C.; Veneri, O. Integration between Super-capacitors and ZEBRA Batteries as High Performance Hybrid Storage System for Electric Vehicles. Energy Procedia 2017, 105, 2539–2544. [Google Scholar] [CrossRef]
- Kumar, D.; Kuhar, S.B.; Kanchan, D.K. Room temperature sodium-sulfur batteries as emerging energy source. J. Energy Storage 2018, 18, 133–148. [Google Scholar] [CrossRef]
- Shamim, N.; Thomsen, E.C.; Viswanathan, V.V.; Reed, D.M.; Sprenkle, V.L.; Li, G. Evaluating ZEBRA Battery Module under the Peak-Shaving Duty Cycles. Materials 2021, 14, 2280. [Google Scholar] [CrossRef]
- Aneke, M.; Wang, M. Energy storage technologies and real life applications—A state of the art review. Appl. Energy 2016, 179, 350–377. [Google Scholar] [CrossRef]
- Chauhan, A.; Saini, R.P. A review on Integrated Renewable Energy System based power generation for stand-alone applications: Configurations, storage options, sizing methodologies and control. Renew. Sustain. Energy Rev. 2014, 38, 99–120. [Google Scholar] [CrossRef]
- Weber, A.Z.; Mench, M.M.; Meyers, J.P.; Ross, P.N.; Gostick, J.T.; Liu, Q. Redox flow batteries: A review. J. Appl. Electrochem. 2011, 41, 1137–1164. [Google Scholar] [CrossRef]
- Sun, C.; Negro, E.; Nale, A.; Pagot, G.; Vezzù, K.; Zawodzinski, T.A.; Meda, L.; Gambaro, C.; Di Noto, V. An efficient barrier toward vanadium crossover in redox flow batteries: The bilayer [Nafion/(WO3)x] hybrid inorganic-organic membrane. Electrochim. Acta 2021, 378, 138133. [Google Scholar] [CrossRef]
- Xu, Z.; Fan, Q.; Li, Y.; Wang, J.; Lund, P.D. Review of zinc dendrite formation in zinc bromine redox flow battery. Renew. Sustain. Energy Rev. 2020, 127, 109838. [Google Scholar] [CrossRef]
- Alotto, P.; Guarnieri, M.; Moro, F. Redox flow batteries for the storage of renewable energy: A review. Renew. Sustain. Energy Rev. 2014, 29, 325–335. [Google Scholar] [CrossRef]
- Vanýsek, P.; Novák, V. Redox flow batteries as the means for energy storage. J. Energy Storage 2017, 13, 435–441. [Google Scholar] [CrossRef]
- Clemente, A.; Costa-Castelló, R. Redox Flow Batteries: A Literature Review Oriented to Automatic Control. Energies 2020, 13, 4514. [Google Scholar] [CrossRef]
- Rajarathnam, G.P.; Montoya, A.; Vassallo, A.M. The influence of a chloride-based supporting electrolyte on electrodeposited zinc in zinc/bromine flow batteries. Electrochim. Acta 2018, 292, 903–913. [Google Scholar] [CrossRef]
- Jiménez-Blasco, U.; Moreno, E.; Cólera, M.; Díaz-Carrasco, P.; Arrebola, J.C.; Caballero, A.; Morales, J.; Vargas, A. Enhanced Performance of Zn/Br Flow Battery Using N-Methyl-N-Propylmorpholinium Bromide as Complexing Agent. Int. J. Mol. Sci. Artic. 2021, 22, 9288. [Google Scholar] [CrossRef]
- Bartolozzi, M. Development of redox flow batteries. A historical bibliography. J. Power Sources 1989, 27, 219–234. [Google Scholar] [CrossRef]
- Zeng, Y.K.; Zhou, X.L.; An, L.; Wei, L.; Zhao, T.S. A high-performance flow-field structured iron-chromium redox flow battery. J. Power Sources 2016, 324, 738–744. [Google Scholar] [CrossRef]
- Solid Electrode Battery Technology|Energy Storage Assocation. Available online: https://energystorage.org/why-energy-storage/technologies/solid-electrode-batteries/ (accessed on 12 April 2022).
- Prifti, H.; Parasuraman, A.; Winardi, S.; Lim, T.M.; Skyllas-Kazacos, M. Membranes for redox flow battery applications. Membranes 2012, 2, 275–306. [Google Scholar] [CrossRef]
- Lee, J.-S.; Kim, S.T.; Cao, R.; Choi, N.-S.; Liu, M.; Lee, K.T.; Cho, J. Metal-air batteries with high energy density: Li-air versus Zn-air. Adv. Energy Mater. 2011, 1, 34–50. [Google Scholar] [CrossRef]
- Wang, Y.; Pan, W.; Luo, S.; Zhao, X.; Kwok, H.Y.H.; Xu, X.; Leung, D.Y. High-performance solid-state metal-air batteries with an innovative dual-gel electrolyte. Int. J. Hydrogen Energy 2022, 47, 15024–15034. [Google Scholar] [CrossRef]
- Crompton, T.R. Battery reference book—Second Edition. Fuel Energy Abstr. 1996, 37, 192. [Google Scholar] [CrossRef]
- Li, S.; Guo, H.; He, S.; Yang, H.; Liu, K.; Duan, G.; Jiang, S. Advanced electrospun nanofibers as bifunctional electrocatalysts for flexible metal-air (O2) batteries: Opportunities and challenges. Mater. Des. 2022, 214, 110406. [Google Scholar] [CrossRef]
- Abraham, K.M.; Jiang, Z. A Polymer Electrolyte—Based Rechargeable Lithium/Oxygen Battery TECHNICAL PAPERS ELECTROCHEMICAL SCIENCE AND TECHNOLOGY A Polymer Electrolyte-Based Rechargeable lithium/Oxygen Battery. J. Electrochem. Soc. 1996, 143, 1–5. [Google Scholar] [CrossRef]
- Iudice de Souza, J.P.B.; Belem, U.F.d.P.; Vielstich, W.B. IQSC, Sao Carlos, Universidade de Sao Paulo Seawater aluminum/air cells. Handb. Fuel Cells Fundam. Technol. Appl. 2003, 1, 409–415. [Google Scholar]
- Li, Y.; Lu, J. Metal−Air Batteries: Will They Be the Future Electrochemical Energy Storage Device of Choice? ACS Energy Lett. 2017, 2, 15. [Google Scholar] [CrossRef]
- Paidar, M.; Fateev, V.; Bouzek, K. Membrane electrolysis–History, current status and perspective. Electrochim. Acta 2016, 209, 737–756. [Google Scholar] [CrossRef]
- Bhasker, J.P.; Porpatham, E. Effects of compression ratio and hydrogen addition on lean combustion characteristics and emission formation in a Compressed Natural Gas fuelled spark ignition engine. Fuel 2017, 208, 260–270. [Google Scholar] [CrossRef]
- Fuel Cells and Hydrogen 2 Joint Undertaking (FCH JU). Addendum to the Multi-Annual Work Plan 2014–2020; European Commission’s Horizon 2020 Programme for Research and Innovation; FCH JU: Brussels, Belgium, 2018. [Google Scholar]
- Menezes, M.W.; Simmons, D.R.; Winberg, S.; Baranwal, R.; Hoffman, P.; Genatowski, S.L. U.S. Department of Energy Hydrogen Program Plan. Available online: https://www.hydrogen.energy.gov/pdfs/hydrogen-program-plan-2020.pdf (accessed on 23 April 2022).
- Quantum Fuel Systems Technologies, Worldwide I. High-Pressure Hydrogen Storage Systems. 2004. Available online: http://www.pnl.gov/fuelcells/docs/summits/summit8/presentations/day2/abele%7B%5C_%7D915am.pdf (accessed on 24 April 2004).
- Lindblom, U.E. A Conceptual Design for Compressed Hydrogen Storage in Mined Caverns. Int. J. Hydrogen Energy 1985, 10, 667–675. [Google Scholar] [CrossRef]
- Thiyagarajan, S.R.; Emadi, H.; Hussain, A.; Patange, P.; Watson, M. A comprehensive review of the mechanisms and efficiency of underground hydrogen storage. J. Energy Storage 2022, 51, 104490. [Google Scholar] [CrossRef]
- Arsad, A.Z.; Hannan, M.A.; Al-Shetwi, A.Q.; Mansur, M.; Muttaqi, K.M.; Dong, Z.Y.; Blaabjerg, F. Hydrogen energy storage integrated hybrid renewable energy systems: A review analysis for future research directions. Int. J. Hydrogen Energy 2022, 47, 17285–17312. [Google Scholar] [CrossRef]
- Durbin, D.J.; Malardier-Jugroot, C. Review of hydrogen storage techniques for on board vehicle applications. Int. J. Hydrogen Energy 2013, 38, 14595–14617. [Google Scholar] [CrossRef]
- Zhao, L.; Zhao, Q.; Zhang, J.; Zhang, S.; He, G.; Zhang, M.; Su, T.; Liang, X.; Huang, C.; Yan, W. Review on studies of the emptying process of compressed hydrogen tanks. Int. J. Hydrogen Energy 2021, 46, 22554–22573. [Google Scholar] [CrossRef]
- Landi, D.; Vita, A.; Borriello, S.; Scafà, M.; Germani, M. A Methodological Approach for the Design of Composite Tanks Produced by Filament Winding. Comput. Des. Appl. 2020, 17, 1229–1240. [Google Scholar] [CrossRef]
- Hassan, I.A.; Ramadan, H.S.; Saleh, M.A.; Hissel, D. Hydrogen storage technologies for stationary and mobile applications: Review, analysis and perspectives. Renew. Sustain. Energy Rev. 2021, 149, 111311. [Google Scholar] [CrossRef]
- Zhou, L. Progress and problems in hydrogen storage methods. Renew Sustain. Energy Rev. 2005, 9, 395–408. [Google Scholar] [CrossRef]
- Technical Assessment of Compressed Hydrogen Storage Tank Systems for Automotive Applications Nuclear Engineering Division. 2010. Available online: www.anl.gov (accessed on 13 April 2022).
- Monforti Ferrario, A.; Bartolini, A.; Segura Manzano, F.; Vivas, F.J.; Comodi, G.; McPhail, S.J.; Andujar, J.M. A model-based parametric and optimal sizing of a battery/hydrogen storage of a real hybrid microgrid supplying a residential load: Towards island operation. Adv. Appl. Energy 2021, 3, 100048. [Google Scholar] [CrossRef]
- Zhang, M.; Lv, H.; Kang, H.; Zhou, W.; Zhang, C. A literature review of failure prediction and analysis methods for composite high-pressure hydrogen storage tanks. Int. J. Hydrogen Energy 2019, 44, 25777–25799. [Google Scholar] [CrossRef]
- Florio, L.A. Effect of gas equation of state on CFD predictions for ignition characteristics of hydrogen escaping from a tank. Int. J. Hydrogen Energy 2014, 39, 18451–18471. [Google Scholar] [CrossRef]
- Li, J.Q.; Myoung, N.S.; Kwon, J.T.; Jang, S.J.; Lee, T. A Study on the Prediction of the Temperature and Mass of Hydrogen Gas inside a Tank during Fast Filling Process. Energies 2020, 13, 6428. [Google Scholar] [CrossRef]
- Le Métayer, O.; Saurel, R. The Noble-Abel Stiffened-Gas equation of state. Phys. Fluids 2016, 28, 046102. [Google Scholar] [CrossRef]
- Ni, M. An Overview of Hydrogen Storage Technologies. ENERGY Explor. Exploit. 2006, 24, 197–209. [Google Scholar] [CrossRef]
- Ferrario, A.M.; Vivas, F.J.; Manzano, F.S.; Andújar, J.M.; Bocci, E.; Martirano, L. Hydrogen vs. Battery in the long-term operation. A comparative between energy management strategies for hybrid renewable microgrids. Electronics 2020, 9, 698. [Google Scholar] [CrossRef]
- Composite cylinders for hydrogen-powered snow groomer. Reinf. Plast. 2021, 65, 66. [CrossRef]
- Züttel, A. Materials for hydrogen storage. Mater. Today 2003, 6, 24–33. [Google Scholar] [CrossRef]
- Choi, Y.; Kim, J.; Park, S.; Park, H.; Chang, D. Design and analysis of liquid hydrogen fuel tank for heavy duty truck. Int. J. Hydrogen Energy 2022, 47, 14687–14702. [Google Scholar] [CrossRef]
- Berstad, D.; Gardarsdottir, S.; Roussanaly, S.; Voldsund, M.; Ishimoto, Y.; Nekså, P. Liquid hydrogen as prospective energy carrier: A brief review and discussion of underlying assumptions applied in value chain analysis. Renew. Sustain. Energy Rev. 2022, 154, 111772. [Google Scholar] [CrossRef]
- Aziz, M. Liquid hydrogen: A review on liquefaction, storage, transportation, and safety. Energies 2021, 14, 5917. [Google Scholar] [CrossRef]
- Tang, X.; Pu, L.; Shao, X.; Lei, G.; Li, Y.; Wang, X. Dispersion behavior and safety study of liquid hydrogen leakage under different application situations. Int. J. Hydrogen Energy 2020, 45, 31278–31288. [Google Scholar] [CrossRef]
- Nakano, A.; Shimazaki, T.; Sekiya, M.; Shiozawa, H.; Ohtsuka, K.; Aoyagi, A.; Iwakiri, T.; Mikami, Z.; Sato, M.; Sugino, Y.; et al. Research and development of liquid hydrogen (LH2) temperature monitoring system for marine applications. Int. J. Hydrogen Energy 2021, 46, 15649–15659. [Google Scholar] [CrossRef]
- Farber, E. The Development of Metal Hydride Chemistry. Chymia 1962, 8, 165–180. [Google Scholar] [CrossRef]
- Førde, T.; Næss, E.; Yartys, V.A. Modelling and experimental results of heat transfer in a metal hydride store during hydrogen charge and discharge. Int. J. Hydrogen Energy 2009, 34, 5121–5130. [Google Scholar] [CrossRef]
- Energ, A. Manual de Instalación y Uso de Hidruros Metálicos HBOND1500.
- Bhattacharyya, R.; El-Emam, R.S.; Khalid, F. Multi-criteria analysis for screening of reversible metal hydrides in hydrogen gas storage and high pressure delivery applications. Int. J. Hydrogen Energy 2022, 47, 19718–19731. [Google Scholar] [CrossRef]
- Tarasov, B.P.; Fursikov, P.V.; Volodin, A.A.; Bocharnikov, M.S.; Shimkus, Y.Y.; Kashin, A.M.; Yartys, V.A.; Chidziva, S.; Pasupathi, S.; Lototskyy, M.V. Metal hydride hydrogen storage and compression systems for energy storage technologies. Int. J. Hydrogen Energy 2021, 46, 13647–13657. [Google Scholar] [CrossRef]
- Bellosta von Colbe, J.; Ares, J.-R.; Barale, J.; Baricco, M.; Buckley, C.; Capurso, G.; Gallandat, N.; Grant, D.M.; Guzik, M.N.; Jacob, I.; et al. Application of hydrides in hydrogen storage and compression: Achievements, outlook and perspectives. Int. J. Hydrogen Energy 2019, 44, 7780–7808. [Google Scholar] [CrossRef]
- Moradi, R.; Groth, K.M. Hydrogen storage and delivery: Review of the state of the art technologies and risk and reliability analysis. Int. J. Hydrogen Energy 2019, 44, 12254–12269. [Google Scholar] [CrossRef]
- Majzoub, E.H.; Rönnebro, E.C.E. Methodology of materials discovery in complex metal hydrides using experimental and computational tools. Mater. Sci. Eng. R Reports 2012, 73, 15–26. [Google Scholar] [CrossRef]
- Milanese, C.; Jensen, T.R.; Hauback, B.C.; Pistidda, C.; Dornheim, M.; Yang, H.; Lombardo, L.; Zuettel, A.; Filinchuk, Y.; Ngene, P.; et al. Complex hydrides for energy storage. Int. J. Hydrogen Energy 2019, 44, 7860–7874. [Google Scholar] [CrossRef]
- Ley, M.B.; Jepsen, L.H.; Lee, Y.-S.; Cho, Y.W.; Bellosta Von Colbe, J.M.; Dornheim, M.; Rokni, M.; Jensen, J.O.; Sloth, M.; Filinchuk, Y.; et al. Complex hydrides for hydrogen storage—New perspectives. Mater. Today 2014, 17, 122–128. [Google Scholar] [CrossRef]
- Mcwhorter, S.; Read, C.; Ordaz, G.; Stetson, N. Materials-based hydrogen storage: Attributes for near-term, early market PEM fuel cells. Curr. Opin. Solid State Mater. Sci. 2011, 15, 29–38. [Google Scholar] [CrossRef]
- Millet, P. Hydrogen storage in hydride-forming materials. In Advances in Hydrogen Production, Storage and Distribution; Woodhead Publishing: Sawston, UK, 2014; pp. 368–409. [Google Scholar] [CrossRef]
- George, L.; Saxena, S.K. Structural stability of metal hydrides, alanates and borohydrides of alkali and alkali- earth elements: A review. Int. J. Hydrogen Energy 2010, 35, 5454–5470. [Google Scholar] [CrossRef]
- Li, Z.P.; Liu, B.H.; Arai, K.; Asaba, K.; Suda, S. Evaluation of alkaline borohydride solutions as the fuel for fuel cell. J. Power Sources 2004, 126, 28–33. [Google Scholar] [CrossRef]
- Renewable Energy Agency, Making the Breakthrough: Green Hydrogen Policies and Technology Costs. 2021. Available online: www.irena.org (accessed on 4 August 2022).


| Technology | Advantages | Drawbacks |
|---|---|---|
| Hydro pumped [6] |
|
|
| CAES [6] |
|
|
| Ultracapacitors [6,7] |
|
|
| Flywheels [6] |
|
|
| SMES [6] |
|
|
| SynGas storage (CO+H2+CO2+ minority gases) [8] |
|
|
| Batteries [6] |
|
|
| Hydrogen storage [9] |
|
|
| Battery | Cell Reaction | Manufacturer |
|---|---|---|
| Lead-Acid | Anode: Pb + HSO4−⇄ 4Pb(II)SO4 + H+ +2e− Cathode: Pb(IV)O2 + 3H+ + HSO4− + 2e− ⇄ Pb(II)SO4 + 2H2O Overall cell: PbO2 + Pb+ 2H2SO4 ⇄ 2PbSO4 + 2H2O | MK Powered (Anaheim, USA), Exide (Milton, USA), Electro source (Canada), Clarios (Milwaukee, USA), Leoch (China) [17,18] |
| NiCd | Anode: Cd + 2OH− ⇄ Cd(OH)2 + 2e− Cathode: 2NiO(OH) + 2H2O + 2e− ⇄ 2Ni(OH)2 + 2OH− Overall cell: 2NiO(OH) + Cd + 2H2O ⇄ 2Ni(OH)2 + Cd(OH)2 | SAFT (France), ALCAD (Irun, Spain), Raytalk (China), Enersys (Reading, USA), Mouser (Mansfield, USA), HAWKER GmbH (Germany), GAZ (Russia) [18,19,20,21] |
| Li-ion | Anode: LixC6 ⇄ xLi+ + C6 + xe− Cathode: Li1−xXXO2+xLi++xe−⇄ LiXXO2 Overall cell: LixC6 + Li1−xXXO2 ⇄ LiXXO2+C6 | Panasonic (Osaka, Japan), LG Chem, SK Innovation (Seoul, South Korea), A123 Systems (Michigan, USA), Samsung SDI (Yongin, South Korea), CATL (Ningde, China), Toshiba (Tokyo, Japan), AESC (China), Bisco (Anaheim, USA) [18,22] |
| Battery | Lead-Acid (12 V, 1.2 Ah) | NiCd (1.2 V, 1.3 Ah) | Li-Ion Polymer Battery (3.6 V, 1 Ah) | |
|---|---|---|---|---|
| Parameter | ||||
| 12.65 | 1.25 | 3.73 | ||
| 0.25 | 0.023 | 0.09 | ||
| 0.33 | 0.0085 | 0.0088 | ||
| 0.66 | 0.14 | 0.47 | ||
| 2884.61 | 5.77 | 3.53 | ||
| Parameters | Lead-Acid | Li-Ion | NiCd |
|---|---|---|---|
| Efficiency (%) | 60–95 | 85–97 | 60–91 |
| Life cycles | 500–2500 | 1000–10,000 | 2000–2500 |
| Specific energy (Wh/kg) | 30–50 | 75–265 | 45–80 |
| Battery | Cell Reaction | Manufacturer |
|---|---|---|
| ZEBRA | Anode: Molten sodium (Na) Cathode: Ni and NaCl impregnated with NaAlCl4 Overall cell: NaAlCl4 + 3Na ⇄ 4NaCl + Al | MES-DEA (Switzerland), Eurobat (Brussels, Belgium), FIAMM Sonick (Switzerland), General Electric (Boston, USA) [18,41] |
| NAS | Anode: Sodium (Na) Cathode: Sulfur (S) Overall cell: 2Na + xS ⇄ Na2Sx | NGK Insulators (Tokyo, Japan), ABB (Zürich, Switzerland), Silent Power (Switzerland), BASF (Ludwigshafen am Rhein, Germany) [18,42] |
| Parameters | ZEBRA | NAS |
|---|---|---|
| Efficiency (%) | 70.7–80.9 | 75–90 |
| Life cycles | 2600–4000 | 2500–4500 |
| Specific energy (Wh/kg) | 100–120 | 100–240 |
| Battery | Cell Reaction | Manufacturer/Developer |
|---|---|---|
| ICB | Anode: Cr2+ ⇄ Cr3+ + 1e− Cathode: Fe3+ + 1e− ⇄ Fe2+ | NASA (Washington D.C., USA), Mitsui Engineering & Shipbuilding Co. Ltd. (Tokyo, Japan), Sumitomo Electric Industries Ltd. (Osaka, Japan) [51] |
| VRB | Anode: V 4+ ⇄ V5+ + 1e− Cathode: V 3+ + 1e− ⇄ V2+ | University of South Wales (Cardiff, U.K.), UniEnergy Technologies (Mukilteo, USA), Rongke Power (Dalian, China), Kashima-Kita Electric Power Group (Japan), Kansai Electric Company (Osaka, Japan), Hokkaido Electric Power Company (Sapporo, Japan), Fraunhofer Institute (Münich, Germany), Sumitomo Electric Industries, Mitsubishi Chemicals (Tokyo, Japan) [51,52,53] |
| ZNBR | Anode: Zn ⇄ Zn2+ + 2e− Cathode: Br2 + 2e− ⇄ 2Br− | RedFlow (Brisbane, Australia), Jofemar Energy (Peralta, Spain) [54,55] |
| Parameters | ICB | VRB | ZNBR |
|---|---|---|---|
| Efficiency (%) | 76.3–79.6 | 65–90 | 60–85 |
| Life cycles | - | 100,000–18,000 | 2000–10,000 |
| Specific energy | 15.8 Wh/L | 20–70 Wh/L 10–50 Wh/kg | 30–85 Wh/L 30–50 Wh/kg |
| Battery | Cell Reaction | Manufacturer |
|---|---|---|
| Li-Air | Anode: Li ⇄ Li+ + 1e− Cathode: Li+ + 1e− + O2⇄ LiO2 | American Chemical Society (Washington, DC., USA) |
| Zn-Air | Anode: Zn + 4OH− ⇄ Zn(OH)42− + 2e− Cathode: 1/2O2 + H2O + 2e− ⇄ 2OH− | NantEnergy (Scottsdale, USA), Cegasa (Vitoria, Spain), ReVolt (USA), Energizer (Saint Louis, USA). |
| Comparison of Battery Storage Technologies | ||||
|---|---|---|---|---|
| Characteristics | Conventional Batteries | Molten Salt Batteries | RFBs | Metal-Air Batteries |
| Efficiency (%) | 60–97 | 70.7–90 | 60–90 | 75 |
| Life cycles | 500–10,000 | 2500–4000 | 2000–18,000 | <1000 |
| Specific energy (Wh/kg) | 30–200 | 100–240 | 10–50 | 250–300 |
| Technology | Lifetime | Efficiency | Volumetric Density |
|---|---|---|---|
| Compressed hydrogen storage | 20 years | 90–95% | 30 g/L |
| Liquid hydrogen storage | 30 years (2025 DOE target) | 75–80% | 70.8 g/L |
| Metal hydrides storage | 10 years | 85–90% | 100 g/L |
| Complex hydrides storage | 30 years | - | 150 g/L |
Publisher’s Note: MDPI stays neutral with regard to jurisdictional claims in published maps and institutional affiliations. |
© 2022 by the authors. Licensee MDPI, Basel, Switzerland. This article is an open access article distributed under the terms and conditions of the Creative Commons Attribution (CC BY) license (https://creativecommons.org/licenses/by/4.0/).
Share and Cite
Andújar, J.M.; Segura, F.; Rey, J.; Vivas, F.J. Batteries and Hydrogen Storage: Technical Analysis and Commercial Revision to Select the Best Option. Energies 2022, 15, 6196. https://doi.org/10.3390/en15176196
Andújar JM, Segura F, Rey J, Vivas FJ. Batteries and Hydrogen Storage: Technical Analysis and Commercial Revision to Select the Best Option. Energies. 2022; 15(17):6196. https://doi.org/10.3390/en15176196
Chicago/Turabian StyleAndújar, José Manuel, Francisca Segura, Jesús Rey, and Francisco José Vivas. 2022. "Batteries and Hydrogen Storage: Technical Analysis and Commercial Revision to Select the Best Option" Energies 15, no. 17: 6196. https://doi.org/10.3390/en15176196
APA StyleAndújar, J. M., Segura, F., Rey, J., & Vivas, F. J. (2022). Batteries and Hydrogen Storage: Technical Analysis and Commercial Revision to Select the Best Option. Energies, 15(17), 6196. https://doi.org/10.3390/en15176196