Article

The Carbon Emission Trading Policy of China: Does It Really Boost the Environmental Upgrading?

1
Management School, Hainan University, Haikou 570228, China
2
School of Economics, Hainan University, Haikou 570228, China
3
College of Management and Economics, Tianjin University, Tianjin 300072, China
4
College of Horticulture, Hainan University, Haikou 570228, China
5
Department of Environment and Soil Sciences, University of Lleida, 25198 Lleida, Spain
*
Author to whom correspondence should be addressed.
Energies 2022, 15(16), 6065; https://doi.org/10.3390/en15166065
Submission received: 9 July 2022 / Revised: 29 July 2022 / Accepted: 3 August 2022 / Published: 21 August 2022

Abstract

:
China’s rapid industrialization has led to massive resource consumption, and the country has recently been highlighted as the World’s top carbon emitter. To pursue a sustainable economy via environmental upgrading, reductions in carbon emission levels are of great concern. The carbon emission reduction policy (CETP) is an environmental regulation aimed at cutting emissions and achieving environmental protection. Based on panel data of pilot and non-pilot regions, this study investigated the policy impact of the CETP on carbon emission reduction through difference-in-differences (DID). The findings, based on pooled OLS (ordinary least squares) and LSDV (least square dummy variable) regressions, revealed that the carbon emissions of the pilot regions (Beijing, Tianjin, Shanghai, Guangdong, Chongqing, and Hubei) had reduced by 12 percent more than the non-pilot regions. Thus, this implies that the CETP causes environmental upgrading. The results were further verified using a number of robustness checks, including parallel trends, placebo test, Granger causality test, and DID regression with a longer sample period. Based on the study findings, it was concluded that to achieve higher upgrade levels related to the environment, the CETP needs to be encouraged and improved for nationwide implementation. Furthermore, sustainable economic development in China also needs strict environmental regulations and policy measures.

1. Introduction

Sustainable economic and human development is severely threatened by the emission of carbon dioxide. China’s rapid industrialization has given rise to massive resource use and ecological degradation, thus making it the world’s greatest carbon emitter [1]. According to Xu et al. [2], total carbon emissions by China accounted for 27.3% of the world total in 2006. Figure 1 shows the historical trend of carbon emissions and economic growth rates represented by GDP growth (percentage) of China, from 2000 to 2016. Compared to 2005 levels, China has pledged to cut its carbon emissions per unit of GDP by 60–65% by 2030; to reach its maximum carbon emissions in 2030; and to attain carbon neutrality by 2060 [3,4]. Faced with carbon emission reduction objectives and environmental protection ambitions, the 14th Five-Year Plan offers a low-carbon development route, via green environmental protection [5]. The central and local governments of China are trying to attain these objectives via implementation of various policies, laws, and regulations focusing on environmental protection and reduced carbon emissions [6]. As per the Porter hypothesis, environment protection can be achieved through suitable environmental regulations. Appropriate environmental policies can help to reduce energy intensity, upgrading of industrial structures, and an ultimate environmental upgrading via carbon emission reductions, as carbon emission reductions are a reflection of upgraded technology. Jia et al. [7] stated that in accordance with the new green growth philosophy, China has paid greater attention to environmental preservation and implemented different actions to reduce emissions, including industrial and energy structure adjustment (Mi et al.) [8] and adopting market instruments for emission reduction [9]. According to Wu and Gong [10], the use of a market-oriented mechanisms for cutting down carbon emissions is more cost-effective, as well as more efficient, than conventional strategies. Among these market mechanisms, one of the most effective approaches is the emissions trading scheme (ETS), which is aimed at mitigating GHG emissions (GHG). According to the ETS, the government distributes a set of carbon emission quotas, and enterprises need to follow these quotas. In case of exceeding these quotas, enterprises face penalties or purchase quotas from carbon emission markets.

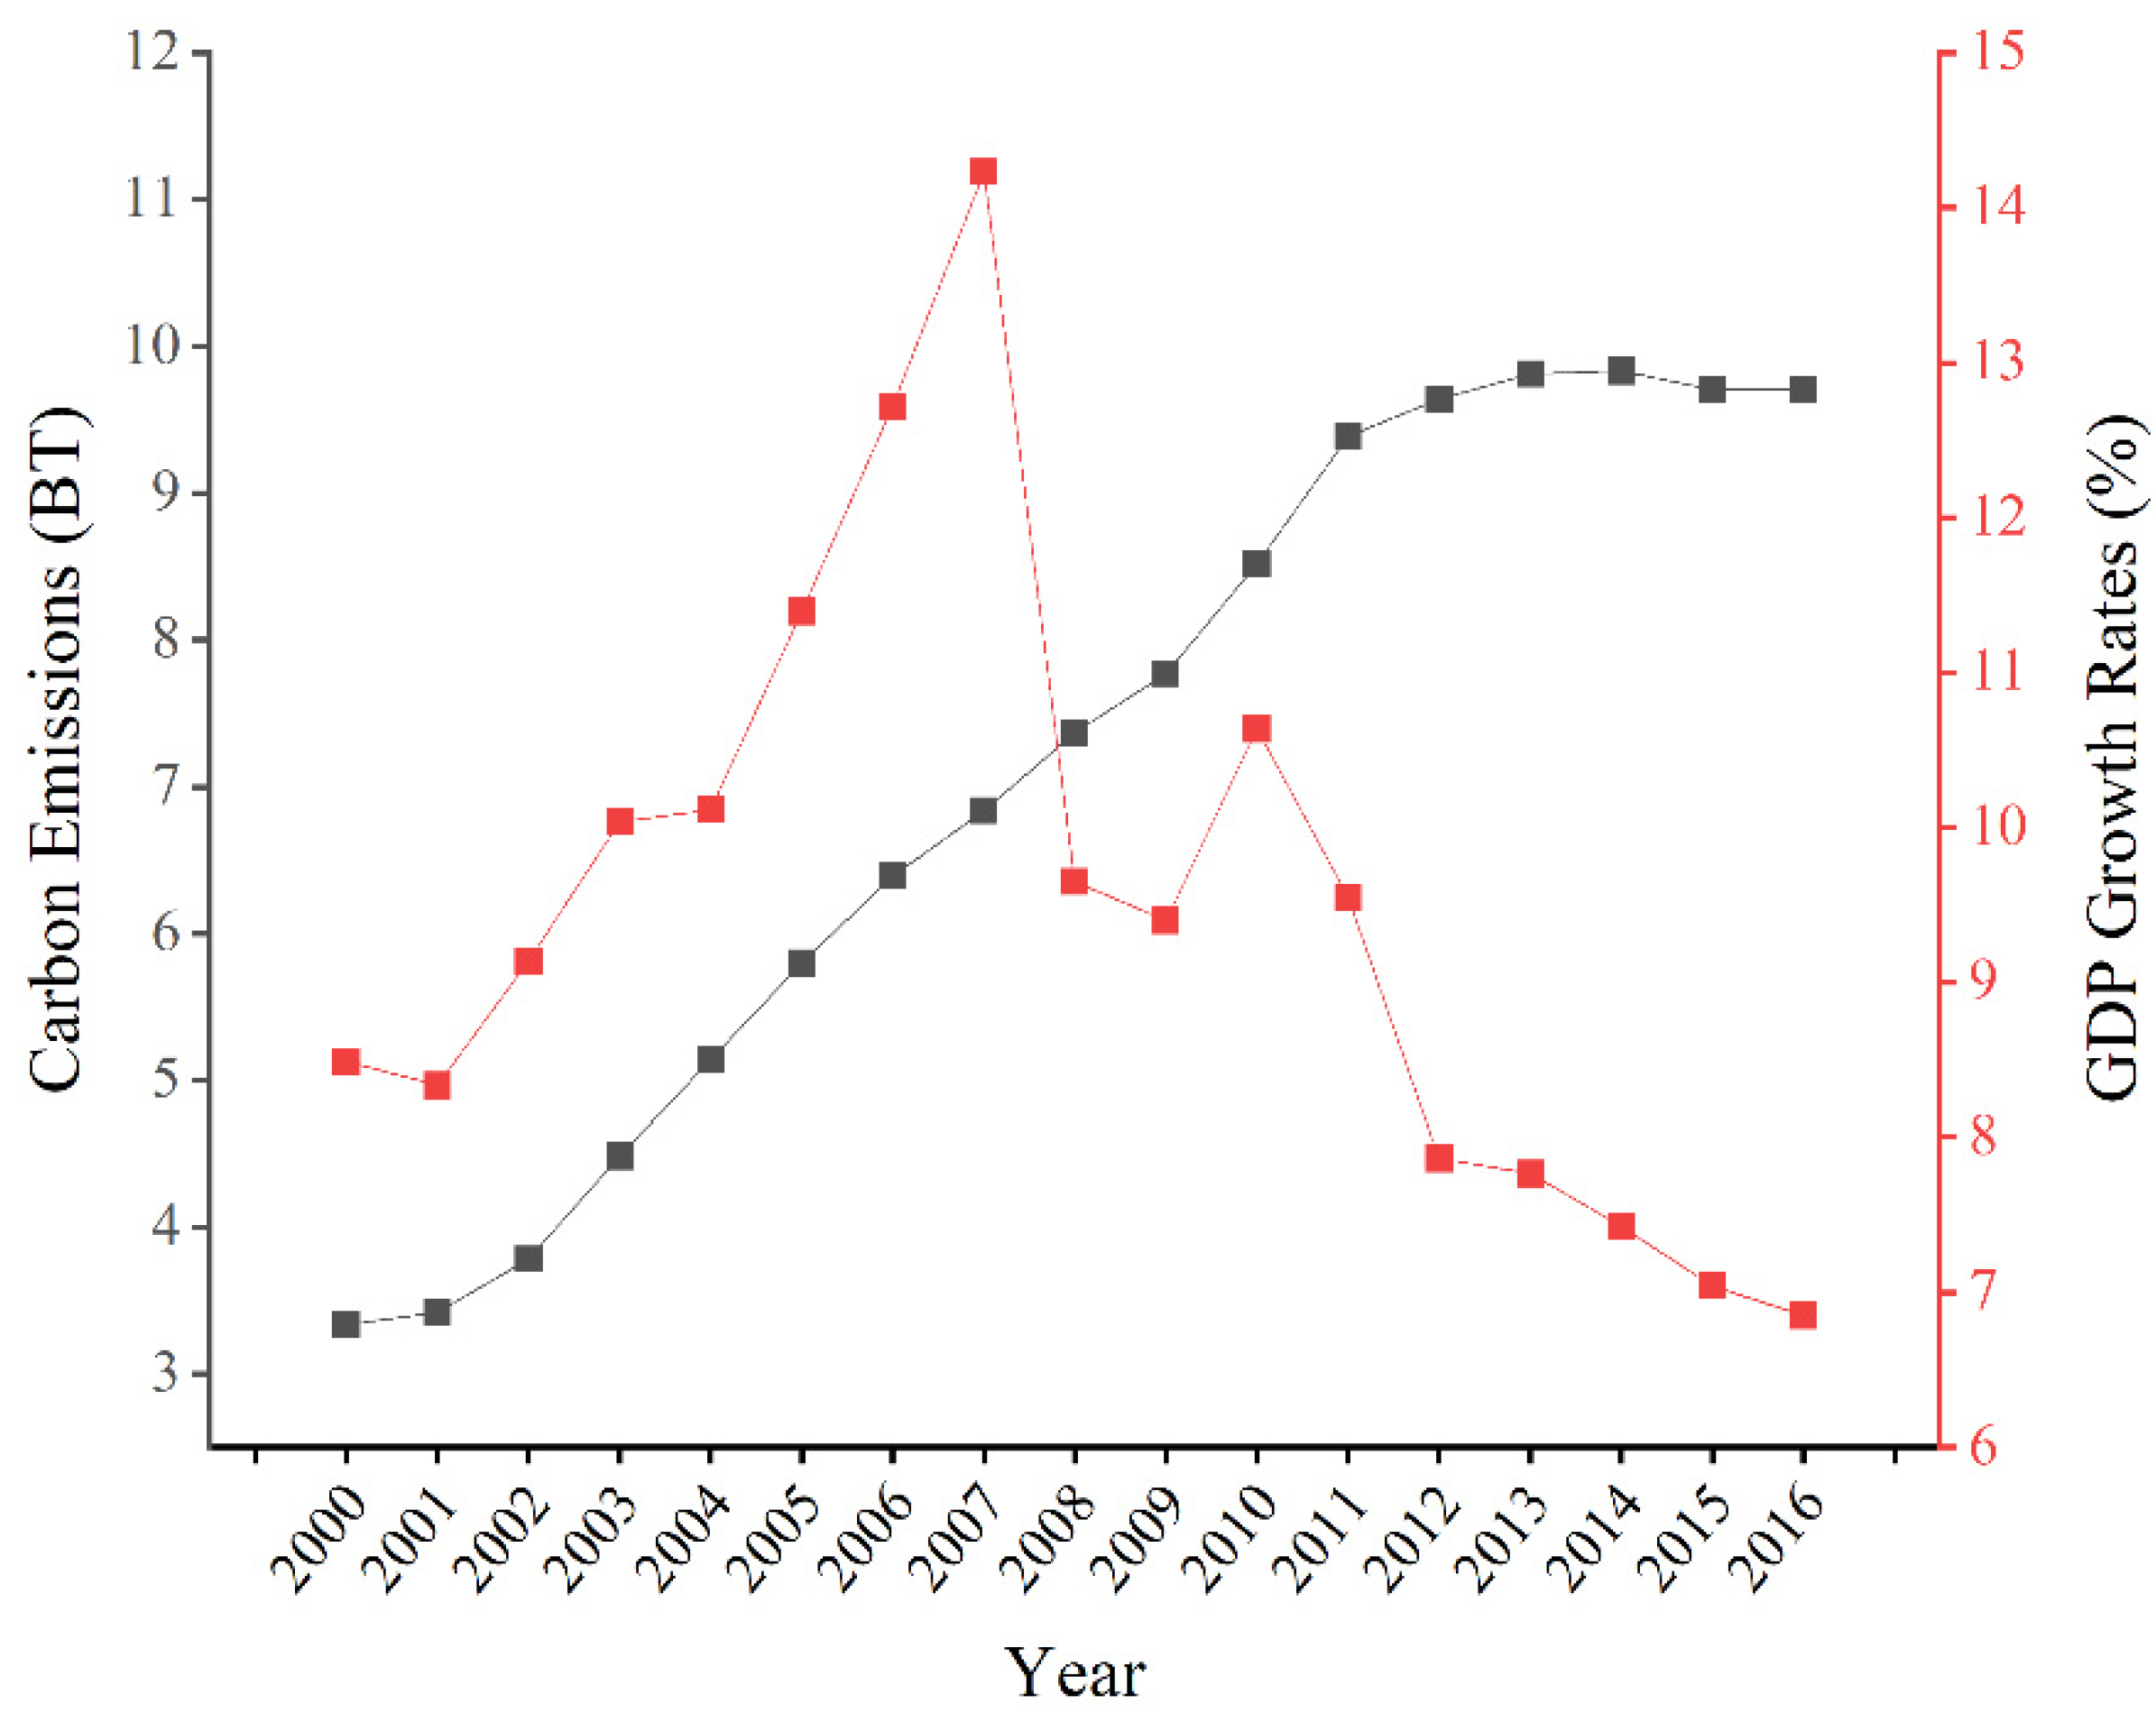
1.1. Research Background

In recent decades, with the increasing threats of environmental degradation and climate change to mankind, environmental regulatory policies have gained much attention globally. According to Zhou et al. [11], serious environmental consequences are threatening human health in developing countries, as the economic growth of these economies relies greatly on resource-intensive industries. Since the reforms and opening up of China, the country has achieved rapid economic growth and industrialization, which also led towards serious environmental pollution problems [12,13]. How to respond to environmental regulations is a main challenge for pollution-intensive firms [11]. The evaluation of the efficacy of environmental regulations for policy improvement and economic development coupled with environmental protection is becoming a great necessity [14,15]. The CETP is one of these environmental regulations, designed by the Chinese government to achieve their carbon peak goals by 2030 [16]. Since the promulgation of CETP in six provinces in 2013, eight industries have been encompassed by the policy [17].
In social sciences, the favoring and marginalization of specific aims by different policies needs to be evaluated [18]; for example, the significant impact of low-carbon city policy on ecological efficiency improvement was explored by [19]. Hitherto, the literature on CETP includes varying topics, such as employment effects of CETP [20], policy impacts on total factor productivity [21], corporate innovation [22], green innovation [14,23], green production [24], carbon neutrality [25], and energy consumption [26,27]. Despite the increasing literature on impact assessment of the CETP, a number of downsides are still valid and can be investigated. It is widely accepted that the CETP promotes economic development, along with green production and innovation, but the influence of the CETP on environmental upgrading by reducing the carbon emissions of a region has yet to be explored. The research methods found in the literature regarding policy impact evaluation highlight the significance of the DID method, as it tackles the problem of unobservable heterogeneity and omitted variable bias. There are a number of ways in which our study differs from the literature: to begin with, this study presents empirical evidence of the country’s efforts to formulate and improve emission trading schemes and regulations based on the environmental protection effect of the CETP. Another aspect of this study is that it adds depth to the theoretical understanding of CETP’s environmental effectiveness through ongoing environmental upgrading.

1.2. Policy Background

In light of the above background, the carbon emission trading policy (CETP) of China was officially launched in six pilot regions in 2011, by the National Development and Reform Commission (NDRC), and came into operation in 2013. China selected six pilot regions, including Beijing, Tianjin, Shanghai, Guangdong, Chongqing, and Hubei, to execute the CETP via establishment of a carbon emission trading market (CETM) (Figure 2). The combined emissions, GDP, and population of these regions in 2011 were 1501 million-ton CO2, 13.0 trillion yuan, and 249 million people, respectively. With huge volumes and great future potential, the CETP led to the establishment of the world’ largest CETM, covering 1700 enterprises from the power industry in the initial phase [28].
Leading the others, Shenzhen (Guangdong) launched a pilot in June 2013, with encouraging results. In December 2016, the CPC Central Committee and State Council announced methods for assessing ecological civilization goals. These measures included the “green development index” of party leaders’ and officials’ evaluations. The NDRC announced the “National CETM Construction Plan (Power Generation Industry)” in December 2017, launching the national carbon market. The 13th Five-Year Plan aimed for a nationwide CETM by 2020, with a strong structure, active trading, rigorous regulation, and transparency. These policies and efforts showed that the Chinese government values upgrading the CETS. Figure 3 presents the volumes of carbon emission quota trading in pilot regions, as given by the Carbon Emissions Trading Network (CETN, 2021). There was notable progress made in cumulative trading volumes, recorded as 237 × 106 t during 2013 to 2019.
Environmental upgrading may be perceived as the mechanism through which economic players shift toward a manufacturing structure that prevents or decreases environmental issues [29]. The reduction of carbon emissions by the firms to improve their environmental performance and for transformation of environmental problems into competitive advantages has recently been focused on by scholars. Scholars and practitioners are studying the emission reduction effects of CETP through ex post empirical methods or ex ante scenario analysis [30,31]. At international level, the need for an industrial environmental agenda has also been highlighted in recent years [32]. In this context, reduction of carbon emissions is an essential means of determining how well a nation is addressing environmental problems, promoting sustainable environmental performance, and sustaining long-term economic growth [33]. Given China’s market and institutional settings, can pilot CETS promote carbon emission reduction? This question requires empirical investigations. Due to the short period of implementation, hitherto, the literature lacks empirical studies regarding environmental protection and upgrading as a result of CETP, despite the huge potential of China’s CETS. As far as the economic theory behind the emissions trading is concerned, there is no ambiguity. However, for evaluating the practical efficacy of such a scheme and improving future policies for the establishment of a national level CETS, it is necessary to investigate the impact of CETP on environmental upgrading. Developing and emerging economies can also benefit from such empirical investigations on China, as the country is the World’s largest developing country. Thus, environmental upgrading caused by CETP is of great significance for worldwide implementation of emission reduction schemes.
In the current study, a difference-in-differences (DID) analysis was carried out, to study the impact of CETP on carbon emission reductions in pilot and non-pilot regions. In the area of policy impact evaluation, the DID method has become one of the most popular methods, as it accounts for unobservable heterogeneity and omitted variable bias [34]. Furthermore, a robustness analysis was carried out to test the efficacy of results. Finally, from a policy point of view, we discussed some policy implications for improving the future policies related to CETS. The rest of the paper is divided into four sections. Section 2 describes the theoretical framework and empirical methodology, and Section 3 discusses the results. Section 4 suggests some policy implications, along with the conclusions.

2. Methodology

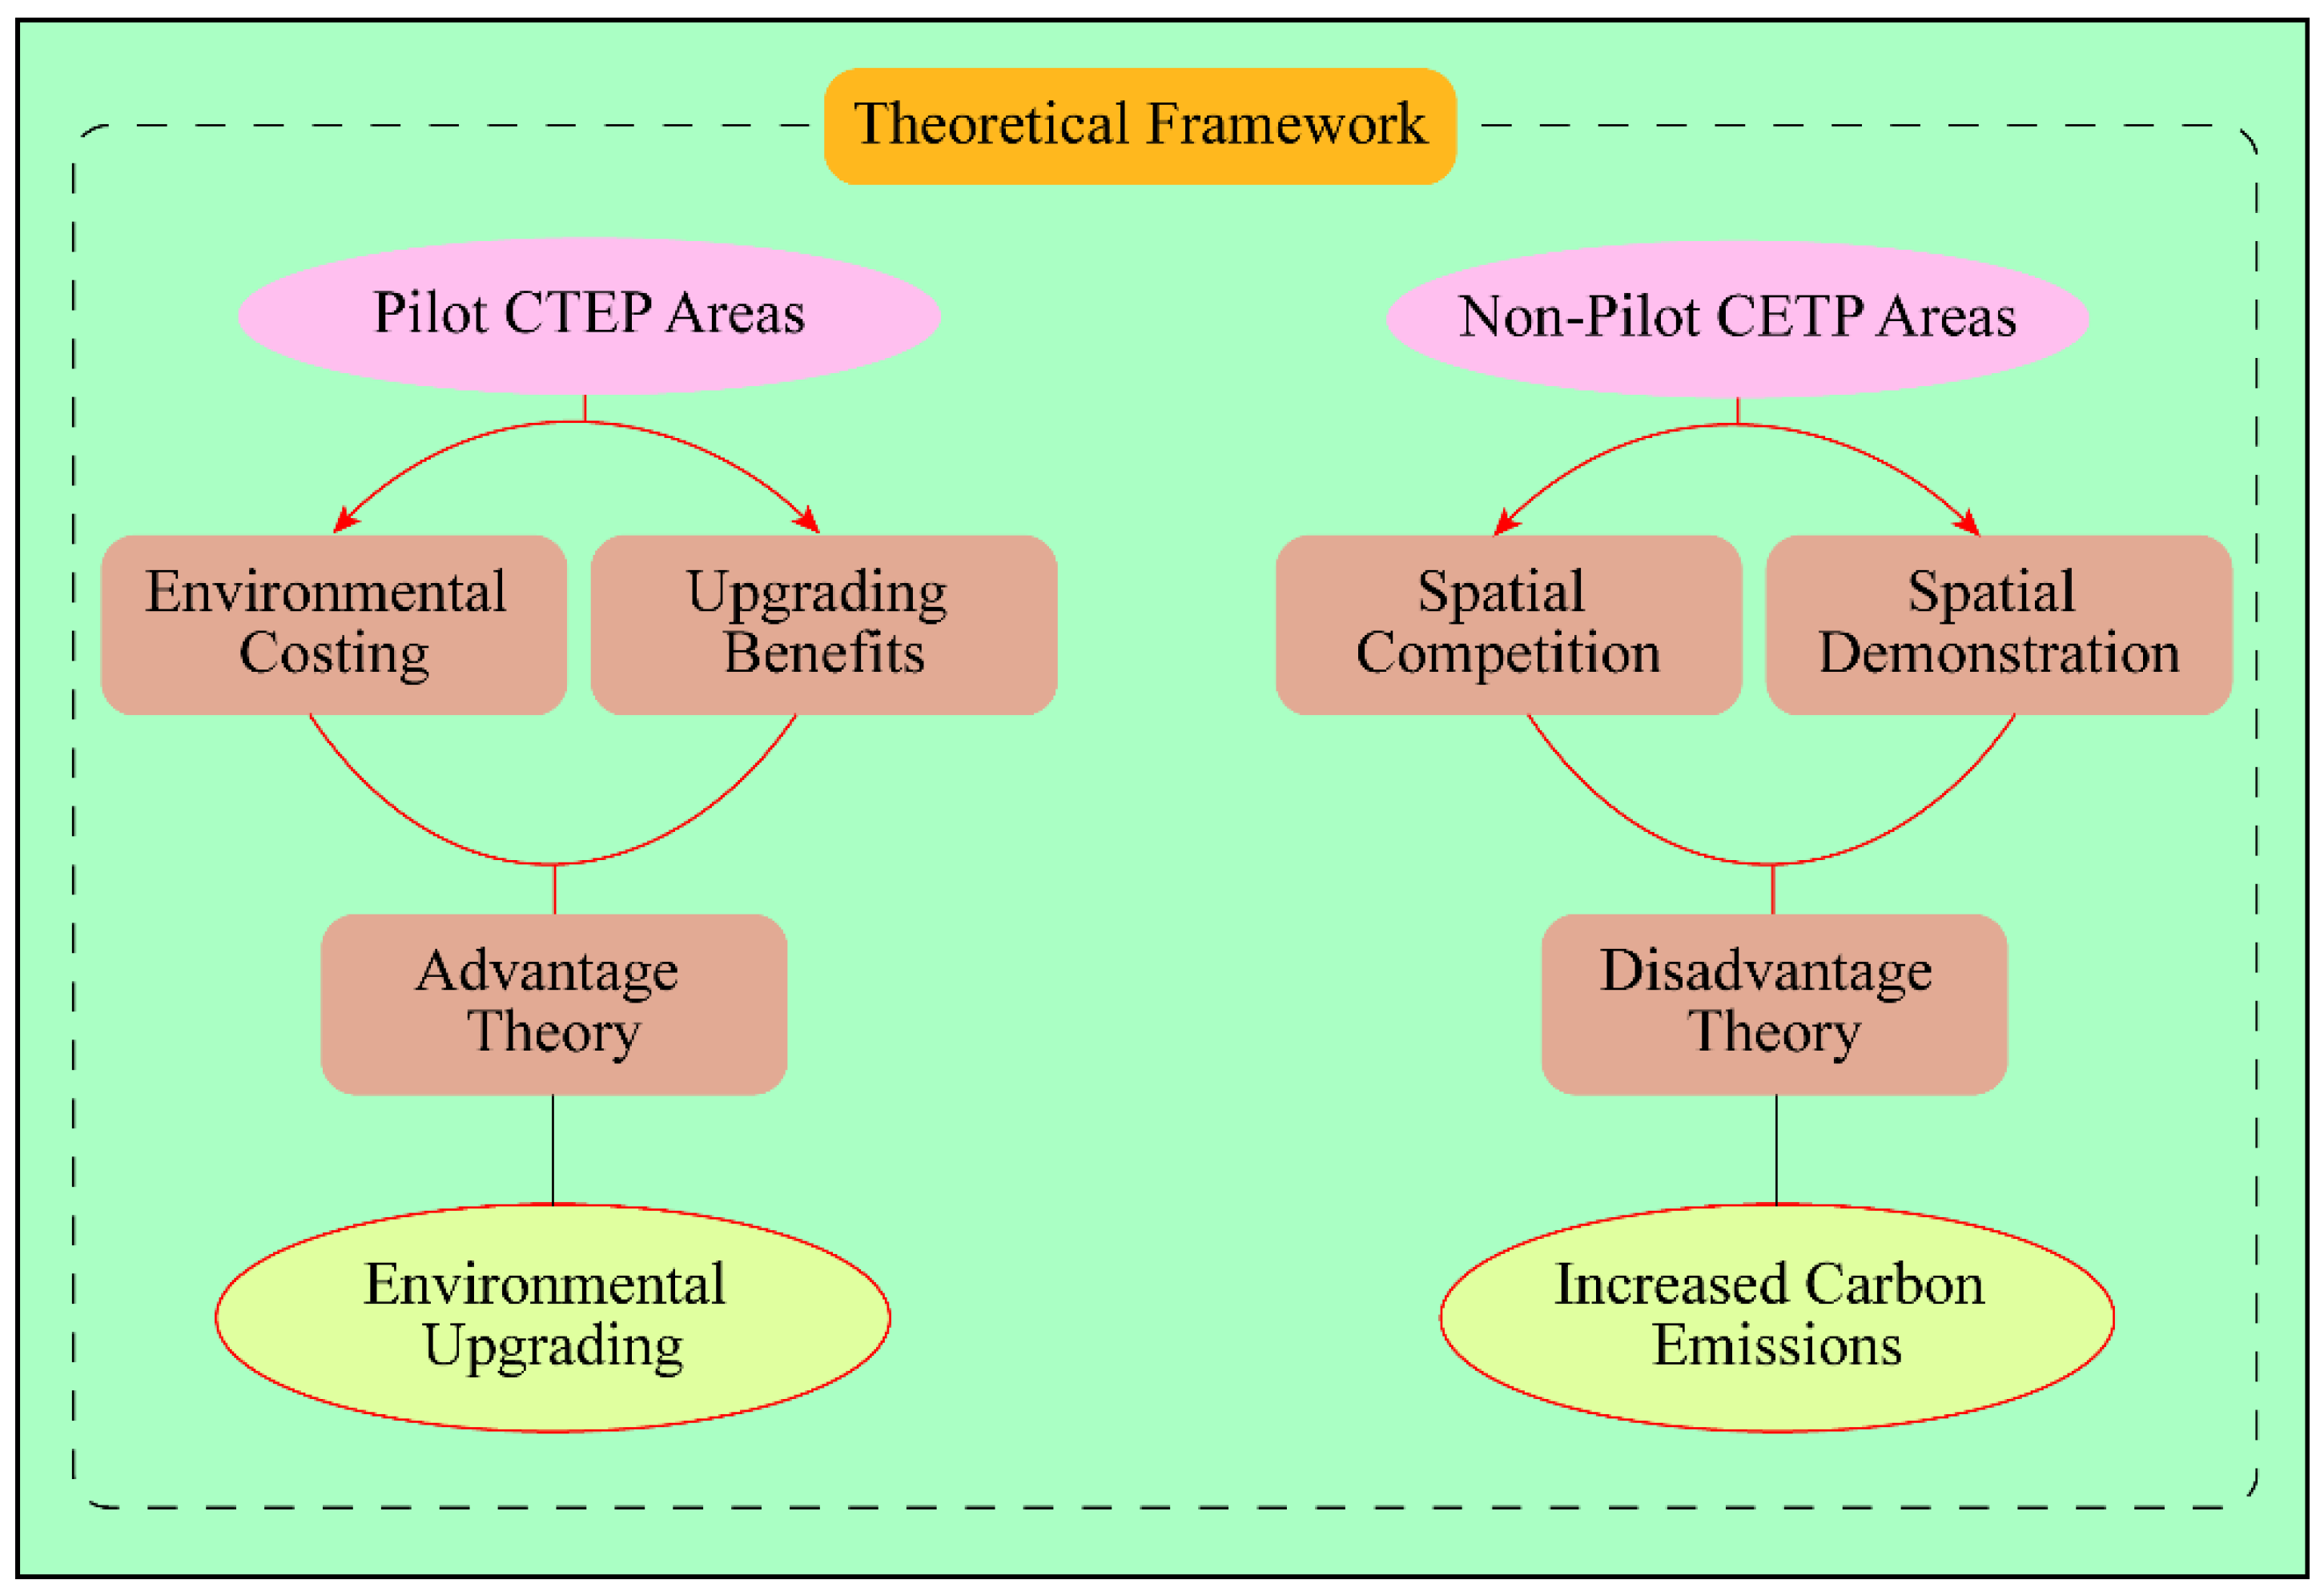
2.1. Theoretical Framework and Research Hypothesis

The theoretical framework indicating the logical relationship between the CETP and environmental upgrading is elaborated in Figure 4. For the construction of a national carbon trading market, carbon emissions should be reduced. Hitherto, the literature shows that enterprises are encouraged towards environmental upgrading, as the carbon the CETP facilitates low-carbon technological upgrading, which in turn leads to low carbon environmental upgrading. The regions with the CETP possess an economic advantage, as firms in these pilot regions use the signal of CET market prices, thus inducing environmental cost and upgrade benefits [35]. According to spatial growth pole theory (SGPT), regions are interdependent, due to varying connections (material and nonmaterial), including resource flow, knowledge diffusion, and commodity trade [36]. Therefore, in light of SGPT, when the CETP leads to environmental upgrading in the pilot regions, neighboring areas experience spatial demonstration and spatial competition effects. This leads to promotion of the environmental upgrading of the pilot regions and neighboring regions. In light of this logical relationship, the current study focuses the following research hypothesis:
Research hypothesis: The environmental upgrading is higher in pilot CETP regions than in regions without CETP. In other words, the CETP facilitates the environmental upgrading of regions through reductions in carbon emissions.

2.2. Empirical Framework

2.2.1. Data and Variables

The study used a panel dataset comprising 30 regions of China over the period of 2006–2016. The CEADS (carbon emission accounts and datasets) database was used to obtain data of the regional CO2 emissions in million tones (mt), whereas the World Bank database (World Development Indicators) was used to obtain growth rates of GDP. Data of other control variables was collected from the China Environmental Statistical Yearbook, RESSET economic and financial database, China Urban Statistical Yearbook, and National Statistical Bureau of China. Based on extant literature and the environmental Kuznets curve hypothesis [37,38], the control variables added in our model are population, foreign direct investment (FDI), per capita gross domestic product (GDP_P), and industrial scale (IS).
Foreign direct investment has a direct impact on the quality of China’s economic development [39,40]. The environmental protection via carbon emission reductions is enhanced with FDI, mainly due to the positive externalities of FDI, including environmental awareness and technological upgrading [41]. Per capita GDP is associated with an increase in carbon emissions, as the fast economic growth ensures greater fossil fuel consumption and pollution emissions [42]. Industrial scale is added, as carbon emissions are reported to increase with increasing share of secondary industry [6]. The control variables are calculated as follow: (1) Foreign direct investment (FDI): The FDI is indicated by the utilization of foreign capital measured by the ratio of fixed assets of industrial enterprises invested by foreign investors and Hong Kong, Macao, and Taiwan enterprises to fixed assets of industrial enterprises above the scale. (2) Per capita GDP (GDP_P): Per capita GDP is used to measure the economic development level of a region. (3) Population (P): total regional populations are taken as a control variable. (4) Industrial scale (IS): An industry requires higher levels of social and state supervision with increased industrial scale. In this case, carbon emissions are expected to reduce due to increased industrial scale. The current study takes the industrial value added to represent the industrial scale variable. Certain missing data are addressed by referencing the Chinese provincial statistics yearbooks, or by using the interpolation technique. Furthermore, the discrepancy between the sample period for pre-policy and post-policy time is due to the fact that, after 2016, many other regions also started shaping their CETP programs, so the results will be affected if we ignore this fact; thus, we restricted our analysis to up to 2016. Prior to analysis, all variables were changed to log form, in order to reduce the sharpness of the findings and facilitate their explanation. Table 1 gives definitions and descriptive statistics for all the variables used in the DID model.

2.2.2. DID Modal

The current research applied the DID technique to assess the policy impact of CETP on the environmental upgrading of the pilot regions. The CETP was first implemented in 2013, and it was observed as a quasi-natural experiment. Regional level data form the first layer of difference in the DID model, while the year level data form the second layer of difference. Based on the cut-off year of 2013 for implementation of CETP, we used data of a total 30 provinces (except for Tibet, Hong Kong, Macao, and Taiwan) divided into two groups; one group was from the six pilot CETP regions (Beijing, Tianjin, Shanghai, Guangdong, Chongqing, and Hubei) and second group was from non-pilot CETP regions (the remaining 24 regions), and the dummy variable of treatment for the experimental group was set by either the group affected by the policy or not. As the pilot program of CETP was established in six regions in 2013, these six regions were assigned a value of 1 as the experimental group, and other regions had a 0 dummy value, as the control group. Despite the approval of the CETP in 2011, the actual implementation was carried out in late 2013 and start 2014. Therefore, the dummy variable for the experimental period was based on the time of CETP implementation; i.e., the years after the program implementation (year 2014–2016) was represented with 1, and the before program implementation period (year 2006 to 2013) was assigned a value of 0. The difference between the carbon emissions of the pilot CETP regions and non-pilot CETP regions before and after implementation of CETP was compared using the DID method. Since our outcome variable and regression factors might be related with some regional characteristics changing over time, DID estimation was done via constructing a two-way fixed effects model, as below:
C E i , t = β o + β 1 t r e a t i × p e r i o d t + μ t + φ i + ε i , t
C E i , t = β o + β 1 t r e a t i × p e r i o d t + β 2 Z i , t + μ t + φ i + ε i , t
In Equation (1), CEi,t is the carbon emissions of the region and is the explanatory variable of the model, representing environmental upgrading. It indicates the degree of environmental upgrading achieved by a region i in year t, as the decline in carbon emissions in the pilot CETP regions is an indicator of environmental upgrading. treati = 1 means that region i has CETP in the year t . t r e a t i = 0 means that region i has no CETP in the year t . p e r i o d t = 0 denotes the period before the policy’s implementation, while periodt = 1 denotes the year after the policy’s implementation. φ i represents the regional fixed effect, and μ t represents the time-fixed effect. In Equation (2), Z i , t   denotes a set of regional-year-level control variables. The coefficient in question in this paper is β1 in the aforementioned estimate formula. If the estimated result of β1 < 0 is found, this is an indication of a reduction in carbon emissions, and thus environmental upgrading under the CETP, as compared to the non-pilot CETP regions. Following the method of [35], we observed that all of our data fit into one of four categories, to validate that β1 is the true DID estimator: (1) pre-CETP implementation period for pilot regions, (2) post-CETP implementation period for pilot regions, (3) pre-CETP implementation period for non-pilot regions, and (4) post-CETP implementation period for non-pilot regions.

3. Results and Discussion

3.1. Comparative Analysis of Variables’ Means

Due to the requirement for a buffer period for implementation of the CETP, complicated coordination amid various parties, and the completion requirement for CETP amid emission control enterprises, the actual outcomes of CETP were not abrupt, delaying the impact to the second year after the CETP implementation (2014). The current study focuses on 2013 as a cut-off point for policy impact analysis, dividing the whole sample into pre-policy (2006–2013) and post-policy (2014–2016) time periods. A comparative analysis of the variables’ mean values between pre-policy and post-policy periods showed a slight increase in carbon emissions of the control group (non-pilot CETP regions), whereas the carbon emissions of the experimental group (pilot CETP regions) exhibited a reduction from the pre-policy to post-policy period (Table 2). These results suggest that, ceteris paribus, the CETP leads towards environmental upgrading through reductions in carbon emissions.

3.2. Impact of CETP on Carbon Emissions: Mixed OLS and LSDV Estimation

The carbon emission trading policy is an efficient policy tool for achieving environmental upgrading benefits via reductions in carbon emissions. Hitherto, studies related to CETP impact assessment have primarily focused on the economic impacts, including employment, green production, and the stock market [43,44,45]. For precise estimation of the impact of CETP on carbon emission reductions, the pooled OLS (ordinary least squares) model and LSDV (least squares dummy variable) model were employed with fixed effects estimation. The benchmark regression results for the policy impact of CETP on carbon emissions are presented in columns 1 to 4 of Table 3. A basic DID estimation is performed in column 1 and 3, excluding all the control variables other than fixed effects, which are then added to column 2 and 4.
According to both the pooled OLS and LSDV regressions, all three coefficients of DID estimation were found to be statistically significant. The estimate of DID (CETP × post-policy) has a value of −0.121 and −0.136, with and without inclusion of control variables, respectively. This depicts that after including all the control variables and regional and time fixed effects, the carbon emissions of the pilot CETP regions reduced by 12 percent more than the non-pilot CETP regions. Furthermore, the magnitude of the DID estimator was greater after adding all control variables. This implies that the CETP certainly leads towards environmental upgrading, due to its potential reduction effect on carbon emissions [46], as improved environmental regulations will lead towards a process of upgrading related to the environment [32]. Scholars have also shed light on increased environment-friendly technologies under carbon emission trading [47]. This technological upgrading also leads towards environmental upgrading. The log of per capita GDP, population, and industrial scale affected carbon emissions positively, which is in line with the existing literature [6,48]. Whereas, FDI caused eminent reductions in carbon emissions, as the technological upgrading associated with increased FDI led to environmental protection [41], mainly due to improved ecological efficiency [49]. Due to the varying results of the DID estimate with and without addition of the control variables, further robustness checks are applied in the subsequent section for accuracy analysis of the DID estimates.

3.3. Robustness Tests

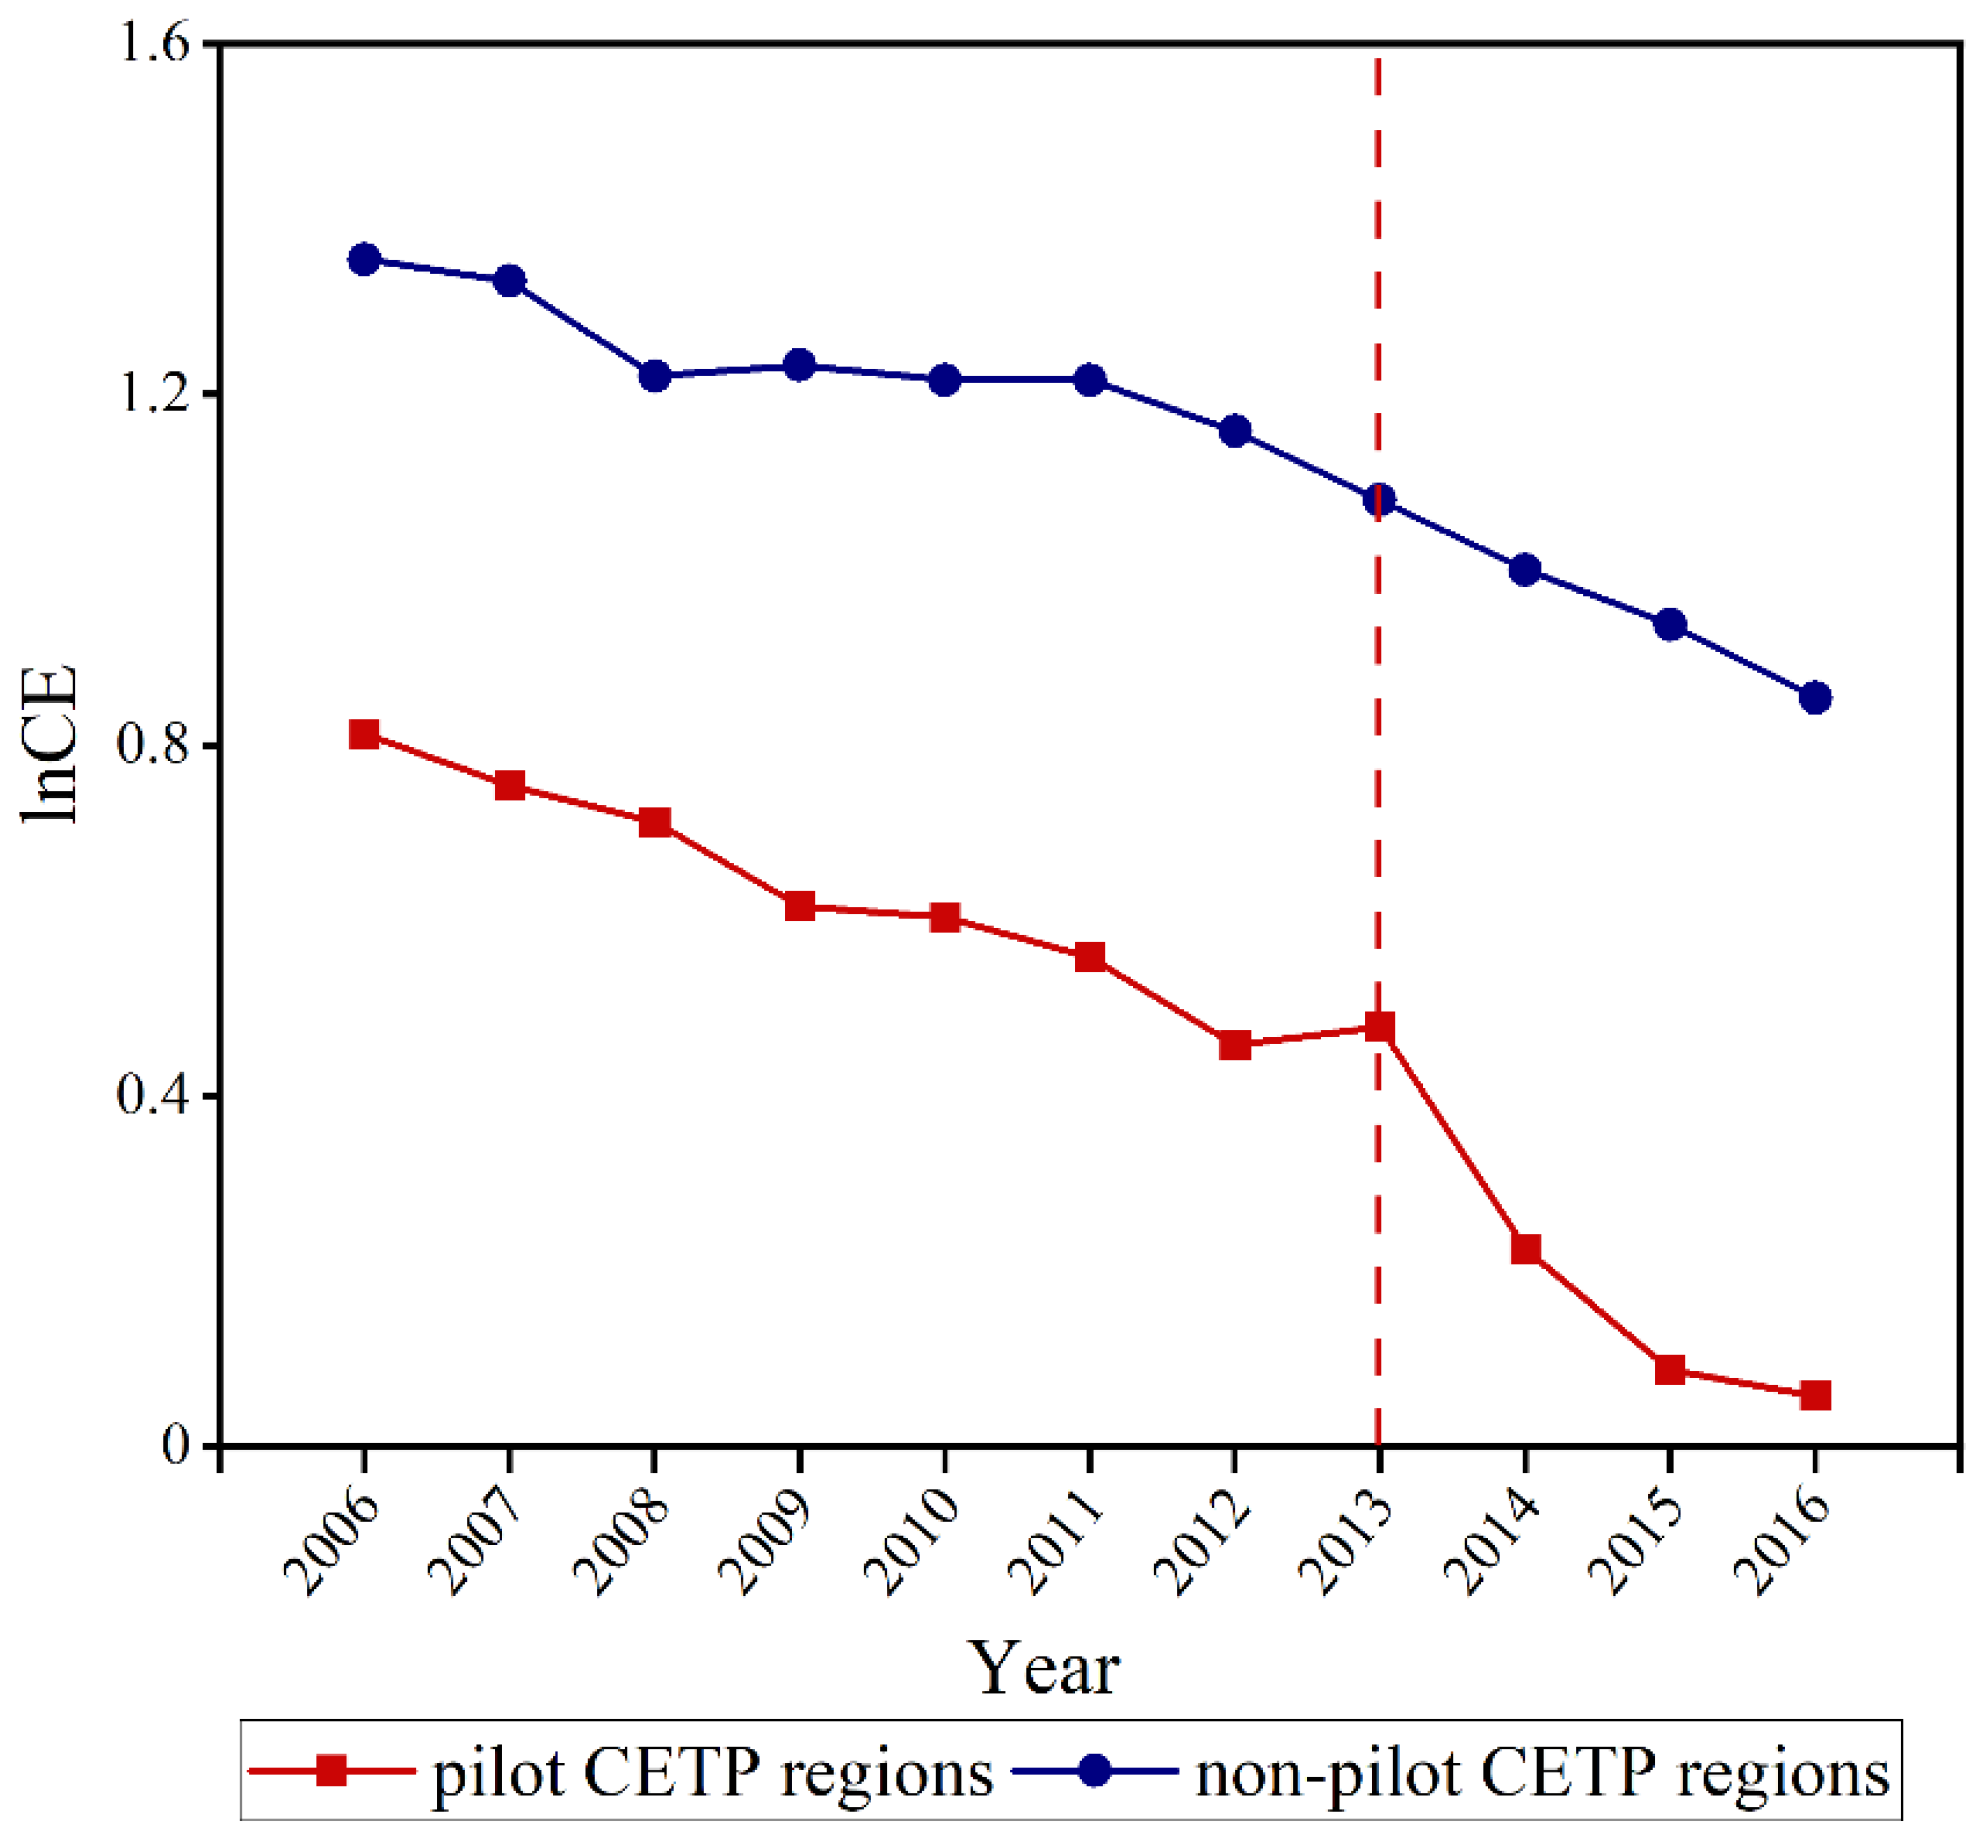
3.3.1. Parallel Trend Analysis
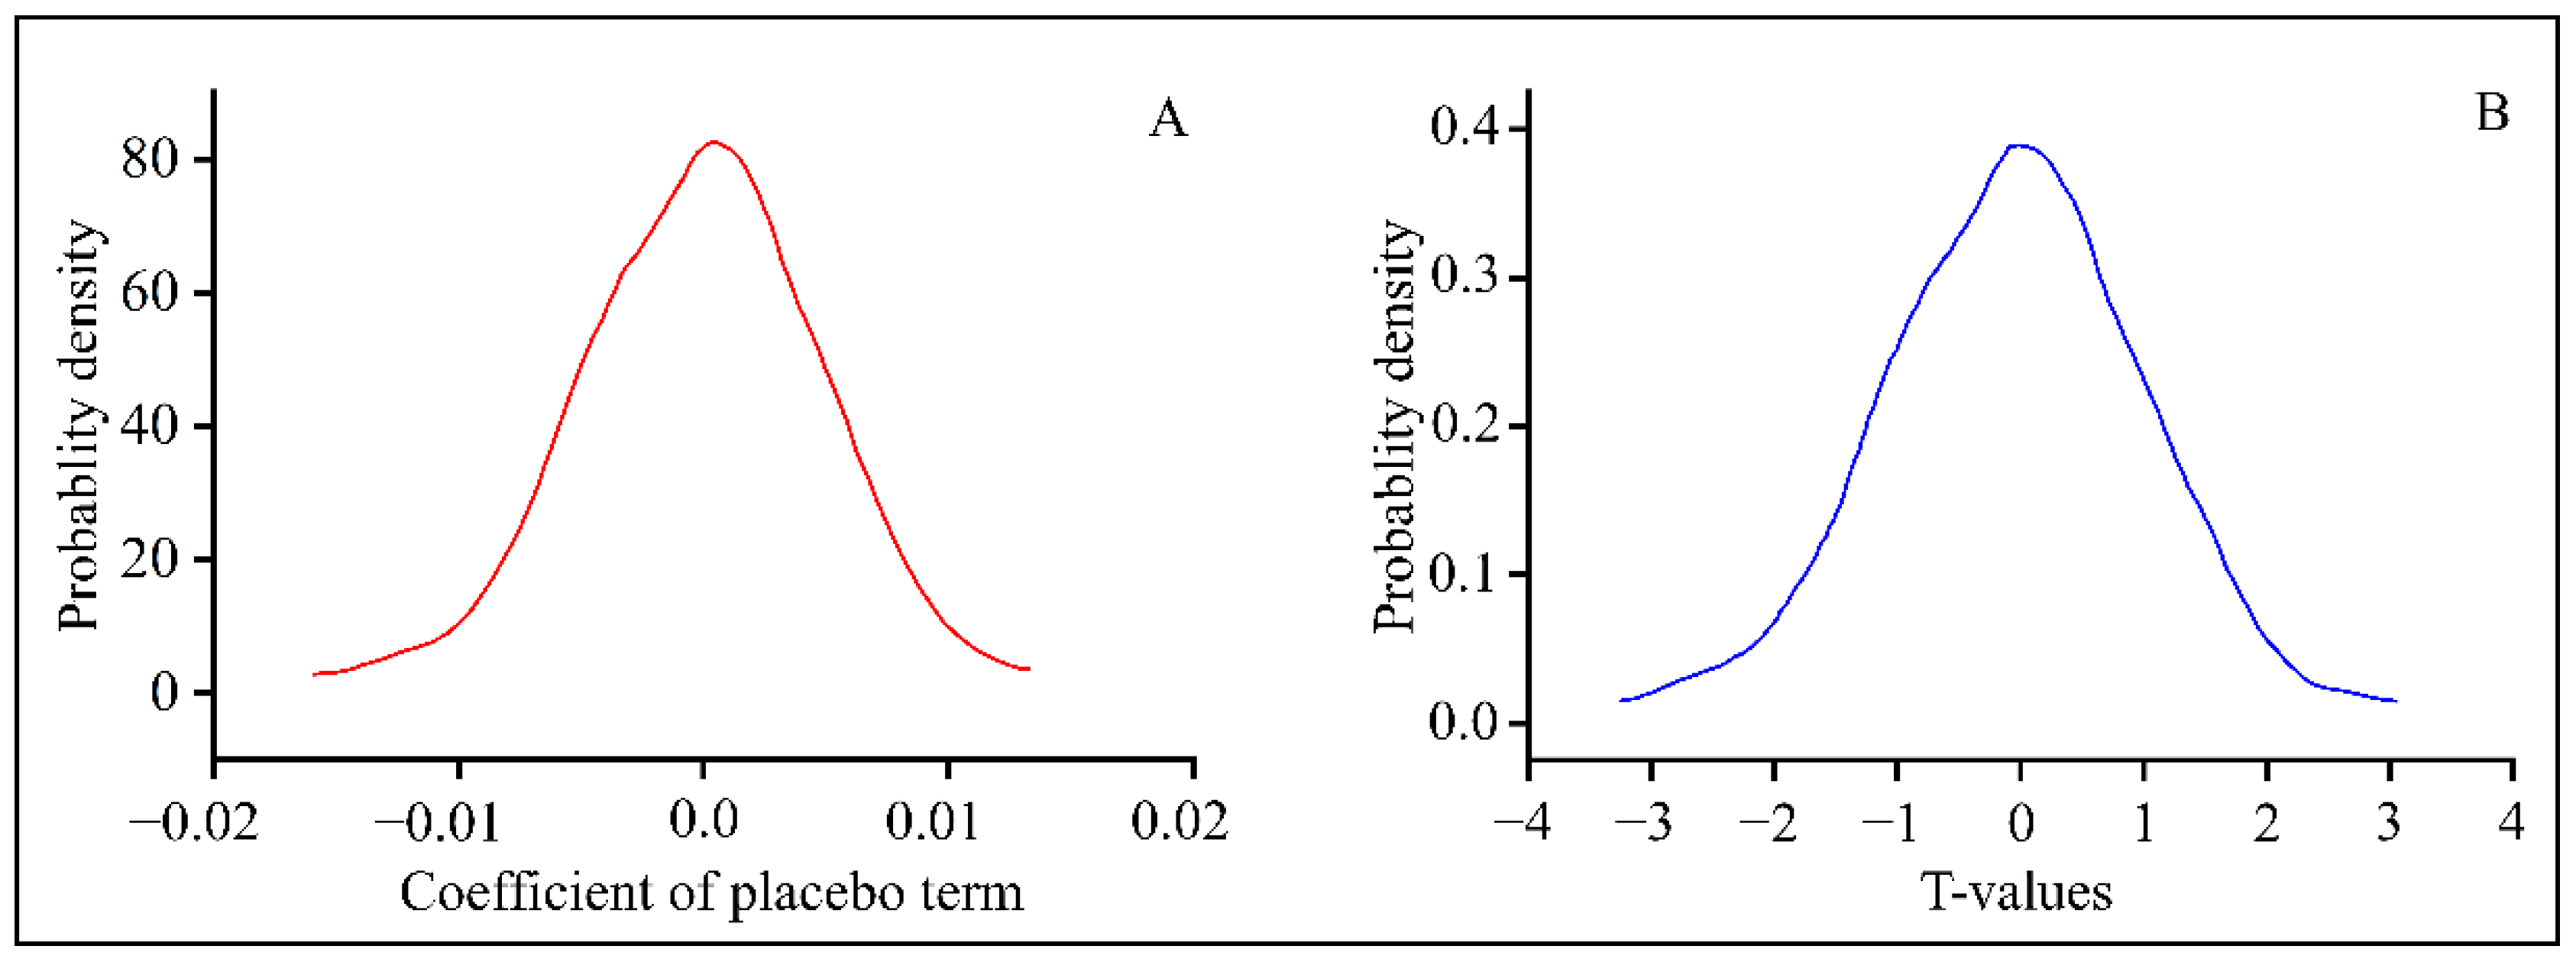
The DID model is best fit if the trends of dependent variable for the control and experimental group are parallel in the pre-policy period. A parallel trend analysis was carried out in the current study, with the aim of obtaining distinct results in the experimental and control groups, and removing the potential of the pre-existing elements being behind carbon emission reductions. We checked the parallel trend for carbon emissions, both visually and statistically (Figure 5, Table 4). Prior to the implementation of the CETP, the treatment and control regions followed a similar course and did not exhibit a dramatic difference (Figure 5). A parallel trend was visually clear between pilot and non-pilot regions before 2013, and a parallel-trend test could be used to further assess this assumption (Table 4). The findings showed that there was not enough evidence to rule out the null hypothesis of parallel trends (p > 0.05). The parallel-trends assumption was supported by the test and the graphical analysis.

3.3.2. Placebo Test

To check the accuracy of our DID estimates, a placebo test was conducted using randomly created false pilot regions. The placebo test was conducted for carbon emissions of all regions. If the reductions in carbon emission were due to the CETP in our baseline DID analysis, then the DID coefficient should be insignificant for false pilot regions. The false pilot regions were randomly generated for CETP during the original analysis period. After that, the DID model was run using the LSDV method and control variables around 1000 times, using data of the false pilot regions. Finally, the distribution of the estimated DID coefficients and their t-values was plotted using Kernel density plots (Figure 6). The distribution of DID estimates using false pilot regions was mostly gathered around zero, which is only slightly varying from the original DID estimates (see Table 3), and are mostly insignificant with the false t-values ranging from −2 to 2. Thus, the outcomes of the placebo test confirmed the robustness and accuracy of the original DID model and estimates, showing the environmental upgrading impact of the CETP via carbon emission reductions.

3.3.3. Granger Causality Test

Another test we performed was to examine whether the treatment or control groups modified their behavior in expectation of treatment. The Granger causality test was used to verify this assumption. The null hypothesis of no change in behavior prior to treatment was accepted (Table 4). These findings, when combined with our earlier diagnostics, show that we could have confidence in the accuracy of the DID estimate.

3.3.4. DID Analysis with a Longer Sample Period

The pilot scheme of the CETP significantly led to environmental upgrading, as the coefficients of the DID model using pooled OLS and LSDV regressions were statistically significant. Several control variables were also added to the model to reduce the bias and obtain accurate estimates. For confirmation of the DID estimate accuracy, the DID analysis was re-done using a longer sample period (2006–2017) and both OLS and LSDV, as before, and the results are presented in Table 5. The DID estimate for the longer sample period, after adding the control variables, was still significant, implying the significant enhancement of environmental upgrading under CETP. Thus, all of the robustness checks affirmed the accuracy of the main DID estimates over the actual sample period.

4. Conclusions and Policy Implications

Does the carbon emission trading policy of China cause reductions in carbon emissions and lead to environmental upgrading? To investigate this question, the current study employed a difference-in-differences method to test the policy impact of the CETP on the carbon emissions of the Chinese pilot and non-pilot CETP regions. A difference-in-differences (DID) approach was employed to find any discrepancies between the environmental upgrading of the pilot and non-pilot regions. The findings of the DID model showed substantial reductions in carbon emission in the pilot CETP regions, as compared to the non-pilot regions. The results suggest that CETP can effectively reduce carbon emissions, thus it caused environmental upgrading. This implies the importance of the CETP for achieving environmental protection and upgrading. Furthermore, other factors such as foreign direct investment, economic development, and industrial scale are also critical for reducing carbon emissions. After carrying out a series of robustness analyses, including parallel trend analysis, Granger causality test, placebo test, and DID regression with a longer sample period, the results of the DID model were affirmed and tested. Thus, it was concluded that the CETP is a significant strategic regulatory measure for coping with environmental issues and for actively developing new norms of upgrading.
Based on these findings, the current study also produced some policy implications for improvement of the CETP. First, keeping in view the eminent role of emission trading schemes on carbon emission reduction, a harmonized emission trading system at national level should be promoted, as a unified national level system can reduce carbon emissions at a faster rate through coordinated and integrated reduction under a complete and efficient system. Due to limited data availability, the current study has the limitation of ignoring the controlling of financial indicators, such as carbon pricing. Other relevant controls can be added with time, to examine the policy impact of CETP in further detail. A complete set of strict environmental regulations and measures should be formed, including all the controls, for effective resource allocation and environmental upgrading, which would ultimately lead towards sustainable economic development.

Author Contributions

Conceptualization, R.S. and S.L.; Methodology, R.S. and M.A.A.; Data Collection, R.S.; Software and Validation, R.S. and A.S.; Formal Analysis, R.S. and A.J.; Writing Original Draft, R.S.; Review and Editing, S.L. and J.G.; Supervision, S.L.; Funding and Acquisition, S.L. All authors have read and agreed to the published version of the manuscript.

Funding

This paper was financially supported by the National Natural Science Foundation of China (Grant No. 71963012, 71663014), Natural Science Fund Projects of Hainan (Grant No. 2019RC040), and Major Projects in Social Sciences of Hainan Province (Grant No. HNSK (ZD) 19-107).

Institutional Review Board Statement

Not applicable.

Informed Consent Statement

Not applicable.

Data Availability Statement

Not applicable.

Conflicts of Interest

The authors declare no conflict of interest.

References

  1. Wu, R.; Dai, H.; Geng, Y.; Xie, Y.; Masui, T.; Tian, X. Achieving China’s INDC through carbon cap-and-trade: Insights from Shanghai. Appl. Energy 2016, 184, 1114–1122. [Google Scholar] [CrossRef]
  2. Xu, L.; Fan, M.; Yang, L.; Shao, S. Heterogeneous green innovations and carbon emission performance: Evidence at China’s city level. Energy Econ. 2021, 99, 105269. [Google Scholar] [CrossRef]
  3. Feng, T.T.; Li, R.; Zhang, H.M.; Gong, X.L.; Yang, Y.S. Induction mechanism and optimization of tradable green certificates and carbon emission trading acting on electricity market in China. Res. Conserv. Recycl. 2021, 169, 105487. [Google Scholar] [CrossRef]
  4. Jahanger, A. Impact of globalization on CO2 emissions based on EKC hypothesis in developing world: The moderating role of human capital. Environ. Sci. Pollut. Res. 2022, 29, 20731–20751. [Google Scholar] [CrossRef] [PubMed]
  5. Usman, M.; Jahanger, A.; Makhdum, M.S.A.; Balsalobre-Lorente, D.; Bashir, A. How do financial development, energy consumption, natural resources, and globalization affect Arctic countries’ economic growth and environmental quality? An advanced panel data simulation. Energy 2022, 241, 122515. [Google Scholar] [CrossRef]
  6. Zhang, Y.; Li, S.; Luo, T.; Gao, J. The effect of emission trading policy on carbon emission reduction: Evidence from an integrated study of pilot regions in China. J. Clean. Prod. 2020, 265, 121843. [Google Scholar] [CrossRef]
  7. Jia, X.; Zhang, Z.; Wang, F.; Li, Z.; Wang, Y.; Aviso, K.B.; Wang, F. Regional carbon drawdown with enhanced weathering of non-hazardous industrial wastes. Res. Conserv. Recycl. 2022, 176, 105910. [Google Scholar] [CrossRef]
  8. Mi, Z.; Wei, Y.M.; Wang, B.; Meng, J.; Liu, Z.; Shan, Y.; Guan, D. Socioeconomic impact assessment of China’s CO2 emissions peak prior to 2030. J. Clean. Prod. 2017, 142, 2227–2236. [Google Scholar] [CrossRef] [Green Version]
  9. Yi, L.; Bai, N.; Yang, L.; Li, Z.; Wang, F. Evaluation on the effectiveness of China’s pilot carbon market policy. J. Clean. Prod. 2020, 246, 119039. [Google Scholar] [CrossRef]
  10. Wu, L.; Gong, Z. Can national carbon emission trading policy effectively recover GDP losses? A new linear programming-based three-step estimation approach. J. Clean. Prod. 2021, 287, 125052. [Google Scholar] [CrossRef]
  11. Zhou, Y.; Zhu, S.; He, C. How do environmental regulations affect industrial dynamics? Evidence from China’s pollution-intensive industries. Habitat Int. 2017, 60, 10–18. [Google Scholar] [CrossRef] [Green Version]
  12. He, C.; Pan, F.; Yan, Y. Is economic transition harmful to China’s urban environment? Evidence from industrial air pollution in Chinese cities. Urban Stud. 2012, 49, 1767–1790. [Google Scholar] [CrossRef]
  13. Jahanger, A.; Usman, M.; Ahmad, P.A. Step towards sustainable path: The effect of globalization on China’s carbon productivity from panel threshold approach. Environ. Sci. Pollut. Res. 2022, 29, 8353–8368. [Google Scholar] [CrossRef] [PubMed]
  14. Liu, M.; Li, Y. Environmental Regulation and Green Innovation: Evidence from China’s Carbon Emissions Trading Policy. Financ. Res. Lett. 2022, 48, 103051. [Google Scholar] [CrossRef]
  15. Hughes, B.B.; Beas-Luna, R.; Barner, A.K.; Brewitt, K.; Brumbaugh, D.R.; Cerny-Chipman, E.B.; Carr, M.H. Long-term studies contribute disproportionately to ecology and policy. BioScience 2017, 67, 271–281. [Google Scholar] [CrossRef] [Green Version]
  16. Cui, J.; Zhang, J.; Zheng, Y. Carbon pricing induces innovation: Evidence from China’s regional carbon market pilots. AEA Pap. Proceed. 2018, 108, 453–457. [Google Scholar] [CrossRef] [Green Version]
  17. Huang, W.; Wang, Q.; Li, H.; Fan, H.; Qian, Y.; Klemeš, J.J. Review of recent progress of emission trading policy in China. J. Clean. Prod. 2022, 349, 131480. [Google Scholar] [CrossRef]
  18. Baker, S.; Eckerberg, K. A policy analysis perspective on ecological restoration. Ecol. Soc. 2013, 18, 17. [Google Scholar] [CrossRef]
  19. Song, M.; Zhao, X.; Shang, Y. The impact of low-carbon city construction on ecological efficiency: Empirical evidence from quasi-natural experiments. Res. Conser. Recycl. 2020, 157, 104777. [Google Scholar] [CrossRef]
  20. Yang, X.; Jiang, P.; Pan, Y. Does China’s carbon emission trading policy have an employment double dividend and a Porter effect? Energy Pol. 2020, 142, 111492. [Google Scholar] [CrossRef]
  21. Xiao, J.; Li, G.; Zhu, B.; Xie, L.; Hu, Y.; Huang, J. Evaluating the impact of carbon emissions trading scheme on Chinese firms’ total factor productivity. J. Clean. Prod. 2021, 306, 127104. [Google Scholar] [CrossRef]
  22. Lv, M.; Bai, M. Evaluation of China’s carbon emission trading policy from corporate innovation. Financ. Res. Lett. 2021, 39, 101565. [Google Scholar] [CrossRef]
  23. Liu, Y.; Liu, S.; Shao, X.; He, Y. Policy spillover effect and action mechanism for environmental rights trading on green innovation: Evidence from China’s carbon emissions trading policy. Renew. Sustain. Energy Rev. 2022, 153, 111779. [Google Scholar] [CrossRef]
  24. Huang, Z.; Du, X. Toward green development? Impact of the carbon emissions trading system on local governments’ land supply in energy-intensive industries in China. Sci. Total Environ. 2020, 738, 139769. [Google Scholar] [CrossRef]
  25. Chen, X.; Lin, B. Towards carbon neutrality by implementing carbon emissions trading scheme: Policy evaluation in China. Energy Pol. 2021, 157, 112510. [Google Scholar] [CrossRef]
  26. Jaciow, M.; Rudawska, E.; Sagan, A.; Tkaczyk, J.; Wolny, R. The Influence of Environmental Awareness on Responsible Energy Consumption—The Case of Households. Pol. Energ. 2022, 15, 5339. [Google Scholar] [CrossRef]
  27. Wan, X.; Jahanger, A.; Usman, M.; Radulescu, M.; Balsalobre-Lorente, D.; Yu, Y. Exploring the effects of economic complexity and the transition to a clean energy pattern on ecological footprint from the Indian perspective. Front. Environ. Sci. 2022, 736, 816519. [Google Scholar] [CrossRef]
  28. Gao, Y.; Li, M.; Xue, J.; Liu, Y. Evaluation of effectiveness of China’s carbon emissions trading scheme in carbon mitigation. Energy Econ. 2020, 90, 104872. [Google Scholar] [CrossRef]
  29. De Marchi, V.; Di Maria, E.; Ponte, S. The greening of global value chains: Insights from the furniture industry. Comp. Chang. 2013, 17, 299–318. [Google Scholar] [CrossRef] [Green Version]
  30. Wang, W.; Xie, P.; Li, C.; Luo, Z.; Zhao, D. The key elements analysis from the mitigation effectiveness assessment of Chinese pilots carbon emission trading system. China Popul. Resour. Environ. 2018, 28, 26–34. [Google Scholar]
  31. Zhang, Z. Carbon emissions trading in China: The evolution from pilots to a nationwide scheme. Clim. Policy 2015, 15, S104–S126. [Google Scholar] [CrossRef] [Green Version]
  32. Shahid, R.; Shijie, L.; Yifan, N.; Jian, G. Pathway to Green Growth: A Panel-ARDL Model of Environmental Upgrading, Environmental Regulations, and GVC Participation for Chinese Manufacturing Industry. Front. Environ. Sci. 2022. [Google Scholar] [CrossRef]
  33. Jahanger, A.; Usman, M.; Balsalobre-Lorente, D. Linking institutional quality to environmental sustainability. Sustain. Dev. 2022, 240, 118245. [Google Scholar] [CrossRef]
  34. Zheng, J.; Shao, X.; Liu, W.; Kong, J.; Zuo, G. The impact of the pilot program on industrial structure upgrading in low-carbon cities. J. Clean. Prod. 2021, 290, 125868. [Google Scholar] [CrossRef]
  35. Hu, J.; Pan, X.; Huang, Q. Quantity or quality? The impacts of environmental regulation on firms’ innovation–Quasi-natural experiment based on China’s carbon emissions trading pilot. Technol. Forecast. Soc. Chang. 2020, 158, 120122. [Google Scholar] [CrossRef]
  36. Thomas, M.D. Growth pole theory, technological change, and regional economic growth. Pap. Reg. Sci. Assoc. 1975, 34, 3–25. [Google Scholar] [CrossRef]
  37. Grossman, G.M.; Krueger, A.B. Environmental Impacts of a North American Free Trade Agreement; MIT Press: Cambridge, MA, USA, 1991. [Google Scholar] [CrossRef]
  38. Jahanger, A.; Yu, Y.; Awan, A.; Chishti, M.Z.; Radulescu, M.; Balsalobre-Lorente, D. The Impact of Hydropower Energy in Malaysia Under the EKC Hypothesis: Evidence from Quantile ARDL Approach. SAGE Open 2022, 12, 21582440221109580. [Google Scholar] [CrossRef]
  39. Jahanger, A. Influence of FDI characteristics on high-quality development of China’s economy. Environ. Sci. Poll. Res. 2021, 28, 18977–18988. [Google Scholar] [CrossRef] [PubMed]
  40. Yang, B.; Usman, M. Do industrialization, economic growth and globalization processes influence the ecological footprint and healthcare expenditures? Fresh insights based on the STIRPAT model for countries with the highest healthcare expenditures. Sustain. Prod. Consump. 2021, 28, 893–910. [Google Scholar] [CrossRef]
  41. Wang, D.T.; Chen, W.Y. Foreign direct investment, institutional development, and environmental externalities: Evidence from China. J. Environ. Manag. 2014, 135, 81–90. [Google Scholar] [CrossRef] [Green Version]
  42. Sharma, S.S. Determinants of carbon dioxide emissions: Empirical evidence from 69 countries. Appl. Energ. 2011, 88, 376–382. [Google Scholar] [CrossRef]
  43. Dendir, S.; Orlov, A.G.; Roufagalas, J. Do economics courses improve students’ analytical skills? A Difference-in-Difference estimation. J. Econ. Behav. Organ. 2019, 165, 1–20. [Google Scholar] [CrossRef]
  44. Yang, L.; Li, Y.; Liu, H. Did carbon trade improve green production performance? Evidence from China. Energy Econ. 2021, 96, 105185. [Google Scholar] [CrossRef]
  45. Wen, F.; Zhao, L.; He, S.; Yang, G. Asymmetric relationship between carbon emission trading market and stock market: Evidences from China. Energy Econ. 2020, 91, 104850. [Google Scholar] [CrossRef]
  46. Yu, D.J.; Li, J. Evaluating the employment effect of China’s carbon emission trading policy: Based on the perspective of spatial spillover. J. Clean. Prod. 2021, 292, 126052. [Google Scholar] [CrossRef]
  47. Zhang, Y.J.; Liang, T.; Jin, Y.L.; Shen, B. The impact of carbon trading on economic output and carbon emissions reduction in China’s industrial sectors. Appl. Energy 2020, 260, 114290. [Google Scholar] [CrossRef]
  48. Cong, R.G.; Wei, Y.M. Potential impact of (CET) carbon emissions trading on China’s power sector: A perspective from different allowance allocation options. Energy 2010, 35, 3921–3931. [Google Scholar] [CrossRef]
  49. Jahanger, A.; Usman, M.; Murshed, M.; Mahmood, H.; Balsalobre-Lorente, D. The linkages between natural resources, human capital, globalization, economic growth, financial development, and ecological footprint: The moderating role of technological innovations. Res. Pol. 2022, 76, 102569. [Google Scholar] [CrossRef]
Figure 1. Carbon Emissions and Economic Growth Trends of China.
Energies 15 06065 g001
Figure 2. Spatial distribution of pilot regions for China’s emission trading policy.
Energies 15 06065 g002
Figure 3. Volumes of carbon emission quota trading in pilot zones (2013–2019).
Energies 15 06065 g003
Figure 4. Theoretical Framework.
Energies 15 06065 g004
Figure 5. Parallel trend results of carbon emissions.
Energies 15 06065 g005
Figure 6. Placebo test density plots ((A): kernel density estimated coefficients, (B): T-values of kernel density estimates).
Energies 15 06065 g006
Table 1. Variables used in the DID model and their descriptive statistics.
Variable NameDescriptionDescriptive Statistics
Overall SamplePilot CETP Regions Non-Pilot CETP Regions
MeanSDMinMaxMeanSDMeanSD
lnCENatural log of carbon emissions0.550.530.211.250.510.460.620.55
lnGDP_PNatural log of per capita GDP1.771.711.122.331.771.661.761.72
lnFDINatural log of foreign direct investment2.432.30.176.293.122.592.181.96
lnPNatural log of population3.653.432.754.043.423.283.843.59
lnISNatural log of industrial scale0.830.710.081.460.830.810.820.69
Table 2. Comparative analysis of variables’ mean values.
VariableMean Value in Pre-Policy Time PeriodMean Value in Post-Policy Time Period
Experimental Group (Pilot CETP Regions)Control Group (Non-Pilot CETP Regions)Experimental Group (Pilot CETP Regions)Control Group (Non-Pilot CETP Regions)
lnCE0.590.570.460.64
lnGDP_P1.431.721.911.81
lnFDI2.891.583.312.32
lnP3.393.793.433.81
lnIS0.760.740.850.91
Author’s own calculation.
Table 3. Impact of CETP on carbon emissions.
VariablePooled OLS ModelLSDV Model
(1)(2)(3)(4)
post-policy−0.203 ***
(0.031)
−0.211 ***
(0.031)
−0.203 ***
(0.036)
−0.211 **
(0.052)
CETP−0.163 ***
(0.038)
−0.176 ***
(0.039)
−0.163 ***
(0.041)
−0.176 ***
(0.042)
CETP × post-policy−0.121 ***
(0.026)
−0.136 ***
(0.018)
−0.121 ***
(0.034)
−0.136 ***
(0.024)
Control variablesNoYesNoYes
lnGDP_P-0.031 **
(0.072)
-0.031 **
(0.061)
lnFDI-−0.421 **
(0.051)
-−0.421 **
(0.067)
lnP-0.002
(0.137)
-0.002
(0.128)
lnIS-0.114 **
(0.048)
-0.114 **
(0.039)
Regional fixed effectsYesYesYesYes
Time fixed effectsYesYesYesYes
Note: The dependent variable is lnCE. “post-policy” is a dummy variable indicating that the lnCE was taken as a post-CETP. “CETP” is a dummy variable indicating that the region has implemented CETP. For all regressions, standard errors are reported in parenthesis. Moreover, N = 330, and *** and ** represent statistical significance at 1% and 5% level respectively.
Table 4. Results of Granger causality and parallel trend analysis.
Diagnostic TestNull HypothesisF-StatInterpretationConclusion
(1) Granger causality test 0.39
(0.8721)
No behavior changes prior to treatmentWe do not have reasons to distrust the validity of the obtained DID estimates
(2) Parallel trend testLinear trends are parallelF = 0.71
(0.2958)
No effect in anticipation of treatment
Note: p-values are reported in parenthesis.
Table 5. Results of DID analysis using a longer sample period.
VariableRobustness Results with a Longer Sample Period (N = 360)
Pooled OLS ModelLSDV Model
post-policy−0.182 ***
(0.029)
−0.182 ***
(0.031)
CETP−0.121 ***
(0.048)
−0.121 ***
(0.036)
CETP × post-policy−0.161 ***
(0.0232)
−0.161 ***
(0.0392)
Control variablesYesYes
Regional fixed effectsYesYes
Time fixed effectsYesYes
Note. The dependent variable is lnCE. “post-policy” is a dummy variable indicating that the lnCE was taken as a post-CETP. “CETP” is a dummy variable indicating that the region has implemented CETP. For all regressions, standard errors are reported in parenthesis. Moreover, *** represent statistical significance at 1% level.
Publisher’s Note: MDPI stays neutral with regard to jurisdictional claims in published maps and institutional affiliations.

