Review

Small-Scale Combined Heat and Power Systems: The Prospects for a Distributed Micro-Generator in the ‘Net-Zero’ Transition within the UK

by
Geoffrey P. Hammond
1,2,* and
Adam A. Titley
1
1
Department of Mechanical Engineering, University of Bath, Bath BA2 7AY, UK
2
Institute for Sustainable Energy and the Environment (I•SEE), University of Bath, Bath BA2 7AY, UK
*
Author to whom correspondence should be addressed.
Energies 2022, 15(16), 6049; https://doi.org/10.3390/en15166049
Submission received: 18 May 2022 / Revised: 30 June 2022 / Accepted: 18 August 2022 / Published: 20 August 2022

Abstract

:
Small-scale combined heat and power (micro-CHP or mCHP) plants generate heat in the process of localised electricity production that can usefully be captured and employed for domestic space and water heating. Studies of the relative merits of three alternative network-connected mCHP plants are reviewed based respectively on an Internal Combustion engine (ICE), a Stirling engine (SE), and a Fuel Cell (FC). Each plant will, in most cases, result in lower carbon dioxide (CO2) emissions, relative to those from the most efficient condensing boilers. In addition, they lead to operational cost savings for the consumer, depending on house type. However, their capital costs are presently more expensive than a conventional boiler, with the FC being prohibitively so. The ICE and SE variants display the greatest economic and environmental benefit. Nevertheless, the performance and costs associated with these innovative technologies have rapidly improved over the last decade or so. Comparisons are also made with heat pumps that are seen as a major low-carbon competitor by the United Kingdom (UK) Government. Finally, the potential role of micro-CHP as part of a cluster of different micro-generators attached to contrasting dwellings is considered. The review places mCHP systems in the context of the UK transition pathway to net-zero CO2 emissions by 2050, whilst meeting residential energy demand. However, the lessons learned are applicable to many industrialised countries.

Graphical Abstract

1. Introduction

1.1. Background

Energy sources of various kinds are used to heat and power human development, but also put at risk the quality and longer-term viability of the biosphere as a result of unwanted, ‘second order’ effects [1]. Arguably the principle environmental side-effect of energy supply is the prospect of global warming due to an enhanced ‘greenhouse effect’ induced by combustion-generated pollutants [1,2,3]. The most recent (2021) scientific assessment by the Intergovernmental Panel on Climate Change (IPCC) [4] states with ‘high confidence’ that observed increases in well-mixed ‘greenhouse gas’ (GHG) concentrations in the atmosphere since 1750 have been “unequivocally caused by human activities”. They argue that such GHG emissions trap long-wave thermal radiation from the Earth’s surface in the atmosphere (not strictly a ‘greenhouse’ phenomena [5]), and that these are the main cause of rises in climatic temperatures, i.e., global heating or warming. Carbon dioxide (CO2; the main GHG) is thought to have a ‘residence time’ in the atmosphere of 50–200 years; with 20–60% remaining airborne for a thousand years or longer [6]. CO2 accounts for some 80% of the total GHG emitted by the United Kingdom of Great Britain and Northern Ireland (UK), and the energy sector is responsible for around 95% of these [1]. In 2019, global atmospheric CO2 concentrations reached 410 parts per million (ppm) [4]; a rise from around 330 ppm in 1975 [6]. The 2015 Paris Agreement on climate change [7,8,9,10] aimed to keep temperatures “well below 2 °C above pre-industrial levels and to pursue efforts to limit the temperature increase to 1.5 °C above pre-industrial levels”. Otherwise, climate modellers believe that humanity will be subject to a greater frequency of extreme weather events [4,9]: life-threatening heatwaves and forest fires, more intense storms, devastating floods, and serious droughts. In addition, other looming threats include sea level rise due to melting ice sheets and glaciers, ocean acidification caused by carbon dioxide (CO2) absorption, and food shortages due to desertification [9]. Alongside such negative environmental ‘side-effects’ of heat and power generation there are growing concerns about the security of energy supplies into the European Union (EU-27) and, in the present context, the UK [10]. Britain became a net importer of fossil fuels in the 2003 [11], with the import dependency growing from then onwards. UK Government energy policy has therefore principally been aimed at cutting GHG emissions in order to reach ‘net-zero’ levels (i.e., ‘carbon neutrality’) by 2050 [12,13], and maintaining secure, diverse supplies of energy [13]. This implies major changes in the way in which energy is sourced, generated, and consumed in the UK over the coming three decades.
The history of electricity generation since the time of Edison has been based around the concept of employing large, centralised power stations (see, for example, Buchanan [14], Hammond [1] and Hughes [15]). Current heat and electricity supply systems in the UK are therefore highly centralised, and rely significantly on the combustion of fossil fuels that give rise to GHGs. The UK energy supply sector (both electricity and heat production) is responsible for about 83 million metric tonnes of carbon dioxide equivalent (MtC02e) or 21% of net CO2e emissions in 2020 (updated from Allen et al. [16]). The bulk of electricity in Britain since the 1950s was generated by large thermal power plants that are connected to a high-voltage transmission network, and is then distributed to end-users via regional low-voltage distribution networks. This centralised model has delivered economies of scale and reliability [11,16], but there are significant drawbacks. It suffers, for example, from overall energy system losses of about 65% in terms of primary energy input [1,3,16,17]. These losses predominantly result from heat wasted during electricity production (58%), but there are smaller losses rising in transmission and distribution—approximately 1.5% and 5% respectively [16,18]. The use of micro-generation and other decentralised or distributed technologies has the potential to reduce such losses. It has been estimated that micro-generation could provide 30–40% of the country’s electricity needs by 2050 [16,18].
The future generation and distribution of electricity is likely to evolve in different ways with ‘low and zero carbon’ (LZC) energy technologies becoming rather more widespread, leading to a network that might embrace a degree of ‘distributed generation’. Electricity generation in the UK was resourced from some 36% natural gas, 43% RET {wind turbines (24%), solar photovoltaic cells, hydropower and bioenergy}, 16% nuclear power, and 2% coal in 2020, the most recent full year data available at the time of writing in the annual Digest of United Kingdom Energy Statistics (DUKES) [19]. Consequently, the UK Electricity Supply Industry (ESI) is still nearly 38% dependent on primary fossil fuels, i.e., natural gas and coal. Much of the electricity grid was constructed in the 1950s and 1960s [11]. It is therefore heavily reinforced in former coal-mining areas, and is nearing the end of its design life. It restricts the power flow from Scotland to England (2.2 GWe), and via the interconnectors (in the form of high-voltage undersea cables) to France, Northern Ireland, and the Netherlands. The grid will therefore require not only renewal, but also reconfiguration of both hardware and software in order to accommodate the introduction of greater levels of distributed generation in the future within the home or on a community-scale [11]. Heat and electricity can be produced locally via LZC energy technologies [16]. A schematic representation of a hypothetical distributed generation network is shown in Figure 1 [11]. Allen et al. [16] argued that, while domestic micro-generation has the potential to contribute favourably to energy supply, there remain substantial barriers to a large rise in its use in the UK.

1.2. The Issues Considered

The ‘domestic’ or residential sector in the UK consists of some 27.5 million households that account for approximately one-third of the UK’s delivered energy use and CO2 emissions [3,11,16,17,18,20]. The use of micro-generators and other decentralised (or distributed) energy technologies [17,20,21] therefore has the potential to reduce the generation, transmission and distribution losses associated with the centralised model of electricity supply [11,15]. When fossil fuels are used, for example in small-scale combined heat and power (micro-CHP or mCHP) plants [18,22,23,24,25,26,27,28,29,30], the heat generated in the process of localised electricity production can be usefully captured and employed for space and water heating. Heat or electricity can alternatively be produced locally via heat pumps [23,24,25,26,29,31] and various renewable energy sources, such as solar thermal water heaters [21,32], solar photovoltaic (PV) systems [20,33], and micro-wind turbines [20,34]. ‘Distributed generation’ (DG) is site-specific in relation to both energy resources and energy demand. It refers to energy supply close to the point of use by way of ‘low and zero carbon’ (LZC) technologies, including micro-generators. They can be in a range of generator sizes; from community or district-level down to individual households. Typically, they represent anything below 50–100 kW, with most household electricity-supply installations being below 3 kWe; slightly larger for heat-supply [16,17,18,23].
Traditionally, the buying and selling of electricity was a one-way process, from suppliers and consumers [21]. The only buyers that could make a choice of supplier tended to be very large customers, such as industrial companies. Since 1999 buyers in the UK have been free to choose their supplier as the market has been opened up or ‘liberalised’ [21]. A more distributed generation network implies a two-way process: consumers with micro-generators also become producers [11], or so-called ‘prosumers’ [35]. This will pose many technical issues for a network not originally designed for decentralised supply [22,23]. But micro-generation has yet to have a significant impact on the UK energy system [11,16], although there has been a rapid rise in solar PV systems over the last decade that now stands over one million installations [21], or 545 MW capacity [19]. Roof-top solar alone accounts for about 4% of UK electricity supply.
Very small ‘combined heat and power’ (CHP) systems are one class of micro-generator that can supply heat and power to a single residential home at significantly increased efficiency and reduced CO2 emissions compared with separate supply [36]. Such systems are known as micro-CHP or domestic-CHP (DCHP) in the United Kingdom, and are used to replace central heating boilers typically installed in houses: see Figure 2. The relative merits of three alternative network-connected mCHP plants were evaluated by Hammond and Titley [18]; based respectively on an Internal Combustion engine (ICE), a Stirling engine (SE), and a Fuel Cell (FC). Each generates electricity and heat in different proportions. They are therefore be suited to various types of housing, and load profiles. A natural gas (NG)-fired IC engine-based system typically produces about 1 kW of electricity and 3 kW of heat (roughly the same size as a domestic boiler) at a capital cost of around £1750 [16,18]. {£1 (GBP) ≈ 1.198 € (EUR) ≈ $1.359 (USD) at the beginning of 2022.} SE-based systems typically produce 1 kW of electricity and 6 kW of heat, at an initial cost of some £2750 [16,18]. (Stamford et al. [27] noted that such systems only started to be commercially available in about 2009, and that very few such plants have been deployed in the UK during the following decade. The capital cost should therefore be viewed as highly uncertain in the present context.) FC-based systems tend to be of a large size at their present state of development. They are very bulky and have estimated capital costs of between £10,000 and £15,000 for generating up to 35 kW of electricity [18]. Although such systems are costly, the technology is likely to improve to become a more realistic medium-term option.
Each of the mCHP systems varies in terms of their power generation efficiencies (i.e., energy and exergy efficiencies [1,17,37]). The system requirements for mCHP associated with UK housing stock, energy demand, and their technological status are identified in Section 2. Then, the current UK energy policy framework for the UK building sector in the context of the net-zero transitions outlined in Section 3. All the mCHP plants studied by Hammond and Titley [18] employed natural gas as the fuel input. They have been evaluated on a ‘whole systems’ basis. Thus, energy, environmental and financial evaluation techniques [18,21,32,33,38,39,40] are described in Section 4 (Methods and Materials), and then applied to various mCHP plants in Section 5 (‘Full Fuel Cycle’ Analysis of Micro-CHP Systems). Such appraisal can be viewed as being ‘integrated’ in the sense that they are interconnected but yield differing perspectives within a ‘sustainability framework’ [21,38,39]. It helps to provide a performance ‘snapshot’ in time, based on quantitative evaluations. The present contribution is part of an ongoing research effort aimed at evaluating and optimising the performance of various sustainable energy systems [11,16,17,21] in the context of transition pathways to a low carbon or net-zero GHG emissions future for the UK [13,41,42]. The performance and costs of rapidly changing innovations, like micro-generators, have been fast changing in the UK market over the last decade or so. Thus, the findings are said to be ‘indicative’ in the sense of being a simplified evaluation and illustration of the performance of the mCHP plants in the light of imperfect information [21]. Nevertheless, such assessments provide a valuable evidence base for developers, policy makers, and other stakeholders across the developed world. The remainder of the paper is structured as follows: Section 6 presents a discussion of the Competition between Heat Pumps and Micro-CHP Plants, including their global micro-generation market position, and the comparative performance of the two micro-generators (based on the work of Cooper et al. [24,25,26]). Section 7 considers the implications of clustering various micro-generators in a residential setting (based on the recent research findings of Allen et al. [21]), whilst the review closes with Concluding Remarks in Section 8.

2. Micro-CHP System Requirements

2.1. The UK Housing Stock

The UK building stock is estimated to consist of some 27.5 million domestic buildings (updated from Brown et al. [3] and Allen et al. [21]). The main parameter that determines the increase in domestic energy use is the rise in the number of dwellings. Population in the UK has risen only slowly over the last few decades [1,20]. The number of households has increased at a similar rate to that in energy use; suggesting that it is the main factor contributing to the rise in domestic energy use over the period between 1970 and 2000 [21]. Thereafter, higher thermal insulation standards prevailed in new dwellings.
The UK domestic sector can be divided into three main categories [3,20], in terms of the energy demands of the dwellings:
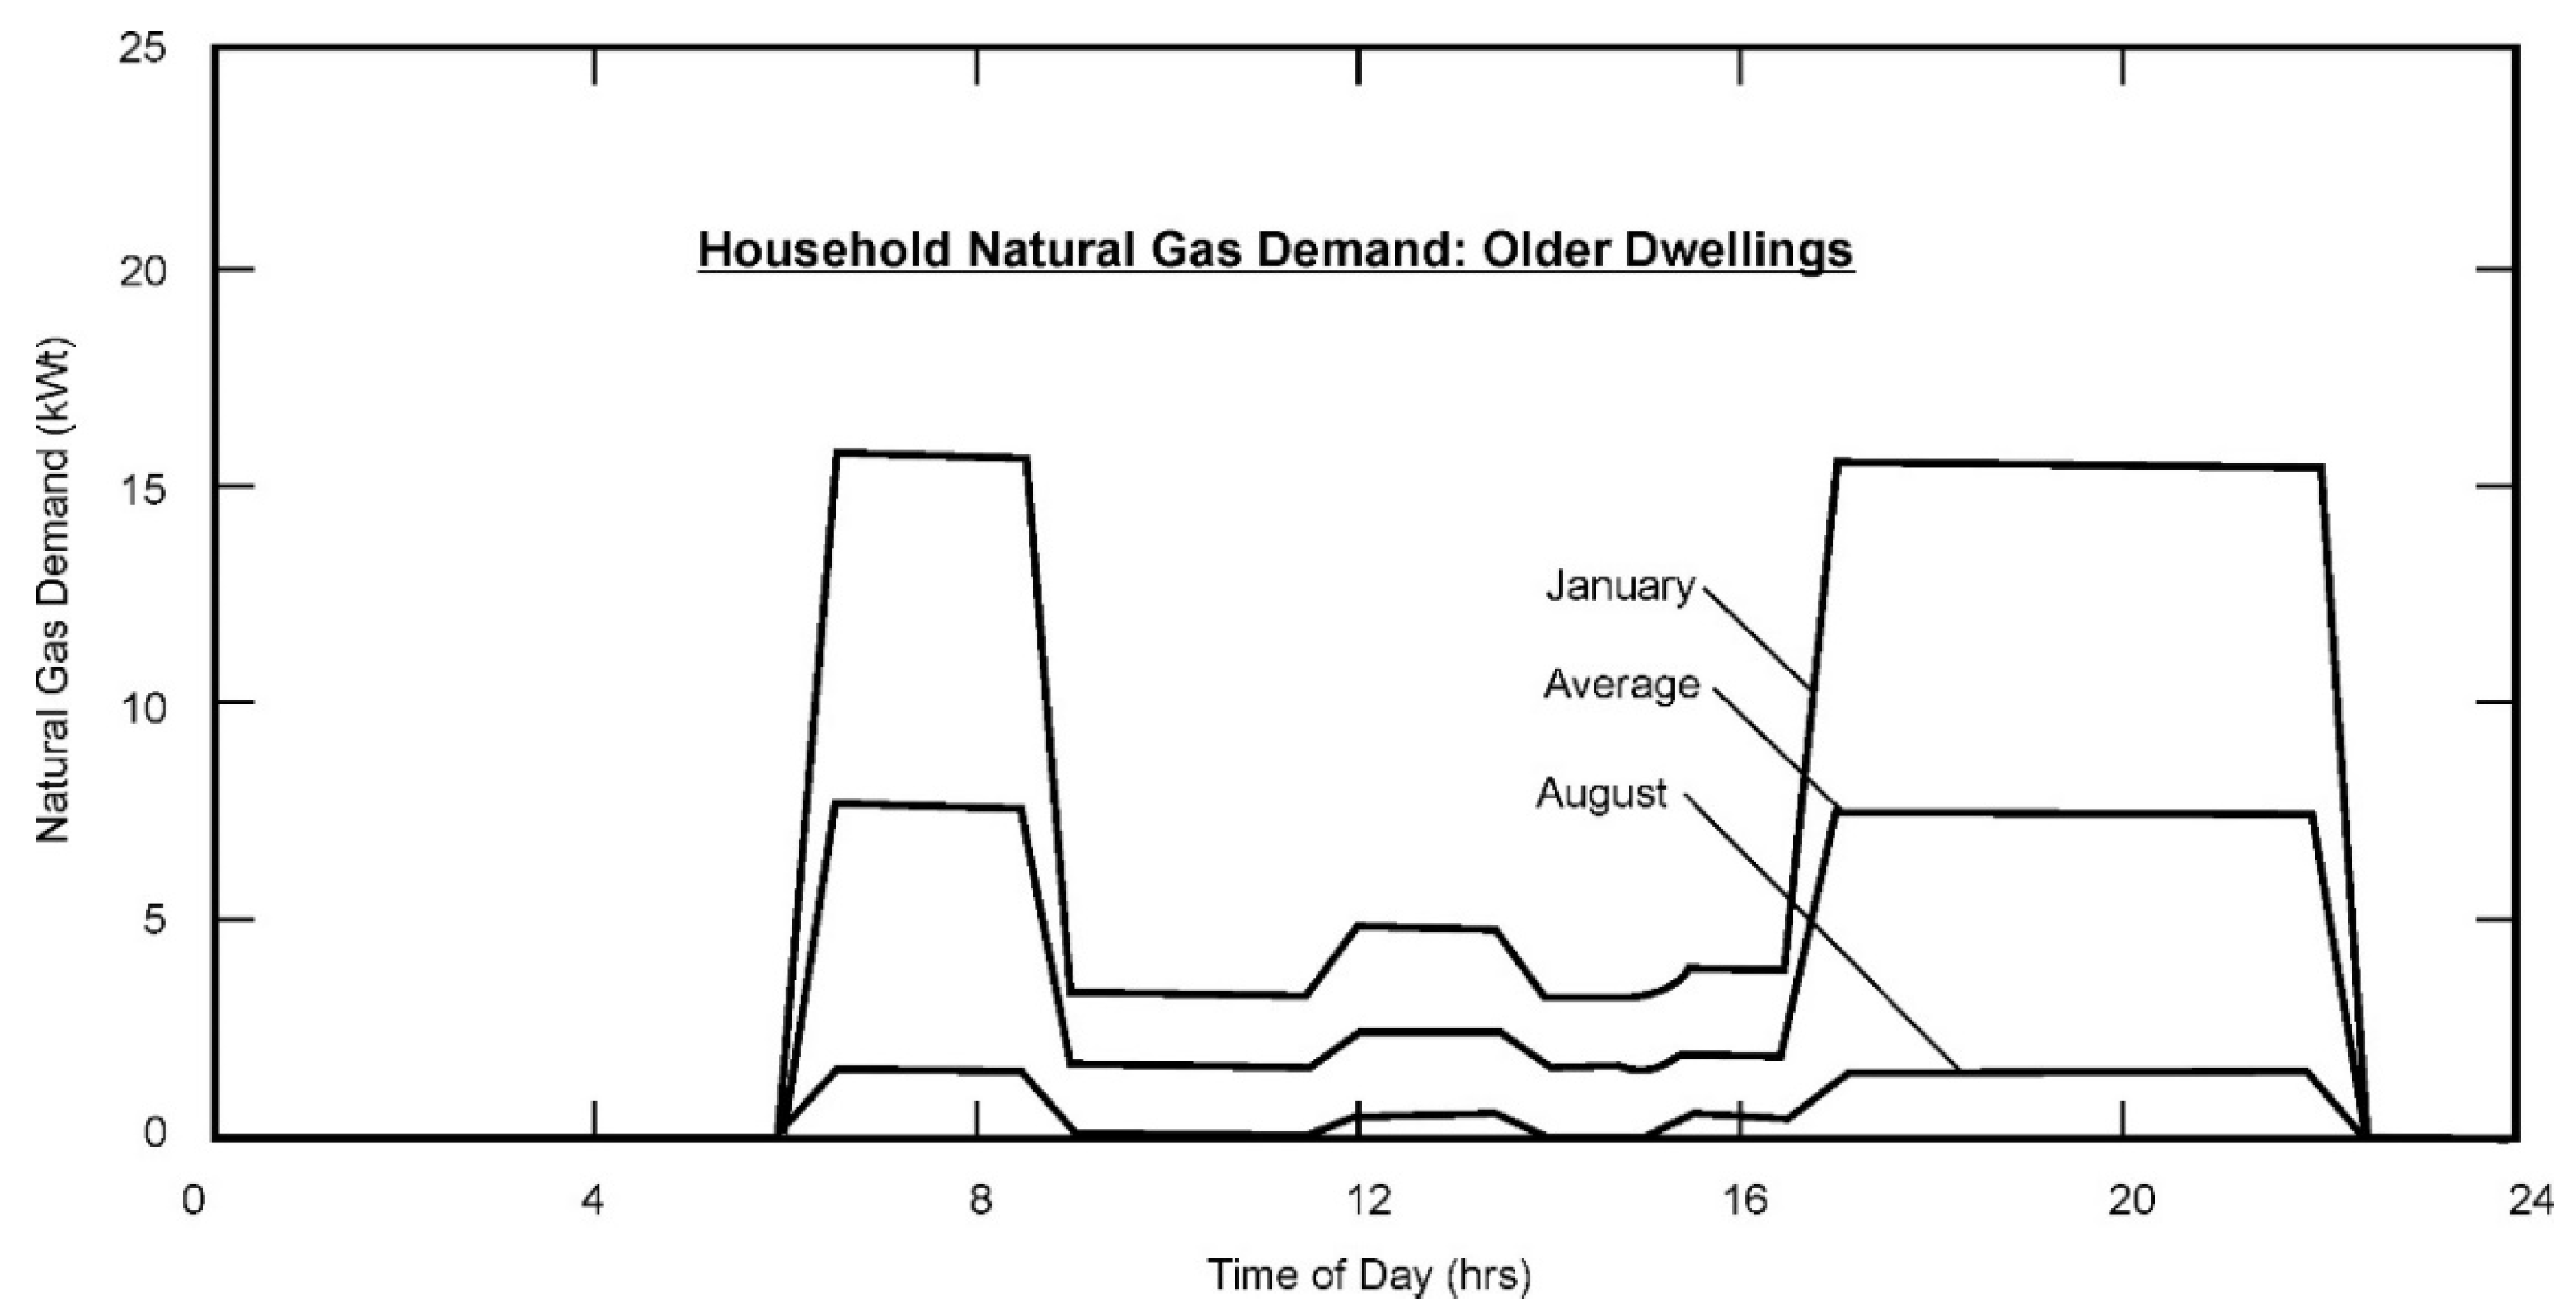
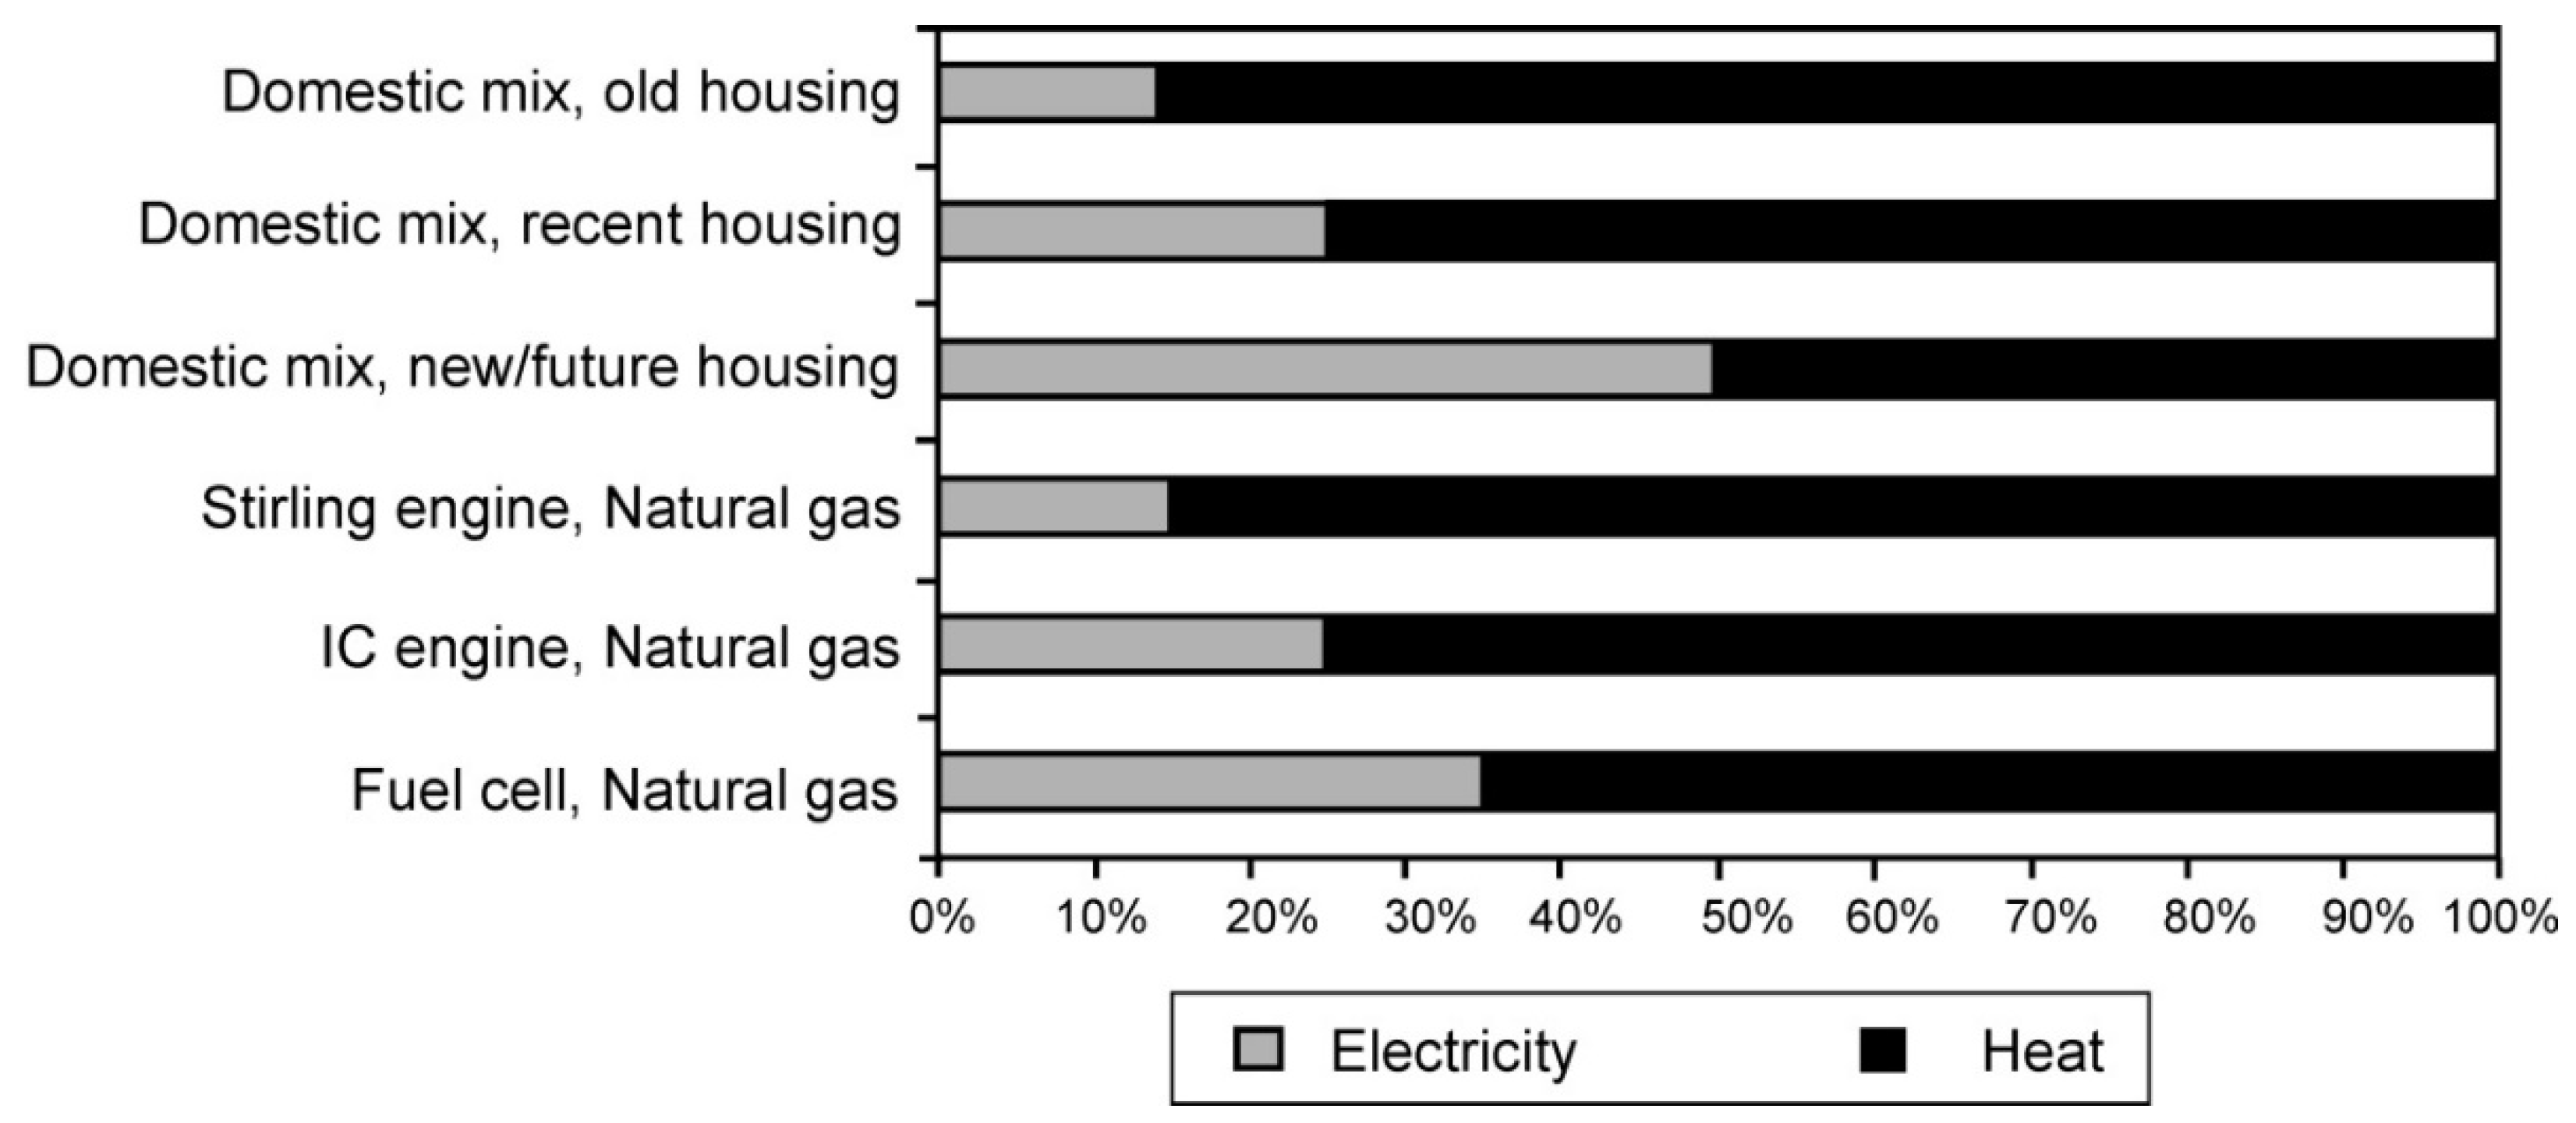
  • Old. These mainly consist of ‘Victorian’ (i.e., late 19th Century) through to pre-World War II housing, particularly and many houses built before the 1970s. This housing is usually single-glazed and poorly insulated. Often draughty with poorly fitting doors and windows. Approximately 19 million houses in the UK fit into this category. According to Hitchin [43] these ‘old houses’ require about 15% of their total energy in the form of electricity, the remaining 85% as heat.
  • Recent. Housing largely built from the mid-1970s, well-built and maintained houses from previous eras, mostly with double-glazed, well-fitted ‘unplasticised polyvinyl chloride’ (uPVC) doors and windows, cavity wall insulation and good roof insulation. Around 3.5 million UK houses fit this category. ‘Recently constructed houses’ require about 25% electricity, 75% heat [43].
  • New and near-future. Housing built from mid-1990s, well designed and constructed, with energy conservation strongly in mind. Layout, materials and structure selected to maximise space heat retention, and featuring low-emissivity double (or even triple) glazing. High thermal insulation levels. This type of housing will form the basis of all new housing in the near future [20,44]. Much of the recent housing stock willalso be brought up to this standard. About 5 million new-build houses fit into this category. ‘New and near-future houses’ require about 50% each of heat and power [43].
For simplicity, it has been assumed here that all UK housing falls into one of the three categories outlined above [3,18,20]. In reality, a detailed assessment would have to be made of each house to assess its specific energy requirements. Home insulation is critical for the sizing of a micro-CHP system in order to determine the proportion of heat to power. Assuming that the home has no electric heating (i.e., no electric space heaters or immersion water heaters), then a house will always consume about the same amount of electricity for so-called ‘white goods’ or domestic appliances [21], no matter how well it is thermally insulated. However, the higher the insulation level or standard of a dwelling, the less space heating will be required.

2.2. Energy Demand in the Home

Energy end-uses in the domestic sector can be usefully subdivided into four categories: space heating, water heating, cooking, and lighting and appliances [17,21]. Fuel switching from coal to natural gas (NG) in the UK domestic sector has occurred on quite a large scale since 1965 [1]. Improvements in heater efficiency and in thermal insulation standards have both held down energy consumption when compared to a ‘business-as-usual’ scenario [1,18]. The upward trend in the use of domestic appliances has had only a moderate impact on final demand, which is dominated by space and water heating [17,21]. In any case it is often argued that saturation effects in the ownership of white goods will inevitably take place in the near future [1,3,18]. However, the greater use of ‘information and communications technology’ (ICT) equipment for homeworking and leisure activities (laptop computers, video game consoles, and the like) may counter this trend to some extent. Brown et al. [3] observed that the changes introduced in the 2010 UK Building Regulations were only likely to lead to reductions in energy use and carbon emissions of up to 17% by 2050 compared to a 1990 baseline. Nevertheless, it appears feasible to reduce CO2 emissions associated with current energy use in the UK domestic building stock by more than 65% in the period out to 2050. This would require a significant take-up of energy-efficient boilers, lighting, and appliances, as well as the adoption of higher thermal insulation standards and ‘low and zero carbon’ (LZC) energy technologies, such as micro-generators [3,18,21]. Boardman [44] and Brown et al. [3] both found, for example, that this CO2 reduction could be achieved without any degradation of the quality of life, provided that urgent action is taken in the short-term. This includes legislation for the efficiency of lights, appliances and boilers, incentives for the installation of solar PV cells, solar water heating, heat pumps and insulation measures. There would also need to be an acceleration in the replacement of old inefficient buildings with new highly efficient homes.
NG has become the dominant energy carrier supplied to the residential sector, followed by electricity [16]. Gas is the main provider of space and water heating [16,20], accounting for around 82% of the energy inputs used for these purposes. While cooking isprovided by both gas and electricity, lighting and appliances are powered exclusively by electricity (the only energy carrier to be used in all four end-use categories). Electricity is a very different energy carrier to the fossil fuels that provide the majority of the residential sector’s space and water heating. Like these fuels, electricity can be used to supply low-quality heating, but it can also conveniently provide a wide array of other energy services [17,18,20,37], including refrigeration, illumination, communication, and entertainment. Allen and Hammond [17] provided an estimated breakdown of how electricity has been used in the residential sector on the basis of a variety of sources. They indicate that domestic sector electricity consumption has grown by approximately 50% since 1970, and that this increase has been driven by a growing array of appliances, including consumer electronics and ICT in recent years. The typical winter electricity load profile throughout the day is shown in Figure 3 [18], based on measured data [collated by the former Electricity Association]. It shows the demand profile on a winter weekday, which is where micro-CHP systems are likely to be employed, as a function of household size (the number of occupants). During a weekend, the demand is more constant between 8am and midnight, with smaller peaks. Clearly, houses that lay empty during the day will have a significantly lower demand between 8am and 6pm (or 18.00 h), whereas those that are occupied all day will have flatter demand.
Demand for heat throughout the day is not as easy to establish, as the supply is not as precisely linked to demand, but can be estimated. The gas demand profile for an average house has been estimated using ESP-r—the rigorous and respected building environmental simulation software tool [18,21] (originally developed by Clarke [45])—and displayed in Figure 4. Gas is, of course, used for other purposes than space and water heating, and not all heating requirements are met by gas. However, Hammond and Titley [18] assumed that the gas demand approximately represents heat demand. The data collected to prepare load profile was from older (pre-1970) dwellings. The shape of this idealised graph reflects reasonably well the measured data obtained by Thomson and Infield [46] for 350 modern dwellings, although the peak demands were obviously reduced. Heating demand profiles will approximately follow the same pattern during colder part of the year (see the simulation in Figure 4 and the data of Thomson and Infield [46]).
Energy supply infrastructure for the vast majority of British homes consists of a NG pipeline and electricity from the national grid. Micro-CHP systems must therefore either be completely compatible with the existing infrastructure, or justify the expense and effort of an infrastructure investment, e.g., hydrogen or liquified petroleum gas (LPG) supply to the home. If the mCHP system is to be installed into a dwelling without a NG supply, then it must be run from whatever is the long-term fuel that is locally available. Heating oil or biomass are the most typical alternatives in the UK, particularly in remote locations, such as rural communities. LPG is available to many rural dwellings, where it is oftenused for cooking, but not heating. Petroleum and diesel are also available and widely used for agricultural purposes.

2.3. Micro-CHP Technological Status

Combined heat and power plant utilise the heat produced during electricity production, and can operate at significantly higher efficiencies than traditional thermal power plants [37]. Suitable prime movers for micro-CHP systems include Internal Combustion engines (ICEs), Stirling engines (SEs) and Fuel Cell (FC)-driven devices [22,23,24,25,26,27,28]; all of which have varying heat to electricity generating ratios. ICEs generate noise and vibrations, making them generally unsuitable for domestic application [18,47]. (Cheekatamarla and Abu-Heiba [28] provide a comprehensive recent review of the energy models adopted for the analysis of ICE-based mCHP systems.) SEs have a higher heat to power ratios than FCs [27], and are therefore more applicable to larger dwellings with higher heat loads in order to concurrently satisfy electricity demand [18]. FC-driven devices, on the other hand, are currently more suited to smaller dwellings with lower than average heating demands [16,18,23]. There are only about 990 mCHP units installed in the UK, according to Allen et al. [16] (based on 2006 figures). Current Stirling engine technology is available in sizes appropriate to domestic applications (1 kWe, 7–12 kWt) at costs of approximately £3000 installed [16,18,23]. Some simple modelling [16] led Hammond and Titley [18] to estimates that for heat demands of 15,000–18,000 kWh per year (small to average heat demand), around 2500 kWh of electricity would be concurrently generated, facilitating financial paybacks of 3–5 years. Larger-sized ICE-based, so-called mini-CHP, systems are available in Europe at a cost of £10,000–14,000 [23], or around £2000–2800/kWe. FC-driven micro-CHP plants are the most expensive devices presently available. Staffell et al. [23] estimated that it would take some ten years of deployment and cost reduction activities for them to fall to an unsubsidised price of £5000/kWe.
A field trial sponsored by the Carbon Trust [48] (a UK Government agency initially funded via proceeds from a ‘Climate Change Levy’) has reported poorer than expected efficiencies for ~1 kWe micro-CHP units. This has been the result of the relatively high thermal inertia associated with these units, in combination with intermittent heat demand that drives their operation [23]. A mCHP unit must operate at a fairly high temperature before it can generate electricity. During its warm-up period it will provide some heat, but no electricity. Energy is absorbed while warming up the mass of the unit to its operating temperature, of which little can be usefully recovered. Small-scale CHP for business (up to approximately 25 kWe) has fared better in the trial [48], as the typical operating conditions were steady-state and so warm-up losses were negligible. Modern boilers with a lower thermal mass may therefore be more appropriate than mCHP, especially for domestic use with typically more intermittent heat demands, in terms of energy efficiency and the resulting CO2 emissions [48]. However, the results of this static field trial do not allow for improvements in mCHP performance over time (see Section 1.2 above).

3. Domestic Heating Strategy for the UK Net-Zero Transition to 2050

3.1. The COP26 Context

The UK Government strove to broaden its policy framework in terms of climate change mitigation and adaptation ahead of the 26th United Nations (UN) Climate Change Conference of the Parties (COP26) that it hosted in Glasgow (Scotland) over 1–12 November 2021 [9,49]. This was organised in partnership with Italy, whose Government hosted a pre-COP Summit and related preparatory events (such as a youth conference) in Milan over 30 September–2 October 2021. In this context, the UK Government wished to exhibit leadership and greater ambition ahead of COP26 in order to stimulate the participants (countries and other organisations) to take significant steps to secure their own pathways towards net zero GHG emissions, or so-called ‘carbon neutrality’, by 2050 [9]. Thus, in order to add detail to their policy landscape they issued a ‘Net Zero Strategy’ (NZS) [13] and coupled ‘Heat and Buildings Strategy’ (HBS) [50] on 19 October 2021. Environmental activists regarded this timing as being rather late, given the closeness to the COP26 event, but these developments were nonetheless generally welcomed. This climate summit led to the proclamation of the Glasgow Climate Pact, which indicated both achievements and a number of disappointments [9,49]. Successes included scaling-up clean energy options, a (weak) commitment to phase-down unabated coal power, and ensuring a ‘just transition’ away from coal [9,49]. COP26 also saw an agreement to end, and then reverse deforestation and land degradation by 2030 [9]. Setbacks arose because the world’s most coal-dependent states were unwilling to phase-out coal, while other nations failed to agree to significantly cut methane emissions [9,49]. Likewise, the industrialised countries proved unwilling to come up with public finance to help less developed nations to adapt to the worst impacts of global warming.

3.2. The 2021 UK ‘Heat and Buildings Strategy’

The Heat and Buildings Strategy (HBS) acknowledges that it is critical for the British Government’s drive to net zero GHG emissions by 2050 for the domestic buildings sector to be decarbonised, which would create a huge opportunity in terms of green growth and “new high-skilled jobs, products, markets, and supply chains” [50]. It is based around what is termed a whole-buildings and whole-system approach, although some critics have argued that the strategy is not delivering on this aspiration, because it largely neglects work on energy efficiency in the portfolio of options. The main take-away from the HBS is financial incentives to homeowners to install low-carbon heating systems: heat pumps, hydrogen-ready boilers, and the connection to new community heat networks [50]. A high level of faith is exhibited in heat pumps as what are regarded as a ‘proven technology’ that the UK Government believes would represent a cost-effective and efficient heating system. However, this suggests a possible pitfall in terms of a danger of ‘picking winners’. The HBS incorporates a ‘heat pump first approach’ for properties off the natural gas (NG) grid with a heat pump innovation funding programme (grant funding to prioritise heat pumps), and a manufacturer production mandate [50]. The latter spurs manufacturers of fossil fuelled heating appliances to achieve the sale and installation of heat pumps equal to a proportion of their NG or oil-fired boiler sales within a given period. It seeks to encourage the installation of over 300,000 units a year by 2028 [50]. The HBS ambition is to end the installation of NG boilers by 2035, whether new or replacement. Otherwise, the emphasis of public financial support outlined in the HBS [50] is on low-income households who occupy rented accommodation (so-called ‘social housing’) in order to avoid ‘fuel poverty’. This is defined in the UK as the case where 10% of household income is spent on fuel. Wider policy actions were proposed to rebalance energy levies away from electricity to NG over time in order to encourage the greater use of low-carbon electricity (generated by nuclear or renewable power plants) after 2035.
In general, the HBS was well received by external stakeholders [51], such as the BRE Group (an independent, not-for-profit organisation working on building R&D), Citizens Advice, the Microgeneration Certificate Scheme (MCS) (that issues MCS-certification for solar PV arrays, air source heat pumps (ASHPs), battery stores, and biomass boiler schemes), and regen (a not-for-profit centre of energy expertise and market insight). Organisations in the energy efficiency and carbon reduction field that were set up by previous British governments, like the Energy Savings Trust (now an independent body), also welcomed the publication of the HBS as a significant milestone on the transition pathway towards meeting net zero targets by 2050. They applauded the upgrading of NG boilers to heat pumps and heat networks that could provide the market with confidence in the supply chain. In parallel with the British Government’s development of the HBS, the House of Commons’ BEIS Select Committee took evidence on ‘Decarbonising Heat in Homes’. Their report [51] noted that transitioning households towards low-carbon heating systems would depend on the willingness of occupants to allow changes to their homes. However, the Committee found that awareness of the requirements was limited. They proposed that the UK Government should develop a public awareness campaign in partnership with energy companies. In addition, the Committee argued for the upskilling of the heating workforce relevant to low-carbon heating technologies. Overall, they recommended that the British Government should collaborate with industry, as well as local government, consumer bodies, and affected workers, to devise a roadmap detailing the steps needed to transition to low-carbon residential heating.
Finally, the independent Climate Change Committee (CCC), established under the UK Climate Change Act [12,52], which reports to the UK Parliament on progress made in reducing GHG emissions under successive ‘carbon budgets’, undertook an independent assessment of the HBS that was not published until March 2022 [53]. Its recommendations have often been challenging in policy terms for the UK Government. However, they argued that the HBS was broadly positive, aligning with the NZS and their own recommended carbon budgets. The CCC viewed it as providing a foundation to build on. They argued that it establishes clear market signals, although it is accompanied by multiple risks of delivery, including those related to the ‘fuel poor’ and with low levels of funding for heat networks. The CCC also believes [53] that the UK Government needs to co-ordinate better with local and regional governments, as well as providing greater financial support to upgrade the residential housing stock (largely through improvements in energy efficiency via action such as better home insulation, and then the adoption of heat pumps, hydrogen supply infrastructure, or connection to heat networks).

3.3. The Role of Building Energy Performance Standards and Associated Design Tools

The development of ‘best practice’ guidance and standards is necessary to enable building designers to select technologies that facilitate the optimal operation of residential buildings. Indeed, Bergman et al. [36] argued that building regulations are probably the most important policy instrument available to government in relation to the residential sector. A ‘Standard Assessment Procedure’ (SAP) employed in the UK was initially devised from an early National Home Energy Rating scheme, which was based upon the Milton Keynes Energy Cost Index created by Chapman [54] for the Energy World demonstrator buildings in the 1980s. The latter incorporated 51 low-energy houses constructed in the new city of Milton Keynes (UK), and culminated in a public ‘Energy Park’ exhibition. These homes included advanced designs from Canada, Denmark, Finland, Germany, and Sweden. The SAP methodology [55] is now used to produce building energy reports and associated Energy Performance Certificates (EPCs) for new dwellings. The purpose of these EPCs (the equivalent of Building Performance Evaluation and Certification (BPEC) scheme in the EU-27) is to provide information on a property’s energy use and typical energy-related financial costs [20]. They help to suggest ways of reducing energy usage and increasing efficiency. It has been the responsibility of the UK property seller or landlord, since 2008 (2009 in Scotland), to arrange an EPC to show to prospective buyers or tenants. A section of the EPC deals with the energy efficiency of the dwelling, and is graded from A to G. The former (A) indicates an energy efficient, well-insulated, probably modern home, whereas the latter (G) would be applicable to an old, draughty building [20].
Private occupants own most homes in England (65%) [53], with the rest being privately rented (19%) or socially rented (17%). The private rented sector has the highest concentration of ‘fuel poor’ homes, while social rented houses typically have higher energy efficiency in contrast to owner-occupied homes that have the lowest efficiency on average (as measured by their EPCs). The HBS [50] reported that a study commissioned by the Department for Business, Energy and Industrial Strategy (BEIS) found that EPC C rated dwellings were worth about 5% more than those EPC D rating (allowing for disparities in property size and archetype). It asserted that EPCs are a useful tool for understanding the performance of the building stock, together with the degree of accuracy [50]. They argued that the EPC consistency in assessments has continued to improve over time. The UK Government had produced an EPC Action Plan in 2020 that had helped to set interim milestones for England to improve as many fuel poor homes to a minimum energy efficiency rating of band E by 2020, band D by 2025, and band C by 2030. In the HBS [50] the government set out to establish a Social Housing Decarbonisation Fund to support upgrading of a significant proportion of the social housing stock that is currently below EPC C up to that standard. This would deliver warmer and more energy efficient homes, as well as reducing CO2 emissions and bills, plus generating ‘green jobs’. A Government consultation on minimum performance standards for the private-rented houses suggested that all dwellings should meet EPC E rating by 2020 and EPC C rating by 2028 [50]. They also proposed that a voluntary target on mortgage lenders to reach an average of EPC band C across their portfolio by 2030, with the option of making this target mandatory if insufficient progress is made. In contrast, the Climate Change Committee (CCC) [53] proposed that a range of regulatory measures for minimum EPC ratings should be introduced, including EPC C for rented homes and homes for sale by 2028. They felt that key enablers of progress would be the provision of good quality household information together with real-world performance measurement, including improved EPC and SAP frameworks. The CCC [53] argued that a key policy gap remained around encouraging energy efficiency improvements for owner-occupiers, where the main delivery model is currently only voluntary and relies on EPCs that they consider a relatively weak metric.
An alternative to SAP is the Passivhaus standard (the Passive House Planning Package (PHPP)); another quasi-steady state design tool (see, for example, Forde et al. [56]). This is a set of principles and a design tool produced by the Passivhaus Institut Germany for use by building architects and designers. Passivhaus buildings provide a high level of occupant comfort, whilst using very little energy for heating and cooling [20]. Thus, the PHPP standard incorporates an energy specification that leads to a 75% fall in space heating requirements, compared to standard practice for British new build. An earlier research study commissioned by the Association of Environment Conscious Building (AECB) in the UK examined the differences between the PHPP and SAP [21,55]. It found that SAP made many assumptions that resulted in a less accurate model for low energy buildings. They argued that inefficient practices were assumed within SAP in terms of internal gains, which ultimately results in an under estimation of heating requirements. Similarly, SAP did not allow for the detailed analysis of solar and incidental gains, the effect of thermal mass, or for efficient electricity use [20].

4. Materials and Methods

4.1. Energy Analysis

In order to determine the primary energy inputs needed to produce a given amount of product or service, it is necessary to trace the flow of energy through the relevant industrial system [21,38,57,58,59]. This idea is based on the First Law of Thermodynamics, that is, the principle of conservation of energy, or the notion of an energy balance applied to the system [21,38,58]. It leads to the technique of First Law or ‘energy’ analysis, sometimes termed ‘fossil fuel accounting’, which was developed in the 1970s in the aftermath of the oil crisis (see, for example, Roberts [59] or Slesser [60]). The system boundary in energy analysis (EA) should strictly encompass the energy resource in the ground (e.g., oil in the well or coal at the mine), although this is often taken as the national boundary in practice [21,38,58]. Thus, the sum of all the outputs from this system multiplied by their individual energy requirements must be equal to the sum of inputs multiplied by their individual requirements. Ideally, the analysis should be performed over the entire life-cycle of the product or activity, ‘from cradle to grave’. It yields the whole-life or ‘Gross Energy Requirement’ (GER) of the product or service system [21,36,48]. The process consequently implies the identification of feedback loops, such as the indirect, or ‘embodied’, energy requirements for materials and capital inputs. Different ‘levels of regression’ may be employed [60], depending on the extent to which feedback loops are accounted for, or the degree of accuracy desired. The procedure leads to an estimate of the GER, sometimes loosely termed the primary ‘energy cost’ [21,38,57]. It can provide an estimate of the least energy-intensive industrial processes or materials from amongst a number of alternative options.
There are several different methods of energy analysis; the principal ones being statistical analysis, input-output table analysis, and process analysis [57,59,60]. These are illustrated in Figure 5, along with the associated levels of regression. The first method islimited by the available statistical data for the whole economy or a particular industry, as well as the level of its disaggregation. Statistical analysis often provides a reasonable estimate of the primary energy cost of products classified by industry. However, it cannot account for indirect energy requirements or distinguish between the different outputs from the same industry [59]. The technique of input-output table analysis, originally developed by economists [57], can also be utilised to determine indirect energy inputs and thereby to provide a much better estimate of the GER. This approach is constrained only by the level of disaggregation that is available in national input-output tables. Process EA is the most detailed of the methods, and is usually applied to a particular process or industry. It requires process flow-charting using conventions originally adopted by the International Federation of Institutes of Advanced Studies (IFIAS) in 1974–1975 [57,59,60,61,62]. The application domains of these various EA methods overlap, and a combination of methods is often adopted.
A first level of EA regression (see again Figure 5) incorporates only the direct energy consumption: the processes making the final device or economic product. A second level of regression additionally considers energy that is required for transport and other ancillary inputs [40]. Level 3 regression then includes the energy required to refine feedstock materials (mineral production energy) and that consumed by manufacturing machines. It has been estimated that, in many cases, an EA up to a Level 3 regression will account for 90% of the total life-cycle energy [40,60]. Indeed, some EA studies focus on a combination of Levels 2 and 3 regression [59,62]. Although this may be satisfactory in a number of applications, there will be many systems and activities that fall outside such ‘rules of thumb’ [40]. Finally, a fourth level of regression exists in principle (Figure 5) and includes the energy consumed while producing capital equipment (energy required to machines) [40]. Incorporating information related to this fourth level of regression would be the most accurate, but it would necessarily be costly to undertake in both analyst time and financial terms [40].

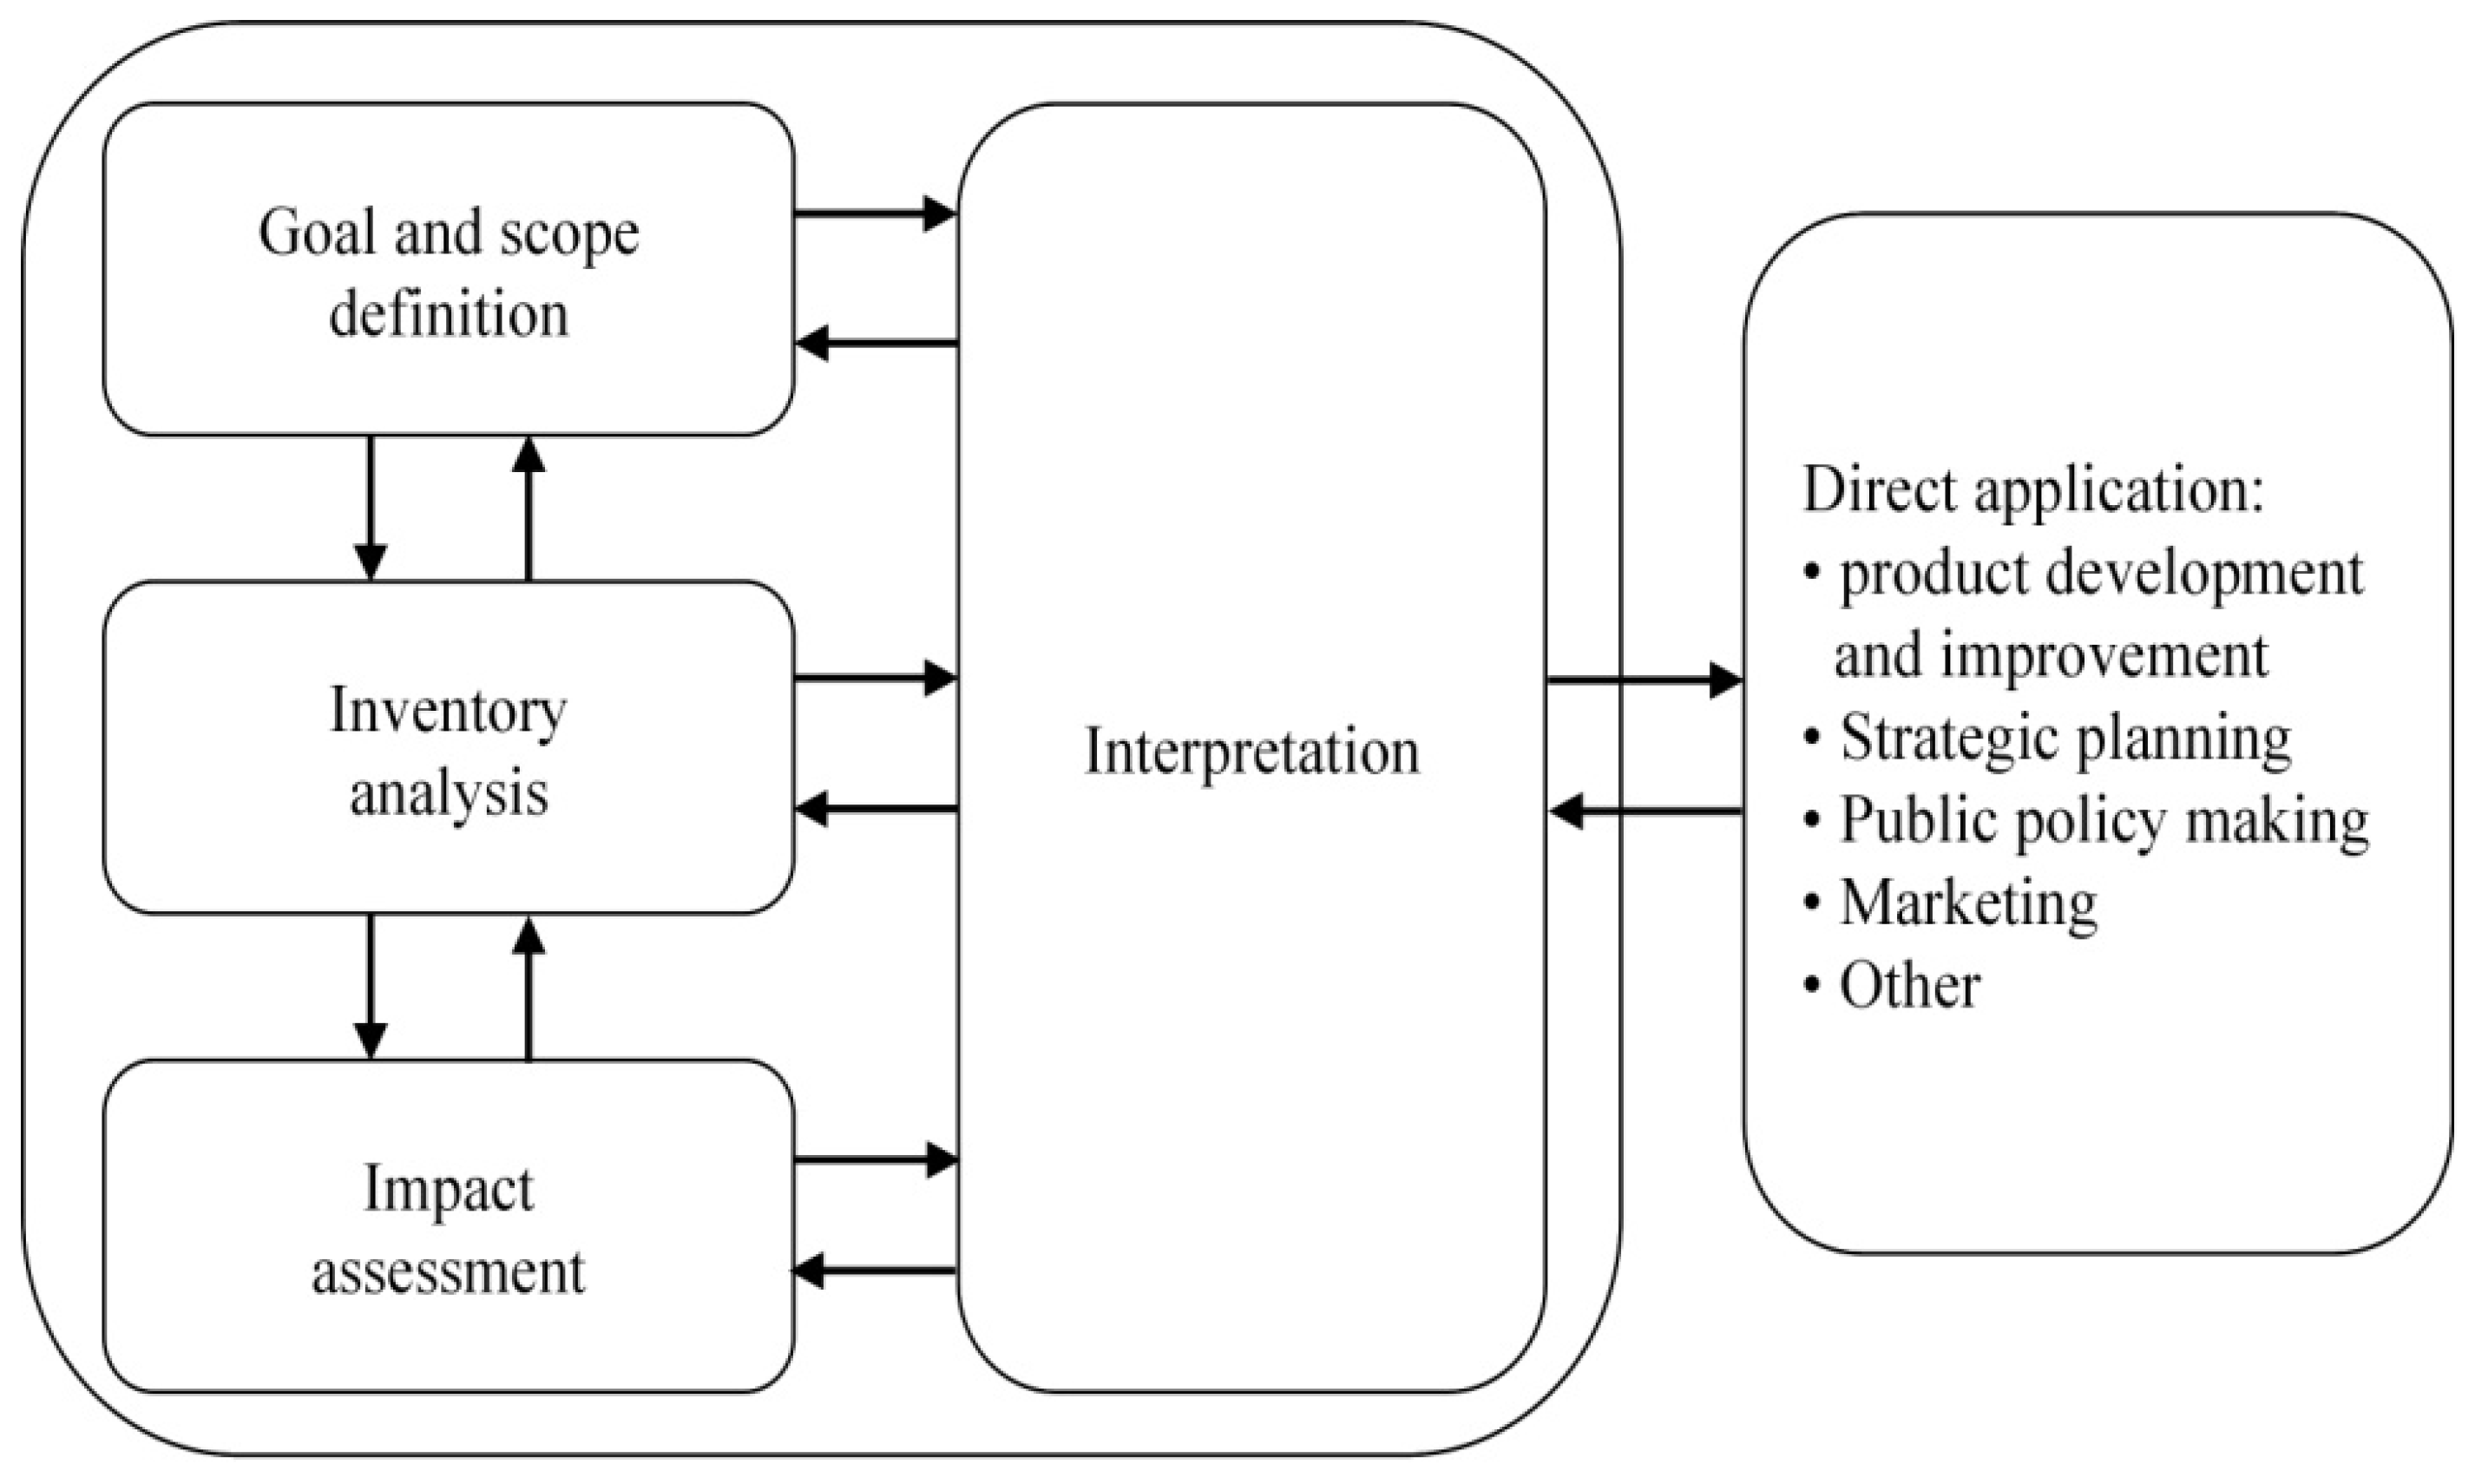
4.2. Environmental Life-Cycle Assessment

EA preceded environmental life cycle assessment (LCA) and, as such, they share much of the same fundamental methodology [40]. In order to evaluate the ideal or ‘whole systems’ environmental consequences of a product or activity the impact resulting from each stage of its life-cycle must be considered [18]. This has led to the development of ecotoxicology or a study of the harmful effects of releasing chemicals into its environs, and a range of analytical techniques that now come under the ‘umbrella’ of LCA [39]. The aim of LCA is therefore to identify opportunities for environmental improvement [21,33,34,39,40,43] by detecting burdens with the most significant impacts. In a full LCA study, the energy and materials used, and pollutants or wastes released into the environment as a consequence of a product or activity are quantified over the whole life-cycle; again ‘from cradle-to-grave’ [26,27,28]. The methodology of LCA follows closely that developed for energy analysis [57,58,59,60,61,62], but evaluates all the environmental burdens associated with a product or process over its whole life-cycle [63,64,65,66,67,68,69,70]. This requires the determination of a balance or budget for the raw materials and pollutant emissions (outputs) emanating from the system. Energy is treated concurrently, thereby obviating the need for a separate energy analysis [17]. LCA is often geographically diverse; that is, the material inputs to a product may be drawn from any continent or geopolitical region of the world [57].
Environmental LCA was originally codified under the auspices of the Society of Environmental Toxicology and Chemistry (SETAC) at a series of workshops in the early 1990s [63,65]. This framework subsequently formed the basis of the International Standards Organisation (ISO) 14,040 series of standards: ISO 14040–14044 (produced over the period 1997–2006). The four main stages of the ISO LCA framework [71], which are shown in Figure 6 to follow a logical sequence of ‘Goal Definition and Scoping’ (outlining aims, methodology and boundary conditions), ‘Inventory Analysis’ (data collection: determining inputs and outputs of materials, fuels, and process emissions), ‘Impact Assessment’ (determination of the life-cycle environmental impacts for the predetermined inventory), and ‘Interpretation’ (identification of hotspots, recommendations for improvement, and treatment of uncertainty). Hammond et al. [40] in their state-of-the-art review of the environmental LCA of energy systems provided a SWOT-like analysis of the approach; identifying a series of strengths and weaknesses: summarised here as Table 1.
Clearly, many technical issues need to be addressed during the conduct of a LCA [38,57,58,63,64,65,66,67,68,69,70]. These include the definition of system boundaries, the quality of data available, and the way the results are normalised [37,57,58,63,64,65,66,67,68,69,70]. The goal definition process is very important as part of the planning stage for an LCA study. Gathering data for the Life-cycle Inventory (LCI) can be a time-consuming task, as many companies either see such data as confidential or simply do not have the sort of detailed records needed for a credible whole-life study. The impact assessment and interpretation stages are still undergoing refinement; although they have been codified in ISO 14,042 and 14,043 (both launched in 2000). The LCA software package SimaPro was employed by Allen et al. [17,31,32,33] and Hammond and Titley [18] to study the environmental impact of various micro-generators. It is a commercial package developed from that originally reported by Heijungs et al. [63] at the Institute of Environmental Sciences (CML), Leiden University, the Netherlands. This software enables the manipulation and examination of inventory data in accordance with the ISO LCA Standards (e.g., [71,72]). Carbon emissions are the principal ‘currency’ of concern and debate in a climate-constrained world. They are consequently the main focus of so-called ‘carbon accounting’, rather the other environmental impact categories (such as ozone depletion, acidification, eutrophication, and the like [21]). Hammond and Titley [18] analysed micro-CHP systems using this approach in order to determine whether or not they give rise to lower CO2 emissions per kilowatt-hour of end-use energy than existing, centralised supply of electricity and heat.

4.3. Financial Appraisal

Financial appraisal evaluates the costs and benefits of any project, programme, or technology in terms of outlays and receipts accrued by a private entity (household, firm …etc) as measured through market prices [18,73,74,75,76,77]. These costs are in the form of the pricepaid for purchasing and installing a device, such as the micro-CHP systems considered here (inclusive of any taxes and/or subsidies). The benefits of this energy technology are often in the form of displaced electricity from the grid [21] and revenues from exported electricity. A substantial contribution to the financial income from the acquisition of a mCHP plant arises from the UK Government’s Feed-in Tariffs (FiT) scheme, which wasfirst implemented in April 2010.
Financial appraisal on a ‘discounted cash flow’ (DCF) basis typically omits environmental ‘externalities’, or any costs or benefits that may occur beyond the private individuals that install micro-generators. In contrast, economic cost-benefit analysis (CBA) is applied to take a society-wide perspective, with a whole systems view of the costs and benefits [21,38]. It accounts for private and social, direct and indirect, tangible and intangible transactions, and regardless to whom they accrue and whether or not they are accounted for in purely financial terms [32]. Allen et al. [21] applied both financial appraisal and CBA to evaluate a number of individual micro-generators. A further distinction between financial appraisal and CBA is in the use of the discount rate to value benefits and costs occurring in the future [21,37,73,74,75,76,77]. Financial appraisal uses the market rate of interest (net of inflation) as a lower bound, and therefore indicates the real return that would be earned on a private sector investment. However, the actual ‘implicit’ discount rate may be substantially higher than this for household energy-related investment, such as ‘low and zero carbon’ (LZC) technologies; even up to 30% according to Watson et al. [78]. However, micro-generators are being sold in the UK (albeit in relatively small quantities), which suggests that rational economics is not the only motivation for installing these systems. There are other direct and indirect factors in play [18,20,21]. In the present study, only financial appraisal has been employed to evaluate various micro-CHP systems on an ‘indicative’ basis [18,20]. This is because successive UK Governments (of different political persuasions) have frequently altered the way in which various micro-generators have been supported from public funds [20]. Likewise, it must be borne in mind that these are innovative technologies, where both performance characteristics and market prices have varied rapidly over the last decade or so (see Section 1.2 above). The economic case for micro-CHP was therefore evaluated by Hammond and Titley [18] in terms of the life-cycle cost of the system in comparison to existing facilities (i.e., separate supply of electricity and heat). Thus, the total cost of manufacture, installation, maintenance, fuel, disposal, and any other costs that arise was divided by the kWh output from the mCHP systems studied in order to yield the notional cost per kWh.

5. Full Fuel Cycle’ Analysis of Micro-CHP Systems

5.1. Practical Requirements of Domestic Energy Systems

Each of the three main micro-CHP systems—based on an Internal Combustion engine (ICE), a Stirling engine (SE), and a Fuel Cell (FC) respectively—will produce a safe energy supply (i.e., of electricity, hot water and space heat) that is suitable for a typical house. A power conditioner must be fitted to the system, as is the case with all systems currently available on the market. The majority of the heat supply will be in the form of hot water, and so existing ‘radiators’ can be utilised in the vast majority of UK houses. Some heat will be available in the form of hot air heated directly by the unit [18]. SE-mCHP systems are a little slow to respond to changing power demands. Fuel Cells exhibit much greater flexibility to changes in loads [23], whilst the ICE is somewhat slower. If the system is installed in parallel with the national electricity distribution network, then the grid can supply the additional power requirements when needed. An alternative arrangement would be to install some form of accumulator to store energy until needed, but this will require more space, and involve greater expense and maintenance.
Domestic mCHP systems are designed to meet specified noise and vibration levels [18,43]. Depending upon the system, the unit should be no louder than a domestic air conditioning compressor, and probably a good deal quieter. The FC system, for example, should be near silent. Natural gas (NG) is the most widely used fuel in the UK for mCHP systems [23]. But for homes with no natural gas supply, each system will run adequately on an alternative fuel. The SEs can use virtually any form of heat source (if appropriately modified), and will run very well on heating oil, LPG, or any other liquid fuel. An ICE system can be built around petrol, diesel or fuel oil engines. A reformer may be fitted to the FC that uses liquid fuel to generate hydrogen. Methanol is commonly used for this purpose [18]. All the mCHP systems on the market have been deemed safe for installation in the home. The ICE and SE plants have also demonstrated that they can fit in the space left by removing a central heating boiler. FC systems have become very much smaller in recent years, and developers are confident that they will get smaller in size in the near future.

5.2. The Energy Performance of Micro-CHP Systems

In order to analyse the performance of micro-CHP system operation on a life-cycle basis, it is necessary to consider the system from the origin of the energy supply to the amount converted into electricity and useful heat. This involves the energy requirements for producing the fuel, as well as transmission and transportation, wherever applicable. In the case of a petrol-fuelled system, for example, the energy is expended in pumping the oil from the ground, transportation to a refinery (e.g., via a pipeline/oil tanker), cracking, fractionating, transportation to a depot, and finally delivery to the home. The energy use of each stage should ideally be considered as part of the ‘full fuel cycle’ [18]. However, that was not the case in the ‘indicative’ study by Hammond and Titley [18].
The efficiency of the system is estimated at the exit point of the mCHP unit. (Thus, the effectiveness of household appliances, house insulation, or hot water pipes are not considered [18]. Likewise, only operational energy use was evaluated. Similarly, Hammond and Titley [18] did not determine the energy requirements for manufacture of components or infrastructure investment amortized over the life of the mCHP unit.) Efficiencies was calculated based on the maximum amount of the energy originally available that could be put to practical use. The maximum amount of this energy that can be converted into electricity was also estimated, along with the maximum amount available to be converted to useful heat. This determines the proportion of electricity to heat for each mCHP system. If only electricity were being usefully employed, and no heat, then the total efficiency would be reduced to just the level of the electrical efficiency. A comparison between the various mCHP plants can then be made, in terms of the likely operating requirements of the system, in order to determine their benefit in a domestic setting. The various mCHP systems may be suitable under different operational circumstances.
The predicted heat and power outputs of each of the three micro-CHP systems aredisplayed in Figure 7, alongside the requirements of the three housing types outlined in Section 2.1 above. These proportions were calculated as an average, or typical figure, but the true proportions will vary according to the nature of the individual dwelling or mCHP unit. The heat/power outputs displayed in Figure 7 are for the total energy supply to the house. mCHP plant electrical outputs are in the range 15–35%, with the corresponding heat outputs of 65–85%. The differing requirements of each type of house are indicated, and suggest which mCHP systems might satisfy the needs of each type of dwelling. For the new/future house type, no system completely matches the requirement, but the FC-based system gives the closest match to these requirements [18]. The efficiency of the FC/reformer package would need to improve to match the requirement exactly, giving more electricity and less heat. The recent housing stock matches quite closely with the ICE system output, whilst the SE system appears more suitable for the retrofit demands of older housing. It can be seen from Figure 3 and Figure 4 above that there are about seven hours during the day when there is concurrent peak demand for both electricity and gas. This is the time period where mCHP will exhibit the greatest energy, environmental, and financial benefit.
The energy and emissions balance for a natural gas-fired Stirling engine (SE) is depicted in Figure 8. A 1 kWe SE installed in older housing will have a maximum heat output of 6 kW of heat. To meet the heat demand of this house, it would either have to be left running for longer, or equipped with a peak burner to boost the heat output. The 1 kW FC and IC engine systems have even smaller heat outputs, so would take a long time to heat up a house [18]. A more powerful engine would alleviate this deficiency, but may lead to unnecessarily high electricity output. Power can be converted to heat efficiently, so this would not affect the overall efficiency. One way to meet the demand would be to have a 2 kWe or 3 kWe SE installed, and adjust the cooling of the cylinder in order to meet the heat requirement. For example, by excessively cooling the cylinder of a 3 kWe engine, it is possible to generate 18 kW of heat (similar to that of a central heating boiler), while just generating 1 kW of electricity with no efficiency penalty [18]. This system would be better suited to coping with peak demand, and as a SE maintains its efficiency at part load, the system would be able to meet the average 1 kW electricity demand effectively. A 3kWe system would cost little more than a 1 kW system. ICE and FC systems are not as flexible, and the output proportions cannot be easily varied. Energy and CO2 emissions balances for these mCHP plants are depicted Figure 9 and Figure 10, respectively.
System efficiencies are depicted in Figure 11 for conventional and mCHP systems, under conditions when the total output (all available heat and electricity) is being put to good use [18]. They yield electrical efficiencies in the range 15–35%; with overall energy efficiencies of 85–90% (see also Staffell et al. [23]). When some heat is wasted, the efficiency figure will lie between the two extremes, depending upon how much is wasted. Liquid and hydrogen-fuelled systems are included. Having an excess of electricity does not affect the potential total efficiency as the extra electricity can be converted to heat with near 100% efficiency by using an electric heater. However, heat cannot be converted into electricity in the same manner. A facility to export surplus power to the grid would also ensure no electricity was wasted. Alternatively, a peak burner will boost heat output when the electricity demand has already been met. The actual efficiency of each system wascalculated in order to show the energy input required by the system would be converted into useful energy. It can be seen from the graph how much of the resource is wasted.

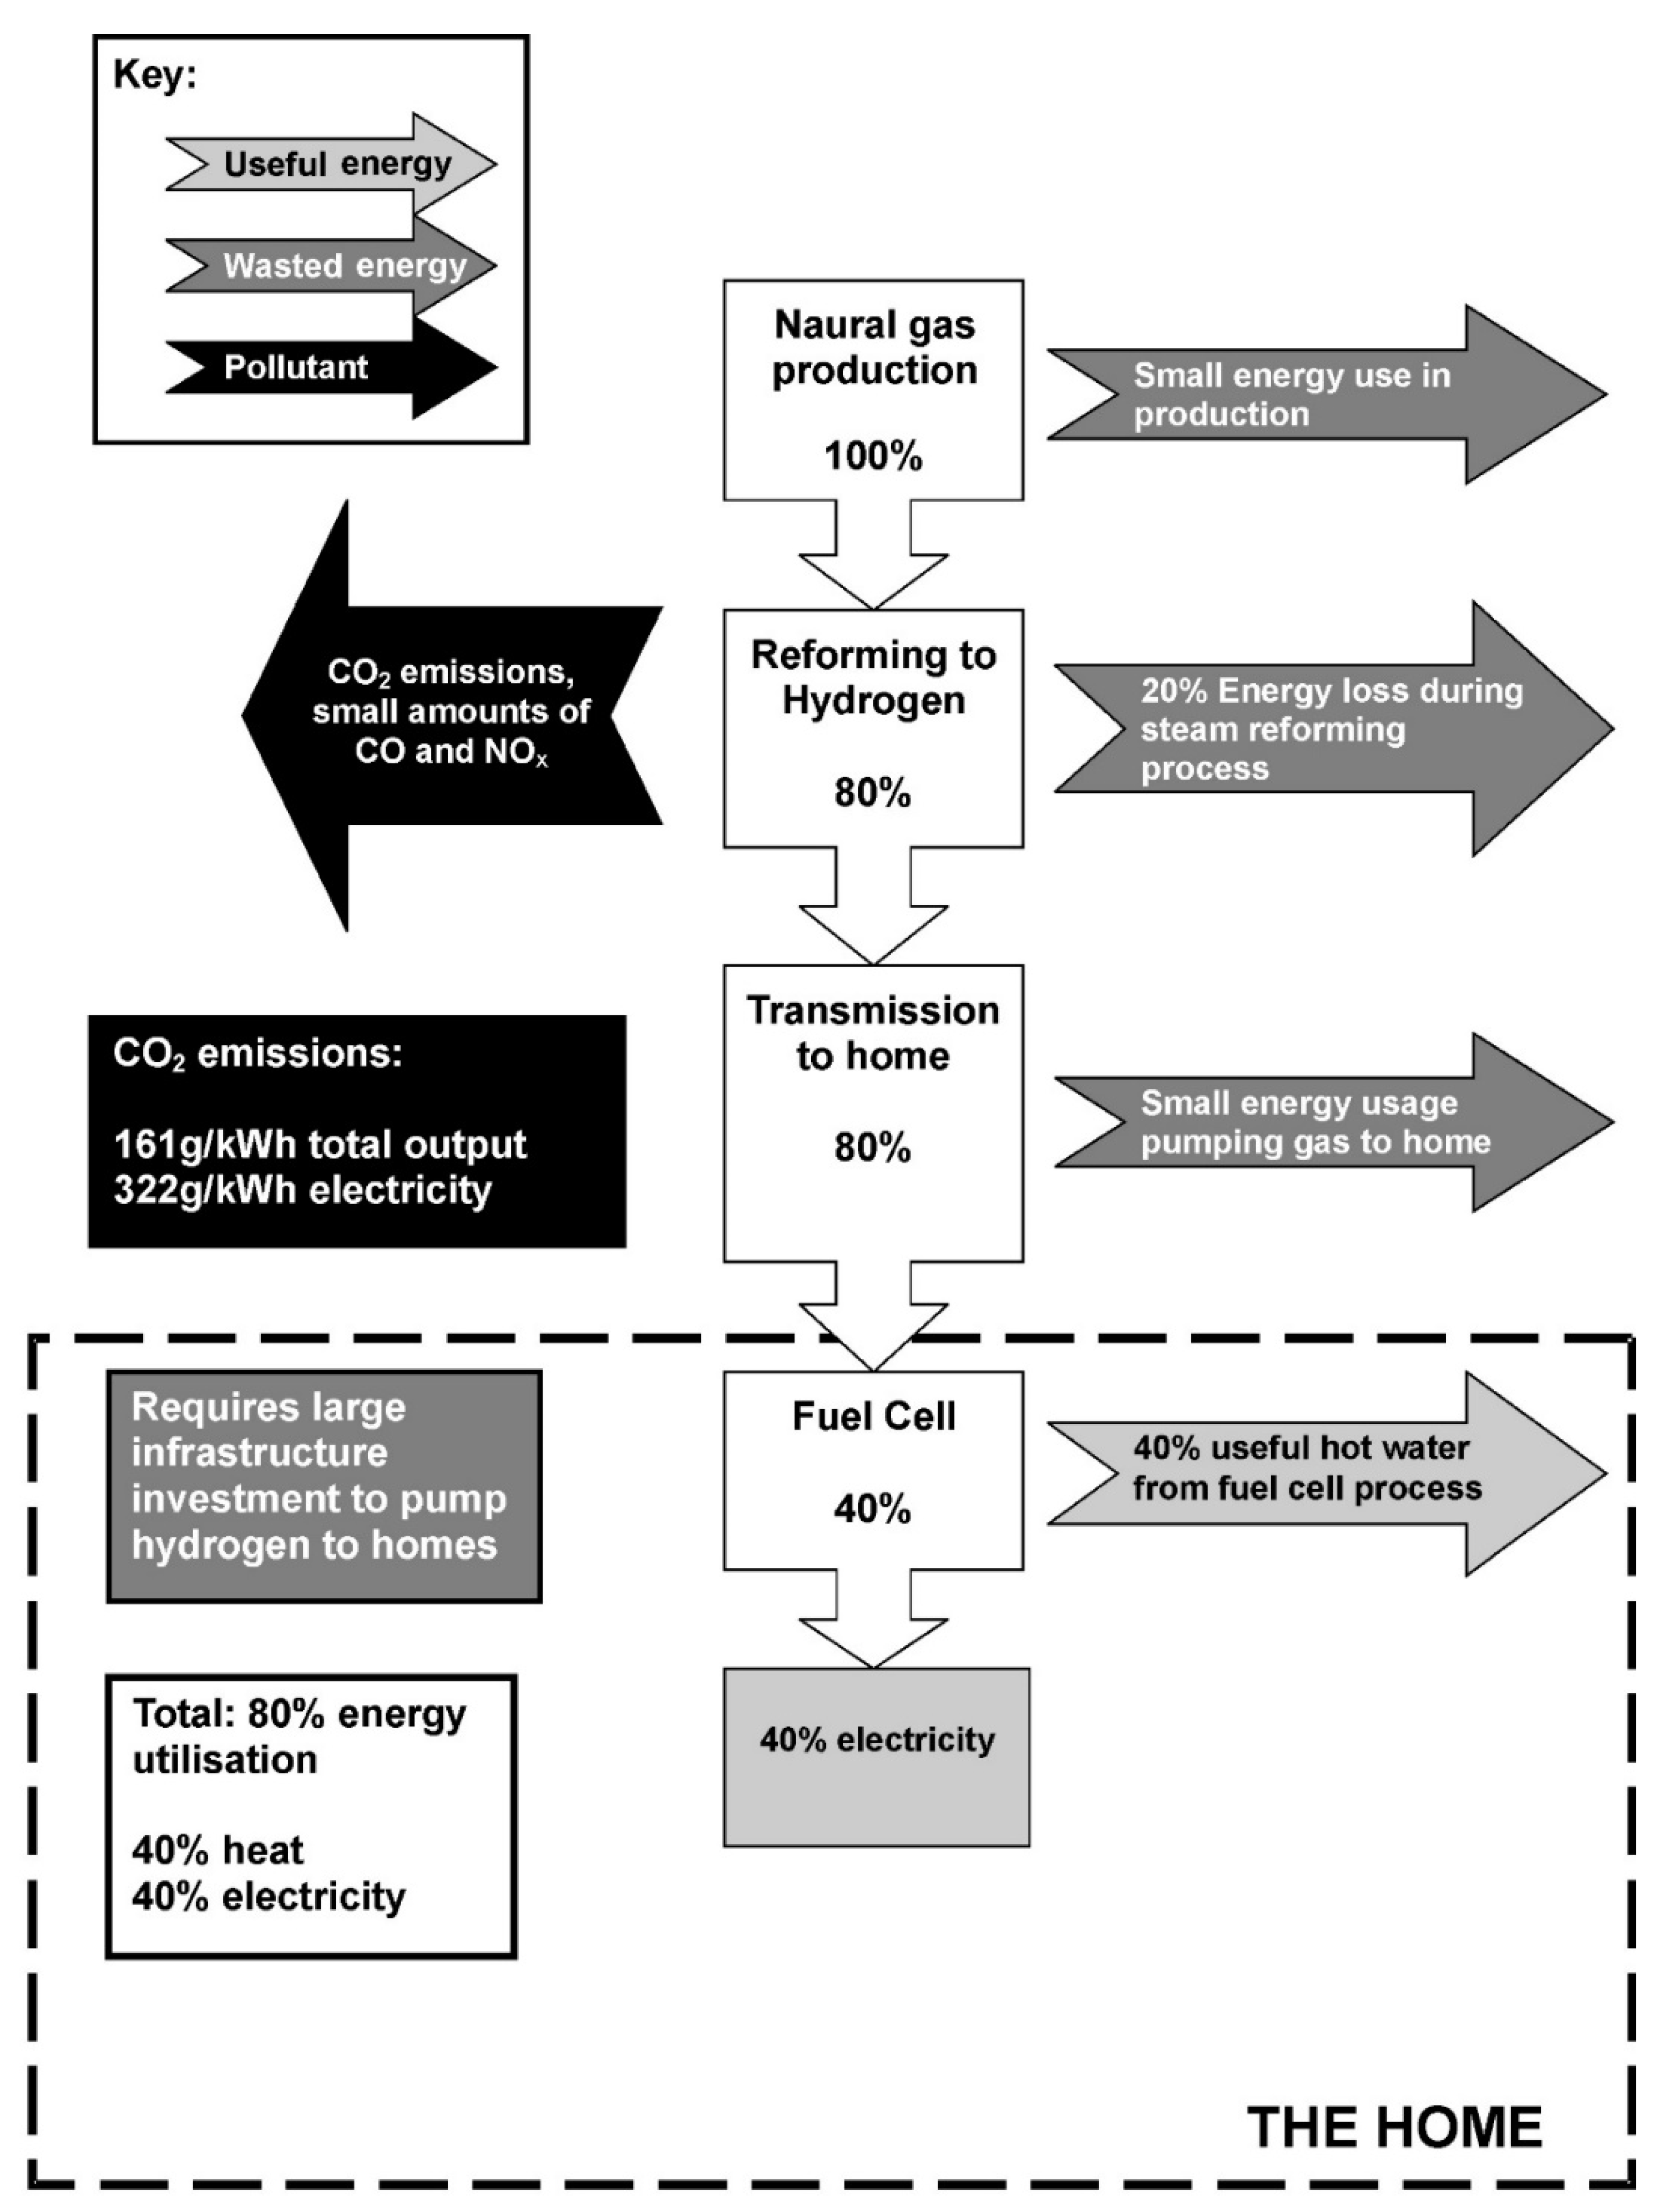
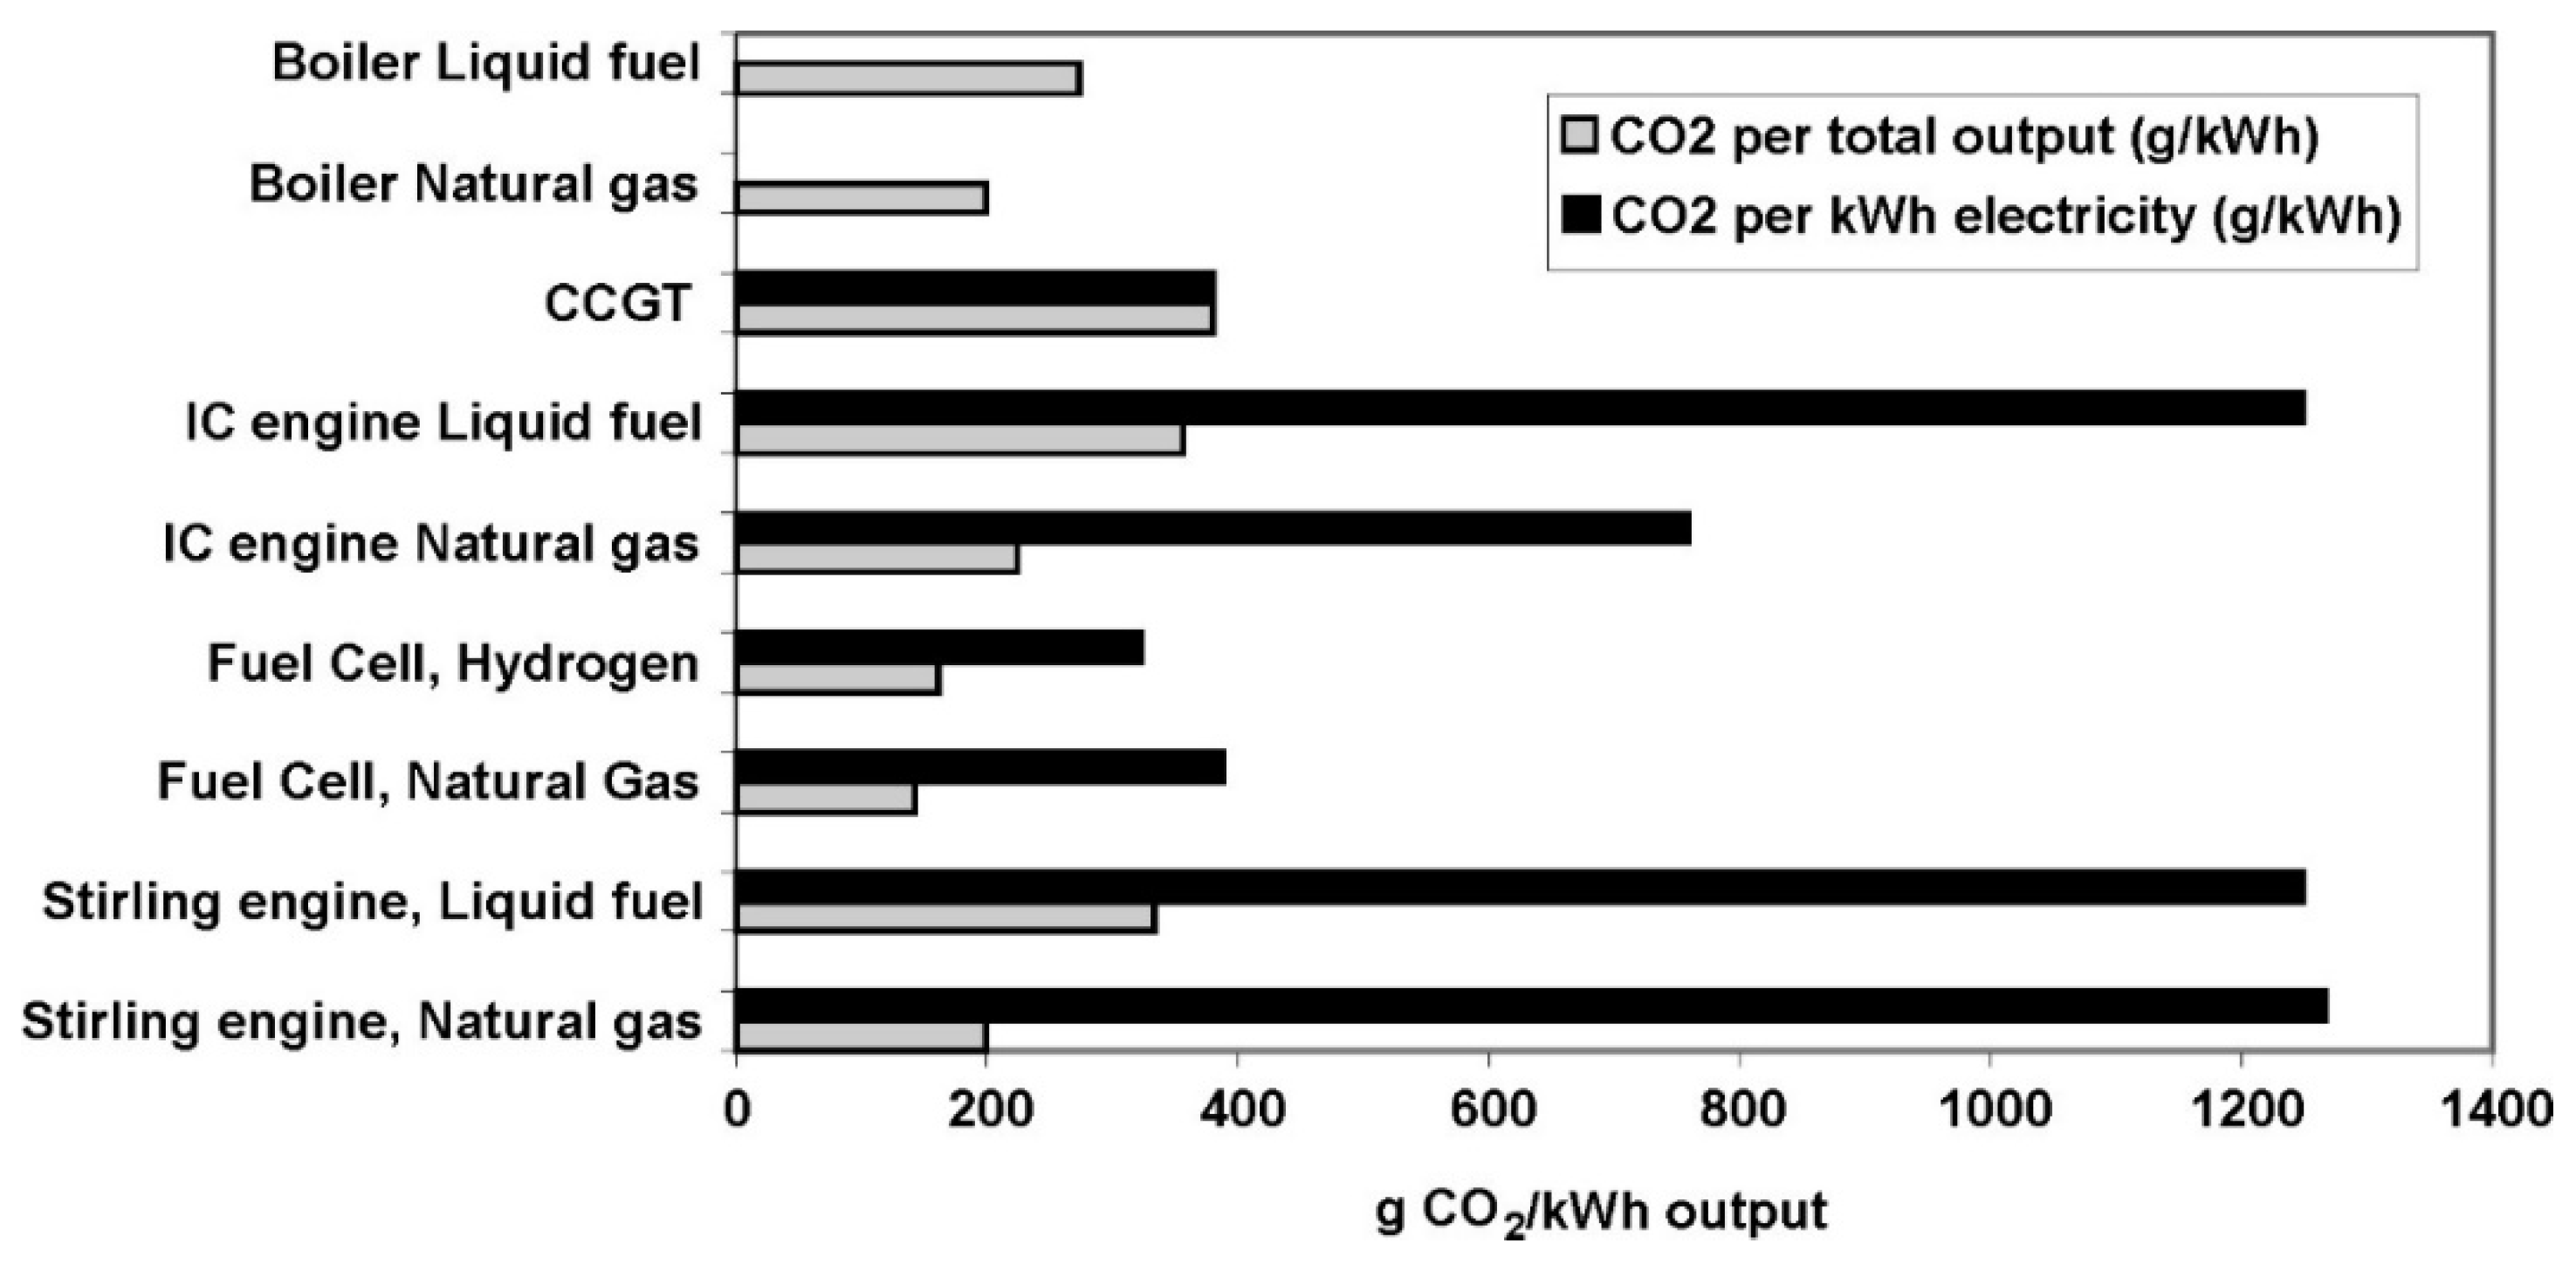
5.3. Carbon Dioxide Emissions Accounting of Micro-CHP Systems

Electricity provision for the home {produced from modern combined cycle gas turbines (CCGTs)} is depicted in Figure 2, along with is a domestic central heating ‘condensing-type’ boiler. Hammond and Titley [18] used data related to such facilities for comparison purposes against the various micro-CHP systems. It is CCGT generators and condensing boilers that provide the central supply alternatives to low-carbon electricity and heat in the transition to net-zero GHG emissions by 2050 (because no new coal power plants are likely to be built, and few people today are likely to buy non-condensing boilers). According to BEIS, 215 g of CO2 were emitted via the national grid for every kWh produced in 2019 [79]. The level in 1990 had been 703 g per kWh, but that has been decreasing year-on-year as more modern, lower carbon generators were brought on-line {such as NG-fuelled plants and renewable energy technologies (RETs)}. Thus, the UK Carbon Trust in their 2011 mCHP accelerator report [48] used a figure of 568 g per kWh (although the corresponding BEIS figure was 496 g per kWh). The phase-out of coal from UK power generation and the uptake of RETs (mainly wind turbines and solar PV arrays) has resulted in a significant fall in the carbon intensity of electricity. The amount of CO2 released to the atmosphere by each mCHP system is illustrated in Figure 12. CCGT power generators and the domestic boilers are also included for comparison purposes. Liquid fuelled systems create more CO2 than their NG-fuelled counterparts and so gas is preferable on environmental grounds. FC-based mCHP systems are clearly the cleanest alternative plants in terms of CO2 emissions associated with either total output or electrical output. Even when only generating electricity, the FCs release similar emissions per kWh to CCGT. When all the heat and power generated by the FC-based mCHP system is in use, a large reduction in CO2 emissions per kWh can be seen (in Figure 12). When only electricity is being used, the ICE and SE-powered systems clearly contribute more CO2 than the existing CCGT system.

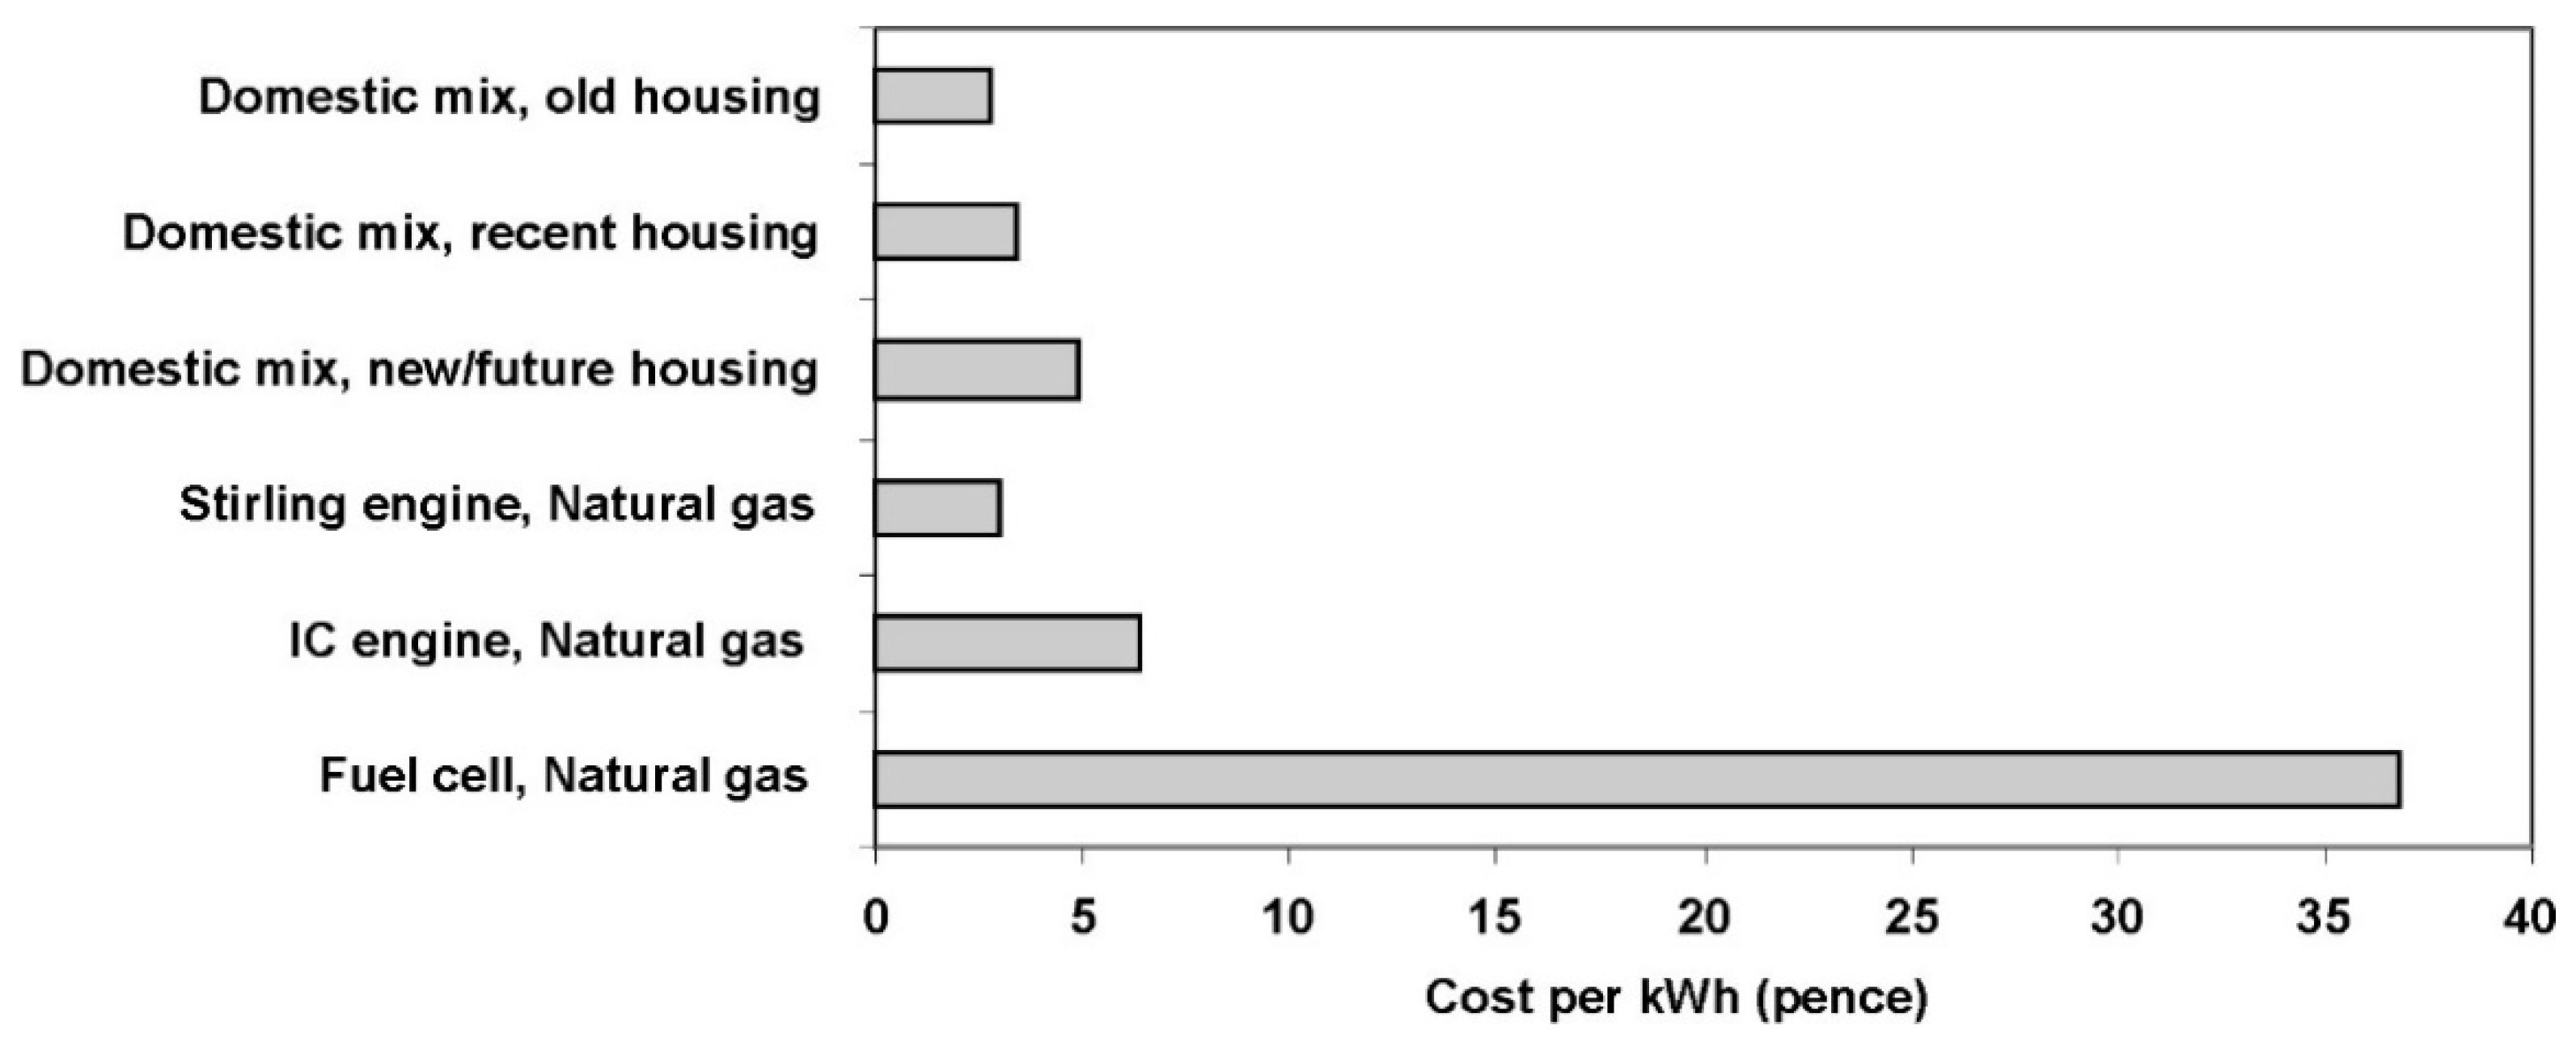
5.4. Financial Investment Appraisal of Micro-CHP Units

Micro-CHP system DCF levelised operating costs per kWh output, in terms of both fuel and of the hardware cost, is shown in Figure 13. Hammond and Titley [18] calculated the hardware cost per hour by multiplying the output of the system by the expected life to give the lifetime output in kWh, and then dividing the hardware cost by this number. Annual discount rates of 6% were employed (well within the range of rates typically employed for investment appraisal in the UK of 3½–10% [22,32,33]). The ‘domestic mix’ figures were estimated using the lifetime output of the boiler, together with prevailing gas and electricity prices. All the energy systems were assumed to give an electrical output of 1 kW, in addition to the relevant amount of heat output. For example, a Stirling engine (SE) outputs 6 kW of heat per 1 kW of electricity, making 7 kW in all. A Fuel Cell (FC) would yield an output of 1 kW for both electricity and heat, making 2 kW in total. The high-energy output of the SE and long-life contribute to its low DCF levelised cost. Thus, indicative mCHP costs were based upon the full use of the available power and heat. When the hardware cost was incorporated into the financial case for micro-CHP [18], it can be clearly seen (again in Figure 13) that the FC has little chance of competing against conventional utilities unless the hardware price dramatically falls. The ICE system is also uncompetitive on economic grounds. Thus, the best investment case for micro-CHP would appear to be installing a SE-based system, which seems to be viable for each housing type.

6. Competition between Heat Pumps and Micro-CHP Plants

6.1. The International Micro-Generation Market Context

It has been indicated in Section 3.2 above that the UK Government [50] and its advisory Climate Change Committee [53] has given preference to heat pumps as a ‘proven technology’ over alternative ‘low and zero carbon’ (LZC) energy technologies. Indeed, the 2021 Heat and Buildings Strategy (HBS) [51] aspires to enable the deployment of 600,000 heat pumps a year by 2028. However, other industrialised nations take a broader perspective with micro-CHP systems being seen as a potentially important part of the future residential heating mix. The Asia-Pacific region, for example, is the largest market for mCHP in the world; dominated by Japan with some 306,000 units installed as of 2019; yielding a 70% share of the global market [80,81]. The Japanese Government aims to further encourage the installation of over 5 million mCHP units by 2030 across both the residential and commercial buildings sector [81]. More modest Asian contributions can be found in South Korea and China. Germany leads mCHP deployment in Europe and the USA in the Americas; albeit the latter at a lower level. Many of these countries have given greater prominence to Fuel Cell (FC) mCHP plants, which are projected to exceed US$ 1.4 billion (bn) in value by 2026 [81]. The share of renewable and waste (including biogas)-fuelled mCHP systems [80] had grown to a market share of around 30% by 2018, particularly in off-natural gas (NG) grid situations. Overall, mCHP market is estimated to grow [80] to some 15 GW in terms of the units installed during 2021–2025. This represents a compound annual growth rate (CAGR) of 16.3% over that period. Factors such as low NG prices and increasing concern towards CO2 emissions along with supportive government policies are expected to drive mCHP deployment systems around the world. (However, the disruption of NG supplies caused by the Russian invasion of Ukraine in early 2022 will no doubt give rise to significant long-term fuel price increases). International mCHP vendors include [80] 2G Energy AG (Heek, Germany), Ballard Power Systems Inc. (Burnaby, Canada), BDR Thermea Group BV (Apeldoorn, The Netherlands), Ceres Power Holdings plc (Horsham, West Sussex, UK), Enginuity Power Systems (St, Alexandria, VA, USA), Honda Motor Co. (Tokyo, Japan), Qnergy (Ogden, UT, USA), SOLIDpower SPA (Mezzolombardo, Trento, Italy), Viessmann Werke GmbH (Allendorf, Germany), and Yanmar Holdings Co. (Osaka, Japan).

6.2. The Comparative Performance of Heat Pumps and Micro-CHP Systems

Cooper et al. [24,25,26] studied various aspects of the relative performance of air source heat pumps (ASHPs) in contrast to micro-CHP plants. The thermodynamic performance of ten ASHPs and eleven mCHP plants were studied under different operating conditions representative of the UK [24,37,41,42] in order to determine their energy and exergy fluxes from primary energy inputs through to low-carbon heating systems and end-use. The resulting performances were then analysed in order to provide insights regarding the relative merits of these systems experienced both now and in the future [24]. They found that current mid-range ASHP and SE-mCHP systems achieved a performance comparable to that of a condensing NG boiler [24]. Thus, ASHPs and mCHP units have the technical potential to improve the overall energy performance of residential dwellings. This was dependent on their electrical characteristics [24]: the grid electrical generation efficiency, the power-to-heat demand ratio, and the export availability of electrical power. In the case of total power-to-heat demands below 1:1.5, ASHPs have greater improvement potential as their energy efficiency is unconstrained [24]. At higher power-to-heat ratios, mCHP units offer the scope for higher overall efficiency and this generally occurred irrespective of whether or not the thermal energy was delivered effectively. Indeed, Cooper et al. [24] noted that efficient Solid Oxide Fuel Cell (SOFC) mCHP units could achieve a higher efficiency than modern combined cycle gas turbine (CCGT) units, once grid losses are taken into account.
Although energy savings are clearly possible using either heat pumps or mCHP plants, as found by Cooper et al. [24], environmental and other considerations must be taken into account in order to provide a fully holistic assessment. The relative energy efficiency and GHG emissions reduction associated with six ASHPs and a SOFC-mCHP unitwere subsequently contrasted via a dispatch model by Cooper et al. [25]. This study wasaimed at indicating the impact of a wide range of operating conditions and methodologies, rather than detailed analysis of the performance of individual units under limited specific circumstances. It is possible that operating regimes that are optimised for grid considerations would not achieve the maximum possible performance from such units. The effect of control methodologies was the primary focus of Cooper et al. [25], but other variables (such as the climate and the specification of the buildings to which heat is supplied) were considered. Several significant findings emerged. Firstly, a reduction in heating demands due to a warmer indoor climate will reduce the impacts of both heating systems. In the case of ASHPs, lower heat demands improve performance. In the case of SOFC-mCHP systems, they reduce the need for auxiliary heating. A wide range of performances may be achieved by ASHPs, even supplying heat to the same building. Nevertheless, the way in which ASHP units are controlled has the potential to reduce their environmental impacts by more than a third [25]. The greatest savings achieved by the SOFC-mCHP unit occurred when it was run continuously at full output, despite the consequent dumping of excess heat. Auxiliary heaters used with them inevitably reduce their overall benefit, but they are still capable of significant savings. It is currently possible for the low-carbon heating systems to offset more GHG emissions than they create [25].
Finally, Cooper et al. [26] evaluated the potential impacts of participating in demand-side management (DSM) on the performance of both ASHPs and mCHP units. DSM involves electricity ‘prosumers’ (consumers who are also generators) [41,42] having the capability to change their usage from their normal or current consumption patterns. It isdesigned to gives customers greater control over the energy they use and produce. This can consequently provide important benefits for customers in terms of reduced bills. Thus, for significant consumers and generators of electricity at the distribution level, large numbers of heat pumps and mCHP plants would provide considerable scope for participation in DSM systems [26]. Cooper et al. [26] therefore investigated the implications of DSM by considering the case where local distribution constraints are the main driver for demand-side interventions. The modelling of domestic electrical demand was adapted to consider a UK neighbourhood of 128 dwellings in order to identify when interventions were necessary. This was combined with dynamic simulations of two Internal Combustion engine (ICE)-mCHP systems, a SOFC mCHP plant, and two ASHPs. A simple thermal model of each building was ‘soft linked’ with a range of user preferences in order to determine the favoured operating profiles for these mCHP units. DSM can then reduce the peak electrical demand of the neighbourhood. However, in the scenarios that Cooper et al. [26] investigated, peaks could not be reduced sufficiently to exceed the capacity of the local distribution transformer when ASHPs were used in all the dwellings. By using a combination of mCHP units with the ASHPs, it was found possible to supply heating to all dwellings without exceeding this capacity constraint. In the context of a low-carbon grid electricity supply (e.g., via nuclear power or renewable energy technologies, like wind turbines), this was observed that such coupling could reduce the average GHG emissions associated with the neighbourhood.

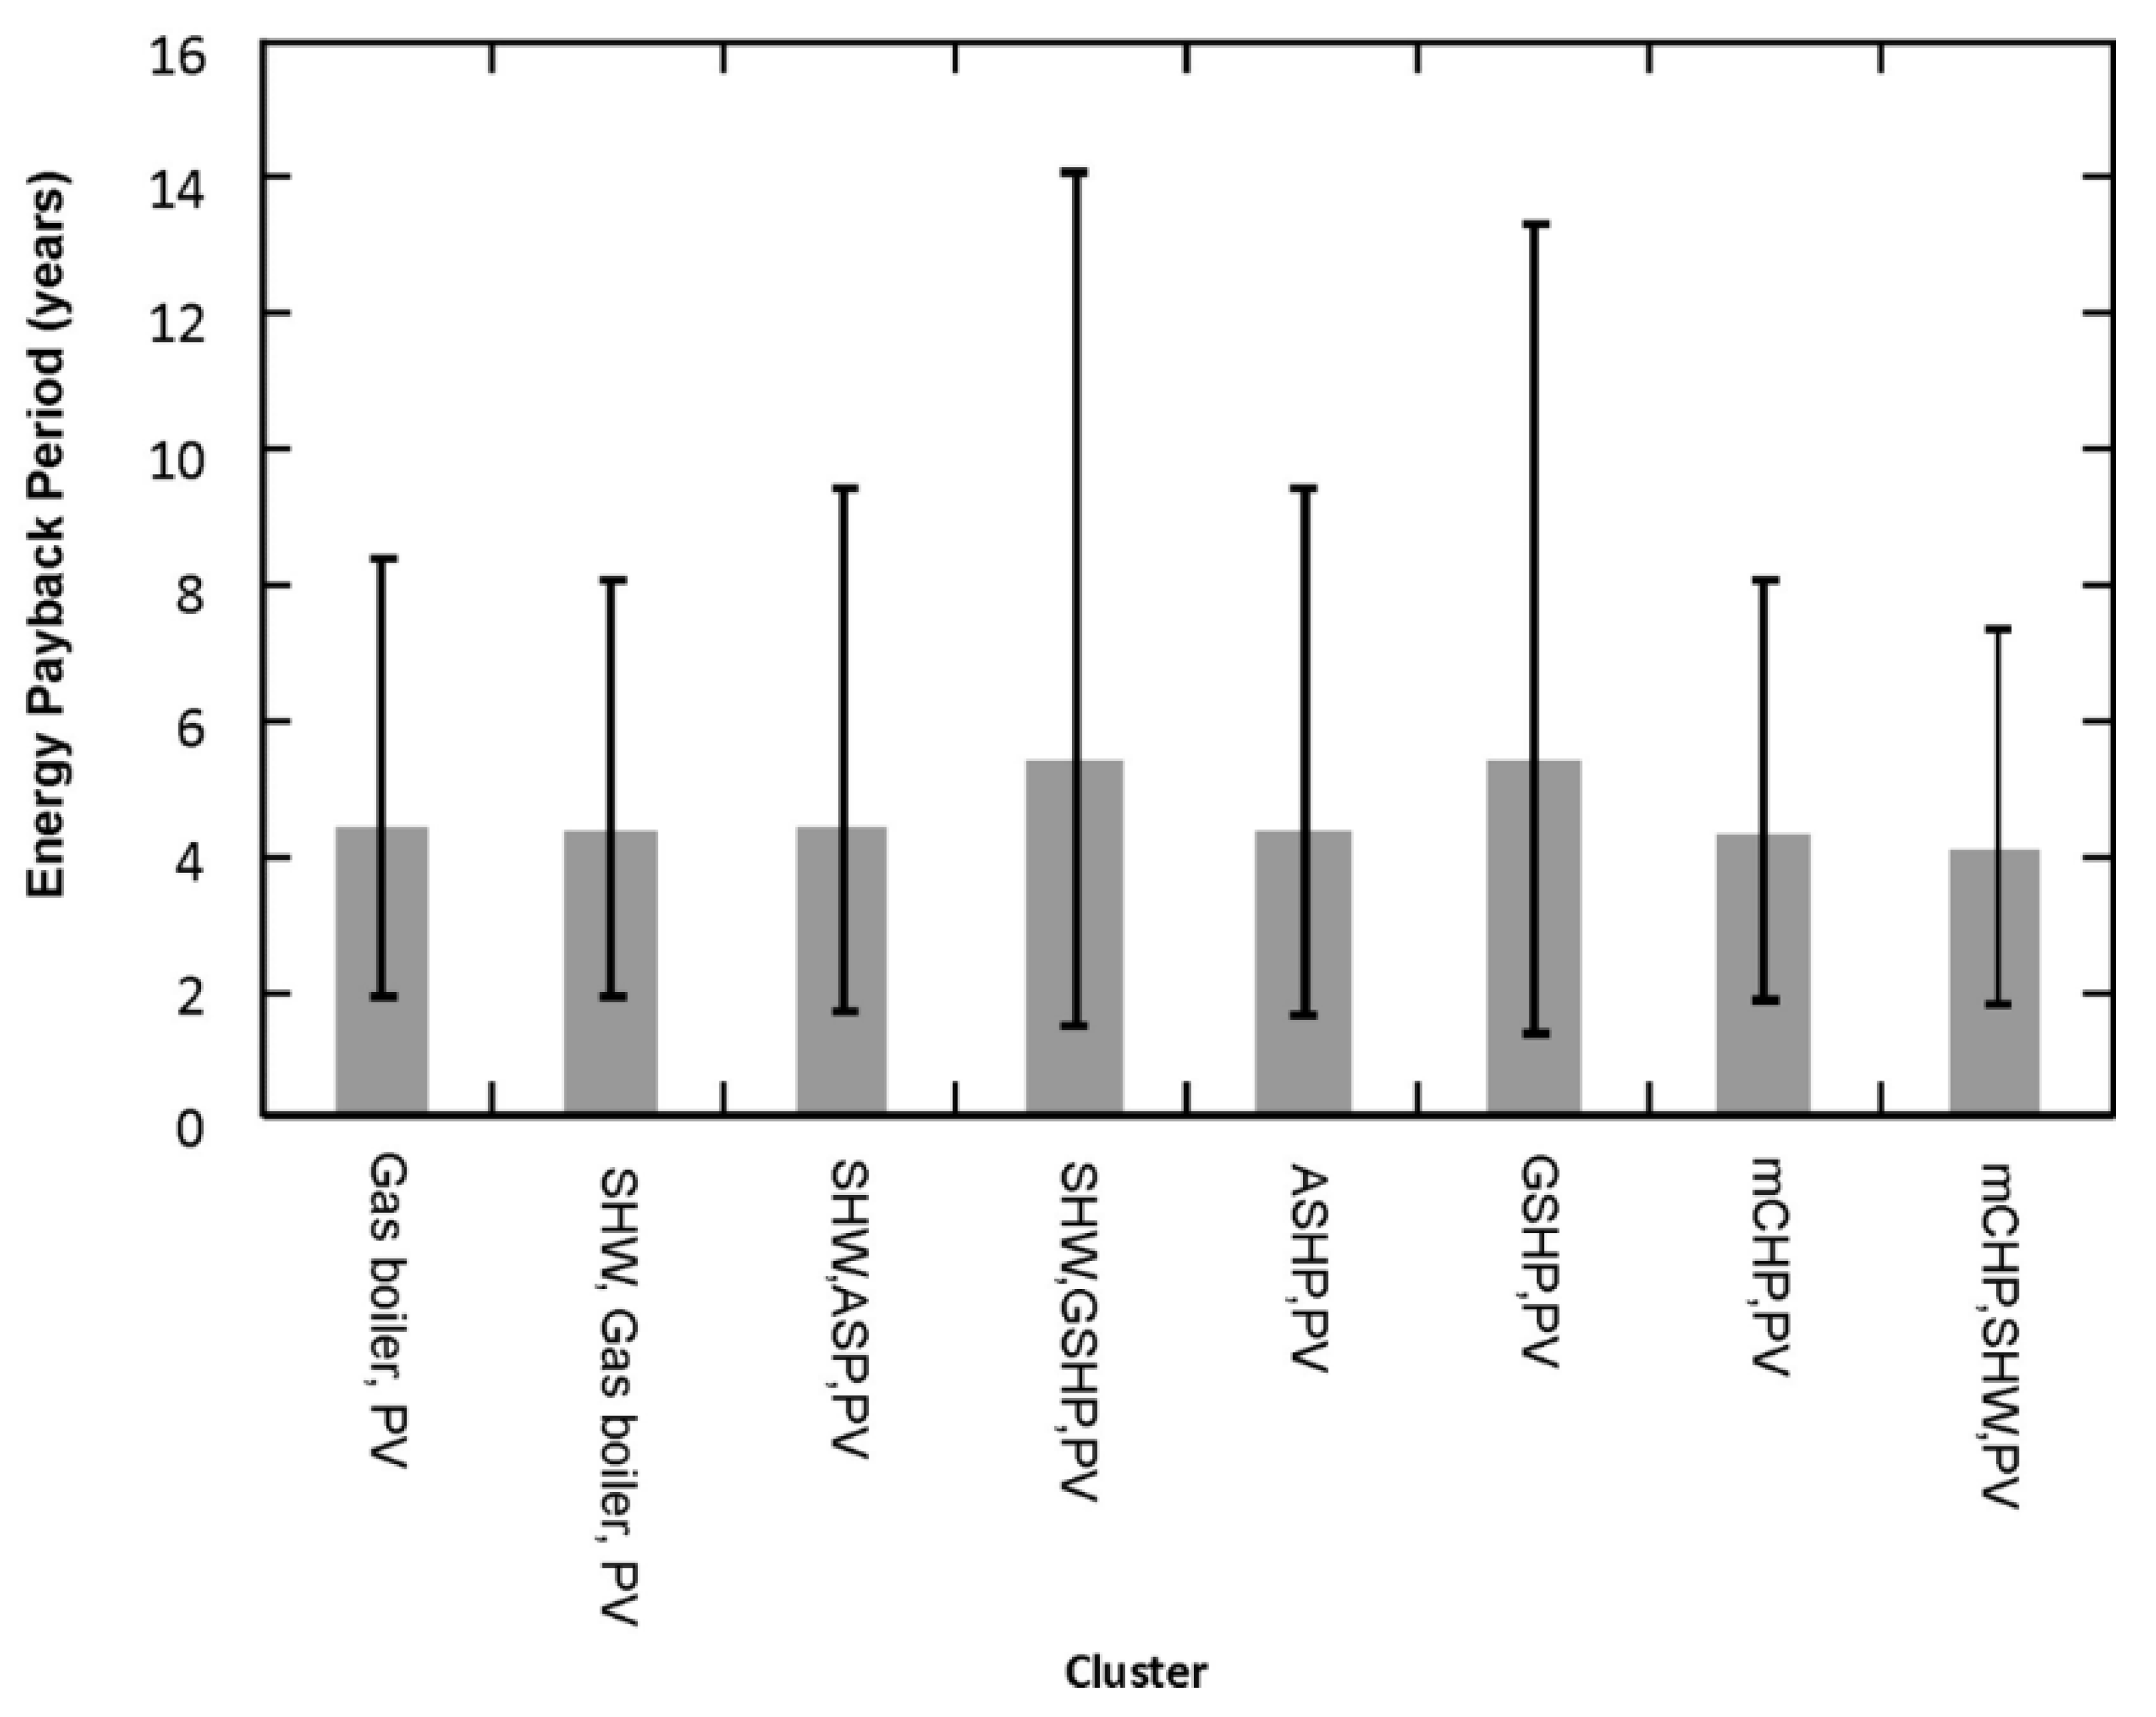
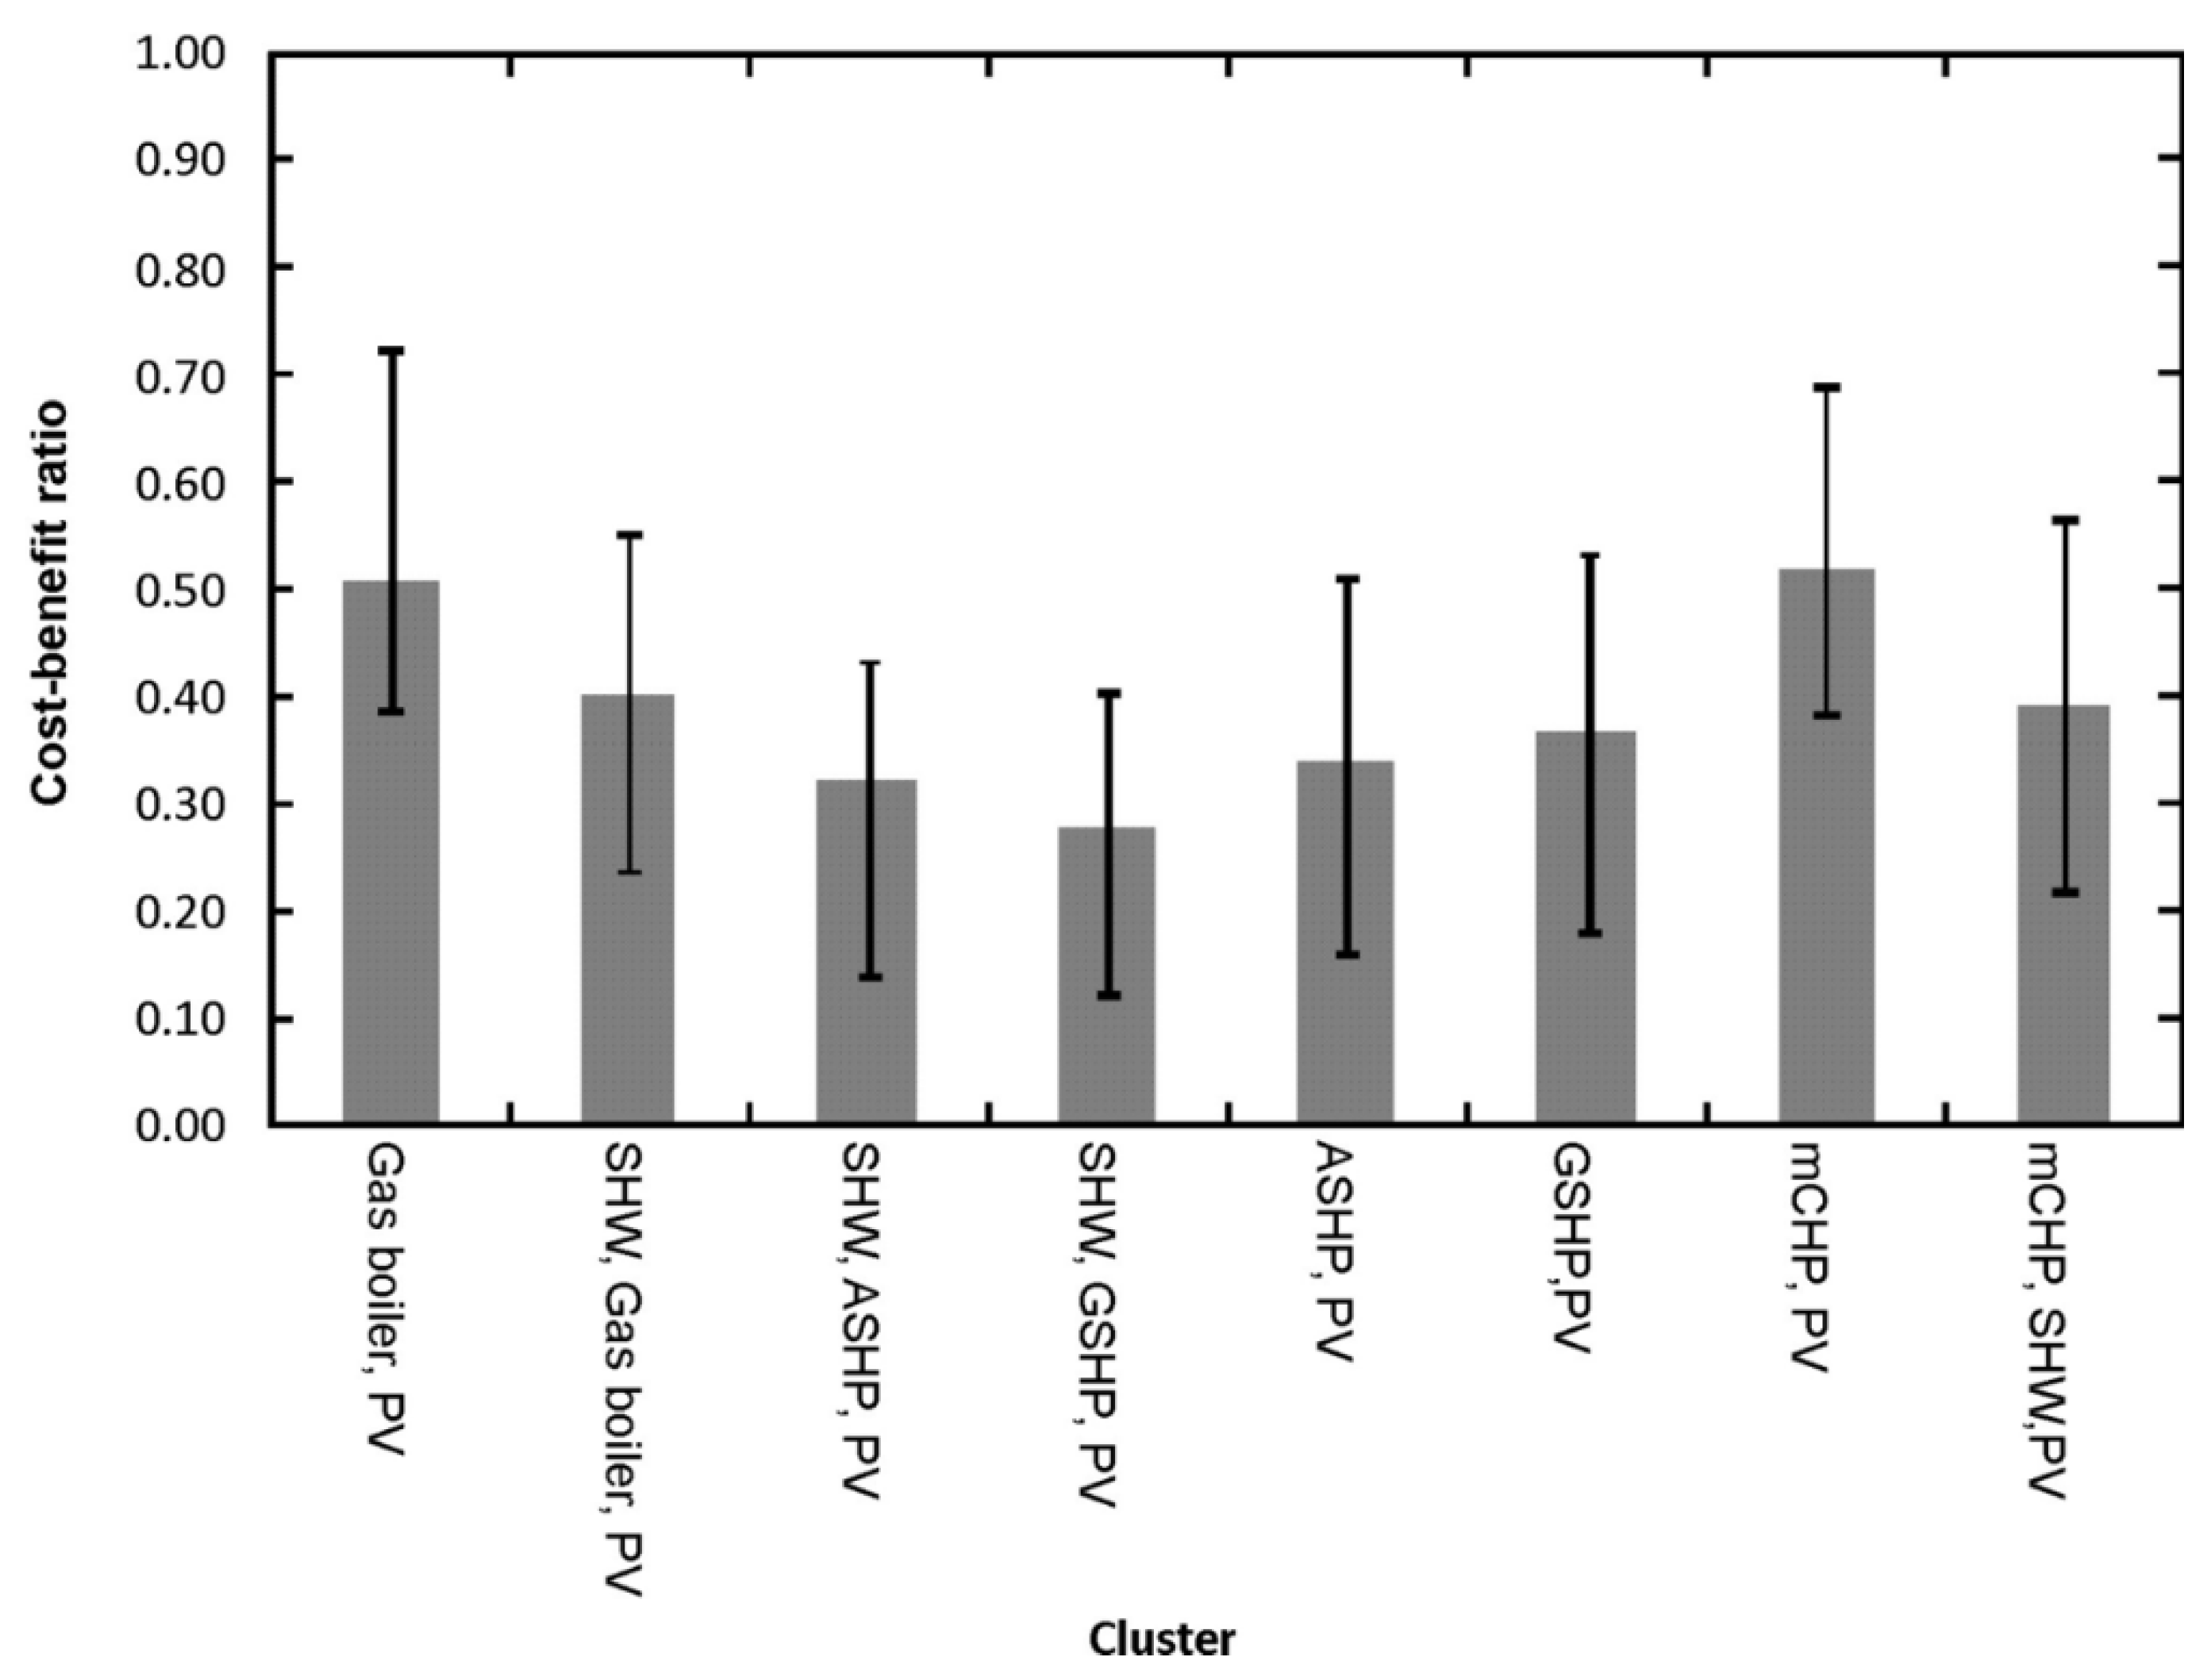
7. Clustering with Other Micro-Generators

Much research has recently been undertaken on the net energy and carbon performance of individual micro-generators (e.g., heat pumps, micro-CHP, micro-wind turbines, solar hot water systems, and solar PV cell arrays) [3,11,16,17,22,31,33,82,83,84,85,86]. But clusters of micro-generators may be required to achieve zero-carbon homes: perhaps, for example, an air source heat pump (ASHP) to provide heating and a solar PV panel to deliver electricity. Indeed, the efficacy of heat generating technologies {e.g., ASHP, ground source heat pumps (GSHP), mCHP, or solar hot water (SHW) systems} are strongly related to demand as well as the interaction with other such heat generating and energy storage technologies [87,88]. Consequently, rather than evaluating individual devices, it is important to analyse the operation of potential clusters. Limited research has been undertaken on the characteristics of two coupled ‘low and zero carbon’ (LZC) technologies [88,89,90,91,92]; what have sometimes been referred to as ‘hybrid’ or ‘multiple’ systems [88,89,90]. Since performance of LZC devices may often be inter-related, the net energy and carbon metrics for micro-generator clusters should be assessed as complete systems. Allen et al. [21] recently identified clusters of micro-generators that could meet the heat and electricity requirements of both recent new build homes (built to the 2006 building standards in the UK) and so-called future ‘zero-carbon homes’. They went on to assess the micro-generators’ net energy and carbon performance. It was found that space-heating requirements can be reduced by some 60–68% by adopting a zero-carbon homes standard [21] for the fabric as compared to those specified in the 2006 building regulations [21]. These findings concur with the previous survey of a limited number of environmental LCAs of individual micro-generators conducted for the Energy Saving Trust [93]; a British organization devoted to promoting the sustainable use of energy and thereby reducing CO2 emissions.
The study by Allen et al. [21] examined the feasibility of clustering (say) two or more of these devices together in the home in order to better match the demand for both heat and power with these distributed energy resources. An ‘integrated approach’ was used (see Section 1.2 above) to determine the impact of the clustered micro-generators—energy analysis, environmental LCA, and indicative financial appraisal. Energy, carbon and financial payback periods were estimated for eight combinations of micro-generators applied with the two levels of UK building standard (2006 and zero-carbon) across five residential dwelling types—a total of 80 combinations. The focus was again on the use of such clustered micro-generators in the context of UK transition pathways to a low-carbon economy out to 2050 [41,43], although the lessons learned are applicable to many industrialised countries. In the present context, Allen et al. [21] specifically examined the clustering of micro-CHP with solar PV panels and of mCHP with SHW and PV panels. Nevertheless, various combinations of heat pumps with SHW and/or PV systems were found to yield the most attractive performance metrics, but all clusters of micro-generators examined had energy and carbon payback periods within their operational lifetime (i.e., EPP = 4.5–5.5 years and CPP = 5.0–7.0 years): see Figure 14 and Figure 15 respectively. This applies for the range of dwellings analysed, together with the embodied energy and carbon values associated with the modelled LZC devices, and their outputs. Embodied energy and carbon values associated with the micro-generators were obtained from the published literature (including the ICE database developed at the University of Bath [57,58]) or from LCA databases (such as ecoinvent [94]). It should be noted that improving the energy efficiency of the building fabric could make significant energy and CO2 emission reductions [2,3].
The grey bars in Figure 14 represent the average ‘energy payback period’ (EPP) for each cluster across all buildings. The error bars indicate the shortest and longest EPPs calculated for each cluster. The longest payback period typically occurred in the dwelling with the lowest heat demand (i.e., a zero-carbon flat) [21]. By contrast, the shortest payback period frequently occurred with the dwelling having the highest heat demand (i.e., a 2006 standard, large, detached house). Regardless of their application, all LZC clusters paid back their embodied energy within a typical 25-year lifetime for micro-generators. The majority of clusters were found to payback within around 5 years of their installation. Clusters containing micro-CHP plants performed relatively well in energy terms (because the mCHP systems were assumed [21] to have the same embodied energy as the gas boiler they replaced), but such mCHP units offset the associated electricity, which has comparatively high associated emissions. All clusters had carbon paybacks (see Figure 15) within their anticipated lifetimes, in a similar manner to that for the EPP. These were found to be roughly 6 years. The shortest payback periods occurred when the heat demand was greatest in, for example, the 2006 large, detached dwelling. High demand increases the amount of energy and carbon saved from the heating technologies (e.g., ASHP, GSHP, mCHP, or SHW systems). Conversely, the longest CPPs occurred in dwellings with the lowest heat demand.
The DCF cost-benefit ratios (CBRs) for the micro-generator clusters, across their notional 25-year lifetime, are depicted in Figure 16. A discount rate of 3.5% was employed in a similar manner to Allen et al. [22] in their appraisal of various individual LZC technologies. The latter reflects the test discount rate (TDR) typically employed by the British Government for short-life energy technology investment appraisal purposes [22]. The values adopted for the price of electricity and gas by Allen et al. [21] were 12p and 3p per kWh respectively, together with a £2500 Low Carbon Buildings Programme (LCBP) grant in operation at the time of their study. This meant, for all of the clusters, that a favourable financial return on the capital investment would not be secured by end of their notional lifetime. Consequently, the clustering micro-generators, with the indicated energy prices and support mechanisms, were not financially attractive. However, this conclusion is sensitive to the specific support mechanisms considered. The use of gas boilers or mCHP to meet heating demand, in conjunction with PV for power supply, yields a favourable Return on Investment (ROI)/discounted payback. This applies whether SHW is, or is not, installed. However, clusters incorporating ASHP and GSHP did not show a discounted CBR > 1. This is because of the relatively high capital costs of the heat pumps compared to gas boilers and mCHP.

8. Concluding Remarks

Highly distributed energy systems, employing various micro-generators, may be able to reduce domestic energy demand and CO2 from the housing sector. Very small ‘combined heat and power’ (CHP) systems are therefore one class of micro-generator that can supply heat and power to a single residential home at significantly increased efficiency and reduced carbon emissions compared with separate supply. Such micro-CHP (mCHP) systems can be used to replace (mainly NG-fired) central heating boilers typically installed in UK dwellings. Allen et al. [16] have described in some detail the prospects for, and barriers to, the adoption of domestic LZC micro-generators. The economics of such devices didn’t look attractive in the early 2000s from a UK perspective, perhaps having financial payback periods to householders stretching out to around 50 years (even allowing for Government grants). Increased production volumes and innovations in the next generation of LZC systems, such as manufacturing processes and operational efficiencies, are necessary to significantly improve their economic performance. The UK ‘Heat and Buildings Strategy’ (HBS) [51] (see Section 3.2 above) acknowledges that it is critical for the UK Government’s drive to net zero GHG emissions for the domestic buildings sector to be decarbonised. The main recommendation from the HBS is that more attractive financial incentives are required to encourage homeowners to install low-carbon heating systems: heat pumps, hydrogen-ready boilers, and the connection to new community heat networks [50]. A high level of faith was exhibited in heat pumps as what the British Government regarded as a ‘proven technology’ that represent cost-effective and efficient heating systems. However, this holds out a possible pitfall in terms of the long discredited policy of ‘picking winners’. Indeed, the HBS [51] aspired to enable the deployment of 600,000 heat pumps a year by 2028. Other industrialised nations take a broader perspective with micro-CHP systems; being seen as a potentially important part of the future residential heating mix. Thus, the Asia-Pacific region is the largest market for mCHP in the world; dominated by Japan with some 306,000 units installed as of 2019; yielding a 70% share of the global market [80,81]. The Japanese Government aims to further encourage the installation of over 5 million mCHP units by 2030 across both the residential and commercial buildings sector [81]. More modest, although substantial, Asian contributions are planned in South Korea and China. Germany leads mCHP deployment in Europe, whilst the USA does the same in the Americas (albeit the latter at a lower level). Many of these countries have given greater prominence to Fuel Cell (FC) mCHP plants, which are projected to exceed by US$ 1.4 billion (bn) in value by 2026 [81].
The relative merits of three alternative network-connected micro-CHP plants were evaluated by Hammond and Titley [18]; based respectively on an Internal Combustion engine (ICE), a Stirling engine (SE), and a Fuel Cell (FC). Their findings in a modern context were summarised above. Each of the systems varies in terms of their electricity generation efficiencies, and supply differing proportions of electricity and heat. They are therefore suitable for different housing types and sizes. Hammond and Titley {18} found that all three mCHP systems were capable of lowering CO2 emissions (relative to those from the most efficient condensing boilers)—about 450 kg for every thousand hours used in the case of a SE-based system installed in a reasonably well insulated home. They also lead to cost savings for the consumer of about 61% over conventional energy supplies, depending on the house type. However, their capital costs are at present more expensive than that for a conventional boiler, with the FC being prohibitively so. The ICE and SE mCHP variants examined by Hammond and Titley {18} were shown to exhibit the greatest economic and environmental benefit. In view of the present enthusiasm of the British Government for heat pumps [51], comparisons have also been made between such devices and mCHP plants by Cooper et al. [24,25,26]. Finally, the potential role of mCHP an element of clustered micro-generators in dwellings of different types was considered, based on the recent research of Allen et al. [21]. The present review places micro-CHP systems in the context of transition pathways to a net-zero CO2 emissions future in terms of meeting UK residential energy demand by 2050, although the lessons learned are applicable to many industrialised countries. They are just one low-carbon option available from amongst a range of ZLC technologies; some of whose strengths and weaknesses have been illustrated here.

Author Contributions

Conceptualization, G.P.H.; methodology, G.P.H. and A.A.T.; validation, A.A.T.; formal analysis, A.A.T.; investigation, G.P.H. and A.A.T.; data curation, A.A.T.; writing—original draft preparation, G.P.H. and A.A.T.; writing—review and editing, G.P.H.; supervision, G.P.H.; project administration, G.P.H.; funding acquisition, G.P.H. All authors have read and agreed to the published version of the manuscript.

Funding

This research was funded by UK research grants awarded by the UKRI Energy Programme, originally as part of the SUPERGEN ‘Highly Distributed Power Systems’ (HDPS) Consortium [under Grant GR/T28836/01; for which Prof. Geoffrey Hammond was a Co-Investigator]; it was renewed as the ‘Highly Distributed Energy Futures’ (HiDEF) Consortium [under Grant EP/G031681/1; for which Prof. Hammond was again a Co-Investigator]. These consortia, which were led by Prof. Graeme Burt and Prof. David Infield of Strathclyde University (Glasgow, Scotland), involved a number of academic and industrial partners. Prof. Hammond also jointly led a large consortium of university partners (jointly with Prof. Peter Pearson—an energy economist, who holds of honorary posts at Cardiff University and Imperial College London) with strategic funding from e.on UK (the electricity generator) and the UKRI Energy Programme to evaluate the role of electricity within the context of ‘Transition Pathways to a Low Carbon Economy’ [under Grant EP/F022832/1], and its successor project solely funded by the UKRI entitled ‘Realising Transition Pathways: Whole Systems Analysis for a UK More Electric Low Carbon Energy Future’ [under Grant EP/K005316/1].

Data Availability Statement

Not applicable.

Acknowledgments

Adam Titley wishes to thank the Bolton Council, as well as the Higher Education Funding Council for England, for financial support of his studies. Both authors are grateful to Steve Petersen of the Stirling Technology, Inc. for his advice in respect to the performance of Stirling engine-based micro-CHP plants. However, the views expressed are those of the authors alone, and do not necessarily reflect the opinions of the collaborators or the policies of the funding bodies. Finally, the authors are grateful to the late Mrs Gill Green (Department of Mechanical Engineering, University of Bath) for her care in preparing the figures. The authors’ names are listed alphabetically.

Conflicts of Interest

The authors declare no conflict of interest.

References

  1. Hammond, G.P. Energy, environment and sustainable development: A UK perspective. Trans. IChemE Part B Process Saf. Environ. Prot. 2000, 78, 304–323. [Google Scholar] [CrossRef] [Green Version]
  2. Royal Commission on Environmental Pollution [RCEP]. Twenty-Second Report: Energy—The Changing Climate; Cm 4749; The Stationery Office: London, UK, 2000. [Google Scholar]
  3. Brown, A.I.; Hammond, G.P.; Jones, C.I.; Rogers, F.J. Greening the UK building stock: Historic trends and low carbon futures 1970–2050. Trans. Can. Soc. Mech. Eng. 2009, 33, 89–104. [Google Scholar] [CrossRef]
  4. Intergovernmental Panel on Climate Change [IPCC]. Climate Change 2021: The Physical Science Basis—Summary for Policymakers; Cambridge University Press: Cambridge, UK, 2021. [Google Scholar]
  5. Houghton, J. Global Warming: The Complete Briefing, 4th ed.; Cambridge University Press: Cambridge, UK, 2009; pp. 20–27. [Google Scholar]
  6. Archer, D.; Brovkin, V. The millennial atmospheric lifetime of anthropogenic CO2. Clim. Change 2008, 90, 283–297. [Google Scholar] [CrossRef] [Green Version]
  7. Ares, E.; Hirst, D. Paris Climate Change Conference; Briefing Paper CPB 7393; House of Commons Library: London, UK, 2015. [Google Scholar]
  8. Intergovernmental Panel on Climate Change [IPCC]. Global Warming of 1.5 °C—Summary for Policymakers; World Meteorological Organization: Geneva, Switzerland, 2018. [Google Scholar]
  9. Cohen, R.; Eames, P.C.; Hammond, G.P.; Newborough, M.; Norton, B. The 2021 Glasgow Climate Pact—Steps on the Transition Pathway Towards a Low Carbon World. Proc. Inst. Civil. Eng. Energy 2022, 175, 97–102. [Google Scholar] [CrossRef]
  10. Gao, Y.; Gao, X.; Zhang, X. The 2 °C global temperature target and the evolution of the long-term goal of addressing climate change—From the United Nations Framework Convention on Climate Change to the Paris Agreement. Engineering 2017, 3, 272–278. [Google Scholar] [CrossRef]
  11. Hammond, G.P.; Waldron, R. Risk assessment of UK electricity supply in a rapidly evolving energy sector. Proc. Inst. Mech. Eng. Part A J. Power Energy 2008, 222, 623–642. [Google Scholar] [CrossRef]
  12. Climate Change Act 2008. 2050 Target Amendment Order; Order No. 1056; The Stationary Office Limited: London, UK, 2019. [Google Scholar]
  13. HM Government [HMG]. Net Zero Strategy: Build Back Greener; Her Majesty’s Stationary Office [HMSO]: London, UK, 2021.
  14. Buchanan, R.A. The Power of the Machine; Penguin Books: Harmondsworth, UK, 1994. [Google Scholar]
  15. Hughes, T.P. Networks of Power: Electrification in Western Society 1880–1930; Johns Hopkins University Press: Baltimore, MD, USA, 1983. [Google Scholar]
  16. Allen, S.R.; Hammond, G.P.; McManus, M.C. Prospects for and barriers to domestic micro-generation: A United Kingdom perspective. Appl. Energy 2008, 85, 528–544. [Google Scholar] [CrossRef]
  17. Allen, S.R.; Hammond, G.P. Thermodynamic and carbon analyses of micro-generators for UK households. Energy 2010, 35, 2223–2234. [Google Scholar] [CrossRef]
  18. Hammond, G.P.; Titley, A. Micro-generators: The prospects for combined heat and power systems on a domestic scale. In Proceedings of the ECOS 2011—The 24th International Conference on Efficiency, Cost, Optimization, Simulation and Environmental Impact of Energy Systems, Novi Sad, Serbia, 4–7 July 2011; pp. 1770–1784. [Google Scholar]
  19. Department for Business, Energy & Industrial Strategy [BEIS]. Digest of United Kingdom Energy Statistics: Annual Data for the UK 2020; The Stationary Office Limited: London, UK, 2021. [Google Scholar]
  20. Shorrock, L.D.; Utley, J.I. Domestic Energy Factfile; Building Research Establishment (BRE): Watford, UK, 2008. [Google Scholar]
  21. Allen, S.R.; Cohen, B.; Hammond, G.P. Indicative appraisal of clustered micro-generators for a low-carbon transition in the UK building sector. Glob. Transit. 2020, 2, 83–97. [Google Scholar] [CrossRef]
  22. Allen, S.R.; Hammond, G.P.; Harajli, H.A.; Jones, C.I.; McManus, M.C.; Winnett, A.B. Integrated appraisal of micro-generators: Methods and applications. Proc. Inst. Civil. Eng. Energy 2008, 161, 73–86. [Google Scholar] [CrossRef]
  23. Staffell, I.; Baker, P.; Barton, J.P.; Bergman, N.; Blanchard, R.; Brandon, N.P.; Brett, D.J.; Hawkes, A.; Infield, D.; Jardine, C.N.; et al. UK microgeneration. Part II: Technology overviews. Proc. Inst. Civil. Eng. Energy 2010, 163, 143–165. [Google Scholar] [CrossRef] [Green Version]
  24. Cooper, S.; Hammond, G.P.; McManus, M.C. Thermodynamic efficiency of low-carbon domestic heating systems: Heat pumps and micro-generation. Proc. Inst. Mech. Eng. Part A J. Power Energy 2013, 227, 18–29. [Google Scholar] [CrossRef] [Green Version]
  25. Cooper, S.J.G.; Hammond, G.P.; McManus, M.C.; Ramallo-Gonzlez, A.; Rogers, J.G. Effect of operating conditions on performance of domestic heating systems with heat pumps and fuel cell micro-cogeneration. Energy Build. 2014, 70, 52–60. [Google Scholar] [CrossRef] [Green Version]
  26. Cooper, S.J.G.; Hammond, G.P.; McManus, M.C.; Rogers, J.G. Impact on energy requirements and emissions of heat pumps and micro-cogenerators participating in demand side management. Appl. Therm. Eng. 2014, 71, 872–881. [Google Scholar] [CrossRef] [Green Version]
  27. Stamford, L.; Greening, B.; Azapagic, A. Life cycle environmental and economic sustainability of Stirling engine micro-CHP systems. Energy Technol. 2018, 6, 1119–1138. [Google Scholar] [CrossRef] [Green Version]
  28. Cheekatamarla, P.; Abu-Heiba, A. A comprehensive review and qualitative analysis of micro-combined heat and power modeling approaches. Energies 2020, 13, 3581. [Google Scholar] [CrossRef]
  29. De Souza, R.; Casisi, M.; Micheli, D.; Reini, M. A review of small–medium combined heat and power (CHP) technologies and their role within the 100% renewable energy systems scenario. Energies 2021, 14, 5338. [Google Scholar] [CrossRef]
  30. Cooper, S.J.G.; Dowsett, J.; Hammond, G.P.; McManus, M.C.; Rogers, J.G. Potential of demand side management to reduce carbon dioxide emissions associated with the operation of heat pumps. J. Sustain. Dev. Energy Water Environ. Syst. 2013, 1, 94–108. [Google Scholar] [CrossRef] [Green Version]
  31. Cooper, S.J.G.; Hammond, G.P.; McManus, M.C.; Pudjianto, D. Detailed simulation of electrical demands due to nationwide adoption of heat pumps, taking account of renewable generation and mitigation. IET Renew. Power Gener. 2016, 10, 380–387. [Google Scholar] [CrossRef] [Green Version]
  32. Allen, S.R.; Hammond, H.A.; Harajli, H.A.; McManus, M.C.; Winnett, A.B. Integrated appraisal of a solar hot water system. Energy 2010, 35, 1351–1362. [Google Scholar] [CrossRef]
  33. Hammond, G.P.; Harajli, H.A.; Jones, C.I.; Winnett, A.B. Whole systems appraisal of a UK building integrated photovoltaic (BIPV) system: Energy, environmental, and economic evaluations. Energy Policy 2012, 40, 219–230. [Google Scholar] [CrossRef]
  34. Allen, S.R.; Hammond, G.P.; McManus, M.C. Energy analysis and environmental life cycle assessment of a micro-wind turbine. Proc. Inst. Mech. Eng. Part A J. Power Energy 2008, 222, 669–684. [Google Scholar] [CrossRef]
  35. Ellsworth-Krebs, K.; Reid, L. Conceptualising energy prosumption: Exploring energy production, consumption and microgeneration in Scotland, UK. Environ. Plan. A Econ. Space 2016, 48, 1988–2005. [Google Scholar] [CrossRef] [Green Version]
  36. Bergman, N.; Hawkes, A.; Brett, D.J.; Baker, P.; Barton, J.; Blanchard, R.; Brandon, N.P.; Infield, D.; Jardine, C.; Kelly, N.; et al. UK microgeneration. Part I: Policy and behavioural aspects. Proc. Inst. Civil. Eng. Energy 2009, 162, 23–36. [Google Scholar] [CrossRef] [Green Version]
  37. Hammond, G.P.; Stapleton, A.J. Exergy analysis of the United Kingdom energy system. Proc. Inst. Mech. Eng. Part A J. Power Energy 2001, 215, 141–162. [Google Scholar] [CrossRef]
  38. Hammond, G.P.; Winnett, A.B. Interdisciplinary perspectives on environmental appraisal and valuation techniques. Proc. Inst. Civil. Eng. Waste Resour. Manag. 2006, 159, 117–130. [Google Scholar] [CrossRef]
  39. Hammond, G.P.; Jones, C.I. Sustainability criteria for energy resources and technologies. In Handbook of Sustainable Energy; Galarraga, I., González-Eguino, M., Markandya, A., Eds.; Edward Elgar: Cheltenham, UK, 2011; Chapter 2; pp. 21–46. [Google Scholar]
  40. Hammond, G.P.; Jones, C.I.; O’Grady, A. Environmental life cycle assessment (LCA) of energy systems. In Handbook of Clean Energy Systems, Vol. 6.—Sustainability of Energy Systems; Yan, J., Ed.; John Wiley and Sons: Chichester, UK, 2015; Chapter 22; pp. 3343–3368. [Google Scholar]
  41. Foxon, T.J.; Hammond, G.P.; Pearson, P.J.G. Socio-technical transitions in UK electricity: Part 1—History, actors and pathways. Proc. Inst. Civil. Eng. Energy 2020, 173, 109–122. [Google Scholar] [CrossRef]
  42. Foxon, T.J.; Hammond, G.P.; Pearson, P.J.G. Socio-technical transitions in UK electricity: Part 2—Technologies and sustainability. Proc. Inst. Civil. Eng. Energy 2020, 173, 123–136. [Google Scholar] [CrossRef]
  43. Hitchin, R. Housepower. Build. Serv. J. 2001, 29–30. Available online: https://en.wikipedia.org/wiki/Horsepower (accessed on 17 August 2022).
  44. Boardman, B. Home Truths: A Low-Carbon Strategy to Reduce UK Housing Emissions by 80% by 2050; Environmental Change Institute, University of Oxford: Oxford, UK, 2007. [Google Scholar]
  45. Clarke, J.A. Energy Simulation in Building Design, 2nd ed.; Butterworth-Heinemann: London, UK, 2001. [Google Scholar]
  46. Thomson, M.; Infield, D. Modelling the impact of micro-combined heat and power generators on electricity distribution networks. Proc. Inst. Mech. Eng. Part A J. Power Energy 2008, 222, 697–706. [Google Scholar] [CrossRef]
  47. Bonnet, S.; Alaphilippe, M.; Stouffs, P. Energy, exergy and cost analysis of a micro-cogeneration system based on an Ericsson engine. Int. J. Therm. Sci. 2005, 44, 1161–1168. [Google Scholar] [CrossRef]
  48. Carbon Trust. Micro-CHP Accelerator: Final Report; Carbon Trust: London, UK, 2011. [Google Scholar]
  49. Hammond, G.P.; Newborough, M. Briefing: Glasgow Climate Pact—A step on the way towards a lower carbon dioxide world. Proc. Inst. Civil. Eng. Civ. Eng. 2022, 175, 8. [Google Scholar]
  50. HM Government [HMG]. Heat and Buildings Strategy; CP 388; Her Majesty’s Stationary Office [HMSO]: London, UK, 2021. [Google Scholar]
  51. House of Commons Business, Energy and Industrial Strategy [BEIS] Committee. Decarbonising Heat in Homes; HC 1038; House of Commons: London, UK, 2022.
  52. Climate Change Act 2008. In Climate; Her Majesty’s Stationery Office: London, UK, 2008; Chapter 27.
  53. Climate Change Committee [CCC]. Independent Assessment: The UK’s Heat and Buildings Strategy; CCC: London, UK, 2022. [Google Scholar]
  54. Chapman, P.F. The Milton Keynes Energy Cost Index. Energy Build. 1990, 14, 83–101. [Google Scholar] [CrossRef]
  55. Building Research Establishment [BRE]. The Government's Standard Assessment Procedure for Energy Rating of Dwellings; BRE: London, UK, 2005. [Google Scholar]
  56. Forde, J.; Hopfe, C.J.; McLeod, R.S.; Evins, R. Temporal optimization for affordable and resilient Passivhaus dwellings in the social housing sector. Appl. Energy 2020, 261, 114383. [Google Scholar] [CrossRef]
  57. Hammond, G.P.; Jones, C.I. Embodied energy and carbon in construction materials. Proc. Inst. Civil. Eng. Energy 2008, 161, 87–98. [Google Scholar] [CrossRef] [Green Version]
  58. Hammond, G.; Jones, C. Embodied Carbon: The Inventory of Carbon and Energy (ICE); Lowrie, F., Tse, P., Eds.; A BSRIA Guide—BG 10/2011; BSRIA Ltd.: Bracknell, UK, 2011. [Google Scholar]
  59. Roberts, F. The aims, methods and uses of energy accounting. Appl. Energy 1978, 4, 199–217. [Google Scholar] [CrossRef]
  60. Slesser, M. Energy in the Economy; Macmillan Press: London, UK, 1978. [Google Scholar]
  61. Boustead, I.; Hancock, G.F. Handbook of Industrial Energy Analysis; Ellis Horwood Ltd.: Chichester, UK, 1979. [Google Scholar]
  62. Chapman, P.F.; Roberts, F. Metal Resources and Energy; Butterworths: London, UK, 1983. [Google Scholar]
  63. Heijungs, R.; Guinee, J.B.; Huppes, G.; Lankreijer, R.M.; Udo de Haes, H.A.; Sleeswijk, A. Environmental Life Cycle Assessment of Products—Guide and Background; Report CML 92; Leiden University: Leiden, Belgium, 1992. [Google Scholar]
  64. Bauman, H.; Tillman, A.-M. The Hitch Hiker’s Guide to LCA: An Orientation in Life Cycle Assessment Methodology and Application; Studentlitteratur: Lund, Sweden, 2004. [Google Scholar]
  65. Udo de Haes, H.A.; Heijungs, R. Life-cycle assessment for energy analysis and management. Appl. Energy 2007, 84, 817–827. [Google Scholar] [CrossRef]
  66. Vogtländer, J.G. LCA: A Practical Guide for Students, Designers and Business Managers; VSSD: Delft, The Netherlands, 2010. [Google Scholar]
  67. Curran, M.A. Life Cycle Assessment Handbook: A Guide for Environmentally Sustainable Products; Wiley-Scrivener: Beverly, CA, USA, 2012. [Google Scholar]
  68. Klöpffer, W.; Grahl, B. (Eds.) Life Cycle Assessment (LCA): A Guide to Best Practice; Wiley-VCH Verlag GmbH: Weinheim, Germany, 2014. [Google Scholar]
  69. Hauschild, M.; Rosenbaum, R.K.; Olsen, S. (Eds.) Life Cycle Assessment: Theory and Practice; Springer International Publishing AG: Cham, Switzerland, 2018. [Google Scholar]
  70. Schebek, L.; Herrmann, C.; Cerdas, F. (Eds.) Progress in Life Cycle Assessment; Springer Nature Switzerland AG: Basel, Switzerland, 2019. [Google Scholar]
  71. ENO ISO 14040; Environmental Management—Life Cycle Assessment—Principles and Framework, 2nd ed. ISO: Geneva, Switzerland, 2006.
  72. ENO ISO 14044; Environmental Management—Life Cycle Assessment—Requirements and Guidelines. ISO: Geneva, Switzerland, 2006.
  73. Short, W.; Packey, D.J.; Holt, T. A Manual for the Economic Evaluation of Energy Efficiency and Renewable Energy Technologies; Report NREL/TP-462-5173; National Renewable Energy Laboratory: Golden, CO, USA, 1995. [Google Scholar]
  74. Brent, R.J. Applied Cost-Benefit Analysis, 2nd ed.; Edward Elgar Publishing: Cheltenham, UK, 2006. [Google Scholar]
  75. Snell, M. Cost–Benefit Analysis, 2nd ed.; ICE Publishing: London, UK, 2011. [Google Scholar]
  76. Götze, U.; Northcott, D.; Schuster, P. Investment Appraisal: Methods and Models; Springer: Berlin, Germany, 2015. [Google Scholar]
  77. Boardman, A.E.; Greenberg, D.H.; Vining, A.R.; Weimer, D.L. Cost-Benefit Analysis: Concepts and Practice, 5th ed.; Cambridge University Press: Cambridge, UK, 2018. [Google Scholar]
  78. Watson, J.; Sauter, R.; Bahaj, B.; James, P.; Myers, L.; Wing, R. Domestic micro-generation: Economic, regulatory and policy issues for the UK. Energy Policy 2008, 36, 3095–3106. [Google Scholar] [CrossRef]
  79. Department for Business, Energy & Industrial Strategy [BEIS]. 2021 Government Greenhouse Gas Conversion Factors for Company Reporting Methodology Paper for Conversion Factors; Final Report; BEIS: London, UK, 2021.
  80. Research and Markets [RM]. Global Micro Combined Heat and Power (micro-CHP) Market 2021–2025; RM: Dublin, Ireland, 2022. [Google Scholar]
  81. Global Market Insights [GMI]. Micro Combined Heat and Power Market Statistics By Fuel—Industry Analysis Report, Regional Outlook, Competitive Market Share & Forecast, 2020–2026; GMI: Selbyville, DE, USA, 2020. [Google Scholar]
  82. Patterson, W. Transforming Electricity: The Coming Generation of Change; Earthscan: London, UK, 1999. [Google Scholar]
  83. Entchev, E.; Gusdorf, J.; Swinton, M.; Bell, M.; Szadkowski, F.; Kalbfleisch, W.; Marchand, R. Micro-generation technology assessment for housing technology. Energy Build. 2004, 36, 925–931. [Google Scholar] [CrossRef]
  84. Johnson, V.C.A.; Hall, S. Community energy and equity: The distributional implications of a transition to a decentralised electricity transition. People Place Policy 2014, 8, 149–167. [Google Scholar]
  85. Nikas, A.; Stavrakas, V.; Arsenopoulos, A.; Doukas, H.; Antosiewicz, M.; Witajewski-Baltvilks, J.; Flamos, A. Barriers to and consequences of a solar-based energy transition in Greece. Environ. Innov. Soc. Transit. 2020, 35, 383–399. [Google Scholar] [CrossRef]
  86. Brisbois, M.C. Decentralised energy, decentralised accountability? Lessons on how to govern decentralised electricity transitions from multi-level natural resource governance. Glob. Transit. 2020, 2, 16–25. [Google Scholar] [CrossRef]
  87. Rosato, A.; Ciervo, A.; Ciampi, G.; Scorpio, M.; Sibilio, S. Integration of micro-cogeneration units and electric storages into a micro-scale residential solar district heating system operating with a seasonal thermal storage. Energies 2020, 13, 5456. [Google Scholar] [CrossRef]
  88. Rosato, A.; Ciervo, A.; Ciampi, G.; Scorpio, M.; Guarino, F.; Sibilio, S. Energy, environmental and economic dynamic assessment of a solar hybrid heating network operating with a seasonal thermal energy storage serving an Italian small-scale residential district: Influence of solar and back-up technologies. Therm. Sci. Eng. Prog. 2020, 19, 100591. [Google Scholar] [CrossRef]
  89. Brandoni, C.; Renzi, M.; Caresana, F.; Polonara, F. Simulation of hybrid renewable microgeneration systems for variable electricity prices. Appl. Therm. Eng. 2014, 71, 667–676. [Google Scholar] [CrossRef]
  90. Entchev, E.; Yang, L.; Ghorab, M.; Lee, E.J. Performance analysis of a hybrid renewable microgeneration system in load sharing applications. Appl. Therm. Eng. 2014, 71, 697–704. [Google Scholar] [CrossRef]
  91. Yang, L.; Entchev, E.; Ghorab, M.; Lee, E.J.; Kang, E.C. Energy and cost analyses of a hybrid renewable microgeneration system serving multiple residential and small office buildings. Appl. Therm. Eng. 2014, 65, 477–486. [Google Scholar] [CrossRef]
  92. Balcombe, P.; Rigby, D.; Azapagic, A. Environmental impacts of microgeneration: Integrating solar PV, Stirling engine CHP and battery storage. Appl. Energy 2015, 139, 245–259. [Google Scholar] [CrossRef]
  93. Energy Saving Trust [EST]. Pathway Beyond Zero Carbon Homes; EST: London, UK, 2006. [Google Scholar]
  94. Ecoinvent. Ecoinvent Database [v3.8]; Ecoinvent: Zurich, Switzerland, 2021. [Google Scholar]
Figure 1. A schematic representation of a possible grid-connected ‘distributed generation’ network. The arrows represent the direction of electricity flows. Source: Reprinted with permission from Ref. [11]. 2008, UK Inst. Mech. Eng./SAGE.
Energies 15 06049 g001
Figure 2. Indicative energy and emissions balances for a modern natural gas-fired central heating boiler (of the condensing type) on a ‘full fuel cycle’ basis. NB: Energy industry use and distribution losses (i.e., small losses in production) currently account for 7% of natural gas supply according to DUKES [19].
Energies 15 06049 g002
Figure 3. Measured UK winter domestic electricity load profiles by house size (number of occupants). Source: Reprinted with permission from Ref. [18]. 2011, University of Nis—Faculty of Mechanical Engineering.
Energies 15 06049 g003
Figure 4. Simulated UK domestic gas demand profiles (pre-1970 dwellings). Source: Reprinted with permission from Ref. [18]. 2011, University of Nis—Faculty of Mechanical Engineering.
Energies 15 06049 g004
Figure 5. Schematic representation of the energy analysis process. Source: Hammond and Winnett [38]; adapted from Slesser [60]. Reprinted with permission from Ref. [38]. 2006, ICE Publishing.
Energies 15 06049 g005
Figure 6. The four main stages of environmental LCA. Source: Allen et al. [21]; adapted from the ISO [71]. Reprinted with permission from Ref. [21]. 2020, KeAi Communications.
Energies 15 06049 g006
Figure 7. Electricity and heat requirements for UK housing stock and potential mCHP plant outputs. Source: Reprinted with permission from Ref. [18]. 2011, University of Nis—Faculty of Mechanical Engineering.
Energies 15 06049 g007
Figure 8. Indicative energy and emissions balances for a micro-CHP system based on a natural gas-fired Stirling engine on a ‘full fuel cycle’ basis.
Energies 15 06049 g008
Figure 9. Indicative energy and emissions balances for a micro-CHP system based on a natural gas-fired internal combustion (IC) engine on a ‘full fuel cycle’ basis.
Energies 15 06049 g009
Figure 10. Indicative energy and emissions balances for a micro-CHP system based on a fuel cell (FC) with off-site industrial hydrogen reformer on a ‘full fuel cycle’ basis.
Energies 15 06049 g010
Figure 11. Overall and electrical efficiency for conventional and micro-CHP systems. Source: Reprinted with permission from Ref. [18]. 2011, University of Nis—Faculty of Mechanical Engineering.
Energies 15 06049 g011
Figure 12. CO2 emissions of each micro-CHP system type. Source: Reprinted with permission from Ref. [18]. 2011, University of Nis—Faculty of Mechanical Engineering.
Energies 15 06049 g012
Figure 13. Micro-CHP plant DCF levelised cost per kWh of fuel and installed hardware. Source: Reprinted with permission from Ref. [18]. 2011, University of Nis—Faculty of Mechanical Engineering.
Energies 15 06049 g013
Figure 14. Energy payback periods for a range of clustered micro-generators. Source: Reprinted with permission from Ref. [21]. 2020, KeAi Communications.
Energies 15 06049 g014
Figure 15. Carbon payback periods for a range of clustered micro-generators. Source: Reprinted with permission from Ref. [21]. 2020, KeAi Communications.
Energies 15 06049 g015
Figure 16. Discounted cost-benefit ratios for a range of clustered micro-generators. Source: Allen et al. [21].
Energies 15 06049 g016
Table 1. Overview of strengths and weaknesses of LCA *.
StrengthsWeaknesses
Holistic environmental appraisalStatic/Snapshot assessments
Established international standardsVariation in assessment due to value choice/methodological approaches
Procedural transparencyOnly predefined environmental impacts assessed
Allows level playing field for comparisonA target for sustainable activity not specified only embodied impacts quantified
Pinpoints environmental/inefficient hotspotsData quality
Springboard for communicationInaccessible results
* Source: Reprinted with permission from Ref. [40]. 2015, John Wiley & Sons.
Publisher’s Note: MDPI stays neutral with regard to jurisdictional claims in published maps and institutional affiliations.

