Article

State Characterization of Lithium-Ion Battery Based on Ultrasonic Guided Wave Scanning

1
College of Physics and Optoelectronic Engineering, Shenzhen University, Shenzhen 518060, China
2
Institute of Structural Health Management, Faculty of Civil Engineering and Mechanics, Jiangsu University, Zhenjiang 212013, China
3
Guangdong Laboratory of Artificial Intelligence and Digital Economy (SZ), Shenzhen University, Shenzhen 518060, China
*
Author to whom correspondence should be addressed.
Energies 2022, 15(16), 6027; https://doi.org/10.3390/en15166027
Submission received: 19 July 2022 / Revised: 16 August 2022 / Accepted: 18 August 2022 / Published: 19 August 2022
(This article belongs to the Special Issue New Advances in Battery Technologies)

Abstract

:
Accurate state characterization of batteries is conducive to ensuring the safety, reliability, and efficiency of their work. In recent years, ultrasonic non-destructive testing technology has been gradually applied to battery state estimation. In this paper, research on the state characterization of lithium-ion batteries based on ultrasonic guided wave (UGW) scanning is carried out. The laser Doppler vibrometer (LDV) and the X-Y stage are used to obtain the surface scanning UGW signal and the line scanning UGW signal of lithium-ion batteries under different states of charge and different aging degrees. The propagation law of UGWs in the battery is analyzed by surface scanning signals, then the energy spectrum of the signals is calculated, showing that the aging of the battery attenuates the transmission energy of UGWs. The “point” parameters are extracted from the scanning point signals. On this basis, the “line” parameters composed of line scanning multi-point signals are extracted. By analyzing the changing law of parameters during the charge–discharge process of batteries, several characteristic parameters that can be used to characterize the battery state of charge and state of health are obtained. The method has good consistency in the state characterization of the three batteries and provides a new approach for non-destructive testing and evaluation of battery states.

1. Introduction

Driven by the global energy crisis, environmental protection, and the policy of carbon neutrality and carbon peaking, electric vehicle technology with clean, efficient, and sustainable features has become the focus of the development of the world automobile industry [1]. Lithium-ion batteries have gradually become an ideal energy storage device for electric vehicles due to their advantages of high energy density, long cycle life, low environmental pollution, etc. [2]. However, during the long-term storage and charge-discharge process of lithium-ion batteries, batteries capacity decay, failure, etc., will occur, resulting in potential safety hazards [3]. Therefore, the accurate characterization and estimation of the battery state is beneficial to ensure the safe, reliable, and efficient operation of the system. In addition, it also provides a basis for the performance evaluation of retired batteries [4,5].
At present, in the battery state evaluation technology, the state of charge (SOC) and the state of health (SOH) of the battery are two states that attract much attention. They reflect the remaining capacity of the battery and the aging degree of the battery, respectively. In the traditional battery state characterization and estimation methods, it mainly depends on the battery electrical and thermal characteristic parameters [6,7]. These methods need to obtain information such as the voltage, current, and surface temperature of the battery over a period of time, which require a long test time, and is not conducive to improving the efficiency of battery state detection [8]. Additionally, for faulty batteries, there is a certain hysteresis in the measurement of electrical parameters. It is also not sensitive to side reaction processes, such as gas production and lithium evolution inside the battery.
In recent years, with the development of ultrasonic non-destructive testing technology, some scholars have applied this technology to the state characterization and evaluation of power batteries. Ultrasonic testing technology mainly uses the propagation characteristics of ultrasound in the medium to characterize, estimate and diagnose the characteristics of the medium. Lukas Gold et al. [9] used ultrasonic transmission wave detection technology to obtain ultrasonic signals penetrating lithium-ion batteries. The fast and slow wave components of the signal are analyzed using the Biot theory of multilayer saturated fluid media. The study found a linear correlation between the slow-wave delay time and battery SOC. In the charging case, the error of the obtained SOC estimation results is 3.5%. Jae-Yeon Kim et al. [10] analyzed the relationship between the amplitude and time-of-flight (TOF) of the ultrasonic reflected signal and the battery state. Ultrasonic signal energy decays as the battery ages. With the deepening of the aging degree of the battery, the hysteresis of the parameter change trend is more obvious. Purim Ladpli et al. [11] used ultrasonic guided wave (UGW) testing technology to detect lithium-ion pouch batteries. In the paper, the influence of the changes of electrode modulus and density on the UGW signal during the battery charge–discharge cyclic process was studied. Through the analysis of the amplitude and TOF of guided wave signal, it is pointed out that there is a clear correspondence between the two and the battery SOC and SOH. With the development of ultrasonic transducer technology, non-contact ultrasonic testing technologies, such as air-coupled ultrasonic technology and laser ultrasonic technology, have also begun to be applied in battery state characterization and evaluation. Guoqi Zhao et al. [
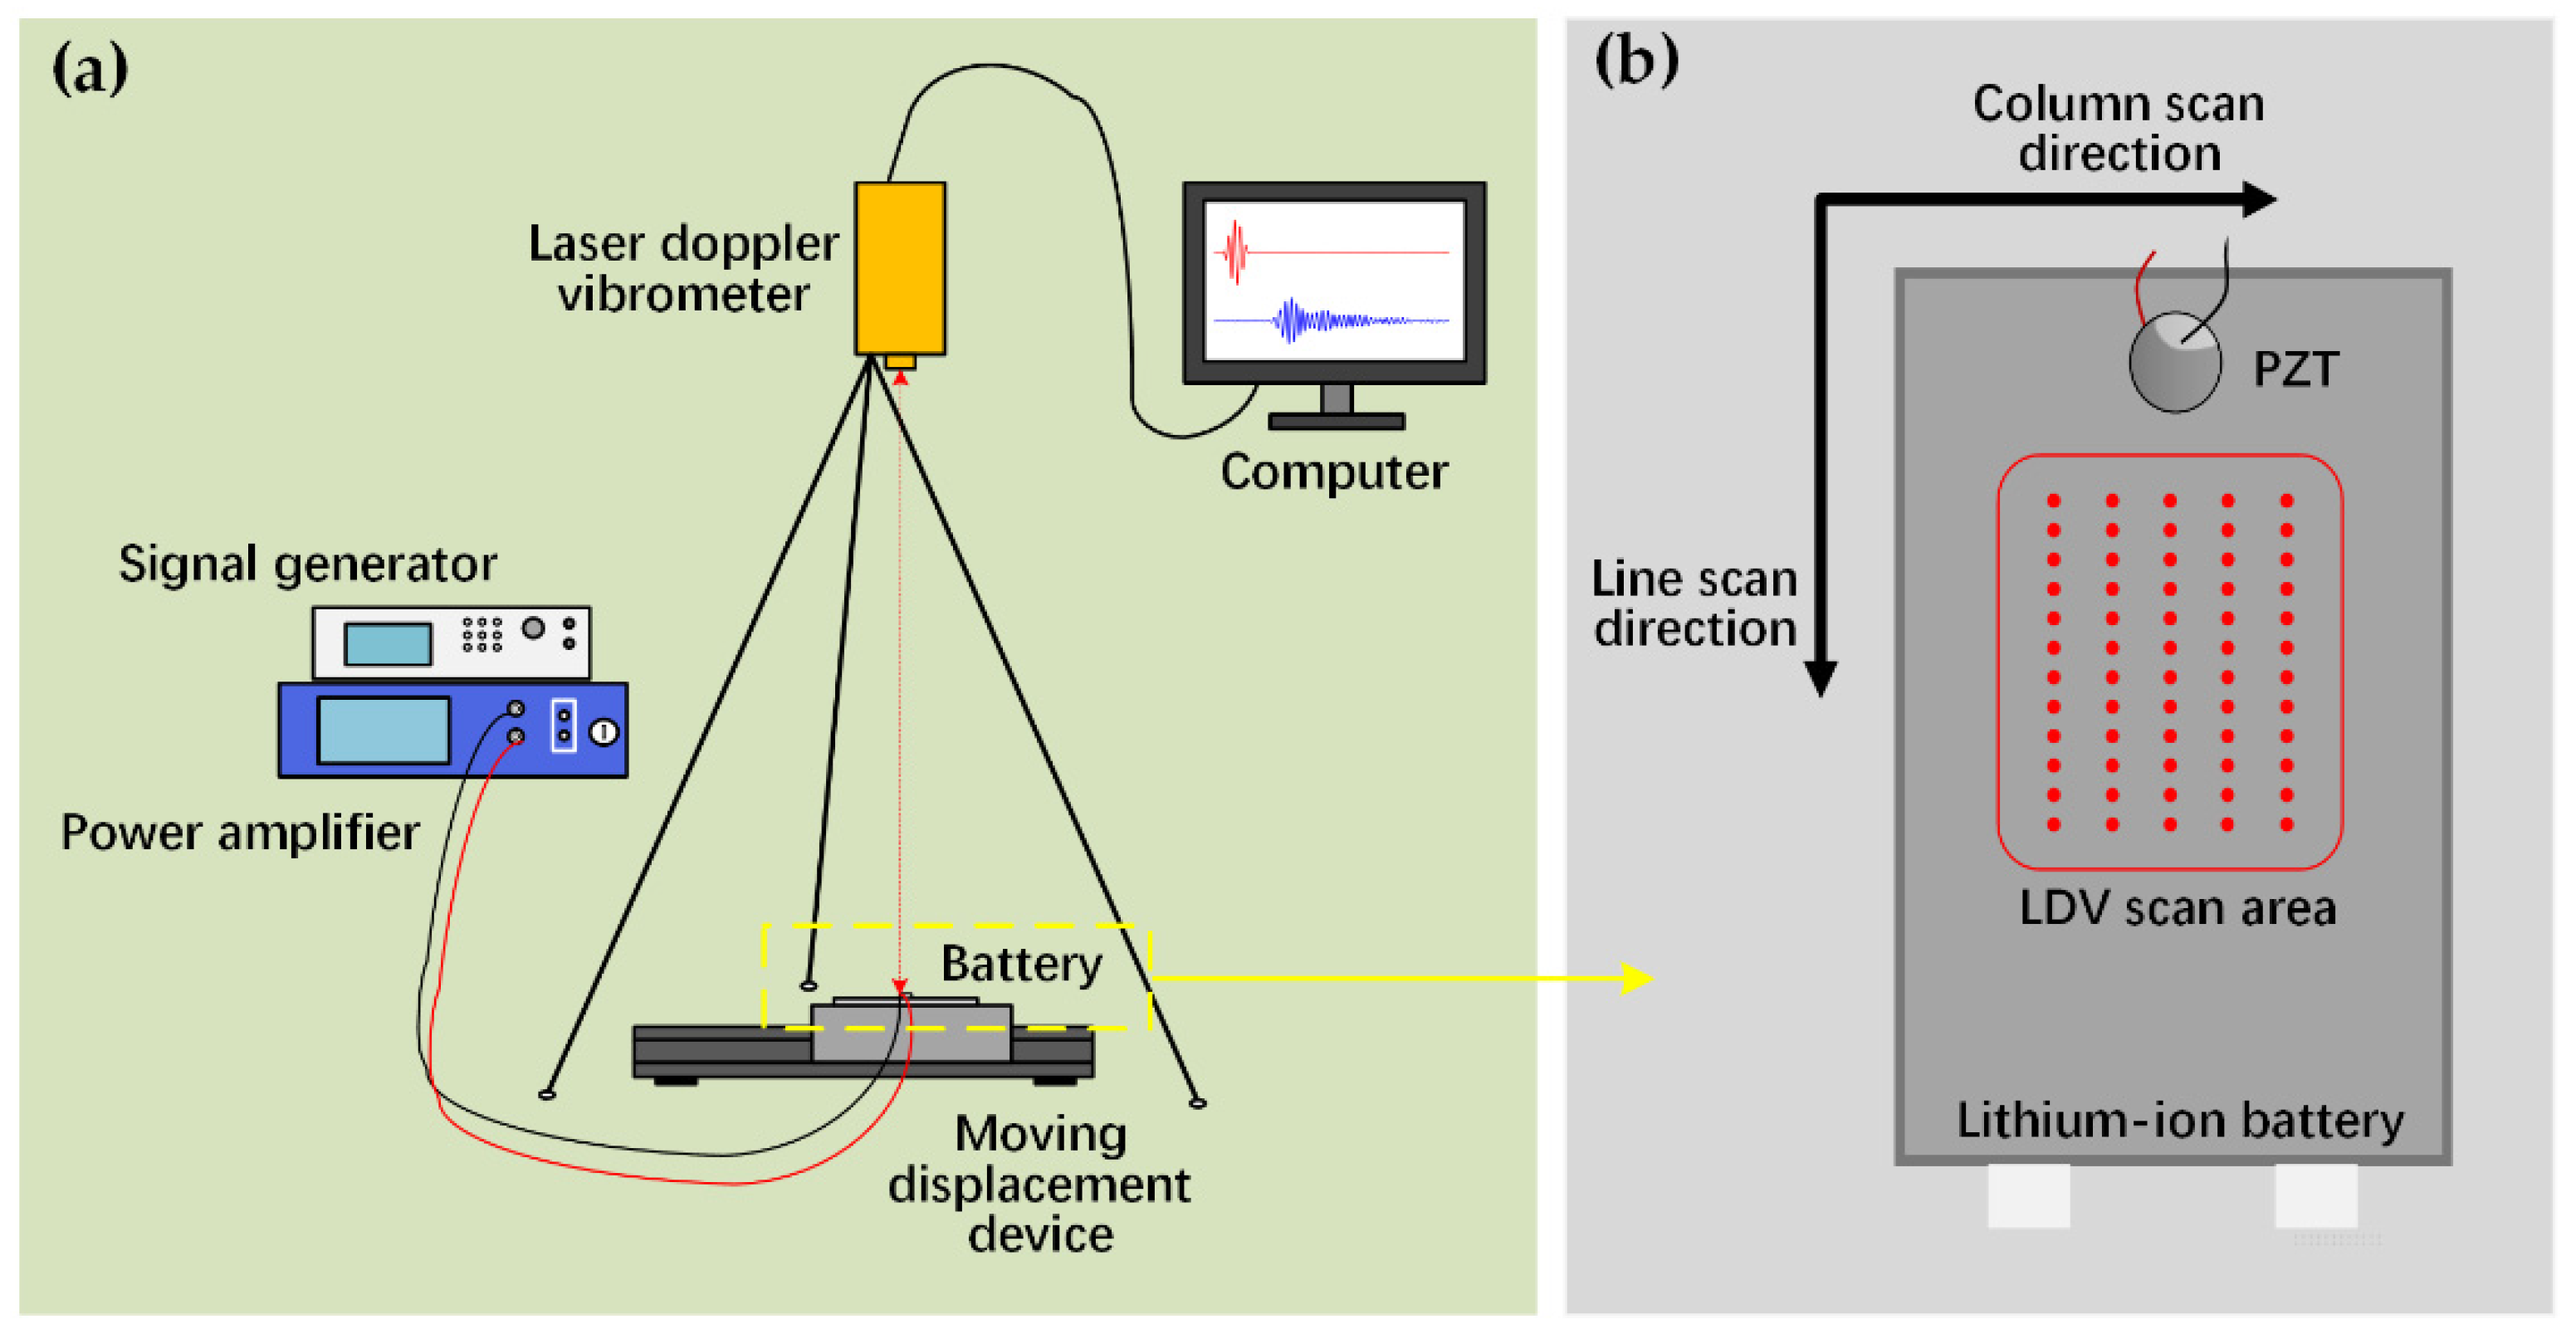
12] used a laser Doppler vibrometer (LDV) to detect the UGW signal propagating on a lithium-ion battery. Through the time-domain analysis, frequency-domain analysis, and time–frequency analysis of the signal, it was found that the signal amplitude, TOF, and power spectral density are in good agreement with the battery SOC. At the same time, the differential curve of the signal amplitude can effectively reflect the aging process of the battery. Shanpu Zheng et al. [
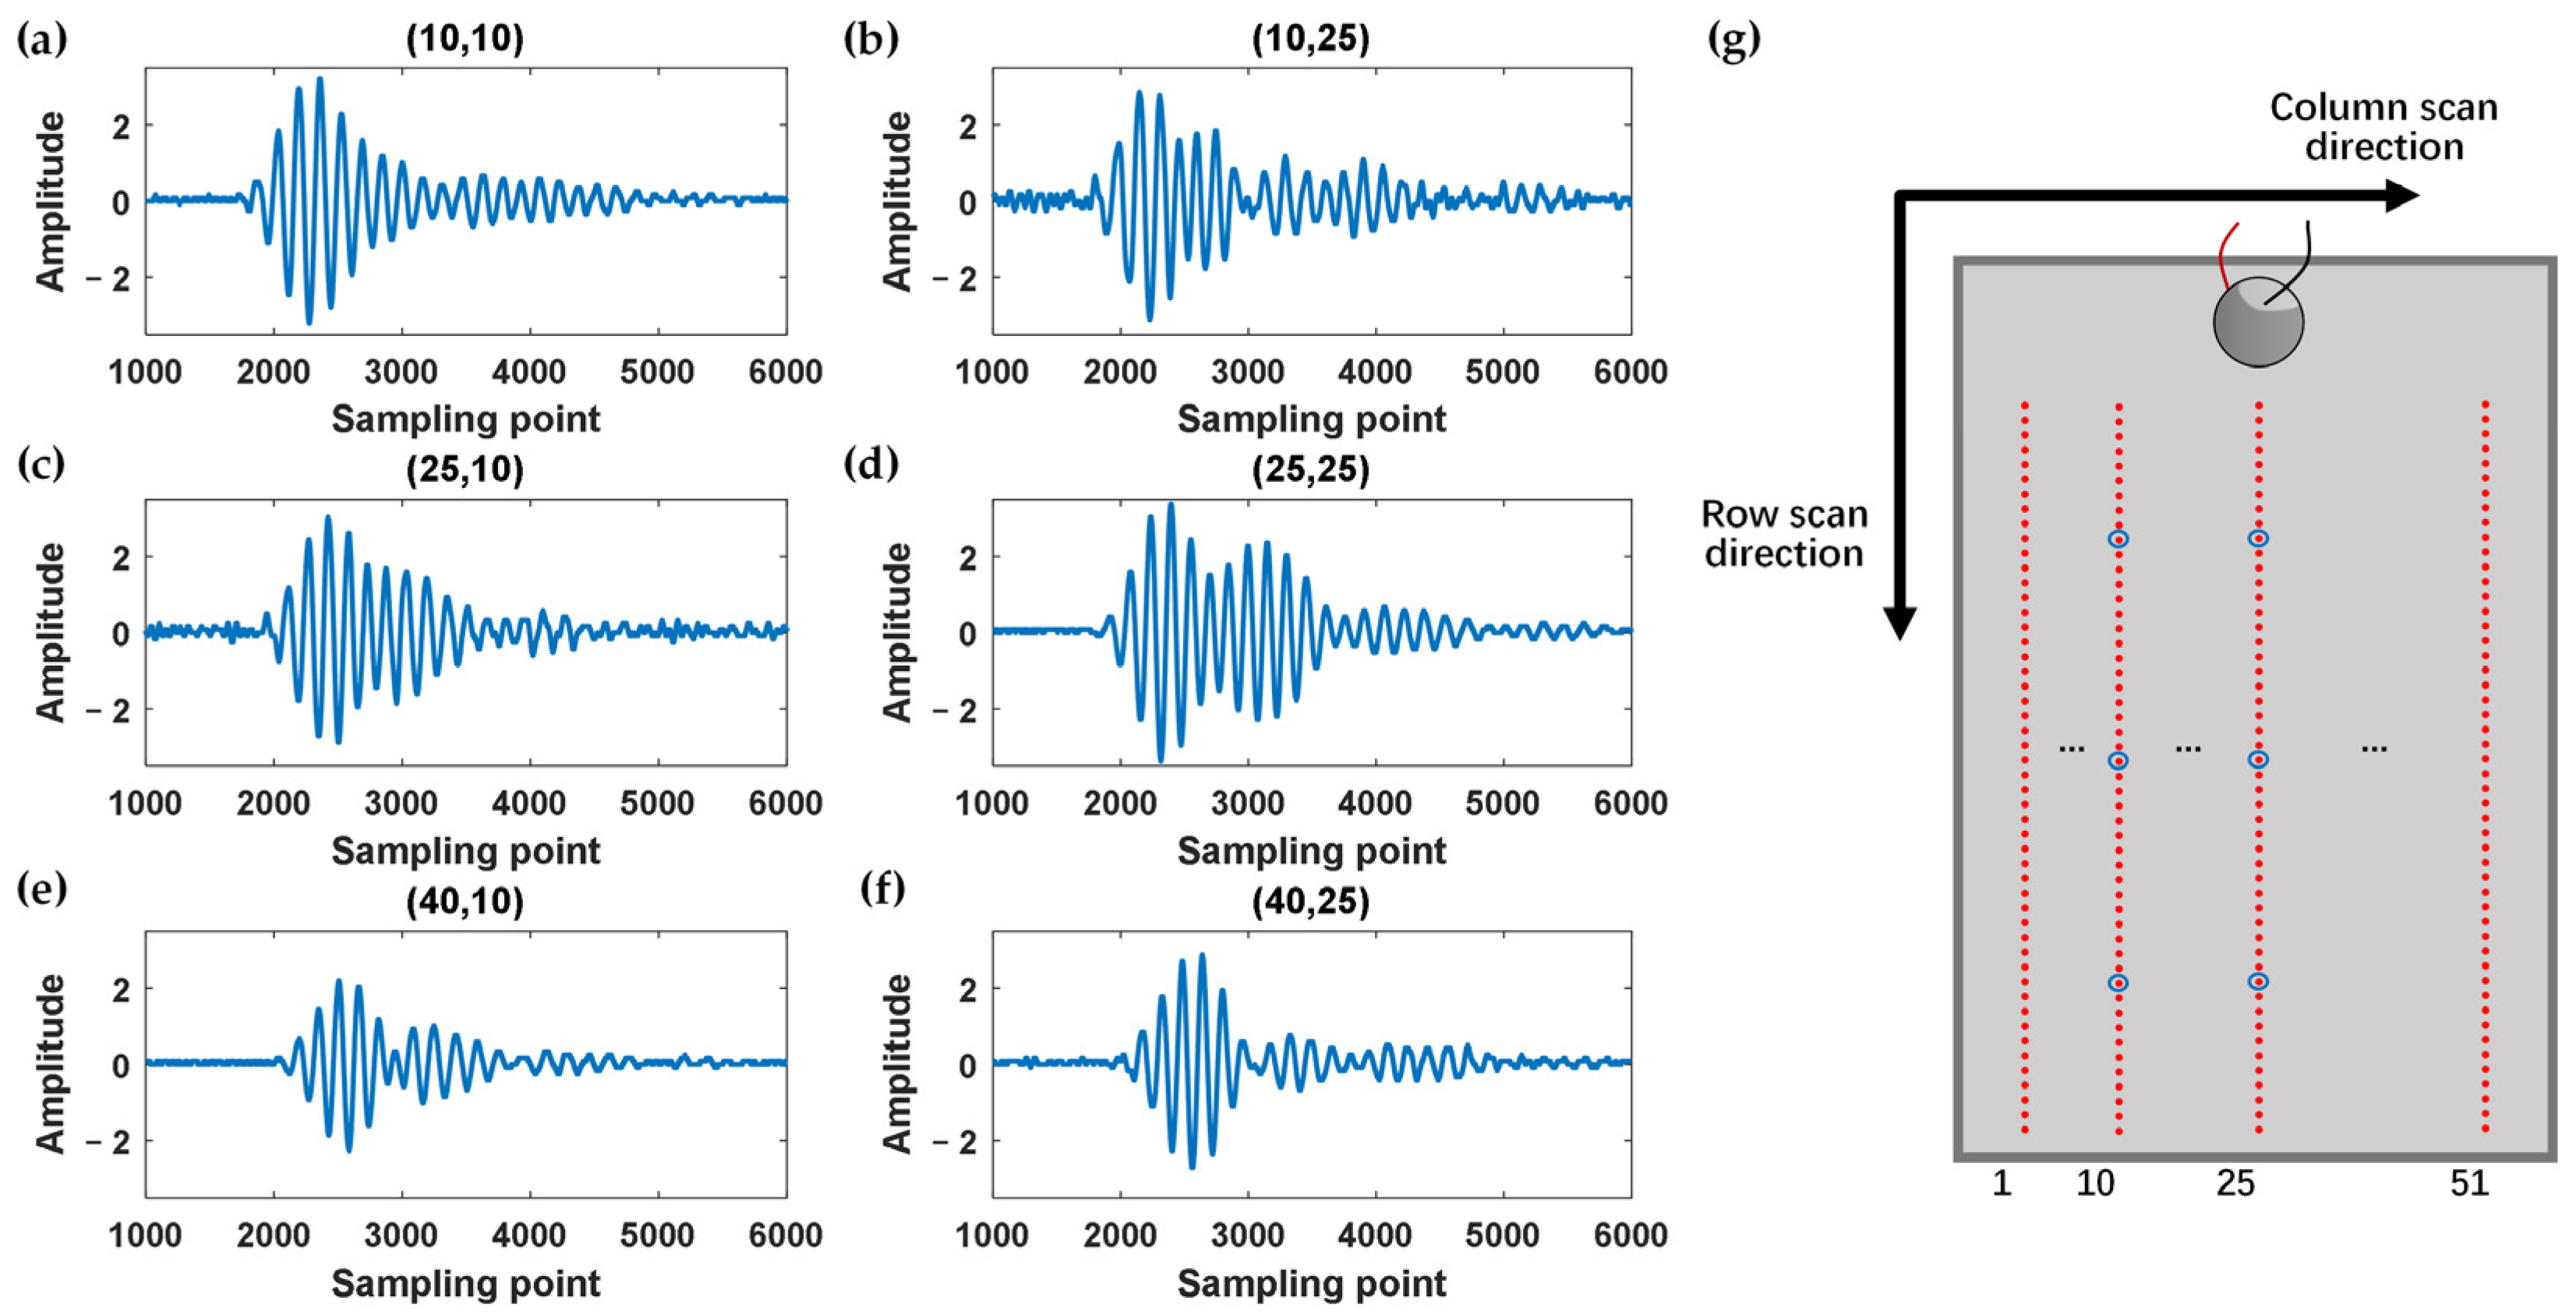
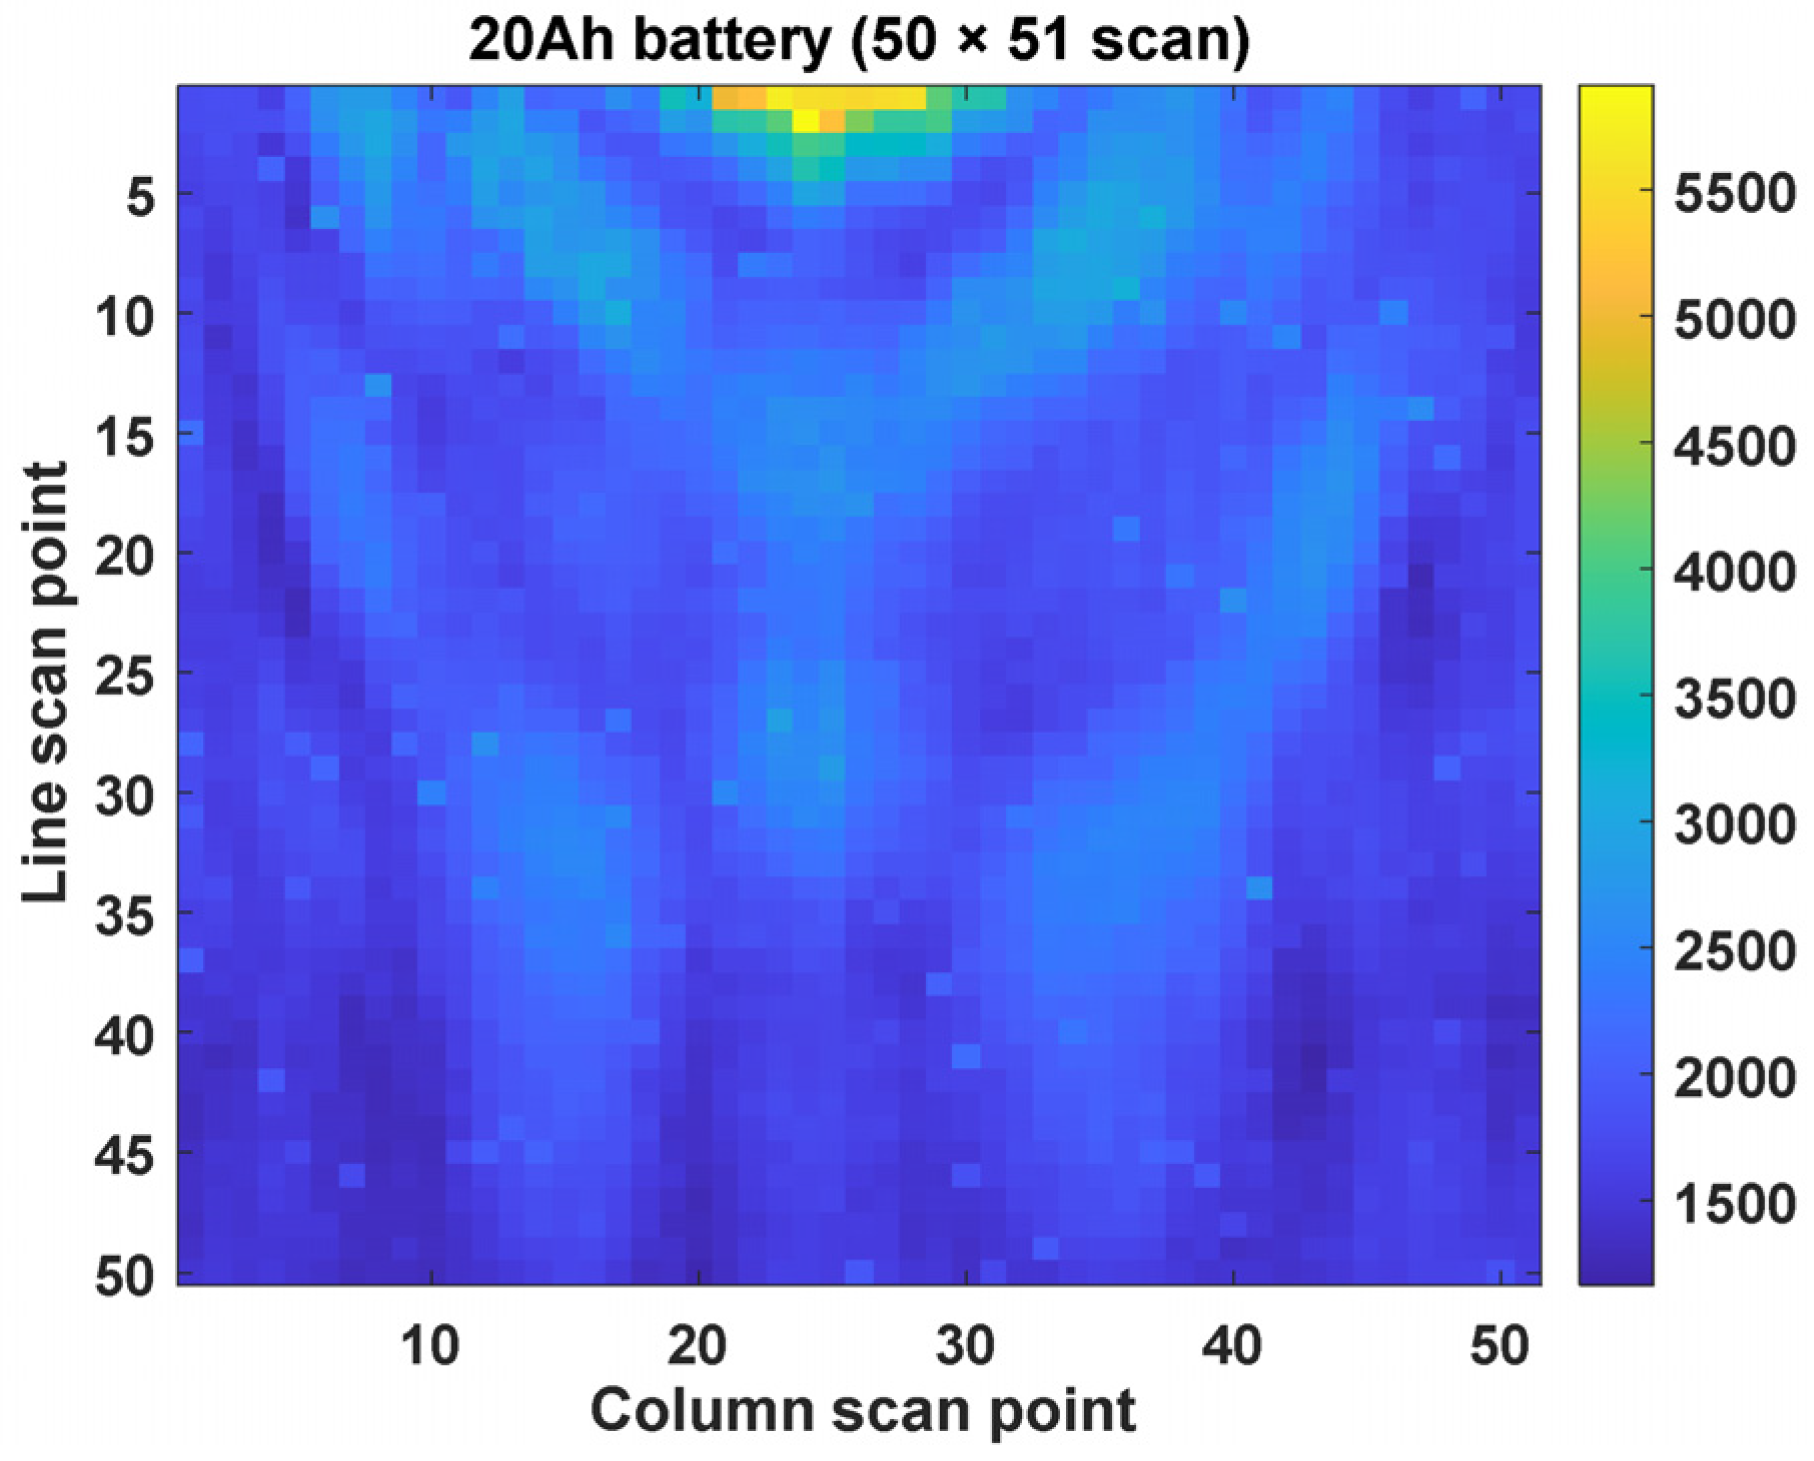
13] used LDV to perform area scan of fully charged lithium-ion batteries. The transient wave field diagrams at different moments during the UGW propagating inside the battery were obtained. The battery defects were observed using the spectrogram of the ultrasonic signal.
Ultrasonic non-destructive testing technology undoubtedly provides a new technical means for the state characterization and estimation of batteries. Compared with battery state characterization methods based on electrical and thermal parameters, ultrasonic testing can greatly shorten the battery testing time. Moreover, the ultrasonic signal is more sensitive to faults, such as battery gas production, which is conducive to the identification of battery faults. Nevertheless, there are still some problems and difficulties in the ultrasonic testing technology of power batteries. For example, ultrasonic testing has high requirements on environmental stability, the reliability of single-point testing results is low, the testing method needs to be further improved, etc. Furthermore, in ultrasonic signal analysis, it mainly depends on signal peaks and TOF. The characteristic parameters are relatively simple. Thus, it is urgent to explore more reliable ultrasonic detection methods and more effective ultrasonic signal characteristic parameters to increase the robustness of the battery state characterization and estimation, as well as reducing the influence of environmental noise on the evaluation results of ultrasonic signals. Additionally, the multi-layered, solid-liquid mixed, finite boundary structure of the battery should be fully considered. More in-depth analysis of the ultrasound signal is required.
In this paper, the state detection and characterization of the lithium-ion pouch battery is carried out by means of non-contact UGW scanning. In Section 2, the formation of UGW signal and its propagation in finite boundary medium are introduced. The characteristic parameters extracted from single-point and line scanning multi-point UGW signals are listed. In Section 3, the UGW surface scanning experiments, line scanning experiments, and battery cycle charge and discharge experiments are introduced. In Section 4, based on the extracted ultrasonic characteristic parameters, the experimental data of UGW scanning in battery charge-discharge process are processed and analyzed, and the results are discussed.

2. Methods

2.1. UGW Propagation in Lithium-Ion Batteries

Ultrasound is a mechanical wave with a frequency higher than 20 kHz. Its propagation is essentially the propagation of particle vibration, and there are two propagation forms: longitudinal waves (also known as compression waves, P waves) and transverse waves (also known as shear waves, S waves). The longitudinal wave propagates in the same direction as the particle’s vibration direction, while the transverse wave propagates in the direction perpendicular to the particle’s vibration direction. These two waves propagate independently of each other, and no waveform coupling occurs. When ultrasonic waves are in a limited boundary or inhomogeneous medium, multiple reflections will occur between discontinuous interfaces. Then complex waveform transformation, interference, and geometric dispersion occur, and finally UGWs are formed. Here, a medium that guides the propagation of waves is called a waveguide. Waveguides with different structures will form different forms of UGWs. UGWs formed in planar waveguides are called Lamb waves. As shown in Figure 1, when the ultrasonic wave propagates in the planar waveguide, the ultrasonic wave undergoes multiple reflections and waveform conversions between the upper and lower interfaces of the surface plate, generating new wavelets (including longitudinal waves and transverse waves). The superposition group of these wavelets is guided by the plate structure and propagate along the direction parallel to the interface. As the propagation distance and propagation time increase, different positions of the plate have different Lamb wave envelopes.
Lamb wave has the characteristics of frequency dispersion and multi-mode. Generally, the modes are divided into the A-type antisymmetric type and S-type symmetric type, and each type of mode contains multi-order components. The symmetric and antisymmetric modes of Lamb waves are expressed by Rayleigh–Lamb equations [14]:
t a n k s b t a n k L b = 4 k 0 2 k L k s k 0 2 k s 2 2  
t a n k s b t a n k L b = k 0 2 k s 2 2 4 k 0 2 k L k s
k L 2 = ω c L 2 k 0 2   k s 2 = ω c s 2 k 0 2
Equations (1) and (2) represent the symmetric mode and the antisymmetric mode, respectively, k 0 is the wave number in the horizontal direction, b is the 1/2 plate thickness, ω is the angular frequency, c L is the longitudinal wave velocity, and c s is the shear wave velocity. The wave equation determines the multi-mode and frequency dispersion properties of Lamb waves.
In the principle of acoustics, the ratio of the sound pressure at a point in the sound transmission medium to the vibration velocity of the particle is defined as the acoustic impedance rate of the point, generally expressed by Z (unit: rayls). The magnitude of the acoustic impedance is related to the quality, density, and sound speed of the sound transmission medium. For medium 1 and medium 2 with unequal acoustic impedances, when an acoustic wave is incident from medium 1 perpendicular to the interface to medium 2, the energy transfer at the interface depends on the acoustic impedance parameters of the two media [15]:
γ I = Z 2 Z 1 2 Z 2 + Z 1 2  
t I = 1 γ I = 4 Z 2 Z 1 Z 2 + Z 1 2
where γ I and t I are the reflection coefficient and transmission coefficient of the sound intensity, respectively, and Z 1 and Z 2 are the acoustic impedance ratios of the two media, respectively. According to Equation (3), when Z 2     Z 1 or Z 2     Z 1 , γ I approaches 1, the sound wave will be 100% reflected on the boundary. In addition, when considering the thickness of the medium, the transmission coefficient of the sound intensity can also be expressed as
t I = 4 4 c o s 2 k 2 D + Z 2 Z 1 + Z 1 Z 2 2 s i n 2 k 2 D
where D is the thickness of the medium 2. Among Equation (6), k 2 D = 2 π D λ ( λ is the wavelength of the incident acoustic wave). When D is much smaller than the half wavelength of the incident acoustic wave, t I ≈ 1, at this time, the incident sound wave will penetrate completely from the boundary into the medium 2. It follows that the material properties, size, etc., of the medium determine the reflection and transmission of sound waves propagating in the medium.
The lithium-ion pouch battery uses aluminum–plastic film as the outer packing, which is mainly composed of positive and negative electrodes, electrolyte, separator, and outer shell. The battery cells are stacked layer by layer in the order of negative plate, separator, positive plate, and separator, and the internal ion transmission during charge/discharge process of the battery is realized by means of electrolyte infiltration. Finally, the tabs of the battery are drawn out by welding. When using an appropriate frequency excitation source, the UGWs with millimeter wavelength can be excited in the battery. According to Equation (6), the thickness of each single-layer material inside the battery is much smaller than the half wavelength of the excited UGWs, and the propagation of the UGWs between the layers of materials in the battery is regarded as full transmission. The overall thickness of the lithium-ion pouch battery used in this paper is in the order of millimeters. The thickness of the positive and negative electrode single-layer pole pieces and the single-layer separator in the battery are all in the micrometer scale. According to relevant information [14], the acoustic impedance of aluminum is 169 × 104 rayls, and the acoustic impedance of air is 39.5 rayls. When the UGWs are transmitted to the boundary of the battery, since the acoustic impedance of the air is much smaller than the aluminum–plastic film outer shell of the battery, the UGWs will be completely reflected. The upper and lower planes of the battery outer shell are equivalent to the upper and lower interfaces of the planar waveguide. When a lithium-ion battery undergoes a charge–discharge cycle, its internal structure changes periodically with the change of the battery SOC. For example, during the increase in the battery SOC, lithium ions are continuously intercalated into the graphite anode, then the volume of the graphite anode gradually expands, and the porosity changes accordingly. Given all of that, the UGWs propagating in lithium-ion batteries carry information related to the structural changes of lithium-ion, which is closely related to the SOC and SOH of the battery.

2.2. Characteristic Parameters of UGW Signal

2.2.1. Characteristic Parameters of Single-Point UGW Signal

At one point on the surface of the battery, the UGW signal at that position can be obtained by the ultrasonic transducer. In order to quantify the UGW signal, it is necessary to process the single-point signal to extract characteristic parameters, which are referred to as “point” parameters in the following [16,17,18].
The extracted “point” parameters are shown in Table 1. In the characterization of the time-domain waveform, the maximum amplitude of the time domain signal is first extracted, as shown in Equation (7). Secondly, the time-domain signal amplitude is time integrated to obtain the energy of the time domain waveform, as shown in Equation (8). On this basis, the time-domain centroid of the signal is further calculated, as shown in Equation (9). This characteristic parameter represents the overall movement of the time domain waveform of the signal on the time axis. The smaller the value, the more forward the waveform. In addition, considering the signal sampling length and the signal amplitude corresponding to each sampling time, the shape coefficient of the signal is calculated, as shown in Equation (10). This characteristic parameter represents the distribution of the time domain waveform of the signal on the time axis. The smaller the value, the wider the distribution of the signal on the time axis. Set the amplitude threshold of the ultrasonic excitation signal and the received guided wave signal, respectively. According to the sampling time, when the two reach their own threshold, the TOF of the signal is calculated and obtained, as shown in Equation (11). Fourier transform is performed on the signal to obtain the frequency domain information of the signal, and the intensity of the main frequency components of the signal spectrum is extracted, as shown in Equation (12).
In Table 1, A is the amplitude of the time domain signal, t is the time, [ a ,   b ] is the time domain integration interval, N T is the total number of samples of the time domain signal, N e t h r and N r t h r are the sampling moments corresponding to the amplitudes of the ultrasonic excitation signal and ultrasonic guided wave receiving signal reaching the set amplitude threshold, respectively. T is the total sampling time, and S is the spectrum after Fourier transform of the ultrasonic signal.

2.2.2. Characteristic Parameters of Line Scanning UGW Signal

The line scanning UGW signal consists of ultrasonic signals at multiple positions on the scan line. The scanning result not only includes the propagation information of the signal in the time domain, but also includes the spatial position information composed of multiple scanning points. Based on the extraction of “point” parameters, the “point” parameters of each point in the ultrasonic line scanning process are comprehensively utilized to construct the characteristic parameters of the line scanning UGW signal. These characteristic parameters of line scanning signal are called “line” parameters later.
The “line” parameters are shown in Table 2. The waveform index indicates the fluctuation degree of the “point” parameter value on the scan line. The smaller the value, the smaller the fluctuation. The kurtosis coefficient represents the peak sharpness of the “point” parameter value on the scan line. The smaller the value, the more evenly the “point” parameter values are distributed on the scan line. The larger the value, the more concentrated the signal strength distribution. The dispersion coefficient represents the dispersion degree of “point” parameter values in locations. The smaller the value, the smaller the dispersion. The shape coefficient represents the distribution of the “point” parameters at each position on the scan line. The slope of TOF is related to the propagation velocity of the guided wave signal. The smaller the value, the greater the wave velocity. The mean of time domain centroids is also related to the propagation speed of the guided wave signal.
In Table 2, N L is the total number of scanning points of the line scanning signal, P i is the “point” parameter value extracted from the guided wave signal of the i - th scan point on the line scanning signal, and c d ¯ is a certain length line segment of the scan line.
Through the combined calculation of the “point” parameter and the “line” parameter, the candidate characteristic parameters that characterize the state of the battery are obtained. Then the parameter combination with high correlation with battery SOC and SOH is determined by correlation analysis.

3. Experiments

3.1. Experimental System and Tested Object

The composition of UGW signal scanning system for lithium-ion batteries is shown in Figure 2a. The system includes an ultrasonic signal generator, power amplifier, piezoelectric transducer, LDV, mobile displacement device and computer. The specific information of the equipment is listed in Table 3. Figure 2b is a schematic diagram of scanning a lithium-ion pouch battery. Piezoelectric transducer can stably excite the same ultrasonic wave and realize synchro-nous operation with LDV and mobile displacement device through an external trigger. The LDV is fixed during scanning. The mobile displacement device is used to make the battery produce displacement relative to the LDV. At the same time the LDV measures the micro out-of-plane displacement on the surface of the lithium-ion battery, achieving the scanning of the lithium-ion battery and the UGW signal acquisition.
The experimental object of this paper is three lithium iron phosphate batteries with a capacity of 20 Ah. The specific parameters are shown in Table 4.

3.2. UGW Scanning Experiments of Lithium-Ion Battery

3.2.1. Analytical Experiment of UGW Propagation Characteristics in Lithium-Ion Batteries

In order to obtain the propagation characteristics of UGWs in the battery, the UGW surface scanning experiment as shown in Figure 2 is carried out on the battery. Place the battery on the mobile displacement device. A sound-absorbing sponge is placed between the battery and the displacement device to reduce environmental interference. The piezoelectric transducer is fixed on the lower surface of the battery after being coated with a couplant. A five-period sinusoidal signal modulated by a Hanning window is used as the ultrasonic excitation signal. The scan scale is 50 × 51 points.

3.2.2. Line Scanning Experiment of Lithium-Ion Battery

In order to explore the relationship between the ultrasonic characteristic parameters and the different SOC and SOH of the battery, the ultrasonic signals of the batteries in different states are collected by means of line scanning. During this process, the ultrasonic excitation transducer is affixed to the geometric center of the cell surface. Take the center line parallel to the long side of the battery for scanning.

3.2.3. Aging Analysis Experiment of Lithium-Ion Battery

When the ultrasonic excitation transducer is arranged in different positions, the propagation path of guided waves will also be affected. When it is arranged on one side of the battery, the UGW is excited by that which will reach the battery boundary first, then boundary reflection will occur. In order to weaken the influence of battery boundary reflection on signal analysis, the ultrasonic excitation transducer is placed at the geometric center of the battery surface. Finally, UGW surface scanning experiments are carried out on batteries under different aging conditions.

3.3. Battery Characteristics and Cycle Aging Experiment

Arbin battery tester is used to conduct charge and discharge experiments on the battery. The battery charge mode is CC-CV, and the discharge mode is CC; both charge and discharge current rate are 0.5 C. The experimental test temperature is 25 °C. The three batteries used in the experiment are numbered as B0, B1 and B2, respectively. Among them, 18 charge–discharge cycles were performed on the B2 battery. In each charge–discharge cycle, line scanning UGW signals with a scan scale of 150 × 1 points were collected at every 5% SOC. As for B0 battery and B1 battery, accelerated aging experiments with more than 200 charge–discharge cycles were carried out on them. In the 1st, 6th, 10th, 111st, 161st, and 211st charge–discharge cycles of the B0 battery (corresponding to the battery SOH of 100%, 100%, 100%, 86.74%, 86.12%, and 85.15%, respectively), the acquisition of line scanning UGW signals with a scan scale of 45 × 1 points were performed every 12 min. During the 1st, 100th, 151st, and 200th charge–discharge cycles of the B1 battery (corresponding to the battery SOH of 100%, 88.84%, 88.78%, and 85.17%, respectively), the surface scanning UGW signals with a scan scale of 45 × 9 points were collected every 12 min, and the line scanning UGW signals were extracted from the center line of each corresponding surface scanning signals.

4. Results and Discussion

4.1. UGW Propagation Characteristics Experiment Results and Analysis

Figure 3 shows a graph of the signal intensity of UGWs at different times when propagating in a lithium-ion battery. From Figure 3a,b, the guided wave propagates uniformly around the excitation source, and the propagation plane presents a smooth arc. During this period, no reflection occurs, and the two arc envelopes formed in the propagation of the ultrasonic signal are clearly visible. At moment Figure 3c, an irregular arc appears in the signal intensity diagram, which indicates that the UGW has propagated to the battery boundary and has been reflected. According to the location of the arc, it can be judged that the reflection of the signal comes from the boundary of the left and right sides of the battery. Next, the boundary reflection of the signal at moment Figure 3d is further enhanced. From Figure 3e–h, complete and continuous circular arc waveforms can hardly be observed in the ultrasonic signal intensity diagrams. The UGW signal presents a complex scattering shape, and the signal intensity exhibits non-uniform and rapid attenuation. To sum up, the UGW travels in a straight line in the battery. When it propagates to the boundary of the battery, the reflected wave and the direct wave are superimposed, and a series of complex interference phenomena occur, which accelerates the signal attenuation.
Figure 4 shows the time domain signals of UGWs at different positions of the battery. It can be obtained that with the increase in the propagation distance of the UGW, the TOF of the signal becomes longer, the overall amplitude decreases, the envelope gradually elongates, and the different mode components of the guided wave are gradually separated from a single envelope. In addition, the time and degree of reflection influence of the battery boundary at different positions are different. It means that extracting only the UGW signal at a single position of the battery for analysis has great randomness, which can easily make the inconsistency of the signal analysis results worse.
Figure 5 is the signal energy spectrum of the surface scanning result of the B0 battery. Comparing Figure 5 with the scanning result of Figure 3e, it can be found that the two have very similar waveforms, which means that the signal energy spectrum can characterize the propagation law of the UGW surface signal in the battery.

4.2. Comparative Analysis of UGW Scanning Results of Different Battery SOC

By scanning the B2 battery, several “point” parameters are extracted from the one-dimensional UGW time domain signal. Then the relationship between “point” parameters and battery SOC is analyzed. Figure 6 shows the results of the time-domain peak value of the signals changing with the battery SOC at point 33 and point 36 in the scanning area. For the same position, the time domain peak value of the UGW signal is basically consistent with the change trend of the battery SOC during the multiple charge/discharge processes of the battery. However, comparing the two positions, the trends of the “point” characteristic parameters at point 33 and point 36 are obviously different with the change of the battery SOC. The calculation results have greater randomness, while the two points are only about 3 mm apart. This shows that if the characteristic parameters are only extracted from the ultrasonic signal of a single position, the parameters will vary greatly with the different scanning positions, and the change of the battery state cannot be well reflected.
Based on the extraction of “point” parameters, the “line” characteristic parameters are further calculated for the UGW line scanning results. By combining the characteristic parameters and further screening the stability of the characteristic parameters, 11 groups of characteristic parameters with high correlation with the battery SOC are obtained. These characteristic parameters are listed in Table 5.
Figure 7 shows the changes of four groups of characteristic parameters with the charge–discharge process of the battery. From the changing trend of characteristic parameter values, the trend of different characteristic parameters with the change of the battery SOC presents different characteristics. However, for a certain characteristic parameter, it shows good consistency in multiple charge–discharge processes. The variation range of each characteristic parameter is within the same interval during the 18 charge–discharge cycles. By comparing the figures of the left and right columns, it can be found that the change trends of the same characteristic parameter during the charge process and discharge process of the battery are also different, which are not completely symmetrical.
Figure 8 shows the Pearson correlation coefficient between the characteristic parameters and the battery SOC as well as between characteristic parameters. It can be found that, except for the characteristic parameter h, the correlation coefficient between the characteristic parameters of the battery discharge process and the battery SOC is smaller than that of the charge process. It is worth noting that the Pearson correlation coefficient only describes the linear correlation, and its value cannot be completely equal to whether the characteristic parameters are correlated with the battery SOC. For example, although the average correlation coefficient between the characteristic parameter b and the battery SOC is only 0.3324, it can be seen from Figure 7d that there is an obvious correlation between the characteristic parameter and the battery SOC. In addition, it can be seen from Figure 8 that the correlation coefficients between the characteristic parameters a and c, e and g, and i and k are all 1. This phenomenon shows that when the “point” parameters are used to construct the “line” characteristic parameters, the calculation results of the waveform index and dispersion coefficient are consistent. Therefore, when characterizing the battery state, only one of these two “line” characteristic parameters needs to be selected. Finally, eight sets of characteristic parameters that characterize the battery SOC can be obtained. They are, respectively, “EIT + WaveIndex”, “EIT + KurtosisC”, “meanTime + M”, “log(ShapeC) + WaveIndex”, “log(ShapeC) + KurtosisC”, “TOF + K”, “maxSpec + WaveIndex”, and “maxSpec + KurtosisC”.
In order to compare the stability and accuracy of the “point” parameters and the “line” characteristic parameters of the line scanning ultrasonic signal in the characterization of the battery SOC, the dispersion analysis of the two types of characteristic parameters is carried out here. In this paper, the standard deviation is used to measure the degree of dispersion of the data. For the “point” parameters, normalize the data firstly, and then calculate the standard deviation of the parameters corresponding to the same SOC in the process of multiple charge–discharge cycles. The paper only lists the standard deviation calculation results of the values of two “point” parameters—time domain peak and TOF at the 33rd, 36th, 65th, and 100th scanning points. For the “line” characteristic parameters, this paper counted the calculation results of parameters b and h, as shown in Table 6.
Table 6 derives that the standard deviation of the “point” parameters varies greatly with different scanning positions. Moreover, in most cases, the standard deviations of the “point” parameters at each SOC value will fluctuate greatly with the different SOC of the battery. It illustrates the instability of the “point” parameters, which has low reliability in characterizing the battery SOC. According to the calculation results of the “line” characteristic parameters, the standard deviations of the “line” characteristic parameters are almost the same. It follows that the “line” characteristic parameters are more stable and have higher accuracy in characterizing the battery SOC.
On this basis, the random forest algorithm [19,20] is used to estimate the SOC of the battery. The first 13 of the 18 groups of characteristic parameter data in the battery charging process are used as the training set of the model, and then the last 5 groups of characteristic parameter data are used as the input of the test set to obtain the SOC estimation result. Figure 9 shows the estimation results of the battery SOC during the charging process. In Figure 9a, SOC estimation is performed using eight “line” characteristic parameters. In Figure 9b, four of the eight “line” characteristic parameters with a higher Pearson correlation coefficient with the battery SOC are used for estimation. By analogy, Figure 9c shows the SOC estimation result, using only two “line” characteristic parameters. In order to compare the quality of “line” characteristic parameters and “point” characteristic parameters in characterizing the battery SOC, two “point” characteristic parameters of a point scanning signal are used to estimate the battery SOC. Figure 9d shows the SOC estimation result of two “point” characteristic parameters of the 33rd scan point on the scan line. Table 7 lists the errors of the SOC estimation results obtained by the model based on different training sets.
In summary, the line scanning UGW signal comprehensively reflects the UGW information at different positions of the battery, which weakens the randomness of single-point scanning and has better stability. “Line” characteristic parameters are more suitable for the characterization of the battery SOC.

4.3. UGW Scanning Results under Different Battery SOH

Figure 10 shows the surface scanning results of the UGW of the B1 battery under four different aging degrees. It can be found that with the aging of the battery, the energy of the UGW signal decays rapidly during the propagation process. This is related to a series of irreversible electrochemical reactions that occur during battery aging. During the aging process of the battery, the structure and materials of the battery change [21], which strengthens the scattering attenuation and absorption attenuation of the medium to the UGW signal, and finally enhance the reduction degree of the UGW transmission energy. Therefore, the energy spectrogram of the UGW signal can be the basis for evaluating the aging degree of the battery.
The “line” characteristic parameters are calculated for the line scanning UGW signals of the B0 and B1 batteries, respectively. The characteristic parameters related to the battery aging degree are obtained, as shown in Table 8.
The results of the three groups of characteristic parameters changing with the battery SOC under different aging states of the battery are shown in Figure 11.
Figure 11a,b corresponds to the change of the “line” characteristic parameter—slope of TOF during the charge process and discharge process of the B0 battery, respectively. The value of the slope is negatively correlated with the wave speed of the UGW. With the deepening of the aging degree of the B1 battery, the absolute values of the slope of TOF during the charge–discharge process of the battery increase overall. It suggests that the propagation speed of the UGW signal decreases continuously with the aging. At the same time, during the battery charge process, the slope value gradually decreases as the SOC increases. It shows that the propagation speed of UGW increases with the increase in the battery SOC. Compared with the battery SOC, the aging state of the battery has a greater impact on the propagation speed of the UGW signal. With the deepening of the aging degree, the influence of the battery SOC on the guided wave propagation velocity also gradually expands.
Figure 11c,d respectively shows the changes of the “line” characteristic parameter—“frequency spectrum peak + waveform index” during the charge process and discharge process of the B0 battery. Before the aging of the battery, the value of this characteristic parameter is relatively low, and the frequency spectrum peaks of the ultrasonic signals at each scanning point have small fluctuations with different positions. However, when the number of cycles is greater than 100, the value of this characteristic parameter increases significantly. The frequency spectrum peak of each scanning point has large fluctuation. This phenomenon shows that as the battery ages, the differences in the ultrasonic signals at different positions of the battery become larger. Similarly, comparing the variation range of characteristic parameter values in the entire SOC range of the battery, battery aging also increases the influence of the battery SOC on the change of parameter values. In addition, the change trend of characteristic parameters with SOC in the later stage of battery aging presents the opposite result to that of the battery fresh state. It suggests that the influence of battery aging on the ultrasonic characteristic parameters is not monotonic.
Figure 11e,f respectively shows the change of the “line” characteristic parameter—”time domain centroid + shape coefficient” during the charge–discharge process of the B0 battery. The value of this characteristic parameter is lower when the battery is fresh. After the battery ages to a certain extent, the value increases overall, and shows an opposite changing trend with the increase in the battery SOC. This phenomenon suggests that with the aging of the battery, the changing law of characteristic parameters with the SOC will also change. Figure 11g,h respectively shows the change of the same parameter as Figure 11e,f during the charge process and discharge process of the B1 battery, which have similar experimental results to the B0 battery. Through the comparative analysis of the UGW characteristic parameters of the B0 battery and B1 battery, it can be found that battery aging makes the overall amplitude of characteristic parameters increase in the whole SOC and makes the UGW scanning results more sensitive to the change in battery SOC and differences in scanning point positions.
Combined with the “line” characteristic parameters in Table 8, the random forest algorithm is also used to estimate the battery SOH. Figure 12 is the SOH estimation result of the B1 battery, and the RMSE of the estimation is 0.8%. It can be seen from the figure that the estimation error of SOH is small when the battery is fresh, while as the aging occurs, the estimation error of the battery SOH gradually increases. Considering the training data used, the reasons for the error may include the following aspects. One is that the amount of training data is insufficient, and multiple measurements are not performed at the full SOC state of the battery under different aging degrees to obtain more ultrasonic signal data. Another reason is that the characteristic parameters obtained are not at a fixed SOC for each aging degree of the battery but contain information about 10 different battery SOCs. From Figure 11, it can be seen that with the deepening of battery aging, the sensitivity of characteristic parameters to the battery SOC gradually increases. Therefore, the SOH estimation result of the battery after aging is more affected by the battery SOC than that before the aging, which causes the fluctuation of the estimation result and leads to a larger estimation error. Nevertheless, the existing results in the article can confirm that the ultrasonic “line” characteristic parameters have a certain role in the characterization of the battery SOH.

5. Conclusions

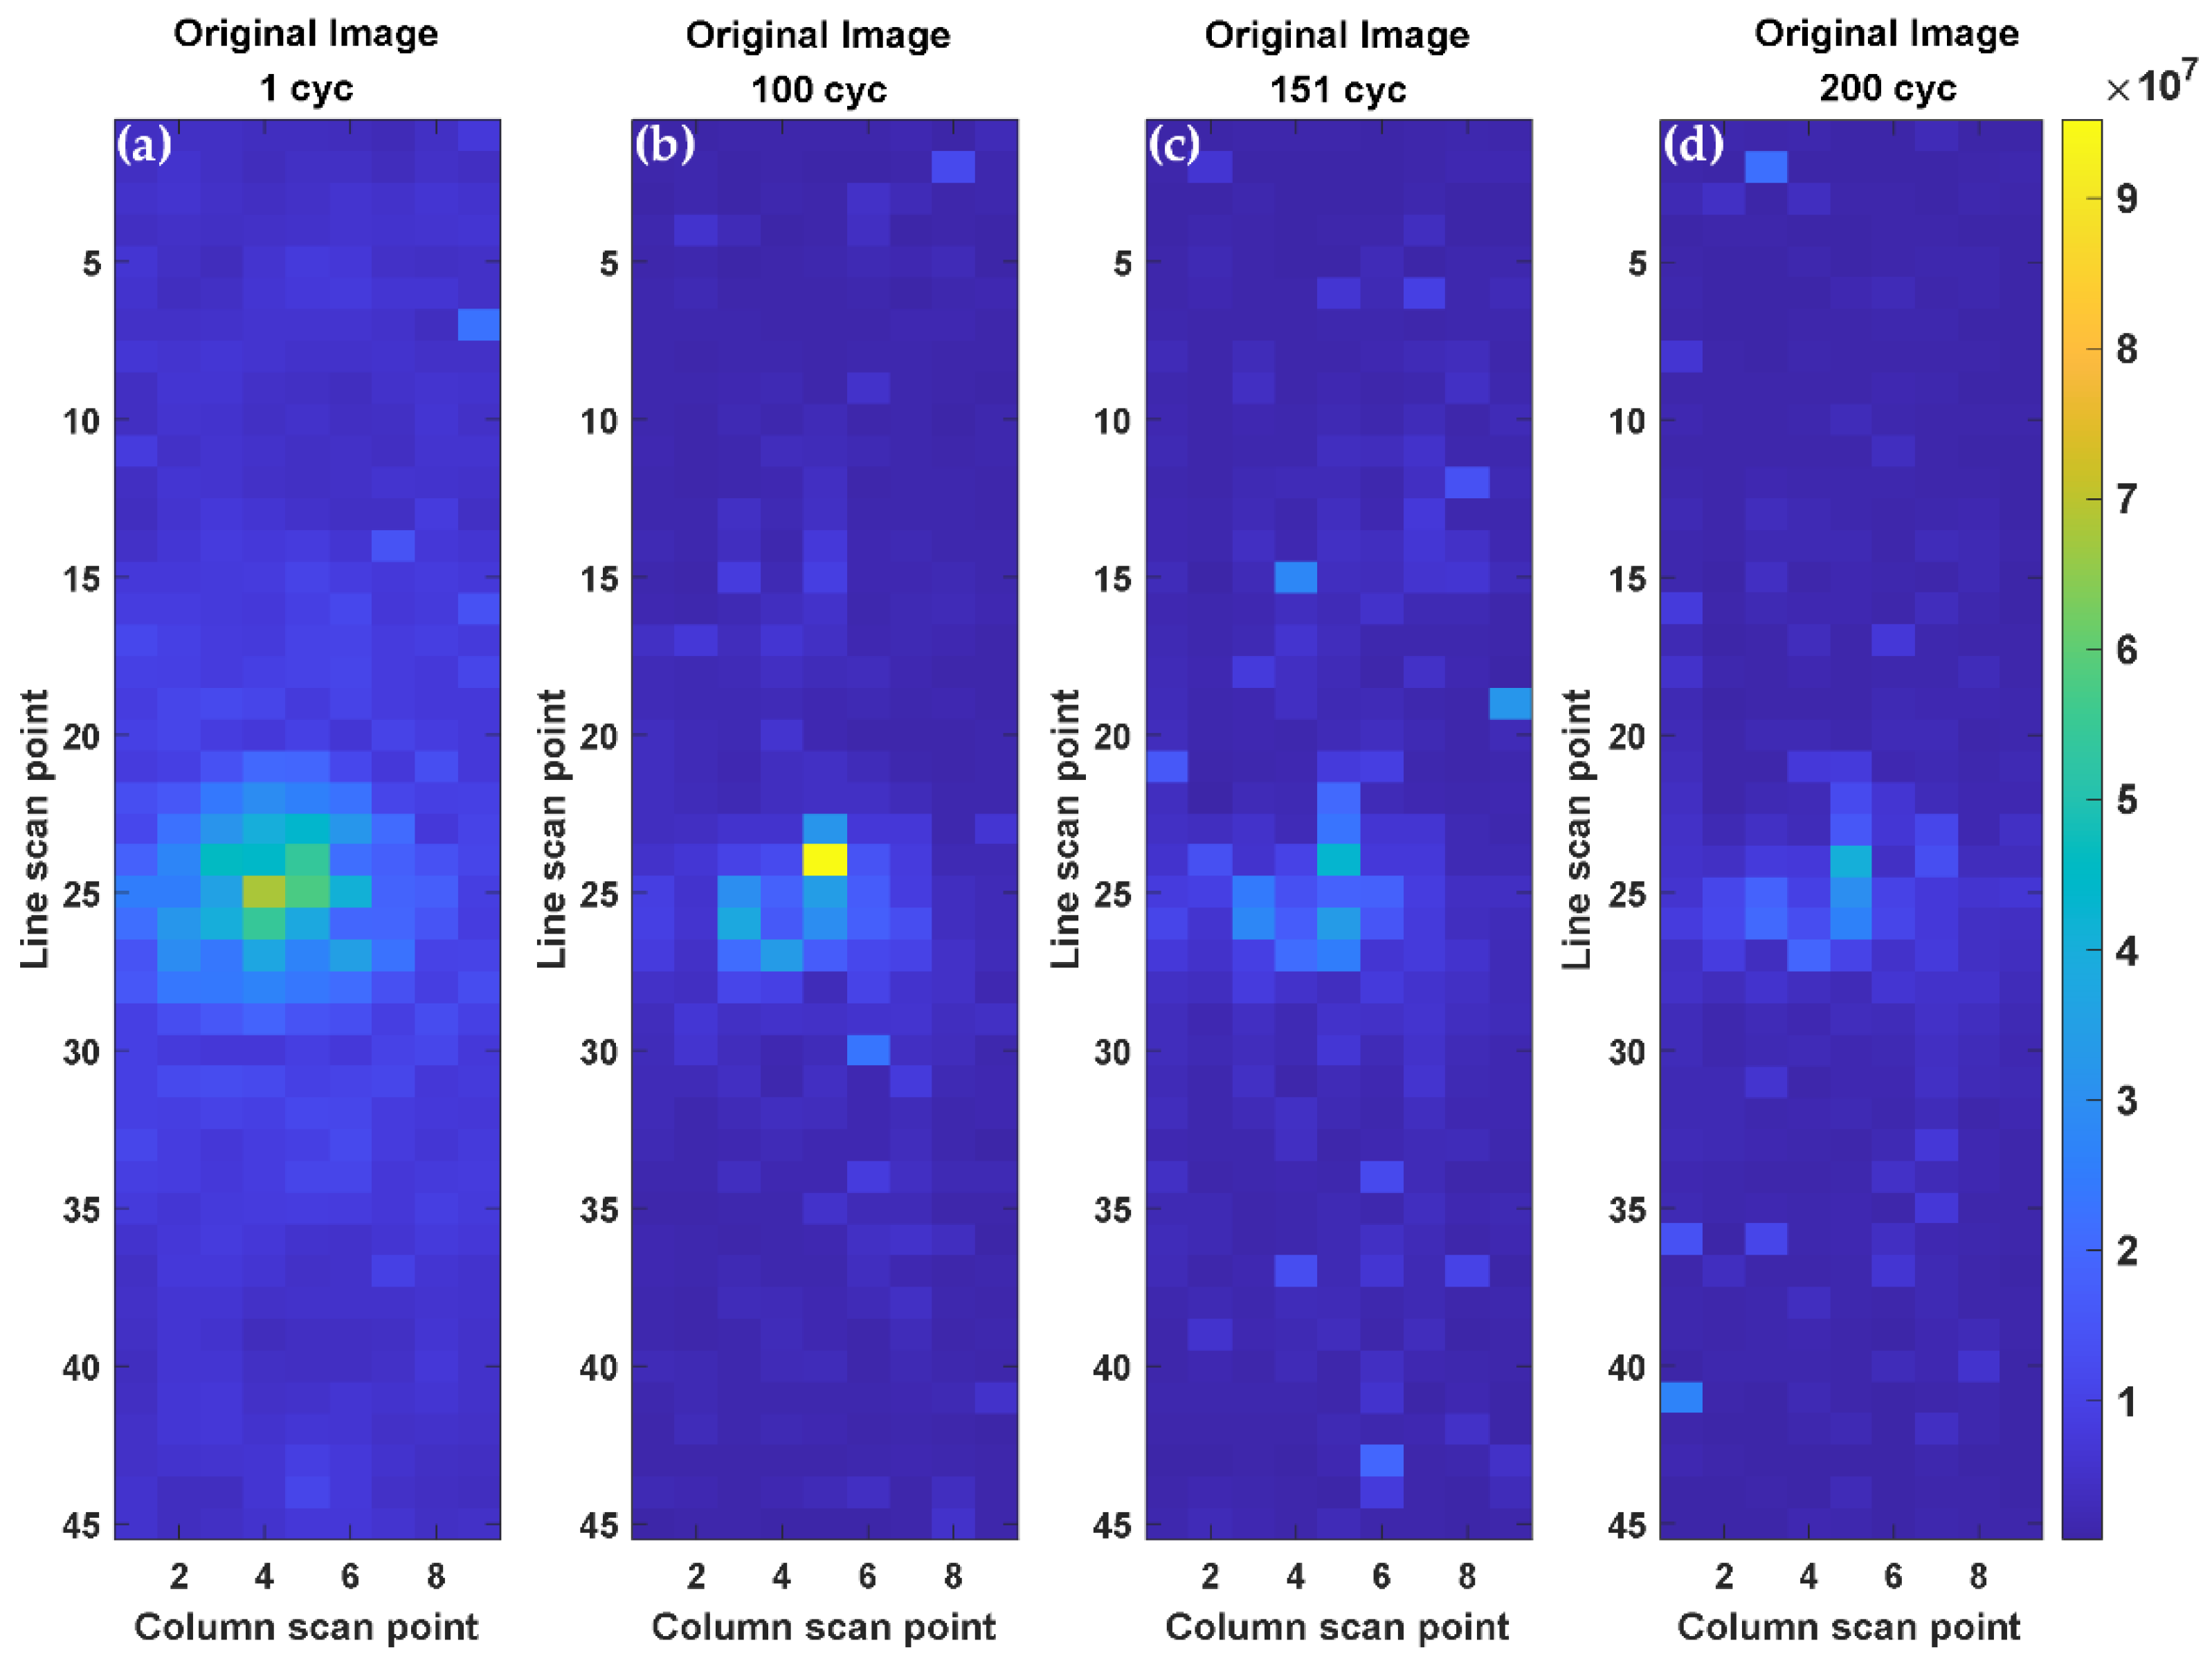
In this paper, the research of UGW scanning technology in the state characterization of lithium-ion batteries is carried out. A UGW surface scanning experimental system is built. UGW scanning experiments and battery cyclic charge–discharge experiments are carried out. The UGW scanning results of the battery under different SOC and different aging degrees are obtained. The propagation characteristics of UGWs in lithium-ion batteries are analyzed. Furthermore, the characteristic parameters of the obtained UGW single-point and line scanning signals are extracted. The variation rules of characteristic parameters among different scanning points of the battery, the variation rules of characteristic parameters of different battery SOC, and the variation rules of characteristic parameters of different battery aging degrees are comprehensively analyzed.
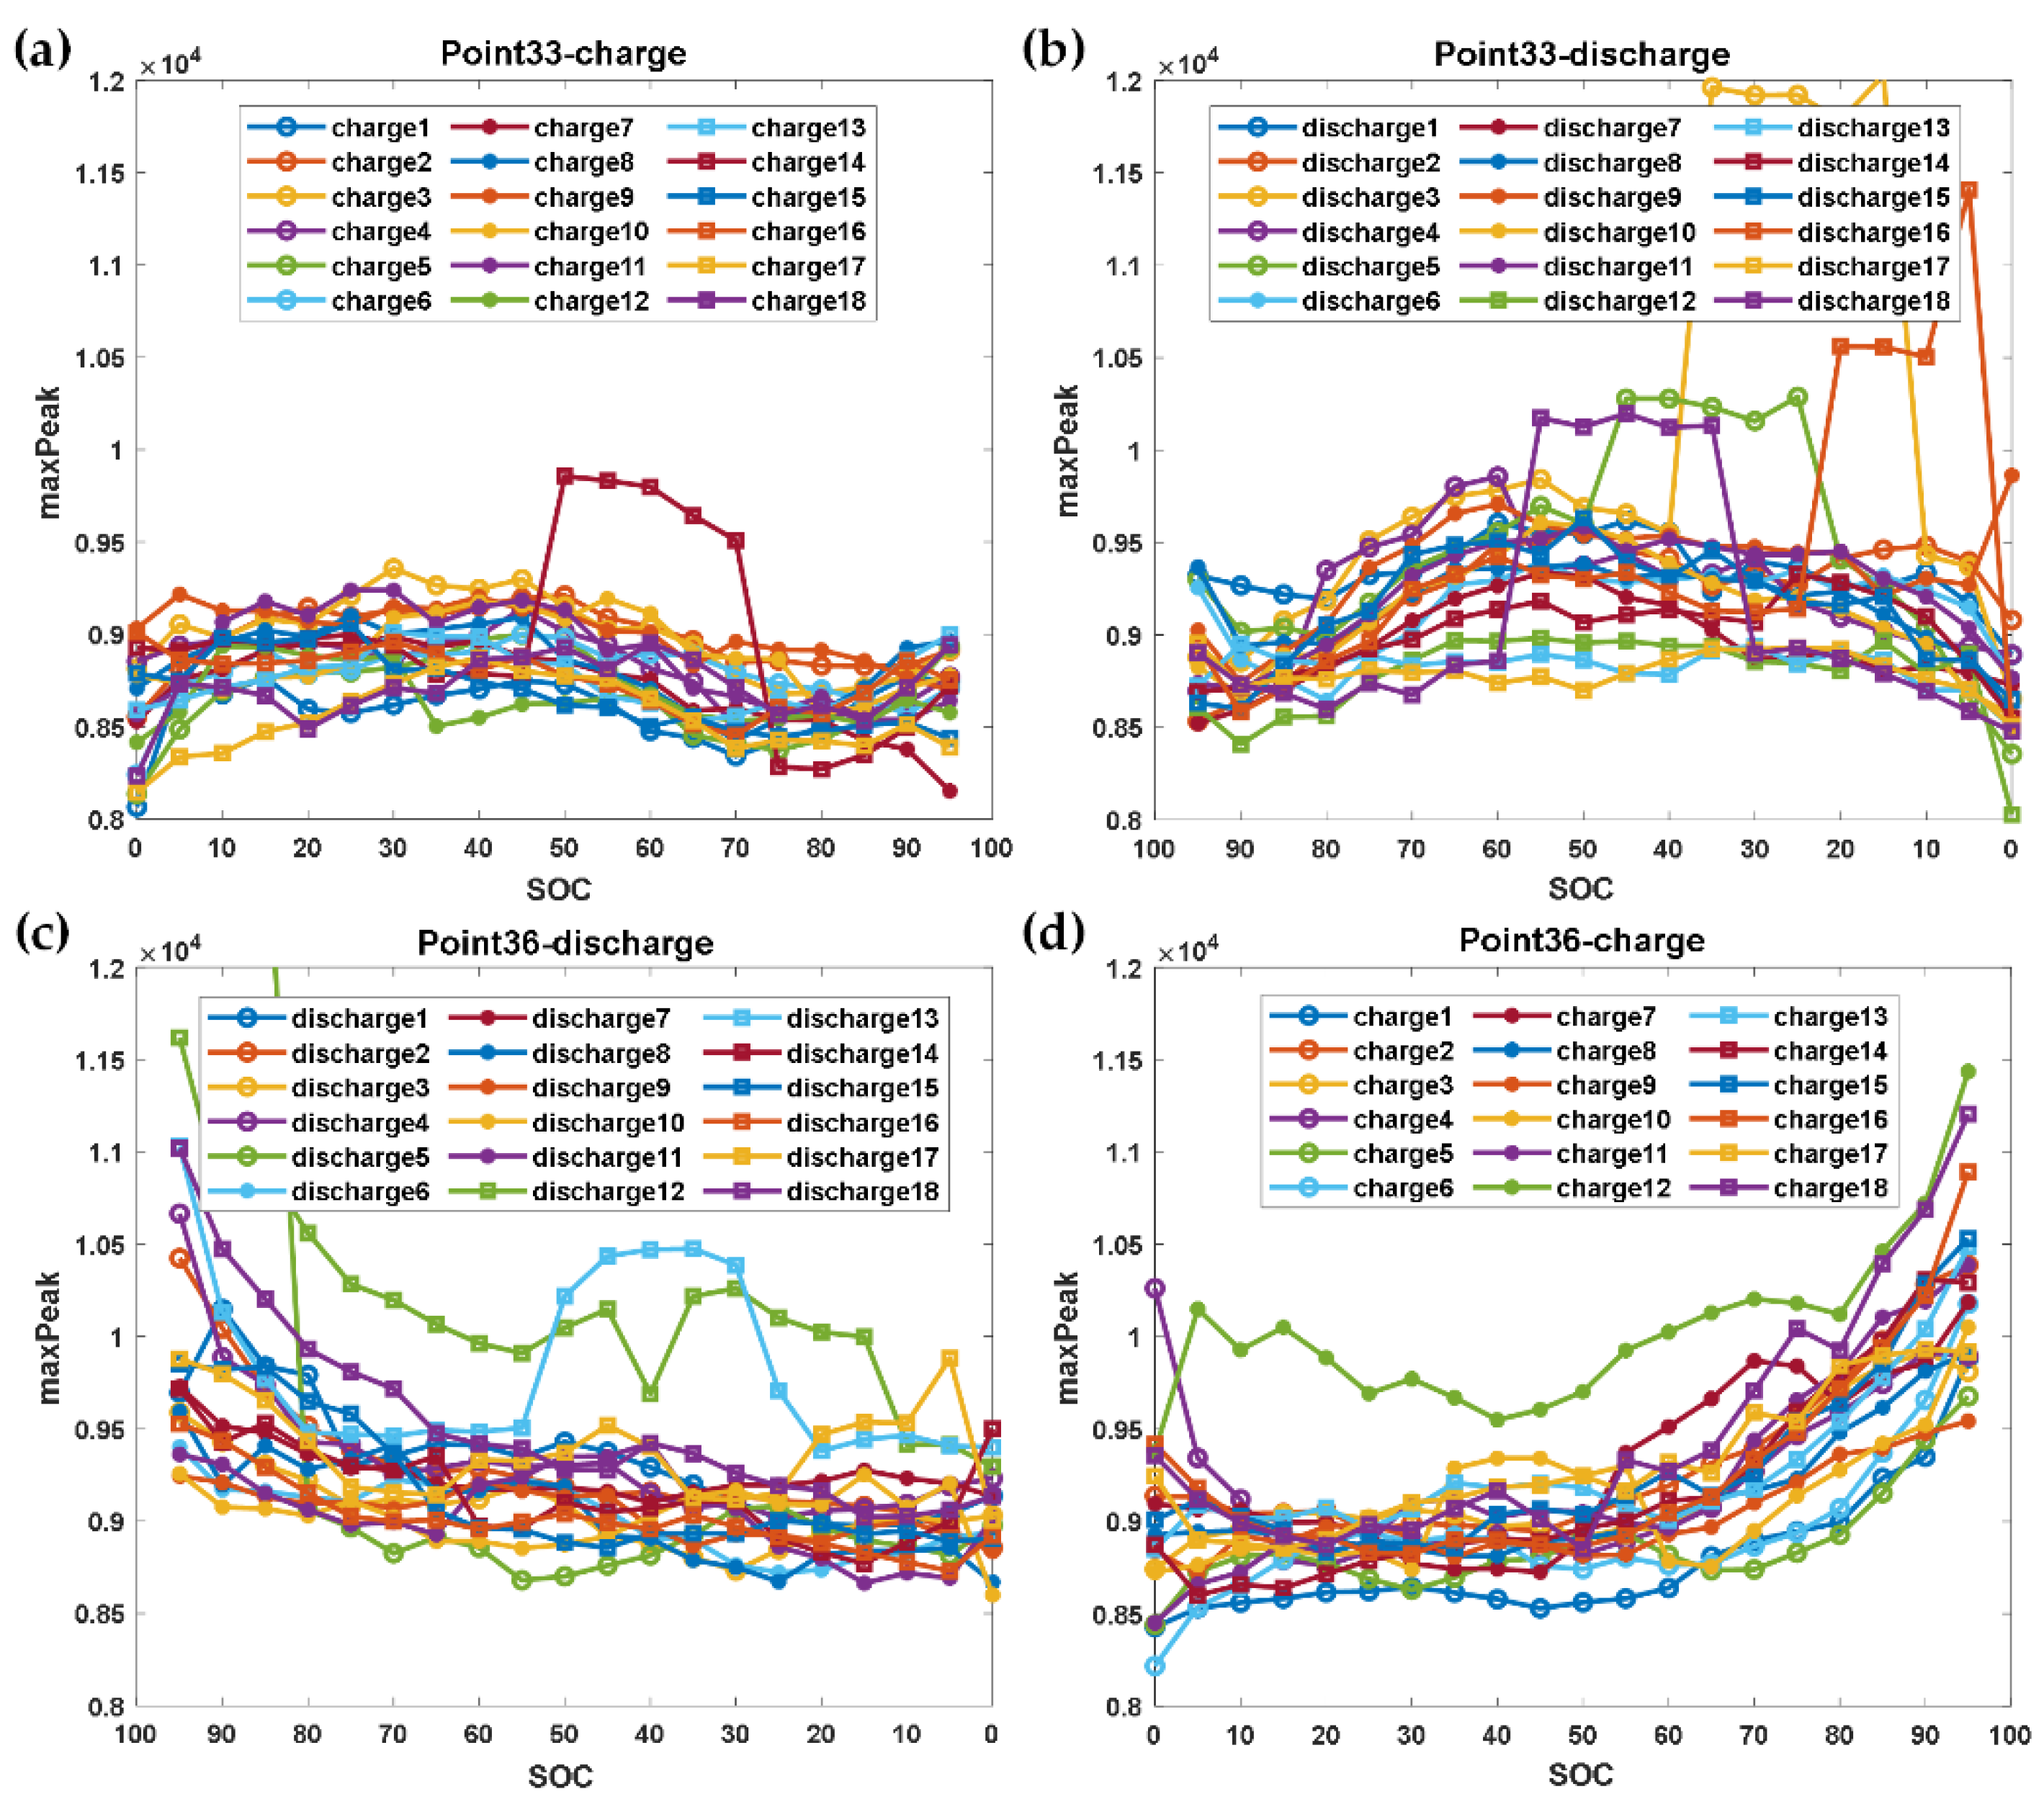
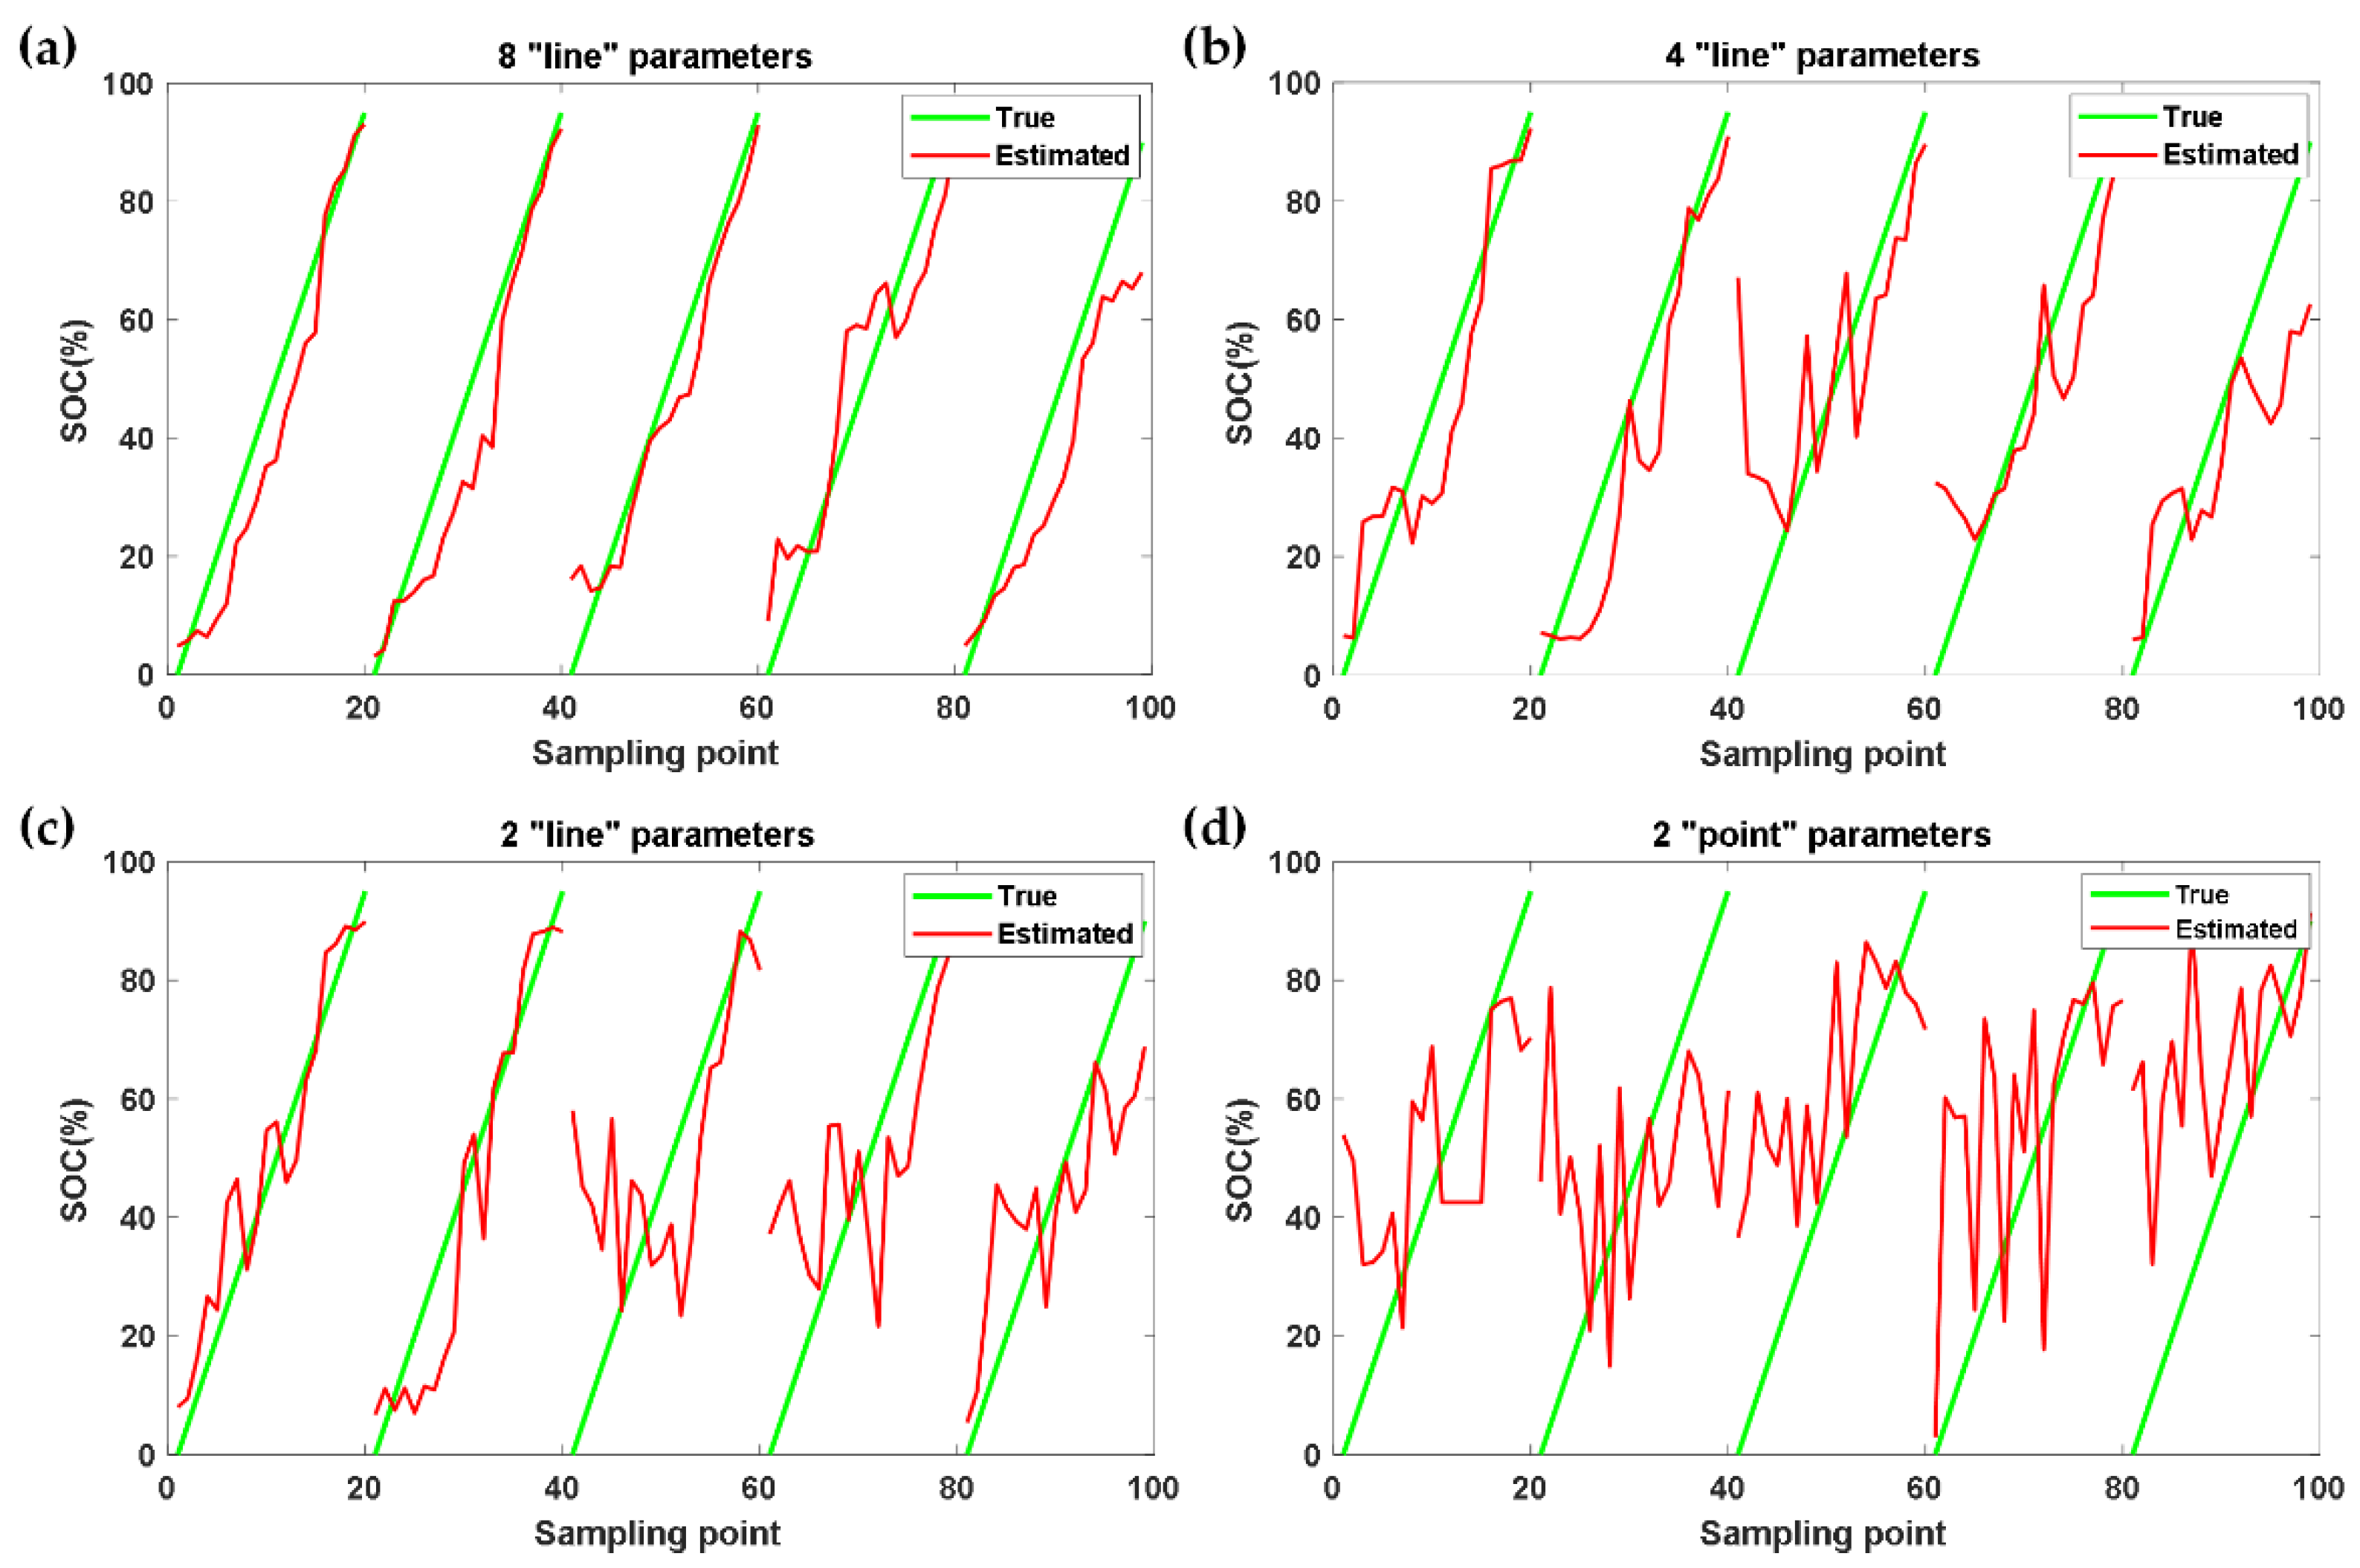
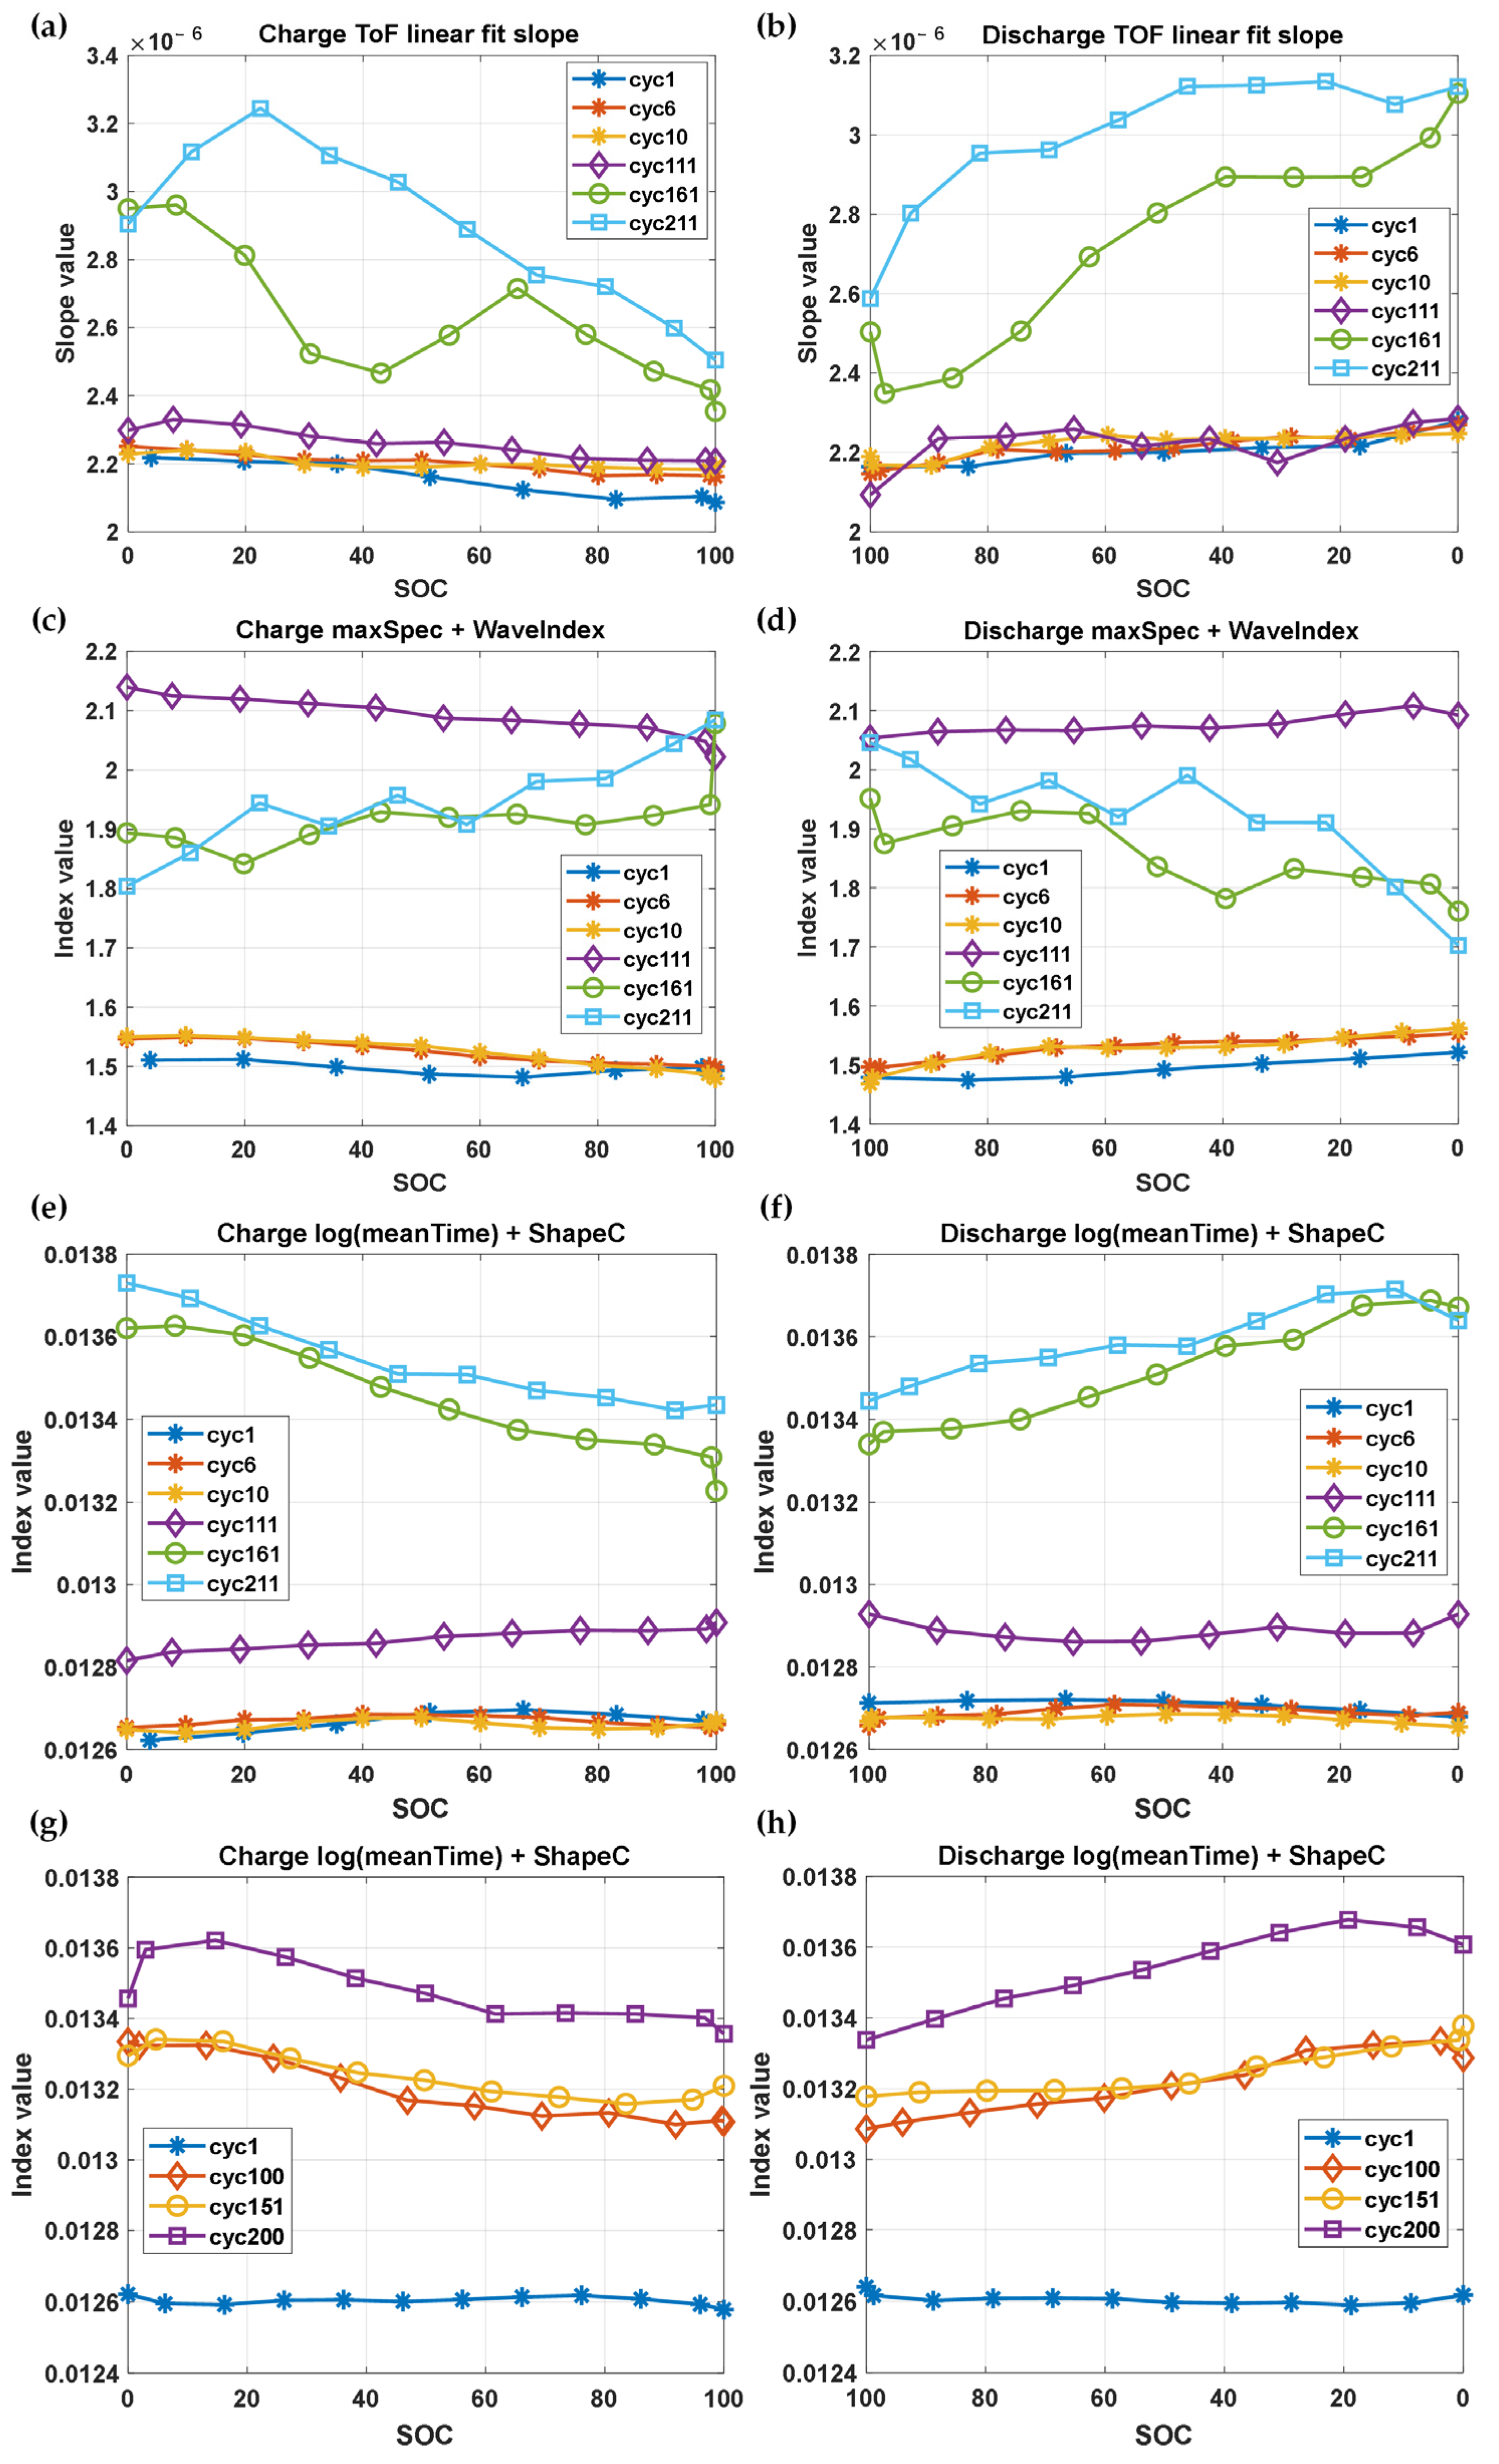
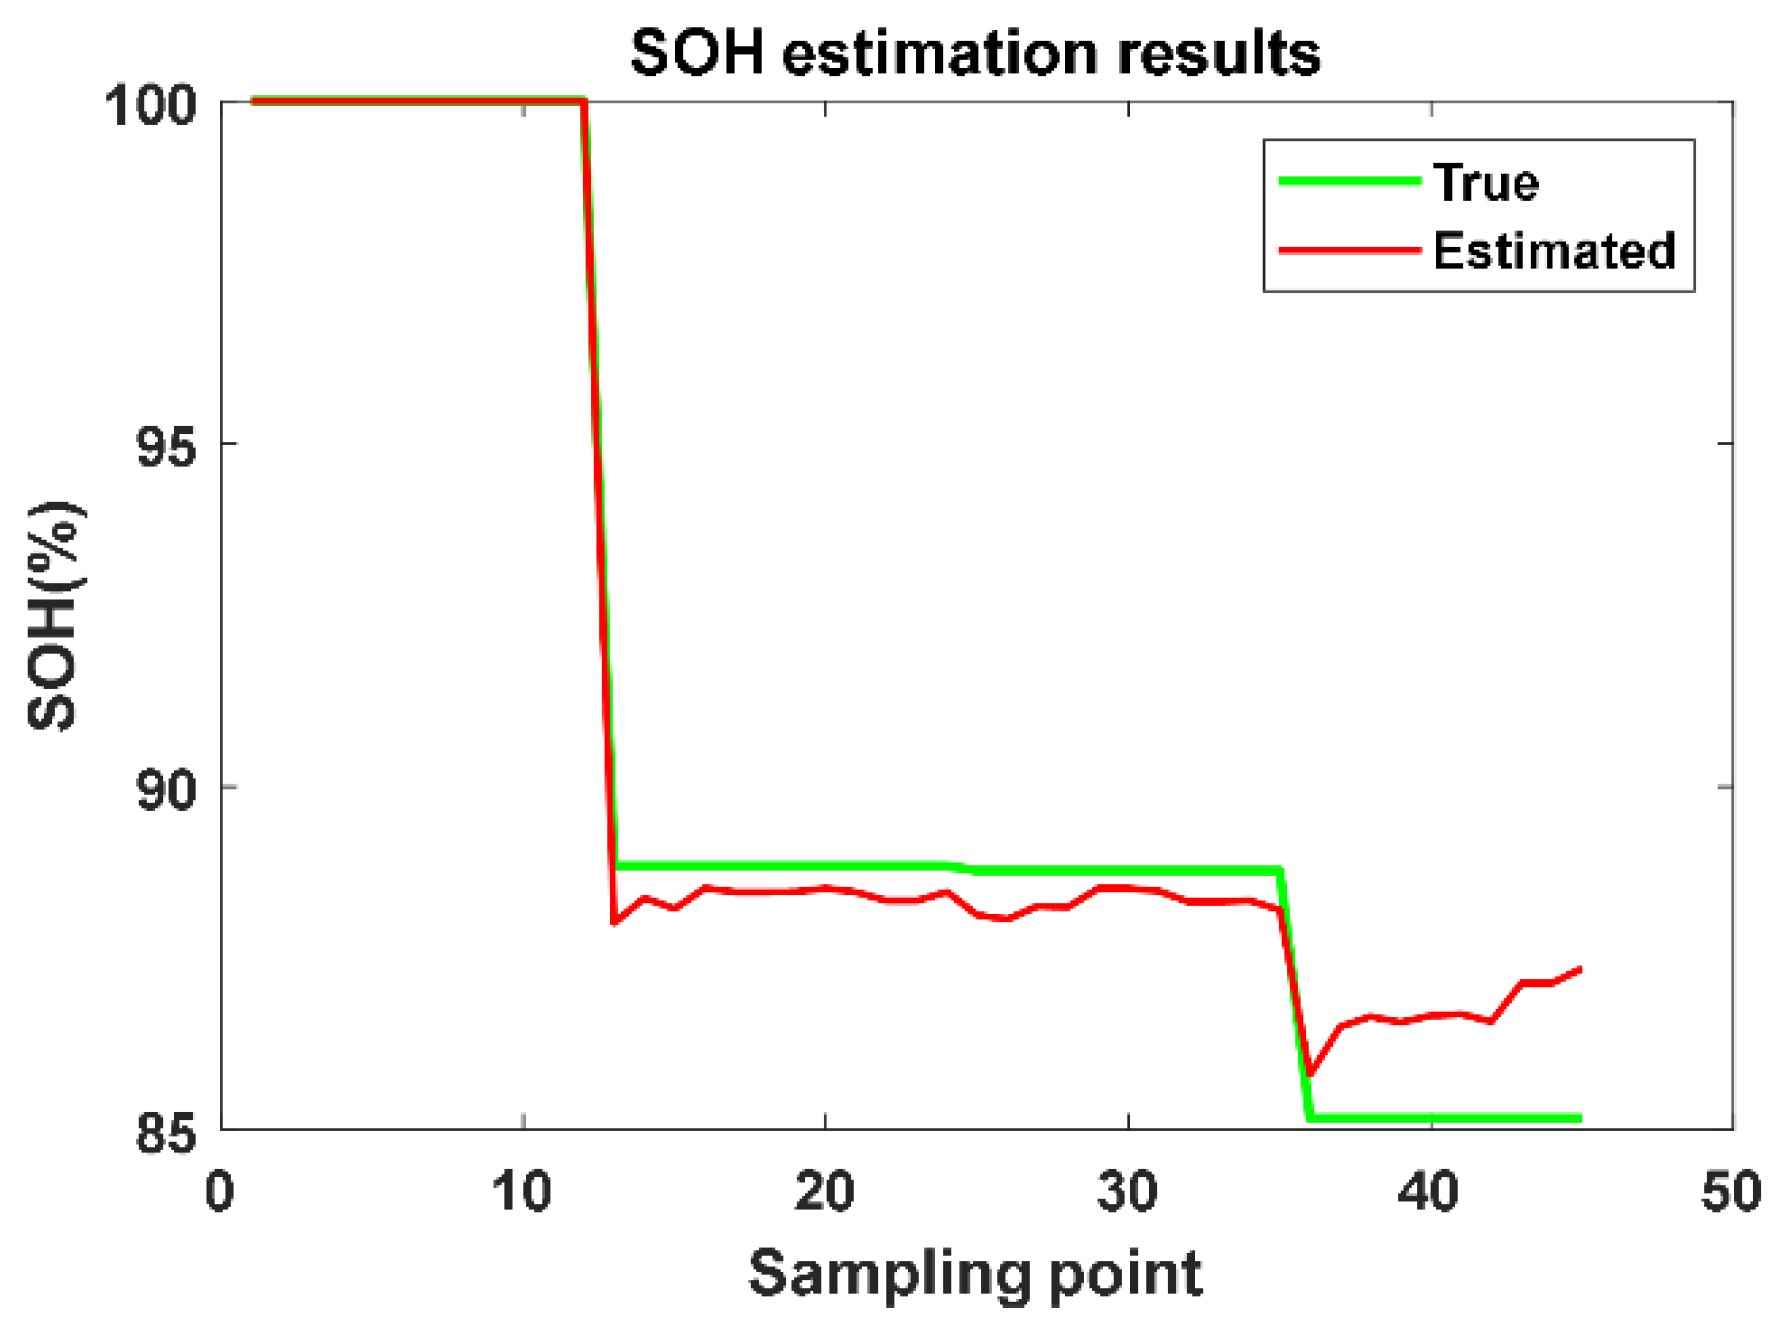
The results show that there is a strong correlation between the “line” characteristic parameters based on the UGW line scanning data and battery SOC and SOH. Additionally, it has good consistency among multiple cycles of the same battery, as well as among different batteries. “Line” characteristic parameters can be used for battery state characterization. In addition, with the deepening of battery aging, the characteristic parameters are more sensitive to the change of the battery SOC and the difference of the guided wave detection position.
The method of extracting characteristic parameters based on the UGW scanning signals can weaken the uncertainty caused by the difference of ultrasonic detection position and the difference of battery structure to a certain extent. The stability of battery state characteristic parameters is increased. The characteristic parameters obtained by UGW scanning are helpful to make a quick judgment on the battery states. The research results in this paper verify the feasibility of the application of contact and rapid ultrasonic detection technology in the characterization of lithium-ion batteries.
Compared with standard battery testing methods, such as the USABC battery test procedures, the battery state testing method based on ultrasonic guided wave scanning can quickly estimate the battery state with less test time. In addition, unlike testing methods based on electrical parameters, a noteworthy practical implication is that this method does not require the charging and discharging of batteries, which greatly reduces the complexity of battery testing. Of course, the method also has its limitations. For example, the results of the ultrasonic testing are disturbed by the test environment and external noise to a certain extent. Additionally, when ultrasound propagating in a battery with a solid–liquid hybrid multilayer structure, the compositions of the ultrasonic signal become complex, and it becomes difficult to analyze and extract effective feature parameters. In addition, the SOH of the battery is affected and restricted by the coupling of environmental temperature, C-rate, and other factors [22], and the aging characteristics and manufacturing processes of the batteries are also different, which increases the difficulty of ultrasonic measurement. To sum up, when the ultrasonic nondestructive testing method is applied in battery testing, the analysis method and feature extraction algorithm of ultrasonic signal, as well as the mechanism of action between the battery structure and ultrasound need to be further studied in order to explore the effect of the method on batteries under different conditions. Moreover, it is very necessary to conduct multi-factor analysis and modeling of the impact of battery inconsistency on ultrasonic measurement to enhance the generalization of ultrasonic measurement. Nevertheless, ultrasonic battery non-destructive testing still has certain research and application value in the online state characterization and estimation, as well as cascade utilization of electric vehicle power batteries.

Author Contributions

Conceptualization, X.L. and C.W.; methodology, X.L.; software, C.W.; validation, C.W. and X.L.; formal analysis, C.W. and C.F.; investigation, C.W. and S.Z.; resources, X.L. and J.T.; data curation, J.T.; writing—original draft preparation, X.L. and C.W.; writing—review and editing, X.L. and C.F.; visualization, C.W.; supervision, X.L. and J.T.; project administration, X.L. and J.T.; funding acquisition, X.L. All authors have read and agreed to the published version of the manuscript.

Funding

This work was supported by the National Natural Science Foundation of China (No. 52177219) and the Natural Science Foundation of Guangdong Province (2021A1515010525).

Institutional Review Board Statement

Not applicable.

Informed Consent Statement

Not applicable.

Conflicts of Interest

The authors declare no conflict of interest. The funders had no role in the design of the study; in the collection, analyses or interpretation of data; in the writing of the manuscript; or in the decision to publish the results.

References

  1. Verma, S.; Dwivedi, G.; Verma, P. Life cycle assessment of electric vehicles in comparison to combustion engine vehicles: A review. Mater. Today Proc. 2022, 49, 217–222. [Google Scholar] [CrossRef]
  2. Fan, E.; Li, L.; Wang, Z.; Lin, J.; Huang, Y.; Yao, Y.; Chen, R.; Wu, F. Sustainable Recycling Technology for Li-Ion Batteries and Beyond: Challenges and Future Prospects. Chem. Rev. 2020, 120, 7020–7063. [Google Scholar] [CrossRef] [PubMed]
  3. Savard, C.; Iakovleva, E.; Ivanchenko, D.; Rassõlkin, A. Accessible Battery Model with Aging Dependency. Energies 2021, 14, 3493. [Google Scholar] [CrossRef]
  4. Hua, Y.; Liu, X.; Zhou, S.; Huang, Y.; Ling, H.; Yang, S. Toward sustainable reuse of retired lithium-ion batteries from electric vehicles. Resources. Conserv. Recycl. 2021, 168, 105249. [Google Scholar] [CrossRef]
  5. Zhao, G. Reuse and Recycling of Lithium-Ion Power Batteries; John Wiley & Sons: Hoboken, NJ, USA, 2017. [Google Scholar] [CrossRef]
  6. Plett, G.L. Battery Management Systems, Volume I: Battery Modeling; Artech House: Norwood, MA, USA, 2015. [Google Scholar]
  7. Li, X.; Huang, Z.; Hua, W.; Rao, L.; Tian, Y.; Tian, J. Mechanical Vibration Modeling and Characterization of a Plastic-Cased Lithium-ion Battery. Green Energy Intell. Transp. 2022, 1, 100006. [Google Scholar] [CrossRef]
  8. Kurzweil, P.; Scheuerpflug, W.; Frenzel, B.; Schell, C.; Schottenbauer, J. Differential Capacity as a Tool for SOC and SOH Estimation of Lithium Ion Batteries Using Charge/Discharge Curves, Cyclic Voltammetry, Impedance Spectroscopy, and Heat Events: A Tutorial. Energies 2022, 15, 4520. [Google Scholar] [CrossRef]
  9. Gold, L.; Bach, T.; Virsik, W.; Schmitt, A.; Müller, J.; Staab, T.E.; Sextl, G. Probing lithium-ion batteries’ state-of-charge using ultrasonic transmission–Concept and laboratory testing. J. Power Sources 2017, 343, 536–544. [Google Scholar] [CrossRef]
  10. Kim, J.Y.; Jo, J.H.; Byeon, J.W. Ultrasonic monitoring performance degradation of lithium ion battery. Microelectron. Reliab. 2020, 114, 113859. [Google Scholar] [CrossRef]
  11. Ladpli, P.; Kopsaftopoulos, F.; Chang, F.K. Estimating state of charge and health of lithium-ion batteries with guided waves using built-in piezoelectric sensors/actuators. J. Power Sources 2018, 384, 342–354. [Google Scholar] [CrossRef]
  12. Zhao, G.; Liu, Y.; Liu, G.; Jiang, S.; Hao, W. State-of-charge and state-of-health estimation for lithium-ion battery using the direct wave signals of guided wave. J. Energy Storage 2021, 39, 102657. [Google Scholar] [CrossRef]
  13. Zheng, S.; Jiang, S.; Luo, Y.; Xu, B.; Hao, W. Guided wave imaging of thin lithium-ion pouch cell using scanning laser Doppler vibrometer. Ionics 2021, 27, 643–650. [Google Scholar] [CrossRef]
  14. Rose, J.L. Ultrasonic Guided Waves in Solid Media; Cambridge University Press: Cambridge, UK, 2014. [Google Scholar]
  15. Feng, R.; Wang, Y. Ultrasound Therapy; China Medical Science and Technology Press: Beijing, China, 1994. [Google Scholar]
  16. Ai, C.A.; Li, J.; Liu, Y.; Ni, T. Ultrasonic Test Theory and Technology for Multilayered Bonding Structure; National Defense Industrial Association: Beijing, China, 2014; pp. 184–298. [Google Scholar]
  17. Zhao, H. Grade Quantitative Analysis and Research Based on Nonlinear Ultrasonic Guided Wave Defect Signal; Shenyang University of Technology: Shenyang, China, 2020; pp. 21–22. [Google Scholar]
  18. Su, Z.; Ye, L. Identification of Damage Using Lamb Waves: From Fundamentals to Applications; Springer Science & Business Media: Berlin/Heidelberg, Germany, 2009; Volume 48. [Google Scholar]
  19. Breiman, L. Random forests. Mach. Learn. 2001, 45, 5–32. [Google Scholar] [CrossRef]
  20. Li, X.; Wang, T.; Li, J.; Tian, Y.; Tian, J. Energy Consumption Estimation for Electric Buses Based on a Physical and Data-Driven Fusion Model. Energies 2022, 15, 4160. [Google Scholar] [CrossRef]
  21. Teliz, E.; Zinola, C.F.; Díaz, V. Identification and quantification of ageing mechanisms in Li-ion batteries by Electrochemical impedance spectroscopy. Electrochim. Acta 2022, 426, 140801. [Google Scholar] [CrossRef]
  22. Laadjal, K.; Cardoso, A.J.M. Estimation of Lithium-Ion Batteries State-Condition in Electric Vehicle Applications: Issues and State of the Art. Electronics 2021, 10, 1588. [Google Scholar] [CrossRef]
Figure 1. Formation of Lamb waves in planar waveguide.
Energies 15 06027 g001
Figure 2. (a) The UGW scanning experimental system for lithium-ion batteries; (b) LDV is used to scan the lithium-ion battery, and the ultrasonic signals at each scanning point are obtained.
Energies 15 06027 g002
Figure 3. Experimental results of the propagation of UGWs in the battery. (The sampling length of the time domain signal is 10,000 points, (ah) correspond to the 2000th, 2500th, 2700th, 2800th, 3000th, 3500th, 4000th and 5000th sampling moments, respectively).
Energies 15 06027 g003
Figure 4. Time-domain waveforms of UGW signals at different positions of the battery. (The total length of time domain sampled signal is 10,000 sampling points, and the signal mainly exists in the [1000,6000] sampling interval. (10,25) represents the scanning points on the 10th row and 25th column in the scanning area, and so on. The ultrasound excitation source is closest to the (1,25) point in the scan area. The scan positions corresponding to (af) are shown in (g)).
Energies 15 06027 g004
Figure 5. Energy spectrum of surface scanning UGW signal of lithium-ion battery.
Energies 15 06027 g005
Figure 6. Variation of time domain peak values of UGW signal at a single-point with the change of battery SOC. ((a,b) are the time-domain peak values of charge and discharge process at the 33rd scan point on the scan line, respectively; (c,d) are the time-domain peak values of charge and discharge process at the 36th scan point on the scan line, respectively).
Energies 15 06027 g006
Figure 7. A diagram shows changes of characteristic parameters during the battery charge-discharge cycles. ((a) means “spectrum peak + waveform index”, and the rest (bh) are analogous. Note that “log(ShapeC)” means that take logarithm of the “point” parameter—“shape coefficient”, and then superimposed the “line” parameter on it).
Energies 15 06027 g007
Figure 8. Correlation coefficient between UGW characteristic parameters and battery SOC. (a) Charge data; (b) discharge data.
Energies 15 06027 g008
Figure 9. SOC estimation result during battery charging process. ((ac) are the SOC estimation results using 8, 4, and 2 “line” parameters, respectively; (d) is the SOC estimation result using 2 “point” parameters).
Energies 15 06027 g009
Figure 10. UGW spectrum diagram of lithium-ion batteries with different aging degrees. (a) 1 cyc; (b) 100 cyc; (c) 151 cyc; (d) 200 cyc.
Energies 15 06027 g010
Figure 11. Changes of characteristic parameters of lithium-ion batteries with different aging degrees. ((af) are the change diagrams of charge/discharge characteristic parameters of B0 battery; (g,h) are the change diagrams of charge/discharge characteristic parameters of B1 battery).
Energies 15 06027 g011
Figure 12. SOH estimation result of B1 battery.
Energies 15 06027 g012
Table 1. “Point” characteristic parameters of UGW signal.
Characteristic ParametersCalculation Equation
Time domain peak m a x P e a k = m a x A (7)
Time domain energy integral E I T = t b t a A 2 t d t (8)
Time domain centroid m e a n T i m e = t b t a A 2 t d t t b t a A 2 d t (9)
Shape coefficient S h a p e C = N T i = 1 N T A i 2 (10)
TOF T O F = ( N r t h r - N e t h r ) T N T   (11)
Frequency spectrum peak m a x S p e c = m a x S (12)
Table 2. “Line” characteristic parameters of UGW signal.
Characteristic ParametersCalculation Equation
Waveform index W a v e I n d e   x = 1 N L i = 1 N L P i 2 1 N L i = 1 N L P i (13)
Kurtosis coefficient K u r t o s i s C = 1 N L i = 1 N L P i 4 ( 1 N L i = 1 N L P i 2 ) 4 (14)
Dispersion coefficient D i s p e r s i o n C = 1 N L i = 1 N L P i 2 P ¯ (15)
Shape coefficient S h a p e C = N L i = 1 N L P i 2 (16)
Slope of TOF K = l i n e a r f i t ( T O F c d ¯ ) (17)
Mean of time domain centroids M = m e a n ( m e a n T i m e ) (18)
Table 3. Experimental equipment information.
EquipmentDetails
Ultrasonic signal generatorRIGOL: DG1022Z
Power amplifierAigtek: ATA-2021H
Piezoelectric transducer125 kHz
LDVSOPOP: LV-S01
Table 4. Experimental battery parameters.
ParametersValue
Positive electrode materiallithium iron phosphate
Negative electrode materialgraphite
Capacity20 Ah
Charge upper limit voltage3.65 V
Charge lower limit voltage2.5 V
Dimension233 mm × 90 mm × 11 mm
Table 5. “Line” characteristic parameters used to characterize battery SOC.
Serial Number“Line” Characteristic Parameters
aEIT + WaveIndex
bEIT + KurtosisC
cEIT + DispersionC
dmeanTime + M
elog(ShapeC) + WaveIndex *
flog(ShapeC) + KurtosisC
glog(ShapeC) + DispersionC
hTOF + K
imaxSpec + WaveIndex
jmaxSpec + KurtosisC
kmaxSpec + DispersionC
* The “+” sign indicates the superposition of the “point” parameter and the “line” parameter; log(*) indicates the logarithmic processing of the parameter.
Table 6. Comparison of dispersion analysis of “point” parameters and “line” parameters.
ParametersmaxPeakTOFEIT + KurtosisCTOF + K
Type of DataMean (std) 1Std (std) 2Mean (std)Std (std)Mean (std)Std (std)Mean (std)Std (std)
Point330.12030.03100.09750.03810.15410.00800.14900.0177
360.10020.02490.10910.0445
650.24200.01070.05260.0456
1000.14880.02620.08750.0334
1 “mean (std)” represents the mean of 20 standard deviations (corresponding to 20 SOC values); 2 “std (std)” represents the standard deviation of 20 standard deviations.
Table 7. Battery SOC estimation result.
Parameter TypeNumber of Training ParametersTraining Error (RMSE)
Point 133227.39
36226.23
65231.72
100226.22
Line2 216.56
4 314.82
89.49
1 The “point” characteristic parameters of each single point are both “maxPeak” and “TOF”; 2 The 2 parameters are “log(ShapeC) + KurtosisC” and “maxSpec + WaveIndex”, respectively; 3 The 4 parameters are “log(ShapeC) + WaveIndex”, “log(ShapeC) + KurtosisC”, “maxSpec + WaveIndex”, and “maxSpec + KurtosisC”, respectively.
Table 8. “Line” characteristic parameters used to characterize battery SOH.
Serial Number“Line” Characteristic Parameters
alog(maxPeak) + ShapeC
blog(meanTime) + ShapeC
cmeanTime + M
dShapeC + ShapeC
eTOF + K
fmaxSpec + WaveIndex
glog(maxSpec) + ShapeC
Publisher’s Note: MDPI stays neutral with regard to jurisdictional claims in published maps and institutional affiliations.

