A Review of Infrared Thermography for Condition-Based Monitoring in Electrical Energy: Applications and Recommendations

 ,
,
Abstract
:1. Introduction
2. Theoretical on Thermography and Thermal Imaging
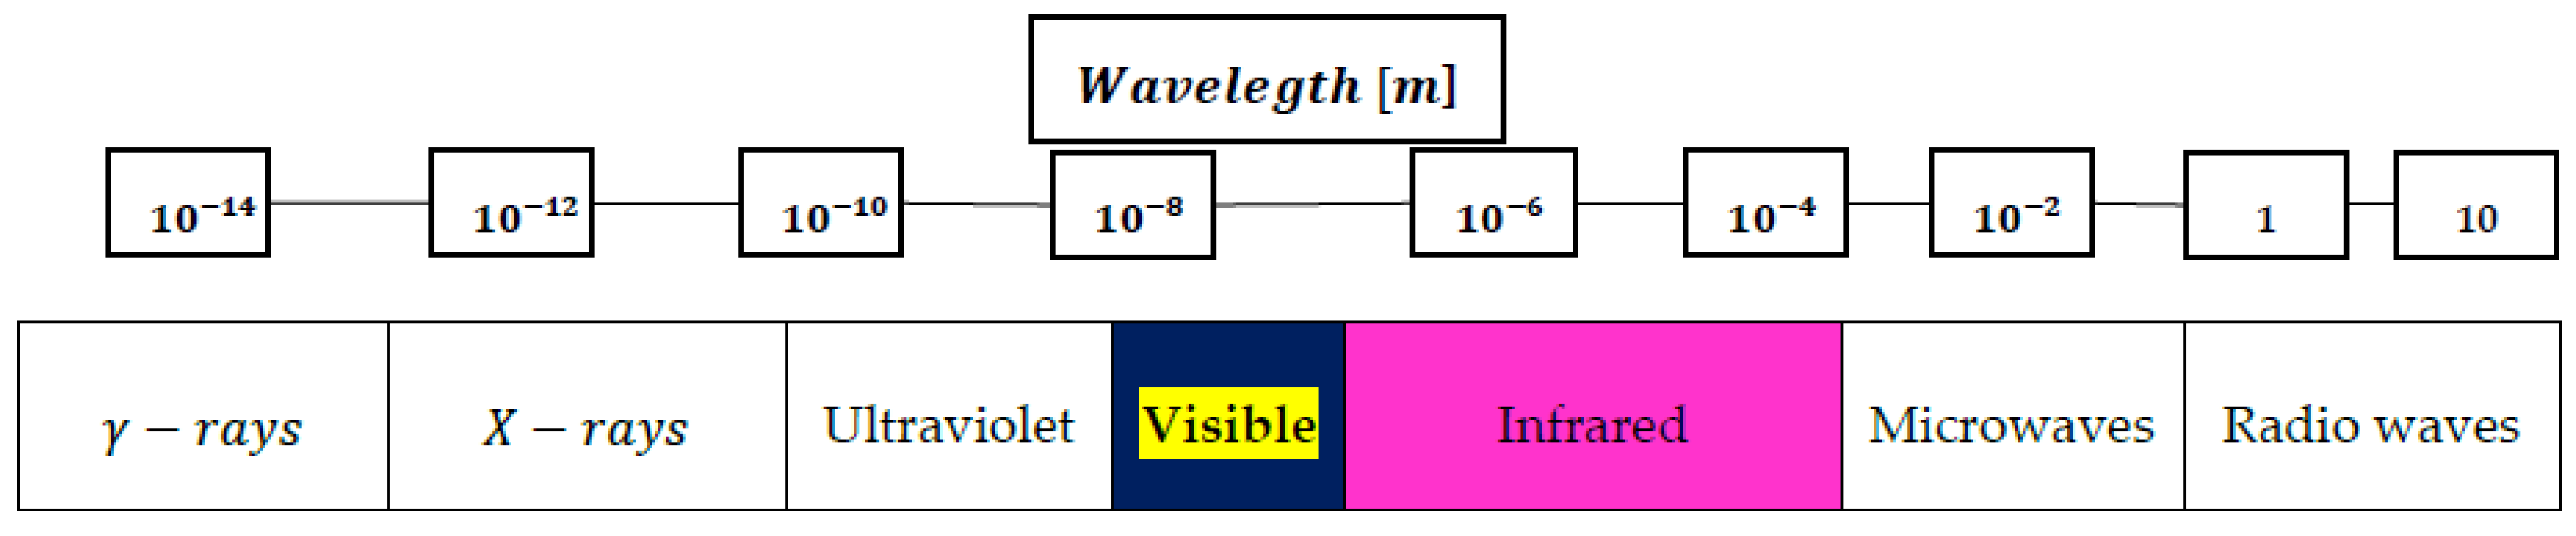
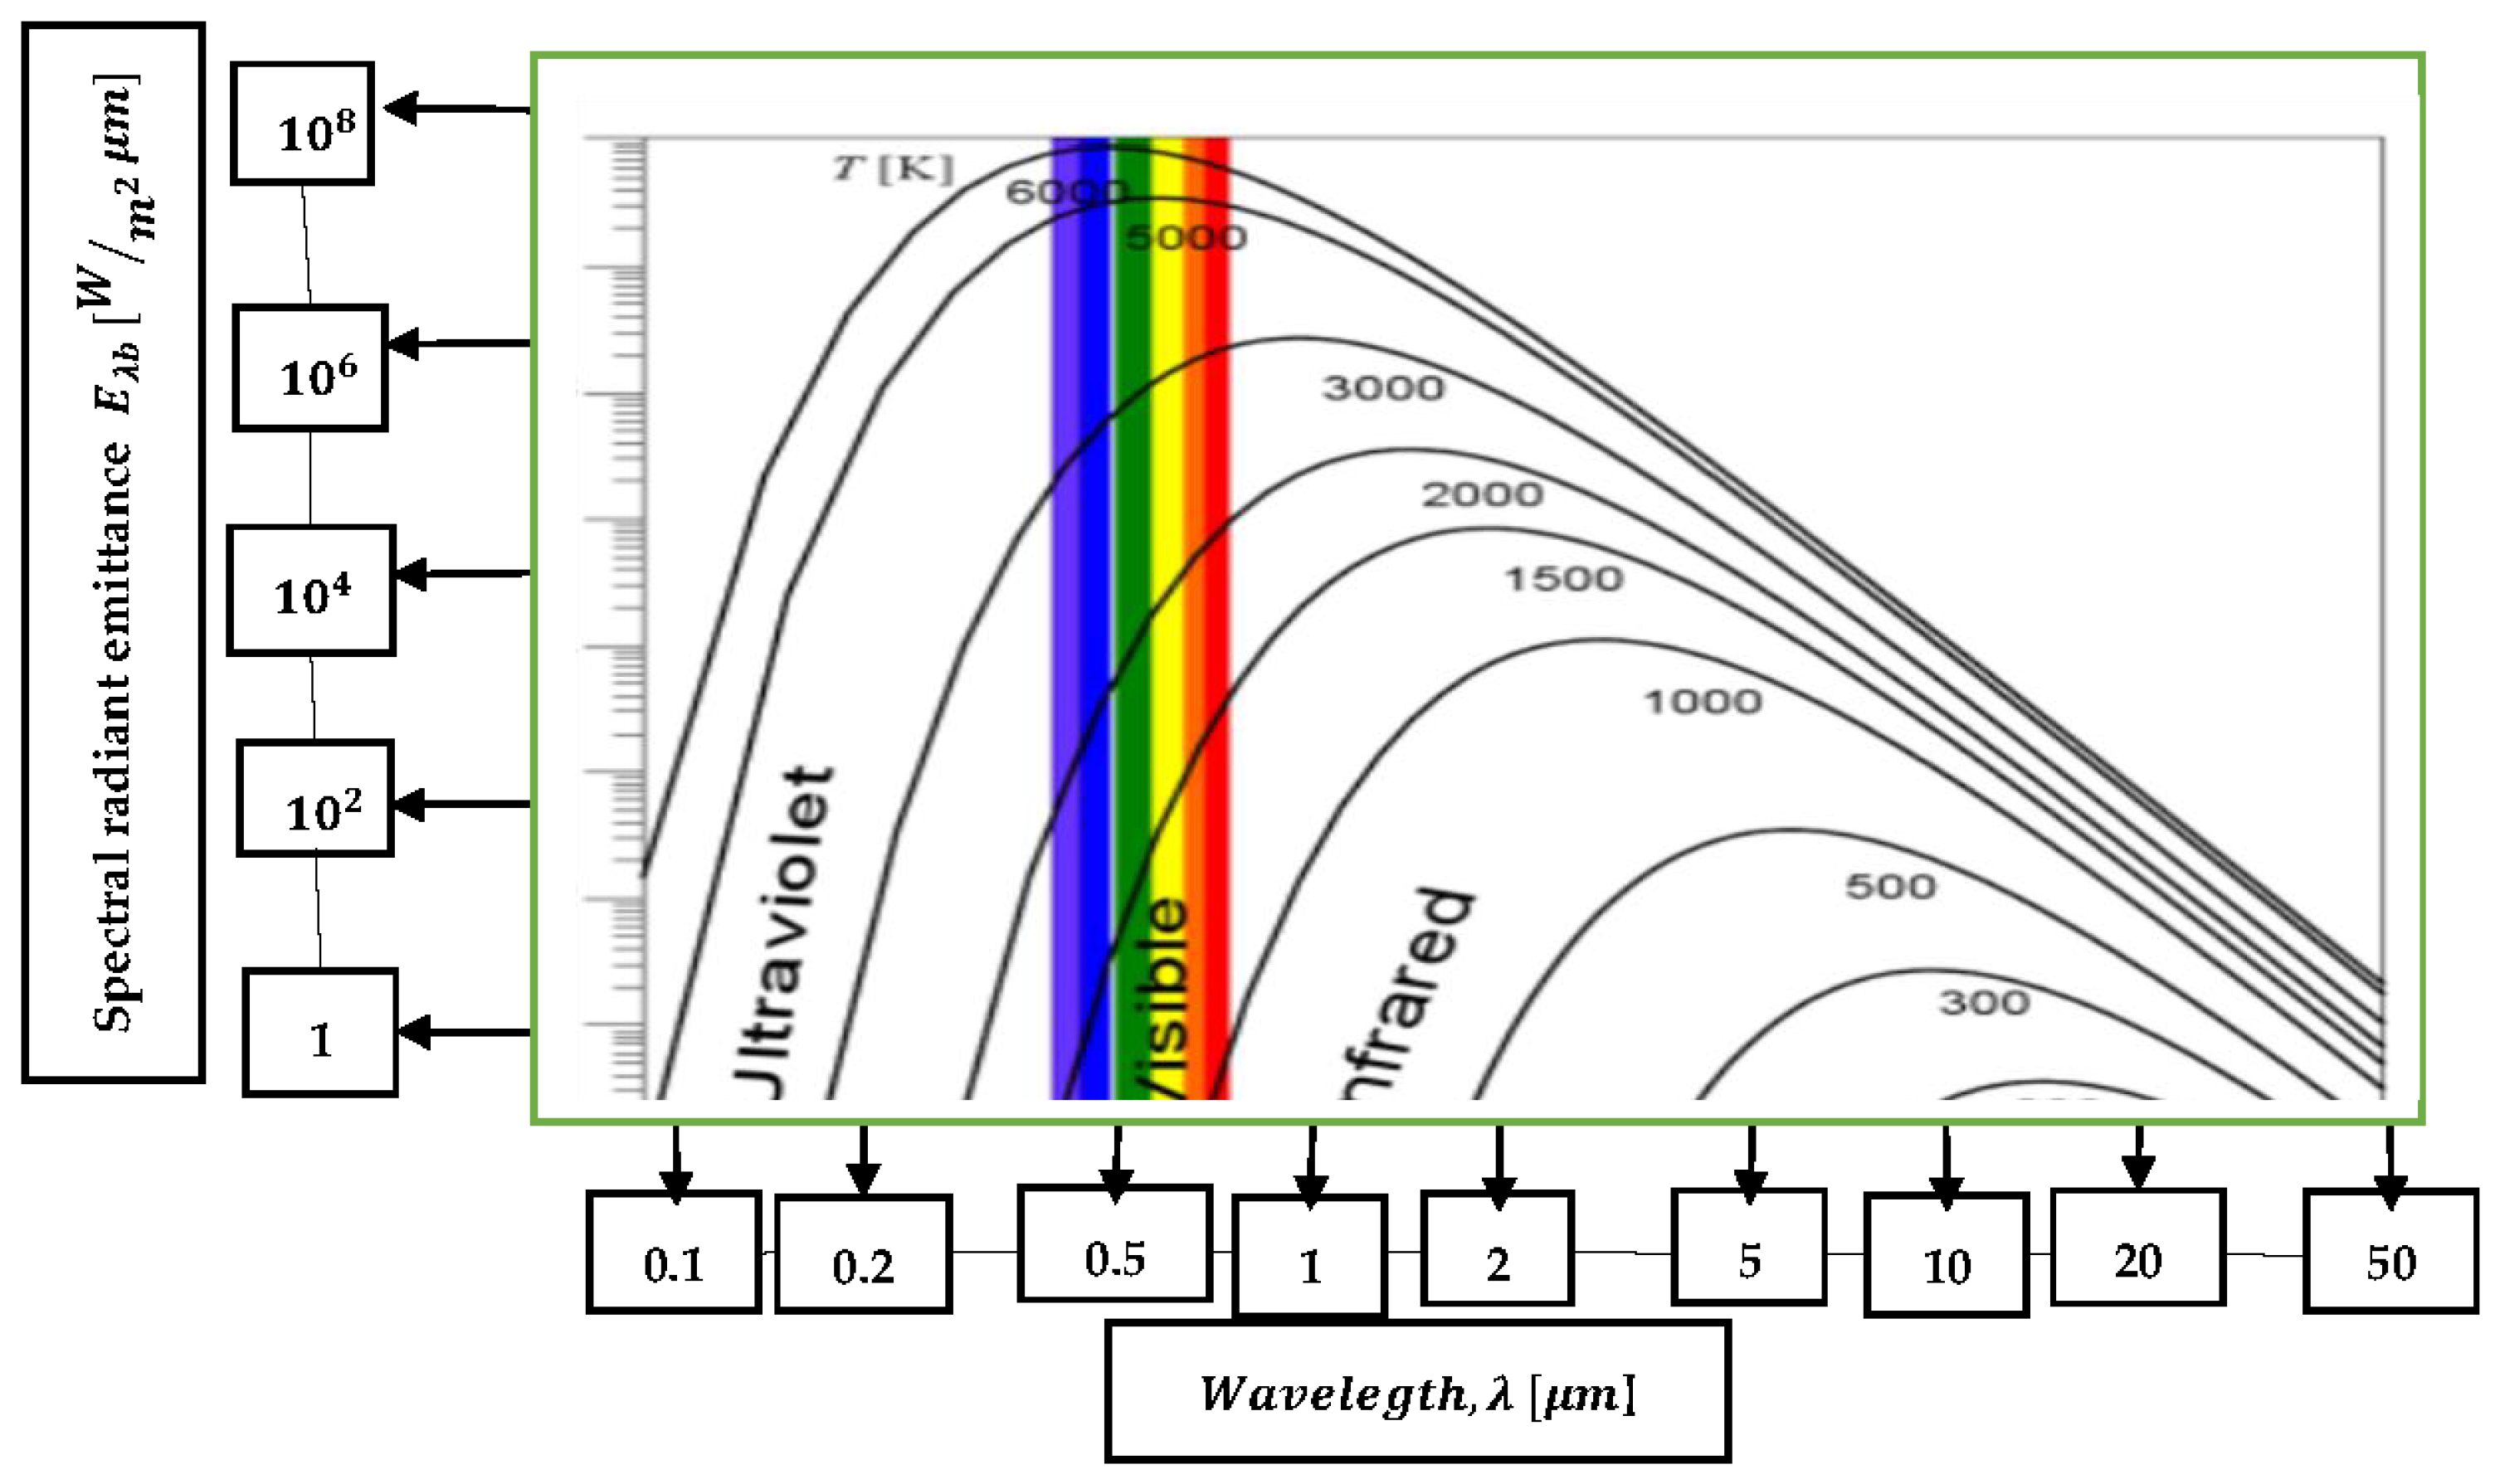
2.1. Spectral Range
2.2. Spatial Resolution
2.3. Spatial Resolution Laser Pointer and Interchangeable Lens
2.4. Temperature Range
2.5. Frame Rate
2.6. Accuracy
3. Experimental Methodologies
- Relative temperature criteria: A collection of safety requirements depending on the temperature increases separated into groups is referred to as “relative temperature criteria”. We can have advisory, intermediate, severe, and critical kinds in electrical machines. You may have a rule that says if a machine’s temperature climbs 10 degrees over a baseline temperature, it is considered advisory. It is deemed to be critical when a device’s temperature rises beyond 104 degrees above a connection or baseline temperature.
- Absolute temperature criteria: To determine the maximum permissible temperature, a thermographer may utilize material or design parameters obtained from previously published data. When the emphasis of the monitoring is on the machine’s material, material criteria are employed, whereas design criteria are utilized when the attention is on the machine’s design. Despite the fact that the criteria are segregated into these two groups, the material element is often included in the method, making it an adequate criterion for monitoring dependability. The component material with the lowest temperature specification should be utilized as “alert criteria” if you are using material criteria to assess the heating of many surrounding components.
- Profile Assessment Criteria: A profile assessment procedure is used to examine temperature differences and trends over any surface. To do a profile evaluation in thermography, you must first establish the absolute and differential temperatures by performing a severity assessment. The state of the machine or component will be classified into two parts: “as new” and “failed.” According to Hitchcock, temperature profile, historical trends, regional variations, absolute temperatures, and the region of anomalies are all essential aspects of a profile investigation.
3.1. Classifying of Thermographic Techniques
3.1.1. Active Thermography
3.1.2. Passive Thermography
3.2. Image Acquisition for Thermographic Images
3.3. Image Processing and Feature Extraction
3.4. IRTs Typical Condition Monitoring for Electrical Equipment
- Temperature trends are compared between stages. The temperature is uniform with a balanced load and under typical operating circumstances.
- For each phase, the conductor route is traced. There are no hot patches or temperature gradients on the conductor.
- If the metal enclosure blocks the current-carrying elements of the switchgear and electrical junction during scanning, the camera will show the heat pattern generated by the sheet metal. Between stages, the picture is compared to the internal components and the heat pattern. The heat pattern associated with load currents is linked to switchgear trended data.
4. The State-of-the-Art Algorithms and Methods
4.1. K-Means Algorithm
- Convert a thermal picture to a greyscale image and set up cluster centers for each of the k groups.
- All points in the picture should be clustered into k groups based on their minimal distance.
- Calculate each cluster’s mean value and use it as the new cluster center.
- Steps (2) and (3) should be repeated until the cluster centers do not change.
- Each picture is divided into k areas, with grey values ranging from tiny to big being colored differently.
- Obtain the minimum, mean, median, and maximum grey value and area information for each cluster, and then the temperature information for each cluster.
4.2. SVM Parameter Optimization
5. IRT Applications in Condition Monitoring for Electrical Energy
5.1. Results in the Electrical and Electronics Applications
5.2. Hotspot Detection
5.3. Improving Inspection Techniques
5.4. Methods of Measurement and Analysis
5.5. Application to Motors
5.5.1. Failure of Cooling System
5.5.2. Bearing Faults
5.5.3. Stator Fault
5.5.4. Eccentricity Fault
5.6. Including and Excluding Criteria
6. Conclusions and Recommendations
- NFPA 70E, Standard for Electrical Safety Requirements for Employee Workplaces, 1995, is one of the numerous publications in the 70 series released by the National Fire Protection Association (NFPA). One of the essential improvements in thermographers’ work habits is conducting electrical checks. It has to do with avoiding an electrical arc flash, which may be very dangerous or even deadly at low levels of 400 V. Additionally, thermographers who are not electricians may be ignorant of the risks of working near active components. NFPA 70E defines limitations and advises personal protective equipment (PPE) to reduce the severity of accidents. Another alternative is to utilize an Infrared Inspection Window, which separates environments with different pressures or temperatures while still allowing IR radiation to pass through.
- Continuous thermal imaging provides additional advantages over periodic thermal examination, particularly in electrical equipment reliability. Continuous thermal monitoring is a benefit since defects may occur at any moment. Furthermore, it is not operator-dependent, and it is not reliant on frequent inspection, particularly under large loads. In addition, real-time monitoring may trigger signals or alerts if abnormalities arise unexpectedly, allowing necessary action to be performed simultaneously. Furthermore, integration with existing Supervisory Control and Data Acquisition (SCADA) systems would allow for real-time remote monitoring without the need for a separate system or report, which is conceivable but not practicable with regular thermal inspections.
- Thermocouples, infrared (IR) cameras, and fiber Bragg gratings have all been used to measure high temperatures (FBGs). Most thermocouples and infrared cameras monitor temperature on the cutting tool’s rake and flank faces. They are not appropriate for temperature readings because of the difficulties of placement between the flank face and the workpiece surface. Furthermore, FBGs are contact sensors, which have the drawback of being fragile and difficult to mount near the measurement site. Only a few solutions give a reasonable solution for temperature readings on the workpiece surface, but integrated sensors in the cutting tool are difficult to install. A two-color fiber-optic pyrometer might be used to circumvent these limitations. To circumvent the emissivity dependency of temperature, it exploits the ratio of optical powers at two spectral bands to construct a self-referencing mechanism. Using optical fibers, you can see isolated regions with a spatial resolution limited only by the numerical aperture and fiber diameters.
- Due to the increased need for preventative maintenance in electrical power equipment, more reliable and resilient intelligent solutions, such as the automated segmentation algorithm to determine the region’s interest in detecting the hotspots of electrical equipment, are urgently required. The majority of existing systems employ manual segmentation based on standard image processing methods. These methods’ output will likely capture the artificial hotspot in the region of interest, enabling CBM analysis to detect the temperature difference. Due to the various properties of the equipment, the created intelligent systems could only be employed for special electrical equipment up until now. As a result, a clever, smart system model must be devised and built to address the picture quality issue. Noises will usually impact the collected picture when inspections are done outside. As a result, complex image processing methods and new algorithms have to be investigated to tackle these issues.
Author Contributions
Funding
Institutional Review Board Statement
Informed Consent Statement
Data Availability Statement
Acknowledgments
Conflicts of Interest
References
- Condition Monitoring: An Overview|Reliable Plant. Available online: https://www.reliableplant.com/condition-monitoring-31760 (accessed on 30 September 2021).
- Brotherton, T.; Jahns, G.; Jacobs, J.; Wroblewski, D. Prognosis of faults in gas turbine engines. In Proceedings of the IEEE Aerospace Conference, Big Sky, MT, USA, 25 March 2000; Volume 6, pp. 163–172. [Google Scholar] [CrossRef]
- Yang, S.; Xiang, D.; Bryant, A.; Mawby, P.; Ran, L.; Tavner, P. Condition monitoring for device reliability in power electronic converters: A review. IEEE Trans. Power Electron. 2010, 25, 2734–2752. [Google Scholar] [CrossRef]
- Using Thermography to Uncover Hidden Problems. Available online: https://www.reliableplant.com/Read/28638/using-thermography (accessed on 30 September 2021).
- Yang, C.; Xiaoming, G.; Qi, J. Infrared technology in the fault diagnosis of substation equipment. In Proceedings of the 2008 China International Conference on Electricity Distribution, Guangzhou, China, 10–13 December 2008. [Google Scholar] [CrossRef]
- Balaras, C.A.; Argiriou, A.A. Infrared thermography for building diagnostics. Energy Build. 2001, 34, 171–183. [Google Scholar] [CrossRef]
- Azmat, Z.; Turner, D.J. Infrared thermography and its role in rural utility environment. In Proceedings of the Rural Electric Power Conference, San Antonio, TX, USA, 8–10 May 2005. [Google Scholar] [CrossRef]
- Jadin, M.S.; Taib, S. Recent progress in diagnosing the reliability of electrical equipment by using infrared thermography. Infrared Phys. Technol. 2012, 55, 236–245. [Google Scholar] [CrossRef]
- Thomson, W.T.; Fenger, M. Current signature analysis to detect induction motor faults. IEEE Ind. Appl. Mag. 2001, 7, 26–34. [Google Scholar] [CrossRef]
- Protection System of Three Phase Induction Motor Using Relays [Internet]. Available online: http://ir.aiktclibrary.org:8080/xmlui/handle/123456789/1584 (accessed on 16 June 2022).
- Short-Circuit or Overload Protection|Motor Control|EECO. Available online: https://eecoonline.com/short-circuit-protection-or-overload-protection/ (accessed on 27 May 2022).
- Picazo-Ródenas, M.J.; Antonino-Daviu, J.; Climente-Alarcon, V.; Royo-Pastor, R.; Mota-Villar, A. Combination of noninvasive approaches for general assessment of induction motors. IEEE Trans. Ind. Appl. 2014, 51, 2172–2180. [Google Scholar] [CrossRef]
- Picazo-Ródenas, M.J.; Royo, R.; Antonino-Daviu, J.; Roger-Folch, J. Use of the infrared data for heating curve computation in induction motors: Application to fault diagnosis. Eng. Fail. Anal. 2013, 35, 178–192. [Google Scholar] [CrossRef]
- Thermography Theory—Physical Basics|InfraTec GmbH. Available online: https://www.infratec.eu/thermography/service-support/glossary/theory/ (accessed on 9 June 2021).
- Theoretical Principle of Thermography|Infrared Detection|Testo® India. Available online: https://www.testo.com/en-IN/Theoretical+principles+of+thermography+/services_knowledgebase_thermography_theory (accessed on 9 June 2021).
- Meola, C. (Ed.) Infrared Thermography Recent Advances and Future Trends—Google Books. Available online: https://books.google.com.my/books?hl=en&lr=&id=ngMqDgAAQBAJ&oi=fnd&pg=PA3&dq=infrared+thermography+theory&ots=K1QjiEeLDF&sig=E1HCbZw3_MhBvzsB7bVKDrorQP4#v=onepage&q&f=false (accessed on 9 June 2021).
- Lahiri, B.B.; Bagavathiappan, S.; Jayakumar, T.; Philip, J. Medical applications of infrared thermography: A review. Infrared Phys. Technol. 2012, 55, 221–235. [Google Scholar] [CrossRef] [PubMed]
- Radiometric Temperature Measurements: I. Fundamentals—Google Books. Available online: https://books.google.com.my/books?hl=en&lr=&id=SmL7HOyEn1QC&oi=fnd&pg=PP1&ots=f6icGs68B1&sig=oHZalyBM92Wbgn7KXlRQTKStWkk&redir_esc=y#v=onepage&q&f=false (accessed on 25 August 2021).
- Biomedical Sensors—Google Books. Available online: https://books.google.com.my/books?hl=en&lr=&id=7cI83YOIUTkC&oi=fnd&pg=PR5&ots=mMwZ0Nhpv_&sig=_9MPAsny6-g-v_8oMJO6yPs898o&redir_esc=y#v=onepage&q&f=false (accessed on 25 August 2021).
- Kylili, A.; Fokaides, P.A.; Christou, P.; Kalogirou, S.A. Infrared thermography (IRT) applications for building diagnostics: A review. Appl. Energy 2014, 134, 531–549. [Google Scholar] [CrossRef]
- Scopus—Document Details—New Developments in Low Cost Infrared Imaging System|Signed in. Available online: https://www.scopus.com/record/display.uri?eid=2-s2.0-84862180679&origin=inward&txGid=b18f13a6446695c3ee52b1985c6dbecf (accessed on 25 August 2021).
- White, T.; Marshall, C.; Butler, N. Uncooled infrared sensor with digital focal plane array for medical applications. In Proceedings of the 18th Annual International Conference of the IEEE Engineering in Medicine and Biology Society, Amsterdam, The Netherlands, 31 October–3 November 1996; Volume 5, pp. 2081–2082. [Google Scholar] [CrossRef]
- Venkataraman, S.B.; Raj, B. Performance parameters for thermal imaging systems. Insight Non-Destr. Test. Cond. Monit. 2003, 45, 531–535. [Google Scholar] [CrossRef]
- An Informative Guide for the Use of Thermal Imaging Cameras in Industrial Applications Thermal Imaging Guidebook for Industrial Applications Content [Internet]. Available online: https://www.flirmedia.com/MMC/THG/Brochures/T820264/T820264_EN.pdf (accessed on 16 June 2022).
- Sarawade, A.A.; Charniya, N.N. Infrared Thermography and its Applications: A Review. In Proceedings of the 2018 3rd International Conference on Communication and Electronics Systems (ICCES), Coimbatore, India, 15–16 October 2018; pp. 280–285. [Google Scholar] [CrossRef]
- Infrared Thermography Explained|Reliable Plant. Available online: https://www.reliableplant.com/infrared-thermography-31572 (accessed on 31 August 2021).
- Thermography Analysis—Arnold Engineering Arnold Engineering. Available online: https://www.arnoldengineering.co.uk/thermography-analysis/ (accessed on 31 August 2021).
- Fox, M.; Coley, D.; Goodhew, S.; de Wilde, P. Thermography methodologies for detecting energy related building defects. Renew. Sustain. Energy Rev. 2014, 40, 296–310. [Google Scholar] [CrossRef]
- Yang, R.; He, Y. Optically and non-optically excited thermography for composites: A review. Infrared Phys. Technol. 2016, 75, 26–50. [Google Scholar] [CrossRef]
- Melnyk, S.; Tuluzov, I.; Melnyk, A. Method of remote dynamic thermographic testing of wind turbine blades. In Proceedings of the 12th International Conference on Quantitative InfraRed Thermography, Bordeaux, France, 7–11 July 2014. [Google Scholar] [CrossRef]
- Harizi, W.; Chaki, S.; Bourse, G.; Ourak, M. Mechanical damage assessment of Glass Fiber-Reinforced Polymer composites using passive infrared thermography. Compos. Part B Eng. 2014, 59, 74–79. [Google Scholar] [CrossRef]
- Why Thermography Is Good for Your Business. Available online: http://www.fluke.com (accessed on 28 August 2021).
- Kabir, S.; Jadin, M.S.; Taib, S.; Yusof, M.A.B. Image processing methods for evaluating infrared thermographic image of electrical equipments. In Proceedings of the Progress in Electromagnetics Research Symposium, Marrakesh, Morocco, 20–23 March 2011. [Google Scholar]
- Huda, A.S.N.; Taib, S. Suitable features selection for monitoring thermal condition of electrical equipment using infrared thermography. Infrared Phys. Technol. 2013, 61, 184–191. [Google Scholar] [CrossRef]
- Chou, Y.C.; Yao, L. Automatic diagnosis system of electrical equipment using infrared thermography. In Proceedings of the 2009 International Conference of Soft Computing and Pattern Recognition, Malacca, Malaysia, 4–7 December 2009; pp. 155–160. [Google Scholar] [CrossRef]
- Jadin, M.S.; Kabir, S.; Taib, S. Thermal imaging for qualitative-based measurements of thermal anomalies in electrical components. In Proceedings of the 2011 Saudi International Electronics, Communications and Photonics Conference (SIECPC), Riyadh, Saudi Arabia, 24–26 April 2011. [Google Scholar] [CrossRef]
- Kapur, J.N.; Sahoo, P.K.; Wong, A.K.C. A new method for gray-level picture thresholding using the entropy of the histogram. Comput. Vision Graph. Image Process. 1985, 29, 273–285. [Google Scholar] [CrossRef]
- INIS Repository Search—Single Result. Available online: https://inis.iaea.org/search/searchsinglerecord.aspx?recordsFor=SingleRecord&RN=45098330 (accessed on 29 August 2021).
- Bagavathiappan, S.; Lahiri, B.B.; Saravanan, T.; Philip, J.; Jayakumar, T. Infrared thermography for condition monitoring—A review. Infrared Phys. Technol. 2013, 60, 35–55. [Google Scholar] [CrossRef]
- Ahmed, M.M.; Huda, A.S.N.; Isa, N.A.M. Recursive construction of output-context fuzzy systems for the condition monitoring of electrical hotspots based on infrared thermography. Eng. Appl. Artif. Intell. 2015, 39, 120–131. [Google Scholar] [CrossRef]
- Bakar, A.H.A.; Illias, H.A.; Othman, M.K.; Mokhlis, H. Identification of failure root causes using condition based monitoring data on a 33 kV switchgear. Int. J. Electr. Power Energy Syst. 2013, 47, 305–312. [Google Scholar] [CrossRef]
- Jain, A.K. Data clustering: 50 years beyond K-means. Pattern Recognit. Lett. 2009, 31, 651–666. [Google Scholar] [CrossRef]
- Rahmani, A.; Haddadnia, J.; Seryasat, O. Intelligent fault detection of electrical equipment in ground substations using thermo vision technique. In Proceedings of the 2010 2nd International Conference on Mechanical and Electronics Engineering, Kyoto, Japan, 1–3 August 2010. [Google Scholar] [CrossRef]
- Huang, C.L.; Dun, J.F. A distributed PSO–SVM hybrid system with feature selection and parameter optimization. Appl. Soft Comput. 2008, 8, 1381–1391. [Google Scholar] [CrossRef]
- Wu, C.H.; Tzeng, G.H.; Lin, R.H. A Novel hybrid genetic algorithm for kernel function and parameter optimization in support vector regression. Expert Syst. Appl. 2008, 36, 4725–4735. [Google Scholar] [CrossRef]
- Vinay, C.; Reddy, K.; Ramana, K.V. A review of methods on Condition Monitoring and Fault Diagnosis using IR Thermography-An Expert System approach. IOP Conf. Ser. Mater. Sci. Eng. 2020, 981, 042027. [Google Scholar] [CrossRef]
- The Latest Reliability & Uptime Maintenance News—Reliabilityweb: A Culture of Reliability. Available online: https://reliabilityweb.com/ (accessed on 31 August 2021).
- Kandeal, A.; Elkadeem, M.; Thakur, A.K.; Abdelaziz, G.B.; Sathyamurthy, R.; Kabeel, A.; Yang, N.; Sharshir, S.W. IInfrared thermography-based condition monitoring of solar photovoltaic systems: A mini review of recent advances. Sol. Energy 2021, 223, 33–43. [Google Scholar] [CrossRef]
- Doshvarpassand, S.; Wu, C.; Wang, X. An overview of corrosion defect characterization using active infrared thermography. Infrared Phys. Technol. 2018, 96, 366–389. [Google Scholar] [CrossRef]
- Suguna, M.; Roomi, S.M.M.; Sanofer, I. Fault localisation of electrical equipments using thermal imaging technique. In Proceedings of the 2016 International Conference on Emerging Technological Trends (ICETT), Kollam, India, 21–22 October 2016. [Google Scholar] [CrossRef]
- Infrared Thermography—Google Books. Available online: https://books.google.com.my/books?hl=en&lr=&id=thyaDwAAQBAJ&oi=fnd&pg=PA209&dq=+Thermal+imaging+for+enhancing+inspection+reliability:+Detection+and+characterization&ots=2tiB1TvZA0&sig=zl2g5htQopKLxNss-SCLtW40h58&redir_esc=y#v=onepage&q=Thermal+imaging+for+enhancing+inspection+reliability%3A+Detection+and+characterization&f=false (accessed on 2 September 2021).
- Gade, R.; Moeslund, T.B. Thermal cameras and applications: A survey. Mach. Vis. Appl. 2013, 25, 245–262. [Google Scholar] [CrossRef]
- Huda, A.S.N.; Taib, S.; Jadin, M.S.; Ishak, D. A semi-automatic approach for thermographic inspection of electrical installations within buildings. Energy Build. 2012, 55, 585–591. [Google Scholar] [CrossRef]
- IEEE Xplore Full-Text PDF. Available online: https://ieeexplore.ieee.org/stamp/stamp.jsp?tp=&arnumber=8656979&tag=1 (accessed on 24 February 2021).
- Utami, N.Y.; Tamsir, Y.; Pharmatrisanti, A.; Gumilang, H.; Cahyono, B.; Siregar, R. Evaluation condition of transformer based on infrared thermography results. In Proceedings of the 2009 IEEE 9th International Conference on the Properties and Applications of Dielectric Materials, Harbin, China, 19–23 July 2009; pp. 1055–1058. [Google Scholar] [CrossRef]
- Weiping, M.; Fangxiao, C.; Ying, S.; Chungui, X.; Ming, A. Fault diagnosis on power transformers using non-electric method. IEEE Int. Symp. Ind. Electron. 2006, 3, 1769–1773. [Google Scholar] [CrossRef]
- Pearson, J.C.; Pandya, D.A. Utilizing infrared and power quality techniques to diagnose and re-commission 33 old power, lighting & receptacles panels and distribution transformers at the New Jersey International & Bulk Mail Center. In Proceedings of the 2007 Electrical Insulation Conference and Electrical Manufacturing Expo, Nashville, TN, USA, 22–24 October 2007; pp. 1–4. [Google Scholar] [CrossRef]
- Pal, N.R.; Pal, S.K. A review on image segmentation techniques. Pattern Recognit. 1993, 26, 1277–1294. [Google Scholar] [CrossRef]
- Pätz, T.; Preusser, T. Segmentation of stochastic images with a stochastic random walker method. IEEE Trans. Image Process. 2012, 21, 2424–2433. [Google Scholar] [CrossRef] [PubMed]
- Almeida, C.A.L.; Braga, A.; Nascimento, S.; Paiva, V.; Martins, H.J.A.; Torres, R.; Caminhas, W.M. Intelligent thermographic diagnostic applied to surge arresters: A new approach. IEEE Trans. Power Deliv. 2009, 24, 751–757. [Google Scholar] [CrossRef]
- Sergyán, S. Edge detection techniques of thermal images. In Proceedings of the 2012 IEEE 10th Jubilee International Symposium on Intelligent Systems and Informatics, Subotica, Serbia, 20–22 September 2012; pp. 227–231. [Google Scholar] [CrossRef]
- Chacon, M.; Manickavasagan, A.; Flores-Tapia, D.; Thomas, G.; Joyas, D.S. Segmentation of wheat grains in thermal images based on pulse coupled neural networks. In Proceedings of the 2007 IEEE International Conference on Image Processing, San Antonio, TX, USA, 16 September–19 October 2007; Volume 2. [Google Scholar] [CrossRef]
- Kapoor, P.; Prasad, S.V.A.V. Image processing for early diagnosis of breast cancer using infrared images. In Proceedings of the 2010 the 2nd International Conference on Computer and Automation Engineering (ICCAE), Singapore, 26–28 February 2010; Volume 3, pp. 564–566. [Google Scholar] [CrossRef]
- Gomez-Moreno, H.; Maldonado-Bascon, S.; Gil-Jimenez, P.; Lafuente-Arroyo, S. Goal evaluation of segmentation algorithms for traffic sign recognition. IEEE Trans. Intell. Transp. Syst. 2010, 11, 917–930. [Google Scholar] [CrossRef]
- Meng, F.; Li, H.; Liu, G.; Ngan, K.N. From logo to object segmentation. IEEE Trans. Multimed. 2013, 15, 2186–2197. [Google Scholar] [CrossRef]
- Chan, W.L.; So, A.T.P.; Lai, L.L. Three-dimensional thermal imaging for power equipment monitoring. IEE Proc. Gener. Transm. Distrib. 2000, 147, 355–360. [Google Scholar] [CrossRef]
- Fan, S.; Yang, S.; He, P.; Nie, H. Infrared Electric Image Thresholding Using Two-Dimensional Fuzzy Renyi Entropy. Energy Procedia 2011, 12, 411–419. [Google Scholar] [CrossRef]
- Picazo-Rodenas, M.J.; Royo, R.; Antonino-Daviu, J.; Roger-Folch, J. Use of infrared thermography for computation of heating curves and preliminary failure detection in induction motors. In Proceedings of the 2012 XXth International Conference on Electrical Machines, Marseille, France, 2–5 September 2012; pp. 525–531. [Google Scholar] [CrossRef]
- Eftekhari, M.; Moallem, M.; Sadri, S.; Hsieh, M.F. A novel indicator of stator winding inter-turn fault in induction motor using infrared thermal imaging. Infrared Phys. Technol. 2013, 61, 330–336. [Google Scholar] [CrossRef]
- Amaral, T.G.; Pires, V.F.; Martins, J.F.; Pires, A.J.; Crisóstomo, M.M. Image processing to a neuro-fuzzy classifier for detection and diagnosis of induction motor stator fault. In Proceedings of the IECON 2007—33rd Annual Conference of the IEEE Industrial Electronics Society, Taipei, Taiwan, 5–8 November 2007; pp. 2408–2413. [Google Scholar] [CrossRef]
- Han, Y.; Song, Y.H. Condition monitoring techniques for electrical equipment—A literature survey. IEEE Trans. Power Deliv. 2003, 18, 4–13. [Google Scholar] [CrossRef]
- Abu-Siada, A.; Islam, S. A novel online technique to detect power transformer winding faults. IEEE Trans. Power Deliv. 2012, 27, 849–857. [Google Scholar] [CrossRef]
- Farag, S.; Lin, B.K.; Habetler, T.G.; Schlag, J.H. An Unsupervised, On-Line System for Induction Motor Fault Detection Using Stator Current Monitoring. IEEE Trans. Ind. Appl. 1995, 31, 1280–1286. [Google Scholar] [CrossRef]
- Yazici, B.; Kliman, G.B.; Premerlani, W.J.; Koegl, R.A.; Robinson, G.B.; Abdel-Malek, A. Adaptive, on-line, statistical method for bearing fault detection using stator current. In Proceedings of the IAS ’97. Conference Record of the 1997 IEEE Industry Applications Conference Thirty-Second IAS Annual Meeting, New Orleans, LA, USA, 5–9 October 1997; Volume 1, pp. 213–220. [Google Scholar] [CrossRef]
- Zidani, F.; Benbouzid, M.E.H.; Diallo, D.; Naït-Saïd, M.S. Induction Motor Stator Faults Diagnosis by a Current Concordia Pattern-Based Fuzzy Decision System. IEEE Trans. Energy Convers. 2003, 18, 469–475. [Google Scholar] [CrossRef]
- Briz, F.; Degner, M.W.; Zamarrón, A.; Guerrero, J.M. Online Stator Winding Fault Diagnosis in Inverter-Fed AC Machines using High-Frequency Signal Injection. IEEE Trans. Ind. Appl. 2003, 39, 1109–1117. [Google Scholar] [CrossRef]
- Shutenko, O.; Ponomarenko, S. Diagnostics of Transformer Oils Using the Multiple Linear Regression Model. In Proceedings of the 2020 IEEE Problems of Automated Electrodrive. Theory and Practice (PAEP), Kremenchuk, Ukraine, 21–25 September 2020. [Google Scholar] [CrossRef]
- Gielniak, J.; Czerniak, M. Investigation of Distribution Transformers Vibrations in Terms of Core and Winding Condition Assessment. Energies 2021, 15, 13. [Google Scholar] [CrossRef]
- Kang, P.; Kang, P.; Birtwhistle, D. On-Line Condition Assessment of Power Transformer on-Load Tap Changers: Transient Vibration Analysis Using Wavelet Transform and Self-Organizing Map. 2000. Available online: http://citeseerx.ist.psu.edu/viewdoc/summary?doi=10.1.1.1006.6343 (accessed on 29 May 2022).
- Kang, P.; Birtwhistle, D. Condition assessment of power transformer on-load tap-changers using wavelet analysis. IEEE Trans. Power Deliv. 2001, 16, 394–400. [Google Scholar] [CrossRef]
- Chien, C.-L.; Tseng, C. Information and Control ICIC International 2011 ISSN. Int. J. Innov. Comput. 2011, 7, 6691–6710. [Google Scholar]
- Dutta, T.; Sil, J.; Chottopadhyay, P. Condition monitoring of electrical equipment using thermal image processing. In Proceedings of the 2016 IEEE First International Conference on Control, Measurement and Instrumentation (CMI), Kolkata, India, 8–10 January 2016; pp. 311–315. [Google Scholar] [CrossRef]
- Hellier, C.J. Handbook of Nondestructive Evaluation, 2nd ed.; McGraw-Hill Education: New York, NY, USA, 2013; p. 720. Available online: https://www.accessengineeringlibrary.com/content/book/9780071777148 (accessed on 2 September 2021).
- Griffith, D.A.; Zeybek, A.Y.; O’Brien, M. Knowledge Transfer as a Means for Relationship Development: A Kazakhstan–Foreign International Joint Venture Illustration. J. Int. Mark. 2018, 9, 1–18. [Google Scholar] [CrossRef]
- Santos, L.D.; Bortoni, E.C.; Souza, L.E.; Bastos, G.S.; Craveiro, M.A.C. Infrared thermography applied for outdoor power substations. In Proceedings of the SPIE Defense and Security Symposium, Orlando, FL, USA, 16–20 March 2008. [Google Scholar] [CrossRef]
- Gašperič, S.; Šprajcar, B.; Bernard, R.; Glavič, R.; Elektro, S.; -Slovenija, L.D.D. The analysis of thermographic reports with emphasis on emissivity coefficient determination of bare conductors and joints. Connections 2007, 20, 21–24. [Google Scholar]
- Snell, J.; Renowden, J. Improving results of thermographic inspections of electrical transmission and distribution lines. In Proceedings of the 2000 IEEE ESMO-2000 9th International Conference on Transmission and Distribution Construction, Operation and Live-Line Maintenance Proceedings, ESMO 2000 Proceedings, Global ESMO 2000, The Powa, Montreal, QC, Canada, 8–12 October 2000; pp. 303–311. [Google Scholar] [CrossRef]
- Epperly, R.A.; Heberlein, G.E.; Eads, L.G. Tool for reliability and safety: Predict and prevent equipment failures with thermography. In Proceedings of the Record of Conference Papers, IEEE Industry Applications Society 44th Annual Petroleum and Chemical Industry Conference, Banff, AB, Canada, 15–17 September 1997; pp. 59–68. [Google Scholar] [CrossRef]
- Zhang, L.; Ume, I.C.; Gamalski, J.; Galuschki, K.P. Study of flip chip solder joint cracks under temperature cycling using a laser ultrasound inspection system. IEEE Trans. Components Packag. Technol. 2009, 32, 120–126. [Google Scholar] [CrossRef]
- IEICE Trans—Laser-SQUID Microscopy as a Novel Tool for Inspection, Monitoring and Analysis of LSI-Chip-Defects: Nondestructive and Non-Electrical-Contact Technique. Available online: https://search.ieice.org/bin/summary.php?id=e85-c_3_746 (accessed on 30 May 2022).
- dos Reis Benatto, G.A.; Chi, M.; Lancia, A.A.S.; Riedel-Lyngskær, N.; Jensen, O.B.; Thorseth, A.; Dam-Hansen, C.; Thorsteinsson, S.; Poulsen, P.B. Scaling up Laser Line Photoluminescence Imaging for Outdoor Inspections. In Proceedings of the 35th European Photovoltaic Solar Energy Conference and Exhibition, Brussels, Belgium, 24–28 September 2018; Volume 10, p. 2020. [Google Scholar] [CrossRef]
- Benatto, G.A.D.R.; Chi, M.; Jensen, O.B.; Lancia, A.A.S.; Riedel, N.; Iandolo, B.; Davidsen, R.S.; Hansen, O.; Thorsteinsson, S.; Poulsen, P.B. Photoluminescence Imaging Induced by Laser Line Scan: Study for Outdoor Field Inspections. In Proceedings of the 2018 IEEE 7th World Conference on Photovoltaic Energy Conversion (WCPEC) (A Joint Conference of 45th IEEE PVSC, 28th PVSEC & 34th EU PVSEC), Waikoloa, HI, USA, 10–15 June 2018; pp. 395–399. [Google Scholar] [CrossRef]
- Takasaki, M.; Chino, S.; Kato, Y.; Ishino, Y.; Mizuno, T. Actuation Force Measurement Mechanism for Non-Contact Ultrasonic Suspension. Key Eng. Mater. 2012, 523–524, 727–732. [Google Scholar] [CrossRef]
- Zhao, Z.; Törmänen, M.; Myllylä, R. Frequency spectrum of laser ultrasonic signals from fibers and particles suspensions. Mol. Quantum Acoust. 2006, 27, 319–326. [Google Scholar]
- Lindquist, T.M.; Bertling, L.; Eriksson, R. Estimation of disconnector contact condition for modelling the effect of maintenance and ageing. In Proceedings of the 2005 IEEE Russia Power Tech, St. Petersburg, Russia, 27–30 June 2005. [Google Scholar] [CrossRef]
- Standard for Maintenance Testing Specifications for Electrical Power Equipment and Systems Secretariat NETA (InterNational Electrical Testing Association). 2011. Available online: www.netaworld.org (accessed on 29 August 2021).
- Singh, G.; Kumar, T.C.A.; Naikan, V.N.A. Fault diagnosis of induction motor cooling system using infrared thermography. In Proceedings of the 2016 IEEE 6th International Conference on Power Systems (ICPS), New Delhi, India, 4–6 March 2016. [Google Scholar] [CrossRef]
- Infrared Thermography Based Fault Diagnosis and Prognosis for Rotating Machines|Semantic Scholar. Available online: https://www.semanticscholar.org/paper/Infrared-Thermography-Based-Fault-Diagnosis-and-for-Mehta-Choudhary/fbdba0c7610e445a234c98008246846ddff54960 (accessed on 16 June 2022).
- Ramirez-Nunez, J.A.; Morales-Hernandez, L.A.; Osornio-Rios, R.A.; Antonino-Daviu, J.A.; Romero-Troncoso, R.J. Self-adjustment methodology of a thermal camera for detecting faults in industrial machinery. In Proceedings of the IECON 2016—42nd Annual Conference of the IEEE Industrial Electronics Society, Florence, Italy, 23–26 October 2016; pp. 7119–7124. [Google Scholar] [CrossRef]
- Othman, M.S.; Nuawi, M.Z.; Mohamed, R. Experimental Comparison of Vibration and Acoustic Emission Signal Analysis Using Kurtosis-Based Methods for Induction Motor Bearing Condition Monitoring. Prz. Elektrotechniczny 2016, 92, 208–212. [Google Scholar] [CrossRef]
- Choudhary, A.; Shimi, S.L.; Akula, A. Bearing fault diagnosis of induction motor using thermal imaging. In Proceedings of the 2018 International Conference on Computing, Power and Communication Technologies (GUCON), Greater Noida, India, 28–29 September 2018; pp. 950–955. [Google Scholar] [CrossRef]
- Cruz, S.M.A.; Cardoso, A.J.M. Stator winding fault diagnosis in three-phase synchronous and asynchronous motors, by the extended park’s vector approach. IEEE Trans. Ind. Appl. 2001, 37, 1227–1233. [Google Scholar] [CrossRef]
- Joksimovic, G.M.; Penman, J. The detection of inter-turn short circuits in the stator windings of operating motors. IEEE Trans. Ind. Electron. 2000, 47, 1078–1084. [Google Scholar] [CrossRef]
- Bonnett, A.H.; Soukup, G.C. Cause and Analysis of Stator and Rotor Failures in Three-Phase Squirrel-Cage Induction Motors. IEEE Trans. Ind. Appl. 1992, 28, 921–937. [Google Scholar] [CrossRef]
- Lopez-Perez, D.; Antonino-Daviu, J. Application of infrared thermography to fault detection in industrial induction motors: Case stories. In Proceedings of the 2016 XXII International Conference on Electrical Machines (ICEM), Lausanne, Switzerland, 4–7 September 2016; pp. 2172–2177. [Google Scholar] [CrossRef]
- Choudhary, A.; Goyal, D.; Shimi, S.L.; Akula, A. Condition Monitoring and Fault Diagnosis of Induction Motors: A Review. Arch. Comput. Methods Eng. 2018, 26, 1221–1238. [Google Scholar] [CrossRef]
- Sangeeetha, M.S.; Nandhitha, N.M.; Roslin, S.E.; Chakravarthi, R. Impact of Segmentation Techniques for Conditıon Monitorıng of Electrical Equipments from Thermal Images. Lect. Notes Netw. Syst. 2022, 213, 167–179. [Google Scholar] [CrossRef]
- Li, W.; Li, G.; Sun, Z.; Wang, Q. Real-time estimation of junction temperature in IGBT inverter with a simple parameterized power loss model. Microelectron. Reliab. 2021, 127, 114409. [Google Scholar] [CrossRef]
- Vakrilov, N.V.; Kafadarova, N.M.; Zlatanski, D.A. Application of Infrared Imaging in the Field of Electrical Engineering. In Proceedings of the 2021 XXX International Scientific Conference Electronics (ET), Sozopol, Bulgaria, 15–17 September 2021; pp. 1–4. [Google Scholar] [CrossRef]
- Phuc, P.N.; Bozalakov, D.; Vansompel, H.; Stockman, K.; Crevecoeur, G. Rotor Temperature Virtual Sensing for Induction Machines Using a Lumped-Parameter Thermal Network and Dual Kalman Filtering. IEEE Trans. Energy Convers. 2021, 36, 1688–1699. [Google Scholar] [CrossRef]
- Leppänen, J.; Ross, G.; Vuorinen, V.; Ingman, J.; Jormanainen, J.; Paulasto-Kröckel, M. A humidity-induced novel failure mechanism in power semiconductor diodes. Microelectron. Reliab. 2021, 123, 114207. [Google Scholar] [CrossRef]
- Das, A.K.; Dey, D.; Chatterjee, B.; Dalai, S. A Transfer Learning Approach to Sense the Degree of Surface Pollution for Metal Oxide Surge Arrester Employing Infrared Thermal Imaging. IEEE Sens. J. 2021, 21, 16961–16968. [Google Scholar] [CrossRef]
- Badoni, S.; Jarial, R.K. Health Monitoring of three phase induction motor using infrared thermography. In Proceedings of the 2021 6th International Conference on Communication and Electronics Systems (ICCES), Coimbatre, India, 8–10 July 2021; pp. 156–160. [Google Scholar] [CrossRef]
- Xia, C.; Ren, M.; Wang, B.; Dong, M.; Xu, G.; Xie, J.; Zhang, C. Infrared thermography-based diagnostics on power equipment: State-of-the-art. High Volt. 2020, 6, 387–407. [Google Scholar] [CrossRef]
- Choudhary, A.; Mian, T.; Fatima, S. Convolutional neural network based bearing fault diagnosis of rotating machine using thermal images. Measurement 2021, 176, 109196. [Google Scholar] [CrossRef]
- ul Hassan, M.; Khan, T.M.; Abbas, S.; Shahid, M.A.; Tariq, S.T.; Amir, F. Degradation assessment of in-service aerial bundled cables in coastal areas leading to prognosis using infrared thermography. IET Gener. Transm. Distrib. 2020, 15, 1348–1356. [Google Scholar] [CrossRef]
- Susinni, G.; Rizzo, S.A.; Iannuzzo, F. Two decades of condition monitoring methods for power devices. Electronics 2021, 10, 683. [Google Scholar] [CrossRef]
- Kumar, P.S.; Xie, L.; Halick, M.S.M.; Vaiyapuri, V. Stator End-Winding Thermal and Magnetic Sensor Arrays for Online Stator Inter-Turn Fault Detection. IEEE Sens. J. 2020, 21, 5312–5321. [Google Scholar] [CrossRef]
- Vidhya, R.; Ranjan, P.V.; Shanker, N.R. Transformer breather thermal image decomposition for fault diagnosis. In Proceedings of the 2021 7th International Conference on Electrical Energy Systems (ICEES), Chennai, India, 11–13 February 2021; pp. 448–453. [Google Scholar] [CrossRef]
- Shao, H.; Li, W.; Xia, M.; Zhang, Y.; Shen, C.; Williams, D.; Kennedy, A.; de Silva, C.W. Fault Diagnosis of a Rotor-Bearing System under Variable Rotating Speeds Using Two-Stage Parameter Transfer and Infrared Thermal Images. IEEE Trans. Instrum. Meas. 2021, 70, 3524711. [Google Scholar] [CrossRef]
- Ziuzev, A.M.; Kryukov, O.V.; Metelkov, V.P.; Mikhalchenko, S.G. Estimation of thermal state of ac electric motors of trunk gas pipelines compressor stations. Bull. Tomsk Polytech. Univ. Geo Assets Eng. 2021, 332, 88–96. [Google Scholar] [CrossRef]
- Najafi, M.; Baleghi, Y.; Gholamian, S.A.; Mirimani, S.M. Fault Diagnosis of Electrical Equipment through Thermal Imaging and Interpretable Machine Learning Applied on a Newly-introduced Dataset. In Proceedings of the 2020 6th Iranian Conference on Signal Processing and Intelligent Systems (ICSPIS), Mashhad, Iran, 23–24 December 2020. [Google Scholar] [CrossRef]
- Alshorman, O.; Masadeh, M.; Alkahtani, F.; Alshorman, A. A Review of Condition Monitoring and Fault Diagnosis and Detection of Rotating Machinery Based on Image Aspects. In Proceedings of the 2020 International Conference on Data Analytics for Business and Industry: Way towards a Sustainable Economy (ICDABI), Sakheer, Bahrain, 26–27 October 2020. [Google Scholar] [CrossRef]
- Redon, P.; Rodenas, M.J.P.; Antonino-Daviu, J. Development of a diagnosis tool, based on deep learning algorithms and infrared images, applicable to condition monitoring of induction motors under transient regime. In Proceedings of the IECON 2020 The 46th Annual Conference of the IEEE Industrial Electronics Society, Singapore, 18–21 October 2020; pp. 2505–2510. [Google Scholar] [CrossRef]
- Sahu, M.; Sharma, S.R.; Singh, A.; Kumar, R.; Sood, Y.R. An improved infrared thermography techique for hotspot temperature, per unit life and aging accelerating factor computation in transformers. In Proceedings of the 2020 IEEE International Conference on Computing, Power and Communication Technologies (GUCON), Greater Noida, India, 2–4 October 2020; pp. 233–238. [Google Scholar] [CrossRef]
- Xu, X.; Zhou, C.; Zhou, W.; Liao, Y.; Wei, Y.; Yuan, J. Autonomous Diagnosis of Overheating Defects in Cable Accessories Based on Faster RCNN and Mean-Shift Algorithm. In Proceedings of the 2020 IEEE International Conference on High Voltage Engineering and Application (ICHVE), Beijing, China, 6–10 September 2020. [Google Scholar] [CrossRef]
- Nasab, P.S.; Moallem, M.; Chaharsoghi, E.S.; Caicedo-Narvaez, C.; Fahimi, B. Predicting Temperature Profile on the Surface of a Switched Reluctance Motor Using a Fast and Accurate Magneto-Thermal Model. IEEE Trans. Energy Convers. 2020, 35, 1394–1401. [Google Scholar] [CrossRef]
- Wang, B.; Dong, M.; Ren, M.; Wu, Z.; Guo, C.; Zhuang, T.; Pischler, O.; Xie, J. Automatic fault diagnosis of infrared insulator images based on image instance segmentation and temperature analysis. IEEE Trans. Instrum. Meas. 2020, 69, 5345–5355. [Google Scholar] [CrossRef]
- Ni, Z.; Lyu, X.; Yadav, O.P.; Singh, B.N.; Zheng, S.; Cao, D. Overview of real-time lifetime prediction and extension for SiC power converters. IEEE Trans. Power Electron. 2019, 35, 7765–7794. [Google Scholar] [CrossRef]
- Singh, R.P.; Sonawane, A.V.; Satpute, M.S.; Shirsath, D.Y.; Thakre, M.P. A Review on Traditional Methods of Condition Monitoring of Transformer. In Proceedings of the 2020 International Conference on Electronics and Sustainable Communication Systems (ICESC), Coimbatore, India, 2–4 July 2020; pp. 1144–1152. [Google Scholar] [CrossRef]
- Zhang, P.; Yan, K.; Pan, A.; Zhu, Y.; Hong, J.; Liang, P. Use of CdTe Quantum Dots as Heat Resistant Temperature Sensor for Bearing Rotating Elements Monitoring. IEEE J. Sel. Areas Commun. 2020, 38, 463–470. [Google Scholar] [CrossRef]
- Al-Musawi, A.K.; Anayi, F.; Packianather, M. Three-phase induction motor fault detection based on thermal image segmentation. Infrared Phys. Technol. 2019, 104, 103140. [Google Scholar] [CrossRef]
- Nasiri, A.; Taheri-Garavand, A.; Omid, M.; Carlomagno, G.M. Intelligent fault diagnosis of cooling radiator based on deep learning analysis of infrared thermal images. Appl. Therm. Eng. 2019, 163, 114410. [Google Scholar] [CrossRef]
- Phuc, P.N.; Vansompel, H.; Bozalakov, D.; Stockman, K.; Crevecoeur, G. Inverse thermal identification of a thermally instrumented induction machine using a lumped-parameter thermal model. Energies 2019, 13, 37. [Google Scholar] [CrossRef]
- Chen, J.; Deng, E.; Zhao, Y.; Zhao, Z.; Huang, Y. Review of On-line Junction Temperature Measurement Methods of High Voltage Power Electronics. Zhongguo Dianji Gongcheng Xuebao/Proc. Chin. Soc. Electr. Eng. 2019, 39, 6677–6687. [Google Scholar] [CrossRef]
- Olanrewaju, O.; Yang, Z.; Evans, N.; Fayyaz, A.; Lagier, T.; Castellazzi, A. Investigation of Temperature Distribution in SIC Power Module Prototype in Transient Conditions. In Proceedings of the 2019 20th International Symposium on Power Electronics (Ee), Novi Sad, Serbia, 23–26 October 2019. [Google Scholar] [CrossRef]
- Novizon, Z.; Malek, A.; Syafii; Ahmad, M.H.; Aulia; Ulfiah, S.A. Condition based monitoring of gapless surge arrester using electrical and thermal parameters. IOP Conf. Ser. Mater. Sci. Eng. 2019, 602, 012007. [Google Scholar] [CrossRef]
- Dragomir, A.; Atanasoaei, M.; Adam, M.; Andruşcǎ, M.; Deac, C.N.; Dragomir, M. Infrared Procedure for Monitoring Long-term Thermal Stresses of Electrical Equipment. In Proceedings of the 2019 54th International Universities Power Engineering Conference (UPEC), Bucharest, Romania, 3–6 September 2019. [Google Scholar] [CrossRef]
- Zhang, Q.; Yang, Y.; Zhang, P. A Novel Method for Monitoring the Junction Temperature of SiC MOSFET On-line Based on On-state Resistance. In Proceedings of the 2019 22nd International Conference on Electrical Machines and Systems (ICEMS), Harbin, China, 11–14 August 2019. [Google Scholar] [CrossRef]
- Doolgindachbaporn, A.; Ali, N.H.N.; Callender, G.; Pilgrim, J.; Lewin, P.; Wilson, G. Detection of Forced Cooling Faults in Power Transformers based on Winding Temperature Indicator and Load Data. In Proceedings of the 2019 IEEE Electrical Insulation Conference (EIC), Calgary, AB, Canada, 16–19 June 2019; pp. 111–114. [Google Scholar] [CrossRef]
- Dragomir, A.; Adam, M.; Andruşcă, M. A Review about Wireless Monitoring of Electrical Equipment Temperature. In Proceedings of the 2019 11th International Symposium on Advanced Topics in Electrical Engineering (ATEE), Bucharest, Romania, 28–30 March 2019. [Google Scholar] [CrossRef]
- AAndrade, F.; Fernandes, J.M.B.; Alves, H.M.M.; Costa, E.G. Thermal Behavior Analysis in a Porcelain-Housed ZnO Surge Arrester by Computer Simulations and Thermography. In Proceedings of the 2018 IEEE International Conference on High Voltage Engineering and Application (ICHVE), Athens, Greece, 10–13 September 2018. [Google Scholar] [CrossRef]
- Hu, Y.; Shi, P.; Li, H.; Yang, C. Health Condition Assessment of Base-Plate Solder for Multi-Chip IGBT Module in Wind Power Converter. IEEE Access 2019, 7, 72134–72142. [Google Scholar] [CrossRef]
- Wei, K.; Wang, W.; Hu, Z.; Du, M. Condition Monitoring of IGBT Modules Based on Changes of Thermal Characteristics. IEEE Access 2019, 7, 47525–47534. [Google Scholar] [CrossRef]
- Lee, S.Y.; Teoh, S.S. A survey on infrared thermography based automatic electrical fault diagnosis techniques. Lect. Notes Electr. Eng. 2019, 547, 537–542. [Google Scholar] [CrossRef]
- Sangeetha, M.S.; Nandhitha, N.M.; Karthikeyan, S.; Venkatesh, N. Mathematical Relationship between Hotspot Temperature, Emissivity and Distance in Thermographs for Condition Monitoring of Electrical Equipments. In Proceedings of the 2018 2nd International Conference on Trends in Electronics and Informatics (ICOEI), Tirunelveli, India, 11–12 May 2018; pp. 984–988. [Google Scholar] [CrossRef]
- Krishnan, S.R.; Su, C.; Xie, Z.; Patel, M.; Madhvapathy, S.R.; Xu, Y.; Freudman, J.; Ng, B.; Heo, S.Y.; Wang, H.; et al. Wireless, Battery-Free Epidermal Electronics for Continuous, Quantitative, Multimodal Thermal Characterization of Skin. Small 2018, 14, e1803192. [Google Scholar] [CrossRef]
- Mariprasath, T.; Kirubakaran, V. A real time study on condition monitoring of distribution transformer using thermal imager. Infrared Phys. Technol. 2018, 90, 78–86. [Google Scholar] [CrossRef]
- Choi, U.M.; Blaabjerg, F.; Jørgensen, S. Power Cycling Test Methods for Reliability Assessment of Power Device Modules in Respect to Temperature Stress. IEEE Trans. Power Electron. 2018, 33, 2531–2551. [Google Scholar] [CrossRef]
- Resendiz-Ochoa, E.; Osornio-Rios, R.A.; Benitez-Rangel, J.P.; Romero-Troncoso, R.D.J.; Morales-Hernandez, L.A. Induction Motor Failure Analysis: An Automatic Methodology Based on Infrared Imaging. IEEE Access 2018, 6, 76993–77003. [Google Scholar] [CrossRef]
- Lopez-Perez, D.; Antonino-Daviu, J. Failure detection in industrial electric motors through the use of infrared-based isothermal representation. In Proceedings of the IECON 2017—43rd Annual Conference of the IEEE Industrial Electronics Society, Beijing, China, 29 October–1 November 2017; pp. 3822–3827. [Google Scholar] [CrossRef]
- Liu, Z.; Wang, J.; Duan, L.; Shi, T.; Fu, Q. Infrared image combined with cnn based fault diagnosis for rotating machinery. In Proceedings of the 2017 International Conference on Sensing, Diagnostics, Prognostics, and Control (SDPC), Shanghai, China, 16–18 August 2017; pp. 137–142. [Google Scholar] [CrossRef]
- Dragomir, A.; Adam, M.; Andruşcǎ, M.; Munteanu, A.; Boghiu, E. Considerations regarding infrared thermal stresses monitoring of electrical equipment. In Proceedings of the 2017 International Conference on Electromechanical and Power Systems (SIELMEN), Iasi, Romania, 11–13 October 2017; pp. 100–103. [Google Scholar] [CrossRef]
- Resendiz-Ochoa, E.; Osornio-Rios, R.A.; Benitez-Rangel, J.P.; Morales-Hernandez, L.A.; Romero-Troncoso, R.D.J. Segmentation in thermography images for bearing defect analysis in induction motors. In Proceedings of the 2017 IEEE 11th International Symposium on Diagnostics for Electrical Machines, Power Electronics and Drives (SDEMPED), Tinos, Greece, 29 August–1 September 2017; pp. 572–577. [Google Scholar] [CrossRef]
- Mechkov, E. Application of infrared thermography technique in transformers maintenance in distribution network. In Proceedings of the 2017 15th International Conference on Electrical Machines, Drives and Power Systems (ELMA), Sofia, Bulgaria, 1–3 June 2017; pp. 354–357. [Google Scholar] [CrossRef]
- Munoz-Ornelas, O.; Elvira-Ortiz, D.A.; Osornio-Rios, R.A.; Romero-Troncoso, R.J.; Morales-Hernandez, L.A. Methodology for thermal analysis of induction motors with infrared thermography considering camera location. In Proceedings of the IECON 2016—42nd Annual Conference of the IEEE Industrial Electronics Society, Florence, Italy, 23–26 October 2016; pp. 7113–7118. [Google Scholar] [CrossRef]
- Dragomir, A.; Adam, M.; Andrusca, M.; Munteanu, A. Aspects concerning the influence of environmental factors in infrared monitoring of electrical equipment. In Proceedings of the 2016 International Conference and Exposition on Electrical and Power Engineering (EPE), Iasi, Romania, 20–22 October 2016; pp. 133–138. [Google Scholar] [CrossRef]
- Khan, Q.; Khan, A.A.; Ahmad, F. Condition monitoring tool for electrical equipment—Thermography. In Proceedings of the 2016 International Conference on Electrical, Electronics, and Optimization Techniques (ICEEOT), Chennai, India, 3–5 March 2016; pp. 2802–2806. [Google Scholar] [CrossRef]
- Singh, G.; Kumar, T.C.A.; Naikan, V.N.A. Induction motor inter turn fault detection using infrared thermographic analysis. Infrared Phys. Technol. 2016, 77, 277–282. [Google Scholar] [CrossRef]
- Zou, H.; Huang, F. A novel intelligent fault diagnosis method for electrical equipment using infrared thermography. Infrared Phys. Technol. 2015, 73, 29–35. [Google Scholar] [CrossRef]
- Janssens, O.; Schulz, R.; Slavkovikj, V.; Stockman, K.; Loccufier, M.; Van de Walle, R.; Van Hoecke, S. Thermal image based fault diagnosis for rotating machinery. Infrared Phys. Technol. 2015, 73, 78–87. [Google Scholar] [CrossRef]
- Perpina, X.; Werkhoven, R.J.; Vellvehi, M.; Jakovenko, J.; Jorda, X.; Kunen, J.M.G.; Bancken, P.; Bolt, P.J. Thermal analysis of LED lamps for optimal driver integration. IEEE Trans. Power Electron. 2014, 30, 3876–3891. [Google Scholar] [CrossRef]
- Taheri-Garavand, A.; Ahmadi, H.; Omid, M.; Mohtasebi, S.S.; Mollazade, K.; Smith, A.J.R.; Carlomagno, G.M. An intelligent approach for cooling radiator fault diagnosis based on infrared thermal image processing technique. Appl. Therm. Eng. 2015, 87, 434–443. [Google Scholar] [CrossRef]
- Zou, H.; Huang, F. An intelligent fault diagnosis method for electrical equipment using infrared images. In Proceedings of the 2015 34th Chinese Control Conference (CCC), Hangzhou, China, 28–30 July 2015; pp. 6372–6376. [Google Scholar] [CrossRef]
- Dragomir, A.; Adam, M.; Andrusca, M.; Molodeschi, M.; Pantelimon, R. About thermal stresses monitoring and diagnosis of electrical equipment. In Proceedings of the 2014 International Conference and Exposition on Electrical and Power Engineering (EPE), Iasi, Romania, 16–18 October 2014; pp. 289–294. [Google Scholar] [CrossRef]
- Garcia-Ramirez, A.G.; Morales-Hernandez, L.A.; Osornio-Rios, R.A.; Garcia-Perez, A.; Romero-Troncoso, R.J. Thermographic technique as a complement for MCSA in induction motor fault detection. In Proceedings of the 2014 International Conference on Electrical Machines (ICEM), Berlin, Germany, 2–5 September 2014; pp. 1940–1945. [Google Scholar] [CrossRef]
- Karvelis, P.; Georgoulas, G.; Stylios, C.D.; Tsoumas, I.P.; Antonino-Daviu, J.A.; Rodenas, M.J.P.; Climente-Alarcon, V. An automated thermographic image segmentation method for induction motor fault diagnosis. In Proceedings of the IECON 2014—40th Annual Conference of the IEEE Industrial Electronics Society, Dallas, TX, USA, 29 October–1 November 2014; pp. 3396–3402. [Google Scholar] [CrossRef]
- Li, K.; Tian, G.Y.; Cheng, L.; Yin, A.; Cao, W.; Crichton, S. State detection of bond wires in IGBT modules using eddy current pulsed thermography. IEEE Trans. Power Electron. 2014, 29, 5000–5009. [Google Scholar] [CrossRef]
- Chen, H.; Ji, B.; Pickert, V.; Cao, W. Real-time temperature estimation for power MOSFETs considering thermal aging effects. IEEE Trans. Device Mater. Reliab. 2014, 14, 220–228. [Google Scholar] [CrossRef]
- Huda, A.S.N.; Taib, S. Application of infrared thermography for predictive/preventive maintenance of thermal defect in electrical equipment. Appl. Therm. Eng. 2013, 61, 220–227. [Google Scholar] [CrossRef]
- Jadin, M.S.; Ghazali, K.H.; Taib, S. Thermal condition monitoring of electrical installations based on infrared image analysis. In Proceedings of the 2013 Saudi International Electronics, Communications and Photonics Conference, Riyadh, Saudi Arabia, 27–30 April 2013. [Google Scholar] [CrossRef]
- Cui, H.; Xu, Y.; Zeng, J.; Tang, Z. The methods in infrared thermal imaging diagnosis technology of power equipment. In Proceedings of the 2013 IEEE 4th International Conference on Electronics Information and Emergency Communication, Beijing, China, 15–17 November 2013; pp. 246–251. [Google Scholar] [CrossRef]
- Manana, M.; Arroyo, A.; Ortiz, A.; Renedo, C.J.; Perez, S.; Delgado, F. Field winding fault diagnosis in DC motors during manufacturing using thermal monitoring. Appl. Therm. Eng. 2011, 31, 978–983. [Google Scholar] [CrossRef]
- Younus, A.M.; Yang, B.S. Wavelet co-efficient of thermal image analysis for machine fault diagnosis. In Proceedings of the 2010 Prognostics and System Health Management Conference, Macao, China, 12–14 January 2010. [Google Scholar] [CrossRef]
- Feng, J.; Sun, P.; Tang, W.; Buse, D.; Wu, Q.; Richardson, Z.; Fitch, J. Implementation of a power transformer temperature monitoring system. In Proceedings of the International Conference on Power System Technology, Kunming, China, 13–17 October 2002; Volume 3, pp. 1980–1983. [Google Scholar] [CrossRef]
- Tsanakas, J.A.; Vannier, G.; Plissonnier, A.; Ha, D.L.; Barruel, F. Fault Diagnosis and Classification of Large-Scale Photovoltaic Plants through Aerial Orthophoto Thermal Mapping. In Proceedings of the 31st European Photovoltaic Solar Energy Conference and Exhibition (EUPVSEC), Hamburg, Germany, 14–18 September 2015; Available online: https://www.researchgate.net/publication/283727126 (accessed on 27 September 2021).
- IR Thermography in Maintenance—Applications—Maintworld. Available online: https://www.maintworld.com/Applications/IR-Thermography-in-Maintenance (accessed on 31 August 2021).


| Thermal Condition | Priority Level | ΔT (°C) | Recommended Actions |
|---|---|---|---|
| Overheated | I | ΔT ≥ 15 | Significant disparity; must correct it immediately |
| II | 5 < ΔT < 15 | Repair as soon as possible if there is a potential defect | |
| Normal | III | ΔT ≤ 15 | Overheating of a minor kind demands further study |
| The Aspect of the Environment | The Impact on the IRT Measurement |
|---|---|
| Ambient air temperature | When the ambient temperature rises, so does the temperature of the machinery. The IR system becomes less reliable at very hot or shallow temperatures. According to the temperature increase of 0–9, 10–20, 21–49, and >50 °C, the authors classified the severity of the flaw-induced overheating into four types: attention, moderate, severe, and critical [39]. |
| Precipitation/humidity (snow, rain, fog, etc.) | The temperature may drop drastically, causing the data to be misinterpreted. The only moderately heated equipment may be cooled below the abnormal temperature. |
| Wind or other convection | Wind velocities may drastically cool a high resistance fitting from speeds as minimal as 1–5 miles per hour (mph). The temperature differential between the equipment and the ambient space may be decreased to a few degrees above the ambient space at speeds greater than 5 mph. |
| Sun or solar radiation | Minor temperature swings will be hidden by the device’s sun heating, mainly if it absorbs much solar light (such as old conductors). |
| Tools and Equipment | Characteristic |
|---|---|
| Electrical Loads | The proper load on the wires must be negotiated with the customer before the inspection.
|
| Equipment Emissivity | The emissivity of most conductors is between 0.1 and 0.3. While emissivity values as high as 0.97 may be found in greasy, dark, hot, and aging conductors, visual evaluation in the field from a distance is frequently difficult [83,86]. Moreover, there are several non-contact and nondestructive inspection tools that have already been introduced such as the Laser Ultrasound Inspection system, Study of Flip Chip Solder Joint Cracks [89], Laser-SQUID Microscopy, monitoring and Analysis of Large Scale Integration (LSI) -Chip-Defects [90], laser line photoluminescence imaging for outdoor inspections [91,92], Ultrasonic Suspension for force measurement [93], and laser ultrasonic signals from particles suspensions [94]. |
| Thermal Gradient | High-resistance heat is typically generated at the surface on the inside. Thermal gradients exist between the apparatus’s hottest point and the surface under investigation [87]. |
| IRT Device (camera) | The observed waveband and the spatial and measurement resolution are all elements to consider [87]. It is also essential to consider the sensitivity and signal processing speed [83]. |
| Distance andAngle | As the distance between them widens, the IRT picture’s resolution drops. An acute angle image has less information than one shot at a straight angle. |
| Standards | Temperature Difference (ΔT) (°C) | Actions to Be Taken | |
|---|---|---|---|
| Under Equivalent Stress, between Comparable Components | ΔT over Ambient Temperature (°C) | ||
| NETA | 1–3 | 1–10 | A potential shortage needs further examination. |
| 4–15 | 11–20 | Indicates a potential flaw that has to be fixed as soon as feasible. | |
| - | 22–40 | Continuously monitor until a solution can be found. | |
| >15 | >40 | There is a significant imbalance that must be addressed once and for all. | |
| MIL-STD2194 | 10–20 | - | Despite the remote possibility of component failure, corrective steps must be conducted at the next scheduled routine maintenance period. |
| 24–40 | - | Failure of a component is likely unless it is repaired. | |
| 40–70 | - | Component failure is almost inevitable unless something is done. | |
| >70 | - | A component is on the verge of failing. | |
| Introspection Institute Standard for Electrical Components | 1–10 | - | During the following maintenance period, corrective action should be conducted. |
| >10–20 | - | Corrective actions are necessary when time allows. | |
| >20–40 | - | Immediate corrective action is essential. | |
| >40 | - | Immediate corrective action is required. | |
| Ref. No. | Authors | DOI Number | Keywords | Monitor | Publisher | Year | Country of Origin | Total Citation |
|---|---|---|---|---|---|---|---|---|
| [107] | Sangeeetha M.S et al. | 10.1007/978-981-16-2422-3_14 | Improved active contour modeling; Multilevel thresholding; Segmentation | Electrical equipment | Springer | 2022 | India | 0 |
| [108] | Li W. et al. | 10.1016/j.microrel.2021.114409 | Electric inverters; Electric losses; Parameter estimation; Insulated gate bipolar transistor inverter | IGBT inverter | Elsevier | 2021 | China | 0 |
| [109] | Vakrilov N.V. et al. | 10.1109/ET52713.2021.9579707 | infrared thermography; thermal analysis; thermal monitoring | Electrical machines | IEEE | 2021 | Bulgaria | 0 |
| [110] | Phuc P.N. et al. | 10.1109/TEC.2021.3060478 | induction motor; rotor temperature estimation; validation; virtual sensing | Induction Machines | IEEE | 2021 | Belgium | 0 |
| [111] | Leppänen J. et. al | 10.1016/j.microrel.2021.114207 | Device technologies; Electrical breakdown; High-humidity environment; Power semiconductor module | Semiconductor diodes | Elsevier | 2021 | Finland | 0 |
| [112] | Das A.K. et al. | 10.1109/JSEN.2021.3079570 | Convolutional neural network; metal oxide surge arrester; pollution severity classification; transfer learning | Surge Arrester | IEEE | 2021 | India | 0 |
| [113] | Nit Hamirpur et al. | 10.1109/ICCES51350.2021.9489095 | Hotspot detection; Induction motor; Infrared thermography (IRT); Remaining life; Thermal efficiency | Three phase induction motor | IEEE | 2021 | India | 0 |
| [114] | Xia C. et al. | 10.1049/hve2.12023 | Electric fault currents; Electric power transmission networks; Failure analysis; Image enhancement | Power equipment | John Wiley and Sons Inc. | 2021 | China | 4 |
| [115] | Choudhary A. at el. | 10.1016/j.measurement.2021.109196 | Deep learning; Fault detection; Infrared thermography; Machine learning | Rotating machine | Elsevier | 2021 | India | 11 |
| [116] | Hassan M.U. et al. | 10.1049/gtd2.12106 | Cable sheathing; Degradation; Distribution functions; Insulation; Nondestructive examination | Aerial bundled cables | John Wiley and Sons Inc. | 2021 | Pakistan | 0 |
| [117] | Susinni G. et al. | 10.3390/electronics10060683 | Condition monitoring; Junction temperature; Power device; Power electronics; Reliability | Semiconductor devices | MDPI | 2021 | Italy | 4 |
| [118] | Kumar P.S. et al. | 10.1109/JSEN.2020.3029041 | Condition monitoring; hall effect sensors; induction motor; infra-red sensors; inter-turn winding fault | Stator End-Winding | IEEE | 2021 | Singapore | 2 |
| [119] | Vidhya R. et al. | 10.1109/ICEES51510.2021.9383639 | Condition Monitoring; Image Processing; Wavelets | Transformer breather | IEEE | 2021 | India | 1 |
| [120] | Shao H. et al. | 10.1109/TIM.2021.3111977 | Fault diagnosis; infrared thermal images; rotor-bearing system; two-stage parameter transfer | Rotor-Bearing | IEEE | 2021 | China | 0 |
| [121] | Ziuzev, A.M. et.al | 10.18799/24131830/2021/1/3002 | AC electric motors; Compressor station; Stator winding insulation; Thermal circuits with lumped parameters; Thermal insulation resource; Thermodynamic model | AC electric motors | Tomsk Polytechnic University, Publishing House | 2021 | Russia | 0 |
| [122] | Najafi M. et al. | 10.1109/ICSPIS51611.2020.9349599 | Condition Monitoring; Image Processing; Infrared Thermography; Interpretable Machine Learning | Electrical Equipment | IEEE | 2020 | Iran | 0 |
| [123] | Alshorman O. et al. | 10.1109/ICDABI51230.2020.9325635 | Fault diagnosis and detection; gearboxes; image; rotating machinery; sensors; wind turbines | Rotating Machinery | IEEE | 2020 | Saudi Arabia | 3 |
| [124] | Redon P. et al. | 10.1109/IECON43393.2020.9254639 | Deep learning; fault diagnosis; image processing; induction motors; infrared thermography | Induction motors | IEEE | 2020 | Spain | 2 |
| [125] | Sahu M. et al. | 10.1109/GUCON48875.2020.9231138 | Aging Acceleration Factor; Hotspot Temperature; Per Unit Life; Transformer Preventive maintenance | Transformer | IEEE | 2020 | India | 0 |
| [126] | Xu X. et al. | 10.1109/ICHVE49031.2020.9280056 | Cable accessories; Faster RCNN; infrared image processing; Mean-Shift; smart condition diagnosis | Cable Accessories | IEEE | 2020 | China | 1 |
| [127] | Shahriari Nasab P. et al. | 10.1109/TEC.2020.2974789 | Computational Fluid Dynamics; Coupled magneto-thermal model; Switched Reluctance motor; temperature signature | Reluctance Motor | IEEE | 2020 | Iran | 2 |
| [128] | Wang B. et al. | 10.1109/TIM.2020.2965635 | Fault diagnosis; infrared detection; instance segmentation; insulator images; substation automation; temperature fitting | Insulator | IEEE | 2020 | China | 27 |
| [129] | Ni Z. et al. | 10.1109/TPEL.2019.2962503 | Accelerated lifetime test (ALT); active thermal control; ageing indicator; condition monitoring; failure mode | Power converters | IEEE | 2020 | United States | 27 |
| [130] | Singh R.P. et al. | 10.1109/ICESC48915.2020.9155858 | Condition Monitoring; Dissolved Gas Analysis; Thermography; Transformers | Transformers | IEEE | 2020 | India | 0 |
| [131] | Zhang P. et al. | 10.1109/JSAC.2020.2968974 | Bearing rotating elements; temperature sensor; thermal monitoring | Bearing Rotating Elements | IEEE | 2020 | China | 4 |
| [132] | Al-Musawi A.K. et al. | 10.1016/j.infrared.2019.103140 | Bearing faults; Edge detection; Image segmentation; Induction motor; Thermal condition monitoring | Three-phase induction motor | Elsevier | 2020 | Iraq | 13 |
| [133] | Nasiri A. et al. | 10.1016/j.applthermaleng.2019.114410 | Convolutional neural network; Cooling radiator; Deep learning; Fault detection; Thermal image analysis | Radiator | Elsevier | 2019 | Iran | 14 |
| [134] | Phuc P.N. et al. | 10.3390/en13010037 | Induction motor; Lumped-parameter thermal network; Model fitting; Transient thermal modelling | Induction machine | Energies | 2019 | Belgium | 6 |
| [135] | Chen J. et al. | 10.13334/j.0258-8013.pcsee.190362 | High-voltage power electronics; Junction temperature application; Junction temperature physical meaning | High Voltage Power Electronics | Chinese Society for Electrical Engineering | 2019 | China | 5 |
| [136] | Olanrewaju O. et al. | 10.1109/PEE.2019.8923270 | infrared thermography; power modules; steady state; temperature distribution; thermal maps; transient | Power Module Prototype | IEEE | 2019 | United Kingdom | 0 |
| [137] | Novizon et al. | 10.1088/1757-899X/602/1/012007 | Metal oxide surge arresters; Surge arresters; Temperature profiles; Thermal images; Thermal parameters | Surge arrester | IOPscience | 2019 | Indonesia | 0 |
| [138] | Dragomir A. et al. | 10.1109/UPEC.2019.8893616 | Infrared monitoring; thermal fault; thermographic report | Electrical Equipment | IEEE | 2019 | Romania | 1 |
| [139] | Zhang Q. et al. | 10.1109/ICEMS.2019.8922346 | Junction temperature; MOSFET; online condition monitoring; SiC devices | MOSFET On-line Based on On-state Resistance | IEEE | 2019 | China | 5 |
| [140] | Doolgindachbaporn A. et al. | 10.1109/EIC43217.2019.9046583 | Condition monitoring; time series decomposition; transformer thermal model; winding temperature indicator | Cooling Faults in Power Transformers | IEEE | 2019 | United Kingdom | 0 |
| [101] | Choudhary A. et al. | 10.1109/GUCON.2018.8674889 | Condition Monitoring; Preventive Maintenance; Thermal Camera; Thermal Imaging | Induction motor | IEEE | 2018 | India | 8 |
| [141] | Dragomir A. et al. | 10.1109/ATEE.2019.8725019 | Condition monitoring; infrared; thermal stress; thermography | Electrical Equipment | IEEE | 2018 | Romania | 1 |
| [142] | Andrade A.F. et al. | 10.1109/ICHVE.2018.8642094 | Electrical systems; Housing temperature; Radiation heat; Surge arresters; Thermal behaviors; ZnO surge arresters | ZnO Surge Arrester | IEEE | 2018 | Brazil | 1 |
| [143] | Hu Y. et al. | 10.1109/ACCESS.2019.2918029 | Base-plate solder; health condition monitoring; multi-chip IGBT module; Wind power converters | Multi-Chip IGBT Module | IEEE | 2019 | China | 11 |
| [144] | Wei K. et al. | 0.1109/ACCESS.2019.2909928 | Bond wires; Condition monitor; IGBT; Solder fatigue | IGBT Modules | IEEE | 2019 | China | 8 |
| [145] | Lee S.Y. et al. | 10.1007/978-981-13-6447-1_68 | Electrical fault detection; Infrared thermography; Intelligent fault diagnosis; Thermal imaging | Electrical fault diagnosis | Springer | 2018 | Malaysia | 3 |
| [146] | Sangeetha M.S. et al. | 10.1109/ICOEI.2018.8553948 | Condition monitoring; distance; electrical equipment; emissivity; Thermographs | Electrical Equipment | IEEE | 2018 | India | 2 |
| [147] | Krishnan S.R. et al. | 10.1002/smll.201803192 | Epidermal electronics; hydration; NFC; thermal sensing; wireless electronics | Epidermal electronics | Wiley-VCH Verlag | 2018 | United States | 43 |
| [148] | Mariprasath T. et al. | 10.1016/j.infrared.2018.02.009 | Condition monitoring technique; Hotspot temperature; Power quality; Thermal imager; Transformer | Transformer | Elsevier | 2018 | India | 25 |
| [149] | Choi U.-M. et al. | 10.1109/TPEL.2017.2690500 | Failure mechanism; insulated gate bipolar transistor (IGBT); power cycling (PC) test; power device module; reliability | Power Device Modules | IEEE | 2018 | Denmark | 86 |
| [150] | Resendiz-Ochoa E. et al. | 10.1109/ACCESS.2018.2883988 | Condition monitoring; failure analysis; image segmentation; Induction motor; infrared imaging; thermal analysis | Induction Motor Failure | IEEE | 2018 | Mexico | 10 |
| [151] | Lopez-Perez D. et al. | 10.1109/IECON.2017.8216652 | Fault diagnosis; induction motors; infrared thermography; isotherm; predictive maintenance | Industrial electric motors | IEEE | 2017 | Spain | 3 |
| [152] | Liu Z. et al. | 10.1109/SDPC.2017.35 | Convolution neural network; Fault diagnosis; Infrared (IR) imaging; Rotating machinery | Rotating machinery | IEEE | 2017 | China | 7 |
| [153] | Dragomir A. | 10.1109/SIELMEN.2017.8123307 | HV busbar systems; Infrared thermography; Thermal stresses | Electrical equipment | IEEE | 2017 | Romania | 4 |
| [154] | Resendiz-Ochoa E. | 10.1109/DEMPED.2017.8062412 | Condition monitoring; fault diagnosis; image segmentation; induction motors; infrared imaging | Induction motors | IEEE | 2017 | Mexico | 17 |
| [155] | Mechkov E. et al. | 10.1109/ELMA.2017.7955462 | Evaluation criteria; infrared thermography; maintenance; transformers | Transformer’s maintenance | IEEE | 2017 | Bulgaria | 5 |
| [156] | Munoz-Ornelas O. et al. | 10.1109/IECON.2016.7793682 | Condition monitoring; Induction motors; Infrared imaging; Predictive maintenance; Thermal analysis | Induction motors | IEEE | 2016 | Mexico | 9 |
| [99] | Ramirez-Nunez J.A. et al. | 10.1109/IECON.2016.7793158 | Fault detection; Image processing; Infrared image sensors; Infrared imaging; Monitoring; Predictive maintenance | Industrial machinery | IEEE | 2016 | Mexico | 10 |
| [157] | Dragomir A. et al. | 10.1109/ICEPE.2016.7781319 | Dust thickness; infrared monitoring device; thermal stresses | Electrical equipment | IEEE | 2016 | Romania | 50 |
| [158] | Khan Q. et al. | 10.1109/ICEEOT.2016.7755208 | Condition Monitoring; Infrared Thermography; Motor; Preventive maintenance; Transformer | Electrical equipment | IEEE | 2016 | India | 10 |
| [97] | Singh G. et al. | 10.1109/ICPES.2016.7584040 | Condition monitoring; Failure of cooling system; Fault diagnosis; Induction motor; Infrared thermography | Induction motor | IEEE | 2016 | India | 9 |
| [159] | Singh G. et al. | 10.1016/j.infrared.2016.06.010 | Condition monitoring; Fault diagnosis; Induction motor; Inter turn fault; Thermography | Induction motors inter turn | Elsevier | 2016 | India | 65 |
| [82] | Dutta T. et al. | 10.1109/CMI.2016.7413761 | Edge detection; color model; image segmentation; thermal monitoring | Electrical equipment | IEEE | 2016 | India | 22 |
| [160] | Zou H. et al. | 10.1016/j.infrared.2015.08.019 | Feature extraction; Infrared thermography; Intelligent fault diagnosis; Parameter optimization; Support vector machine | Electrical equipment | Elsevier | 2015 | China | 50 |
| [161] | Janssens O. et al. | 10.1016/j.infrared.2015.09.004 | Condition monitoring; Fault diagnosis; Image processing; Infrared imaging; Machine learning; Rotating machinery | Rotating machinery | Elsevier | 2015 | Belgium | 76 |
| [162] | Perpiñà X. et al. | 10.1109/TPEL.2014.2346543 | Light-emitting diodes (LEDs); solid-state lighting (SSL); thermal modeling; thermal parameters extraction | LED lamps | IEEE | 2015 | Spain | 16 |
| [163] | Taheri-Garavand A. et al. | 10.1016/j.applthermaleng.2015.05.038 | Artificial neural network; Condition monitoring; Cooling radiator; Discrete wavelet transform; | Cooling radiator | Elsevier | 2015 | Iran | 50 |
| [164] | Zou H. et al. | 10.1109/ChiCC.2015.7260642 | Feature extraction; Infrared image; Intelligent fault diagnosis; Parameter optimization; Support vector machine | Electrical equipment | IEEE | 2015 | China | 14 |
| [165] | Dragomir A. et al. | 10.1109/ICEPE.2014.6969915 | Diagnosis; infrared thermography; monitoring; thermal stresses | Electrical equipment | IEEE | 2014 | Romania | 9 |
| [166] | Garcia-Ramirez A.G. et al. | 10.1109/ICELMACH.2014.6960449 | Induction motors; Infrared imaging; Temperature; Thermal analysis | Induction motor | IEEE | 2014 | Mexico | 24 |
| [167] | Karvelis P. et al. | 10.1109/IECON.2014.7049001 | Fault diagnosis; image segmentation; Induction motor; object matching | Induction motor | IEEE | 2014 | Greece | 26 |
| [168] | Li K. et al. | 10.1109/TPEL.2013.2288334 | Eddy current pulsed thermography (ECPT); insulated gate bipolar transistor (IGBT); nondestructive evaluation | IGBT modules | IEEE | 2014 | United Kingdom | 125 |
| [169] | Chen H. et al. | 10.1109/TDMR.2013.2292547 | Circuit topology; monitoring; MOSFET switches; prognostics and health management; thermal management | Power MOSFETs | IEEE | 2014 | China | 124 |
| [34] | Huda A.S.N. et al. | 10.1016/j.infrared.2013.04.012 | Condition monitoring; Electrical equipment; Features; Infrared thermography; Multilayered perceptron network | Electrical equipment | Elsevier | 2013 | Malaysia | 47 |
| [170] | Huda A.S.N. et al. | 10.1016/j.applthermaleng.2013.07.028 | Discriminant analysis; Electrical equipment; Infrared thermography; Preventive/predictive maintenance | Electrical equipment | Elsevier | 2013 | Malaysia | 105 |
| [171] | Jadin M.S. et al. | 10.1109/SIECPC.2013.6550790 | Condition monitoring; image classification; Infrared image; object recognition; reliability | Electrical installations | IEEE | 2013 | Malaysia | 12 |
| [172] | Cui H. et al. | 10.1109/ICEIEC.2013.6835498 | Fault diagnosis; image processing; Infrared thermography; neural network | Power equipment | IEEE | 2013 | China | 17 |
| [69] | Eftekhari M. et al. | 10.1016/j.infrared.2013.10.001 | Condition monitoring; Feature extraction; Induction motor; Infrared thermal image; Inter-turn short circuit fault | Inter-turn fault in induction motor | Elsevier | 2013 | Iran | 35 |
| [33] | Jadin M.S. et al. | - | Electrical equipment; Image preprocessing; Image processing; Infrared thermogram; Thermal anomalies | Electrical equipment | Academia | 2011 | Malaysia | 15 |
| [173] | Manana M. et al. | 10.1016/j.applthermaleng.2010.11.023 | DC motors; Electric machines; Fault diagnosis; Infrared imaging | Field winding fault | Elsevier | 2011 | Spain | 36 |
| [174] | Younus A.Md. et al. | 10.1109/PHM.2010.5414573 | Infrared thermography; Machine condition monitoring; Machine fault diagnosis; Mechanical systems | Machine fault | IEEE | 2010 | South Korea | 12 |
| [175] | Feng J.Q. et al. | 10.1109/ICPST.2002.1067880 | Condition monitoring; genetic algorithms; Power transformers | Power transformer | IEEE | 2002 | United Kingdom | 9 |
Publisher’s Note: MDPI stays neutral with regard to jurisdictional claims in published maps and institutional affiliations. |
© 2022 by the authors. Licensee MDPI, Basel, Switzerland. This article is an open access article distributed under the terms and conditions of the Creative Commons Attribution (CC BY) license (https://creativecommons.org/licenses/by/4.0/).
Share and Cite
Balakrishnan, G.K.; Yaw, C.T.; Koh, S.P.; Abedin, T.; Raj, A.A.; Tiong, S.K.; Chen, C.P. A Review of Infrared Thermography for Condition-Based Monitoring in Electrical Energy: Applications and Recommendations. Energies 2022, 15, 6000. https://doi.org/10.3390/en15166000
Balakrishnan GK, Yaw CT, Koh SP, Abedin T, Raj AA, Tiong SK, Chen CP. A Review of Infrared Thermography for Condition-Based Monitoring in Electrical Energy: Applications and Recommendations. Energies. 2022; 15(16):6000. https://doi.org/10.3390/en15166000
Chicago/Turabian StyleBalakrishnan, Ganesh Kumar, Chong Tak Yaw, Siaw Paw Koh, Tarek Abedin, Avinash Ashwin Raj, Sieh Kiong Tiong, and Chai Phing Chen. 2022. "A Review of Infrared Thermography for Condition-Based Monitoring in Electrical Energy: Applications and Recommendations" Energies 15, no. 16: 6000. https://doi.org/10.3390/en15166000
APA StyleBalakrishnan, G. K., Yaw, C. T., Koh, S. P., Abedin, T., Raj, A. A., Tiong, S. K., & Chen, C. P. (2022). A Review of Infrared Thermography for Condition-Based Monitoring in Electrical Energy: Applications and Recommendations. Energies, 15(16), 6000. https://doi.org/10.3390/en15166000