
Tracking the CO2 Emissions of China’s Coal Production via Global Supply Chains


Abstract
:1. Introduction
1.1. Review of Earlier Works
1.2. Aim of This Study
2. Materials and Methods
2.1. Methodology for Accounting CO2 Emission Intensity
2.2. Data
3. Results and Discussion
3.1. CO2 Emission Intensity of Coal Production in Major Coal-Producing Countries
3.2. Indirect CO2 Emission Intensity of Coal Production from Material and Service Inputs
3.3. Coal Production CO2 Emissions Embodied in Trade
4. Conclusions and Policy Implications
- (1)
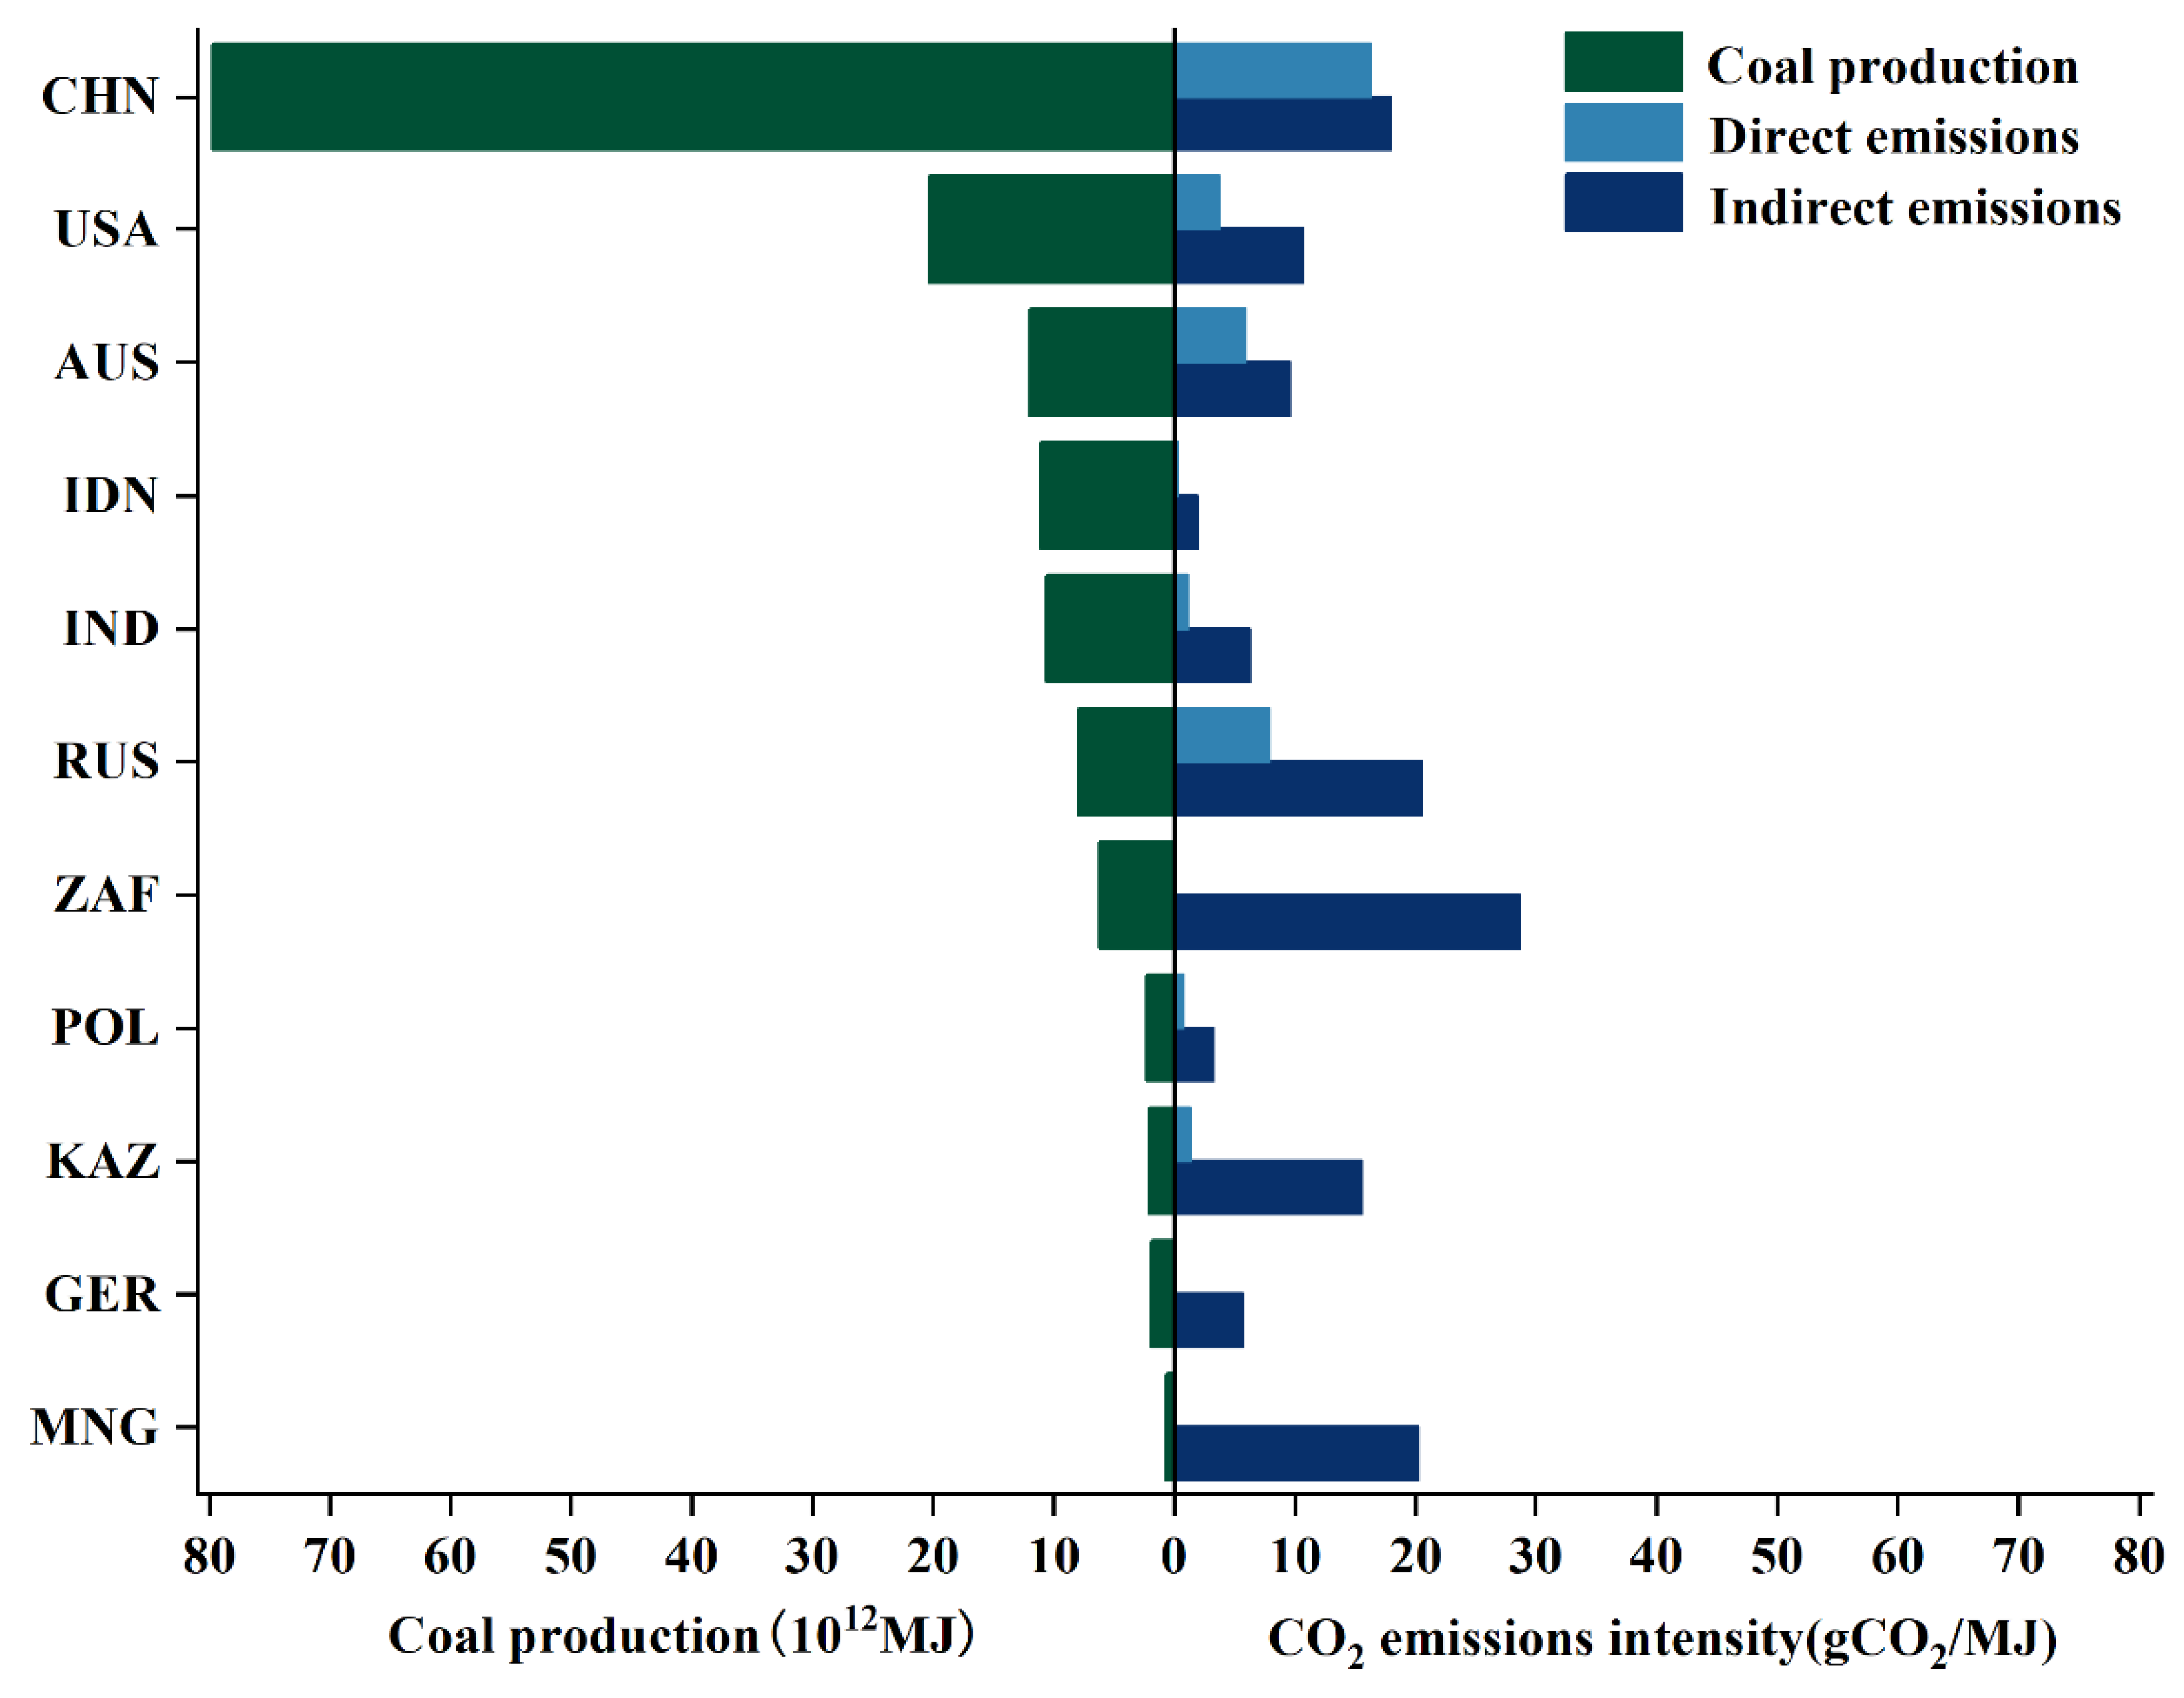
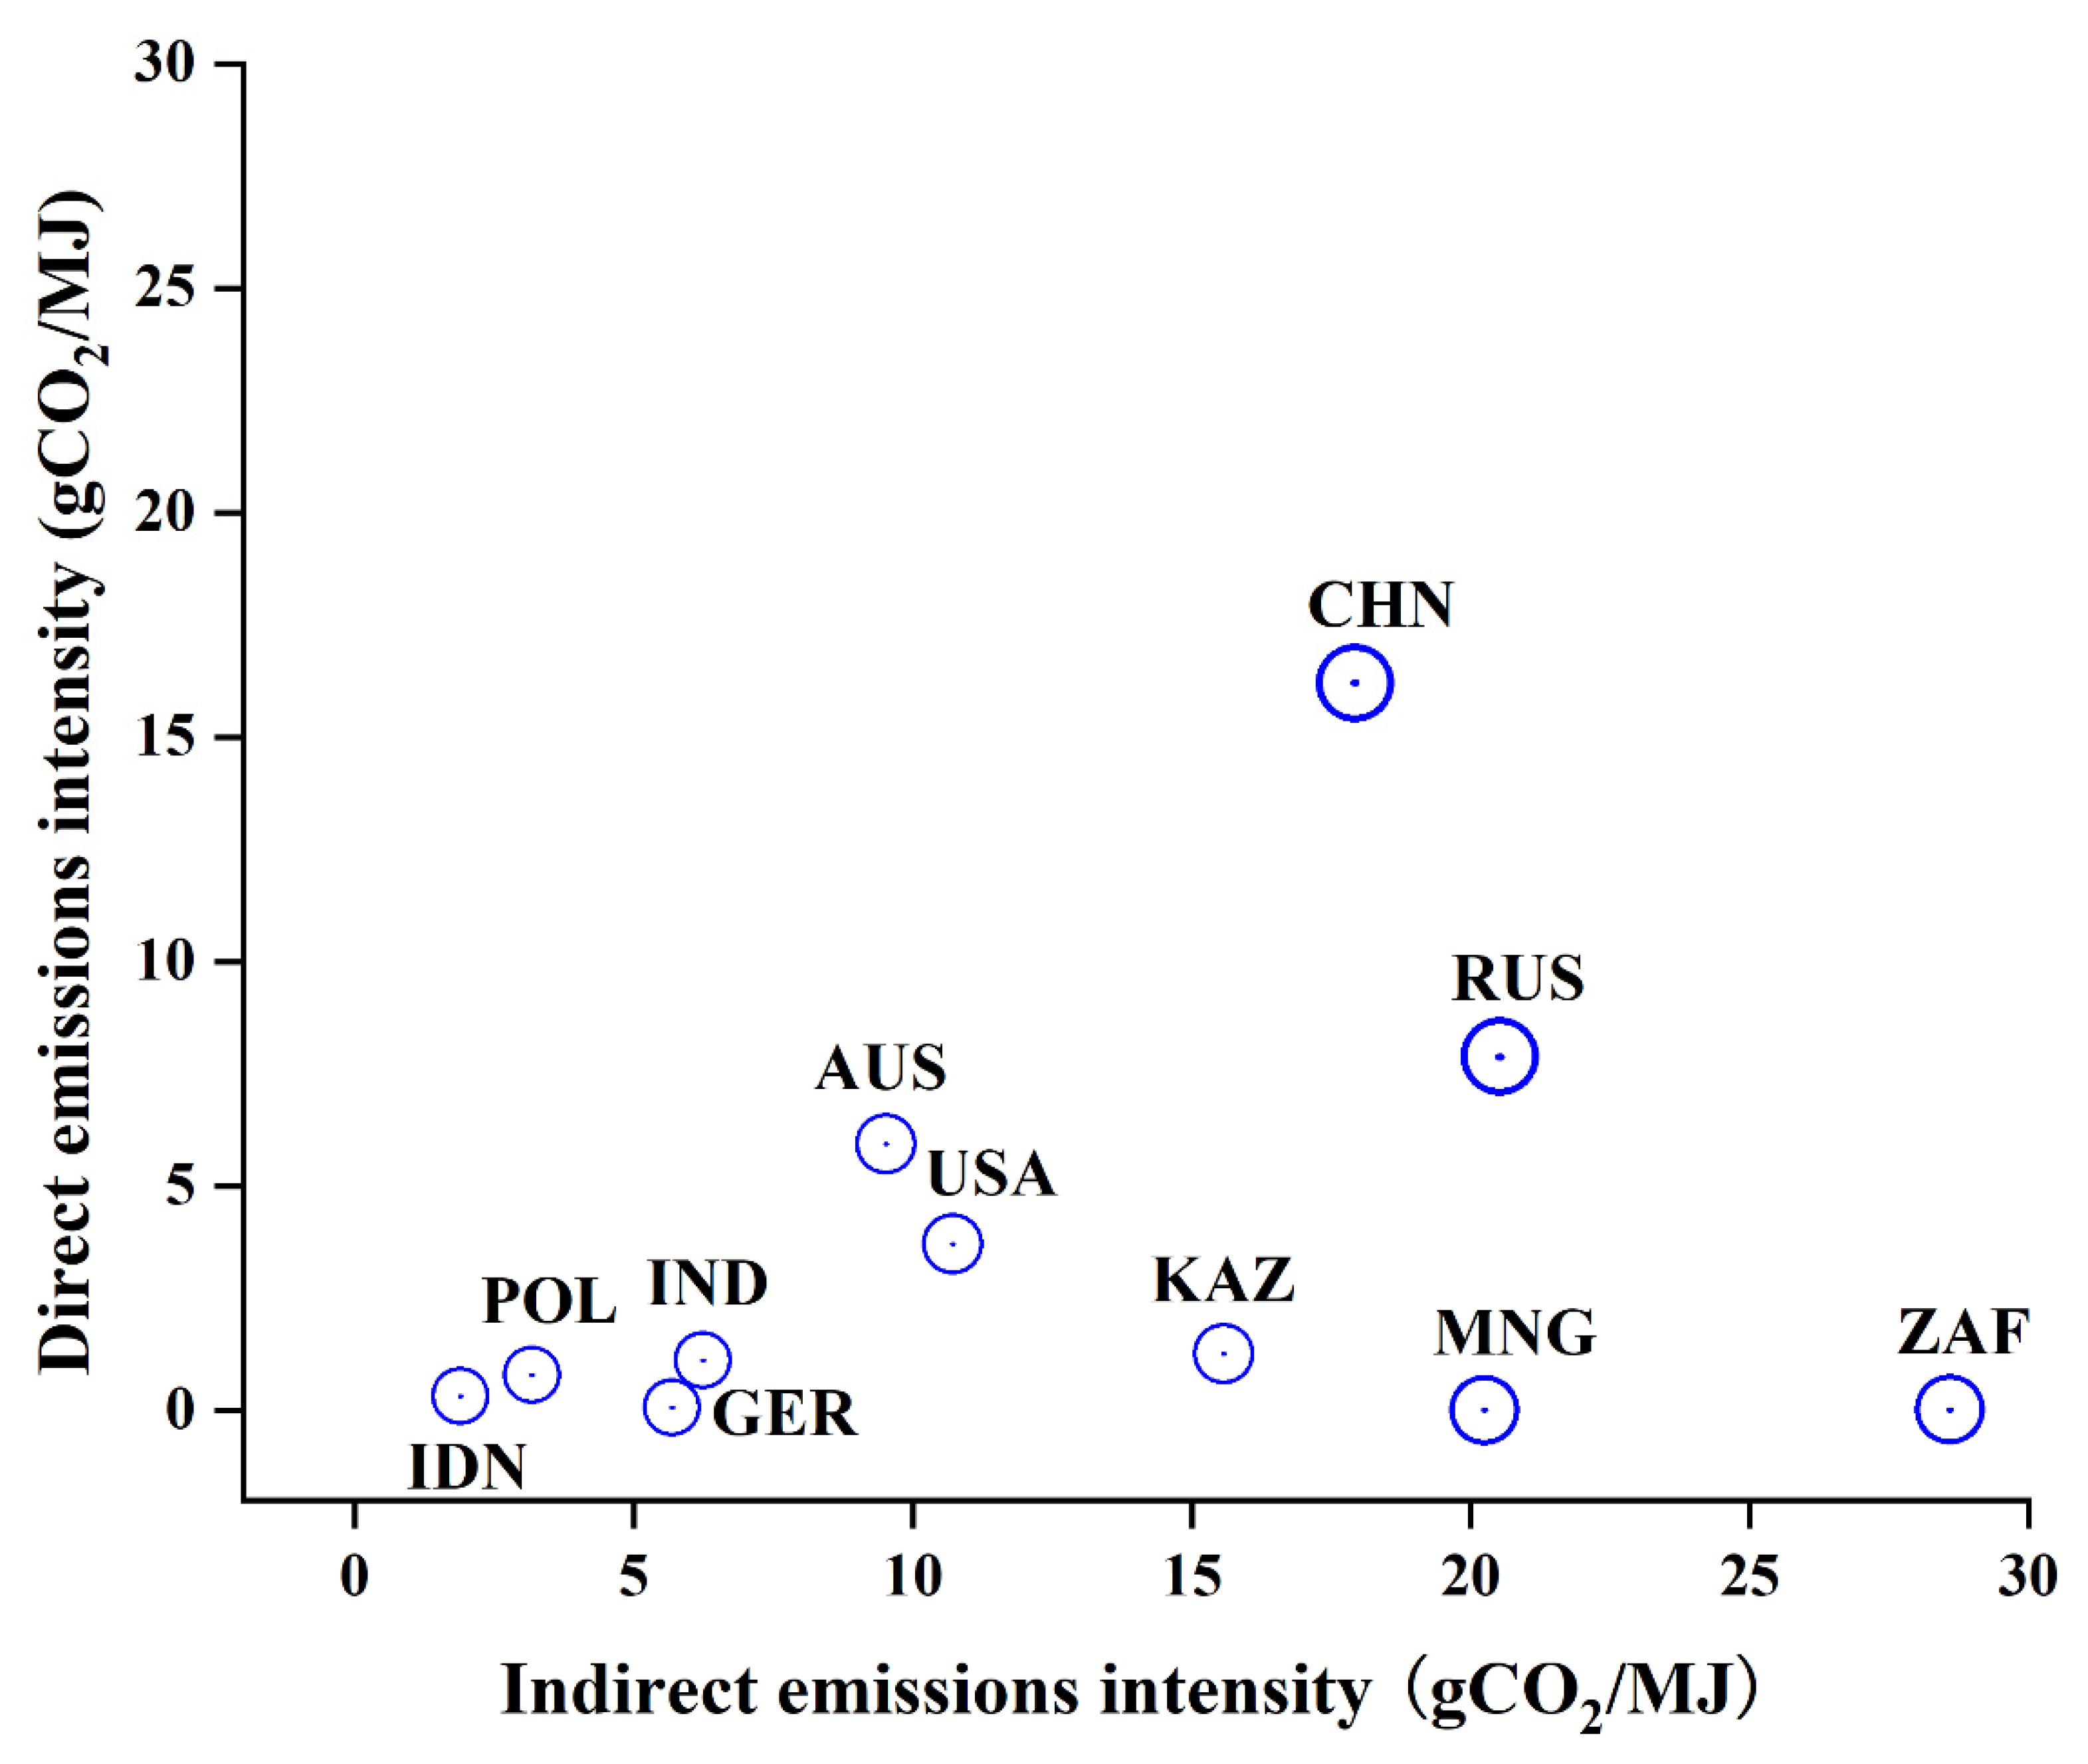
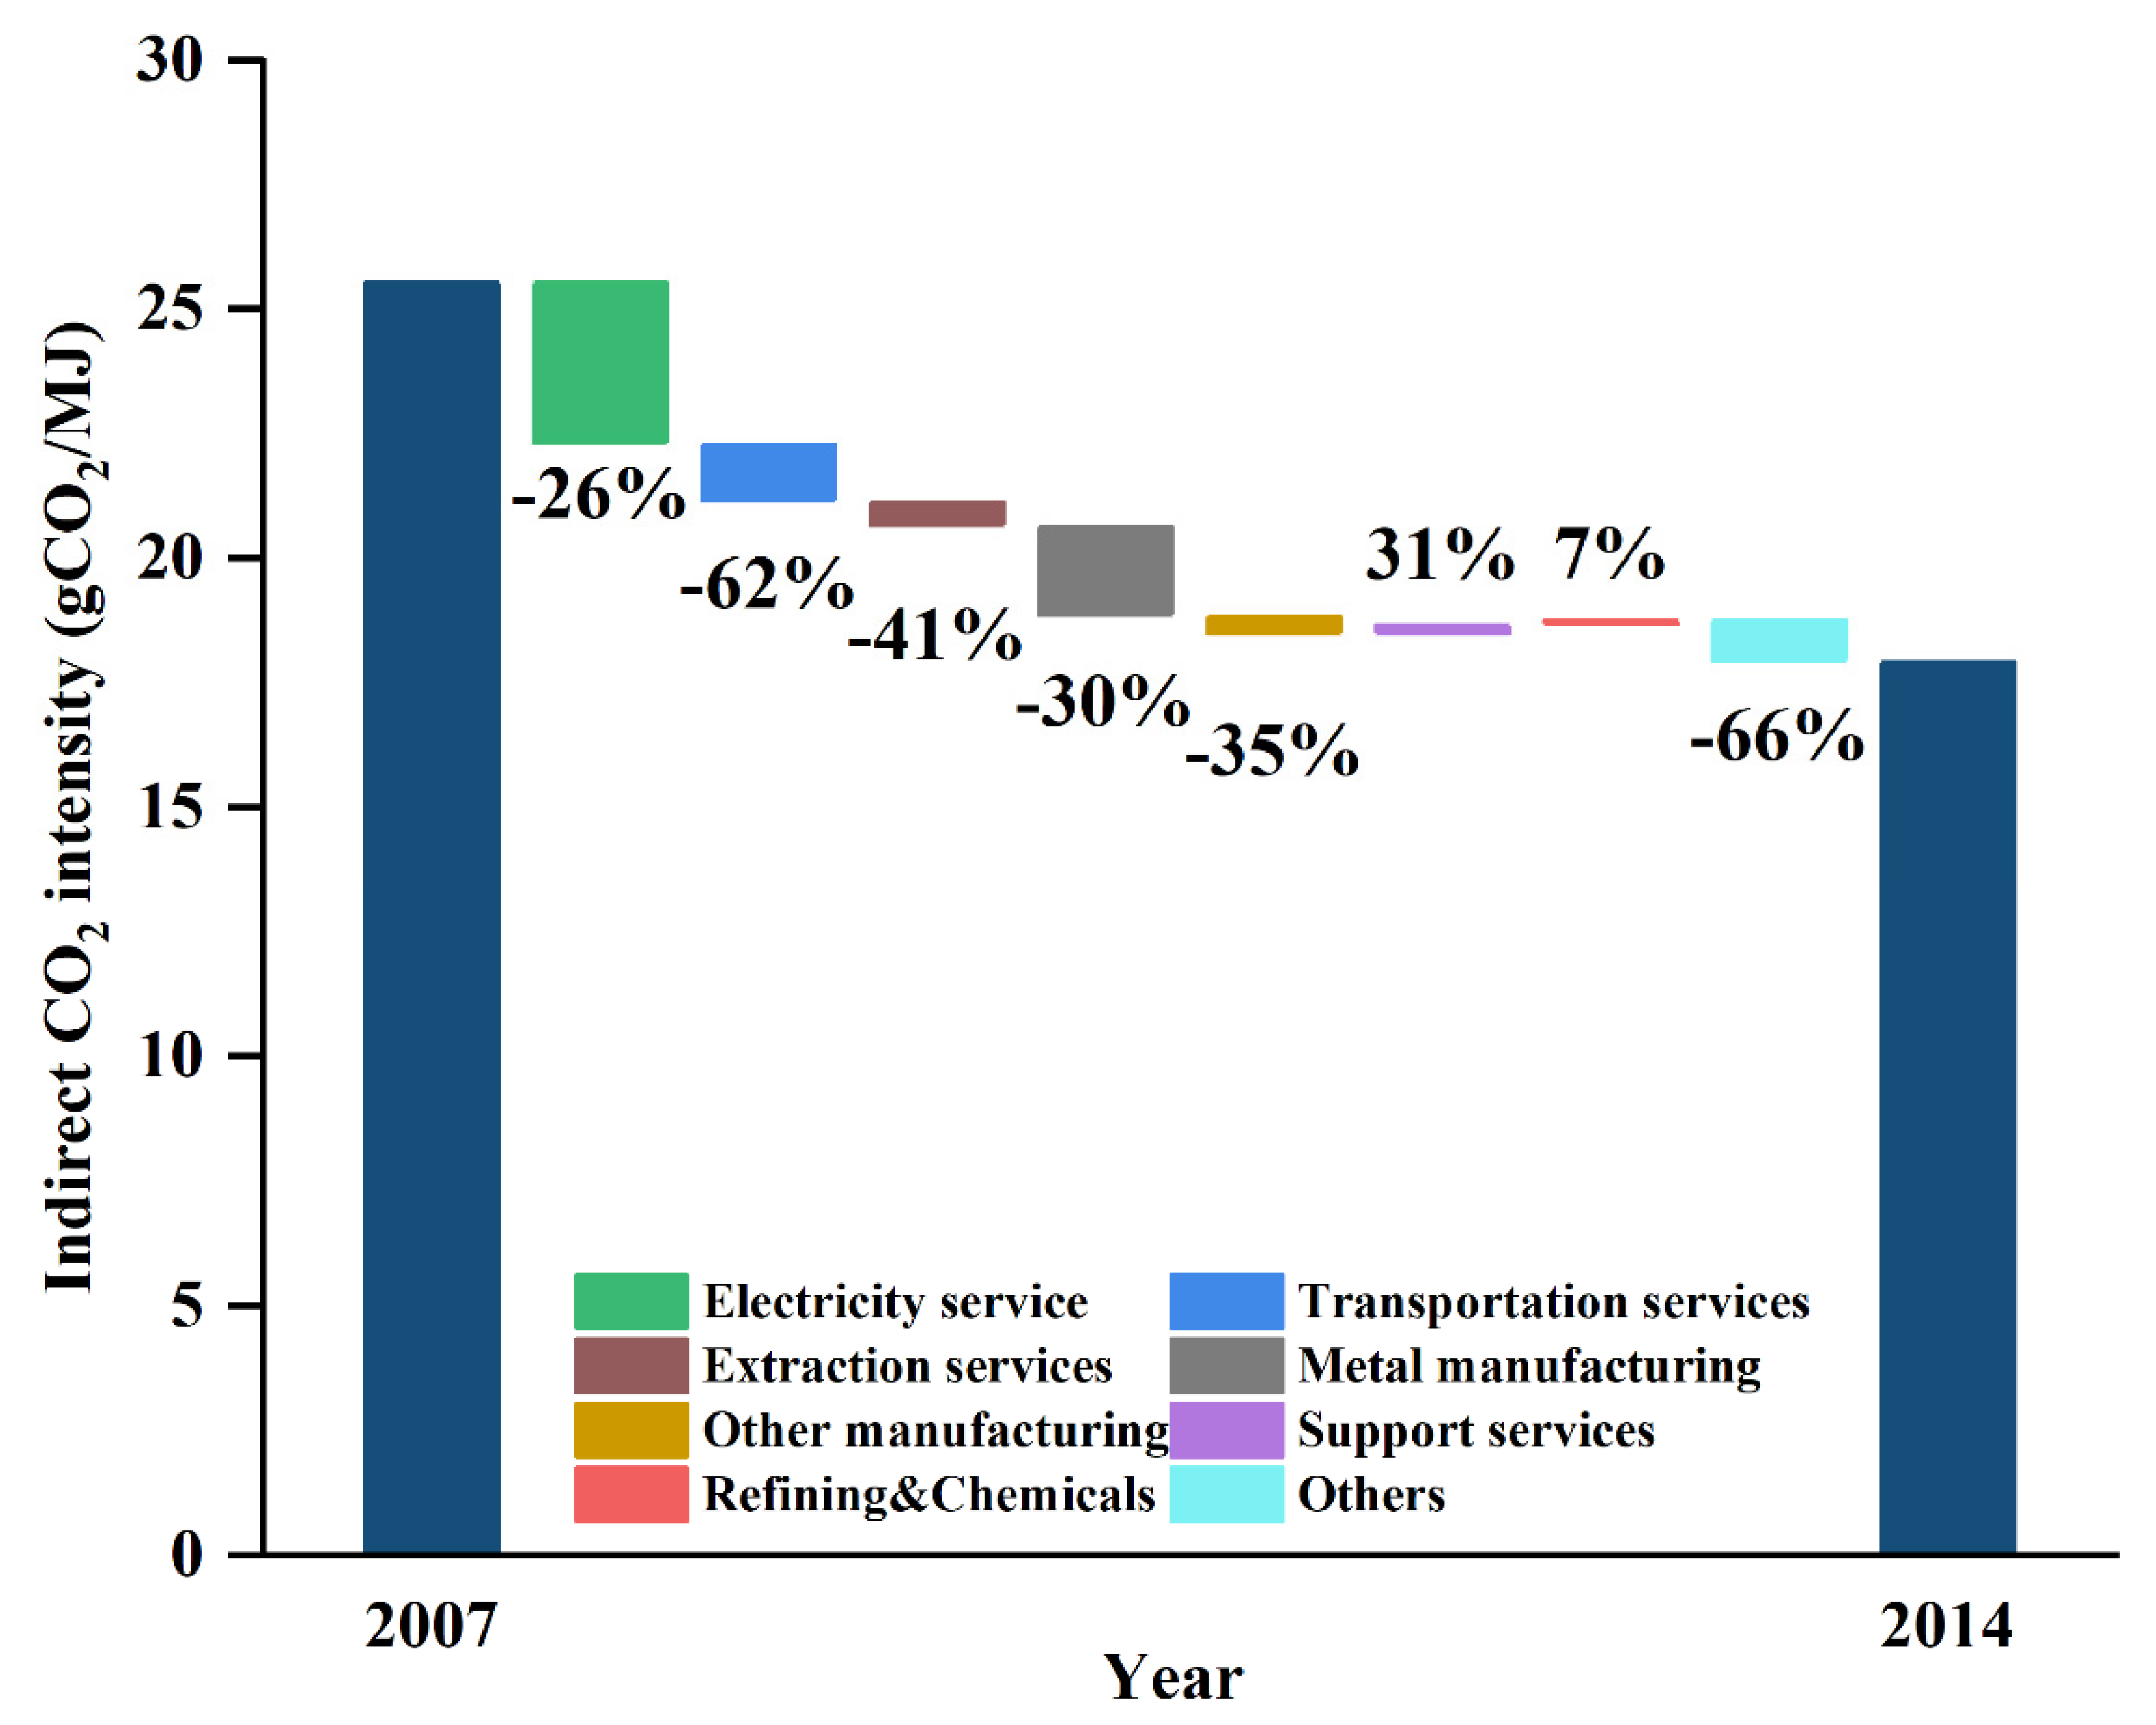
- In 2014, the CO2 emission intensity of China’s coal production was 34.14 gCO2/MJ, of which the direct and indirect emission intensities were 16.22 gCO2/MJ and 17.92 gCO2/MJ, respectively. From 2007 to 2014, the direct emission intensity of China’s coal production increased by 23%, while the indirect emission intensity decreased by 30%. Compared with other coal-producing countries, China has high direct and indirect emission intensity in coal production mining.
- (2)
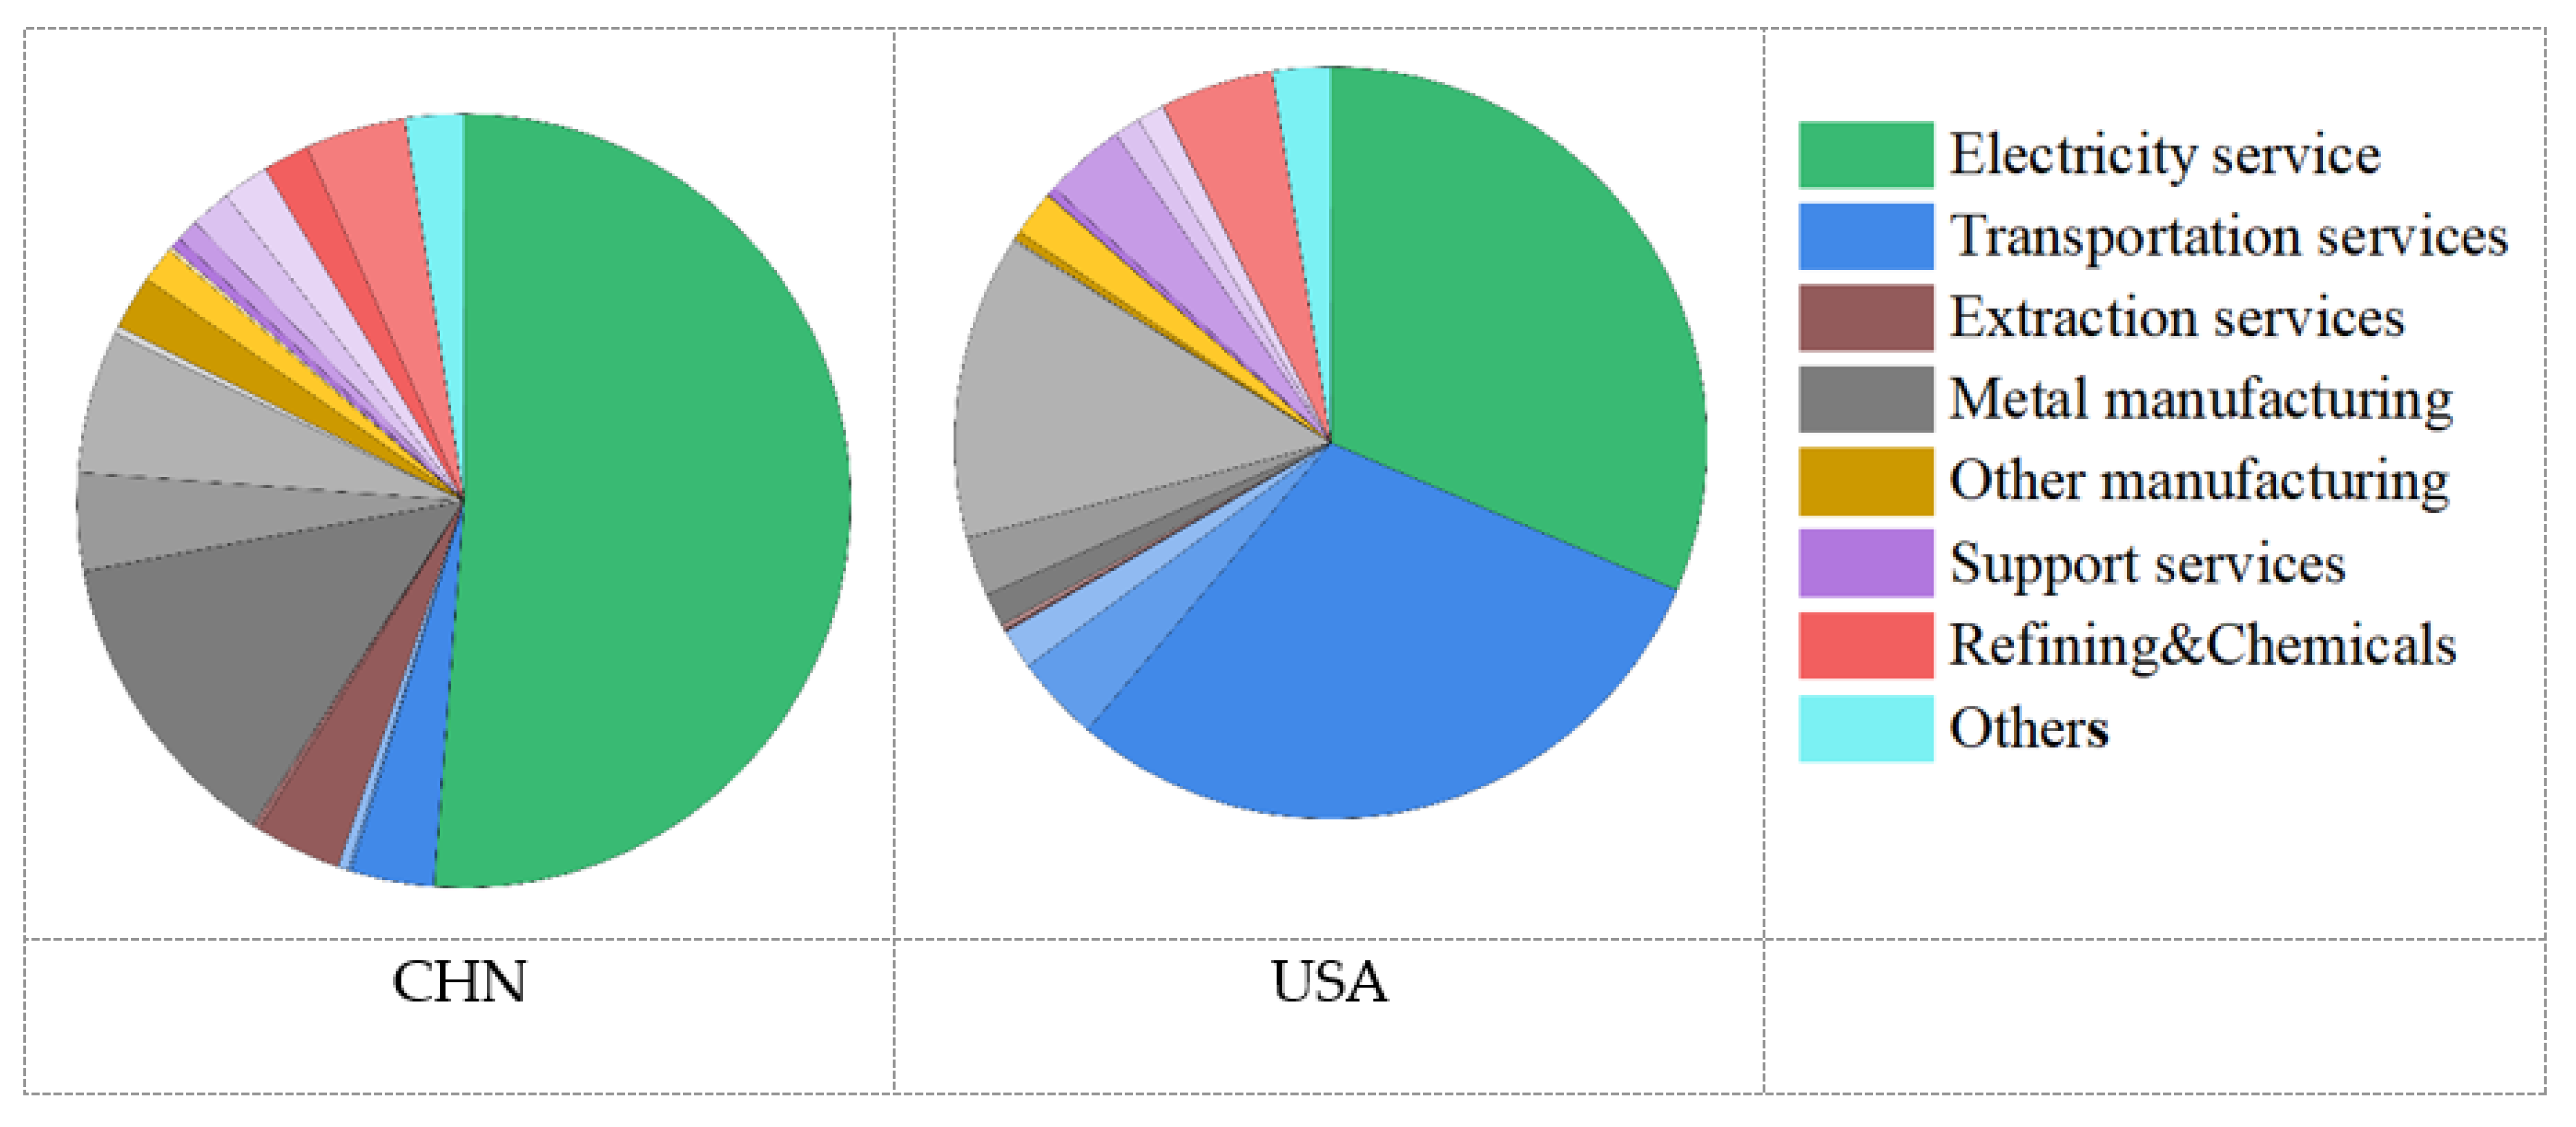
- The key material and service inputs affecting indirect carbon emissions of coal production in China are electricity, ferrous metal, machinery and equipment, chemical products, metal products, coal mining, and transport, which accounted for 85.5% of the total indirect emission intensity of coal production in 2014. It is worth noting that China’s coal mining sector contributes 4% of indirect emissions to coal production, which is much higher than other coal-producing countries.
- (3)
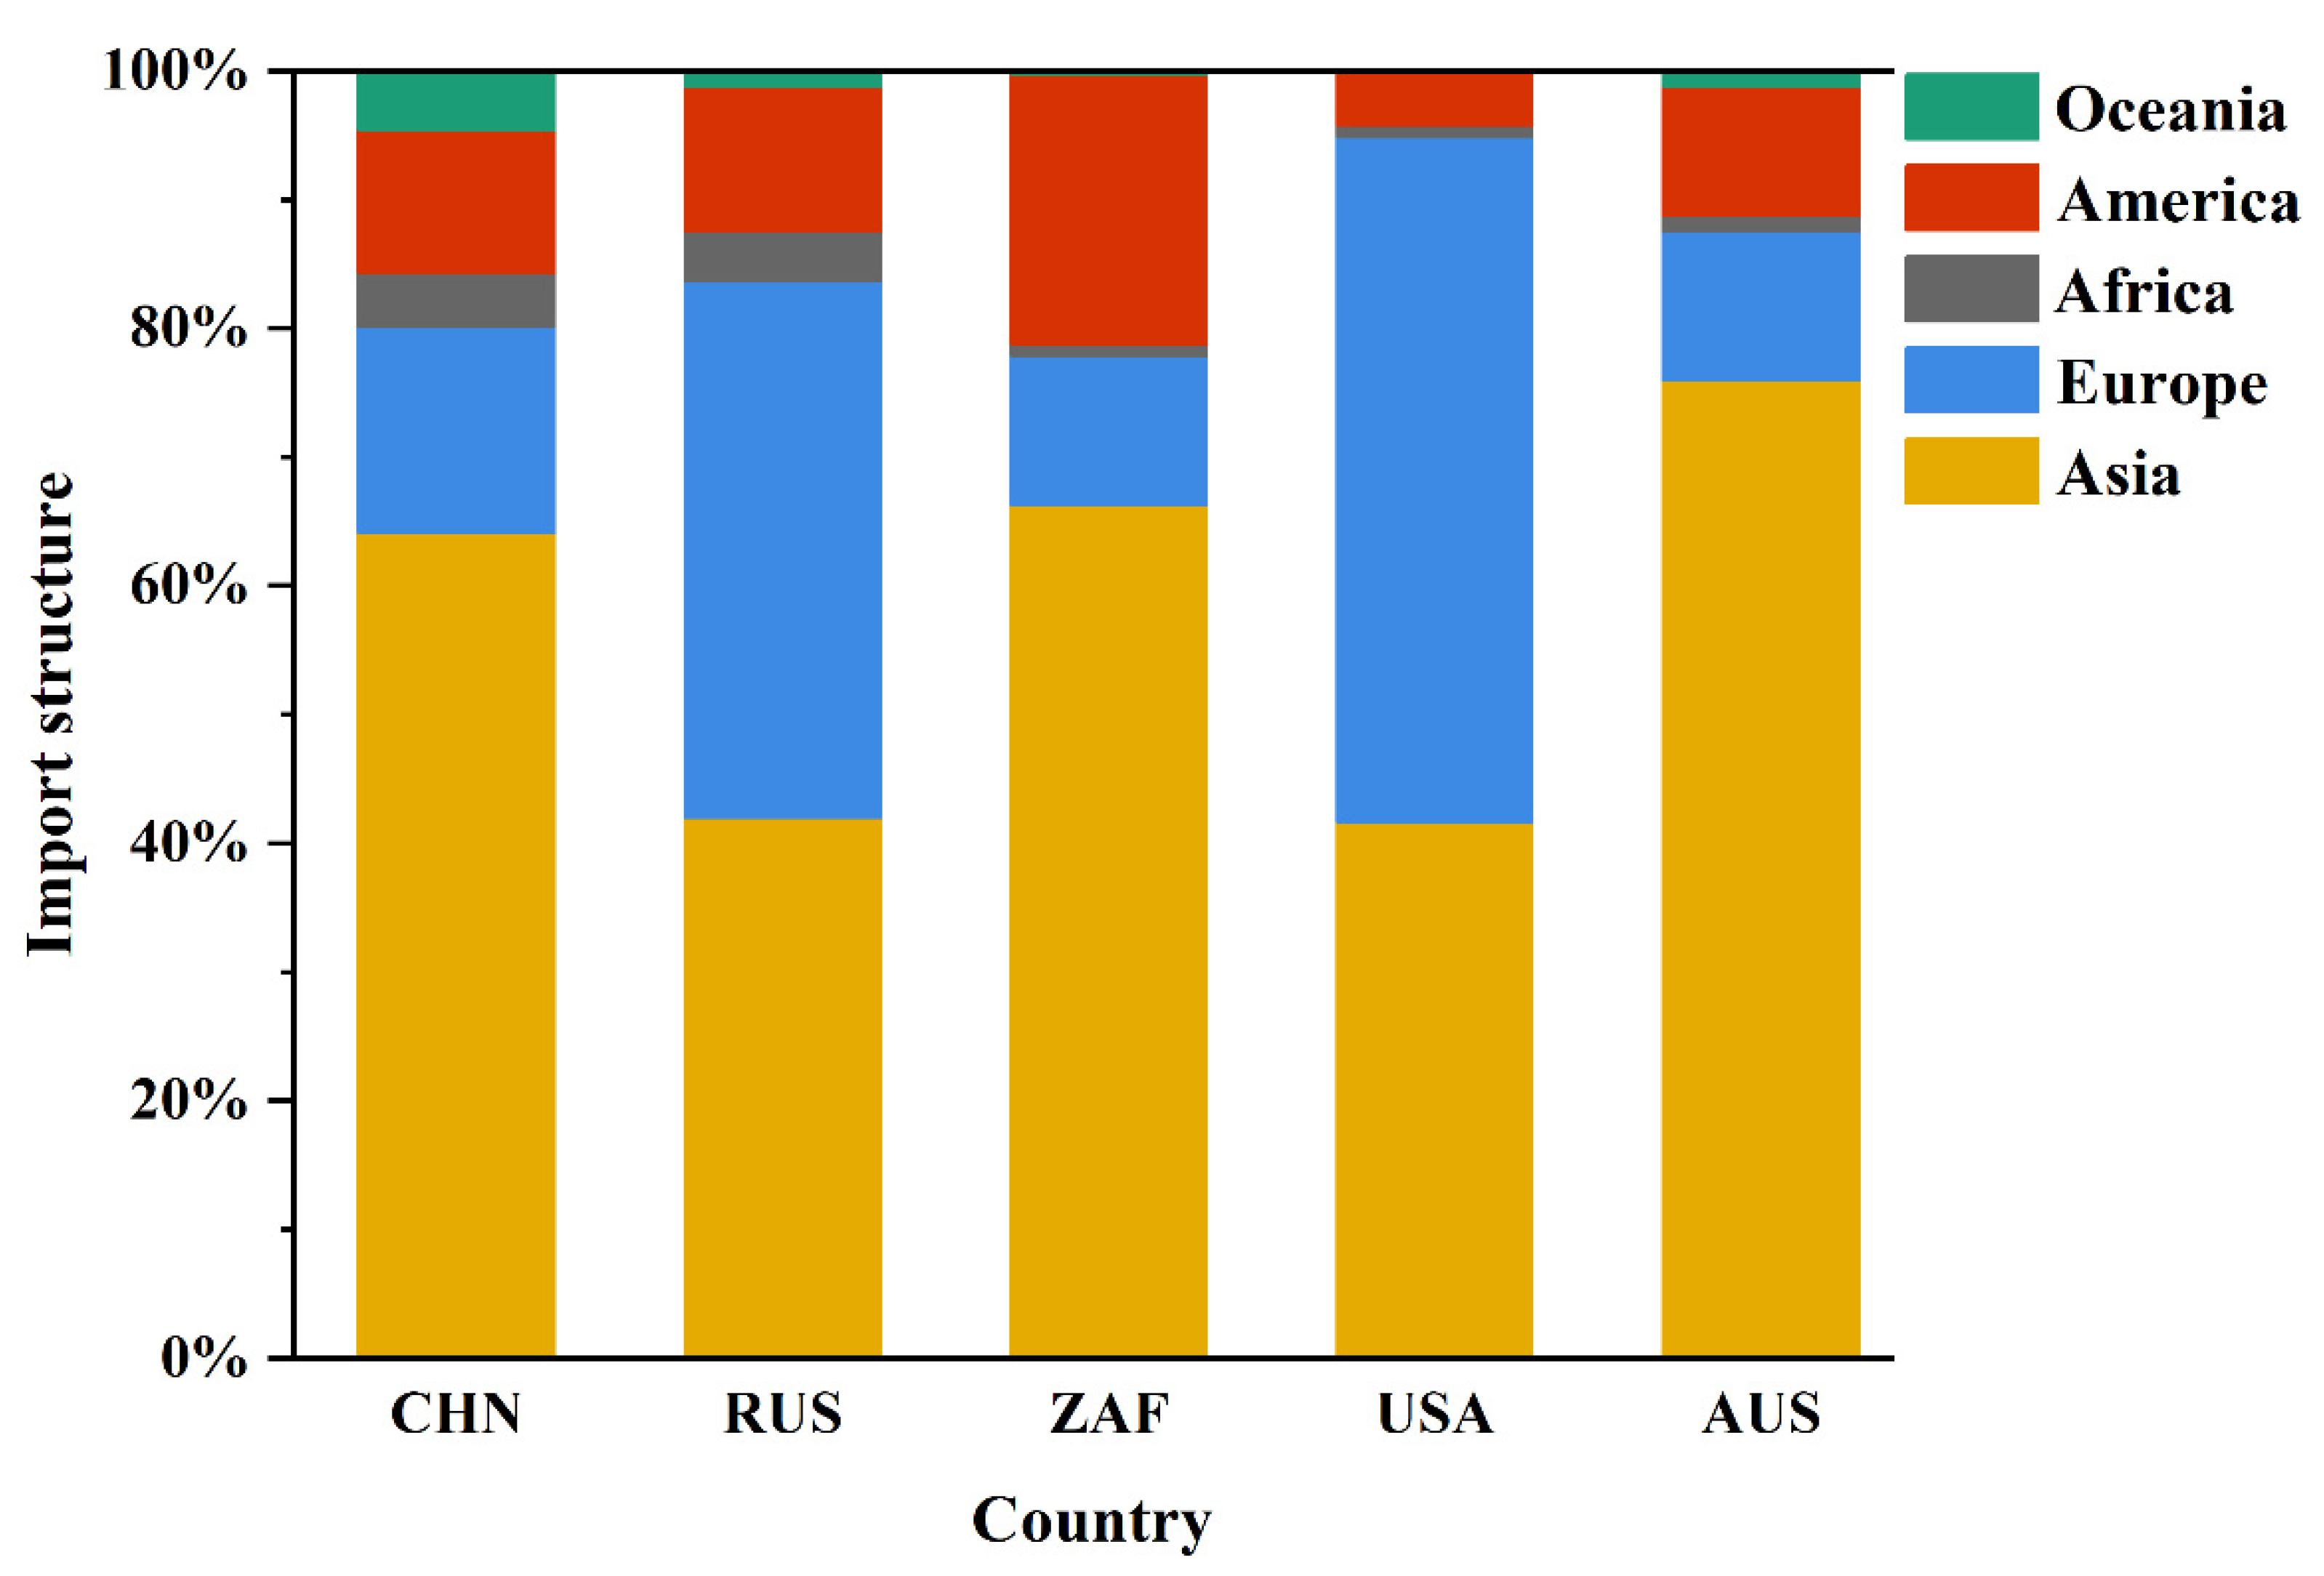
- China’s coal production sector is mainly traded with Japan, South Korea, Thailand, and India. All import trade accounts for 0.8% of the total indirect emissions from coal production in China. However, China is the largest import source of material and service inputs for coal production in South Africa, the United States, Russia, Australia, and other coal-producing countries, accounting for 1.24%, 1.28%, 4.34%, and 3.58% of their total indirect emissions from coal production, respectively.
Author Contributions
Funding
Institutional Review Board Statement
Informed Consent Statement
Data Availability Statement
Conflicts of Interest
References
- Xinhuanet. 2021. Available online: http://www.xinhuanet.com/world/cop15/index.htm (accessed on 12 October 2021).
- He, G.; Lin, J.; Sifuentes, F.; Liu, X.; Abhyankar, N.; Phadke, A. Rapid cost decrease of renewables and storage accelerates the decarbonization of China’s power system. Nat. Commun. 2020, 11, 3780. [Google Scholar] [CrossRef] [PubMed]
- Fu, C.; Yu, H.C.; Bian, Z.F.; Ying, D.Y. How to handles the crisis of coal industry in China under the vision of carbon neutrality. J. China Coal Soc. 2021, 46, 1808–1820. [Google Scholar] [CrossRef]
- Xie, H.P.; Wu, L.X.; Zheng, D.Z. Prediction on the energy consumption and coal demand of China in 2025. J. China Coal Soc. 2019, 44, 1949–1960. [Google Scholar] [CrossRef]
- Meng, L.; Li, Y.; Zhang, S. Regional differences of carbon emissions in the coal industry based on FPGA and wireless sensors. Microprocess. Microsyst. 2020, 103489. [Google Scholar] [CrossRef]
- Eggleston, H.S.; Buendia, L.; Miwa, K.; Ngara, T.; Tanabe, K. 2006 IPCC Guidelines for National Greenhouse Gas Inventories; Institute for Global Environmental Strategies (IGES): Tokyo, Japan, 2006; ISBN 4-88788-032-4. [Google Scholar]
- Gao, T.; Jin, P.; Song, D.; Chen, B. Tracking the carbon footprint of China’s coal-fired power system. Resour. Conserv. Recycl. 2022, 177, 105964. [Google Scholar] [CrossRef]
- Czarnowska, L.; Stanek, W.; Pikon, K.; Nadziakiewicz, J. Environmental quality evaluation of hard coal using LCA and exergo-ecological cost methodology. Chem. Eng. Trans. 2014, 42, 139–144. [Google Scholar]
- Wang, J.; Wang, R.; Zhu, Y.; Li, J. Life cycle assessment and environmental cost accounting of coal-fired power generation in China. Energy Policy 2018, 115, 374–384. [Google Scholar] [CrossRef]
- Wang, C.; Mu, D. An LCA study of an electricity coal supply chain. J. Ind. Eng. Manag. 2014, 7, 311–335. [Google Scholar] [CrossRef]
- Zhou, A.; Hu, J.; Wang, K. Carbon emission assessment and control measures for coal mining in China. Environ. Earth Sci. 2020, 79, 461. [Google Scholar] [CrossRef]
- Burchart-Korol, D.; Fugiel, A.; Czaplicka-Kolarz, K.; Turek, M. Model of environmental life cycle assessment for coal mining operations. Sci. Total Environ. 2016, 562, 61–72. [Google Scholar] [CrossRef]
- Feng, C.; Xu, T.; Jin, Y.; Wang, X.; Zhang, B. Inter-industry path decomposition of embodied oil export changes in China. Pet. Sci. Bull. 2017, 4, 546–556. [Google Scholar] [CrossRef]
- Tang, X.; Jin, Y.; Wang, X.; Wang, J.; McLellan, B.C. Will China’s trade restructuring reduce CO2 emissions embodied in international exports? J. Clean. Prod. 2017, 161, 1094–1103. [Google Scholar] [CrossRef]
- Jiang, Y.; Tang, X.; Zhao, X.; Höök, M. Mitigation strategies of air pollution: Case studies of China and the United States from a consumption perspective. Environ. Sci. Policy 2022, 128, 24–34. [Google Scholar] [CrossRef]
- Wiedmann, T. A review of recent multi-region input–output models used for consumption-based emission and resource accounting. Ecol. Econ. 2009, 69, 211–222. [Google Scholar] [CrossRef]
- Machado, G.V. Energy use, CO2 emissions and foreign trade: An IO approach applied to the Brazilian case. In Proceedings of the Thirteenth International Conference on Input–Output Techniques, Macerata, Italy, 21–25 August 2000. [Google Scholar]
- Davis, S.J.; Caldeira, K. Consumption-based accounting of CO2 emissions. Proc. Natl. Acad. Sci. USA 2010, 107, 5687–5692. [Google Scholar] [CrossRef]
- Zhou, H.; Yang, Y. Carbon emissions embodied in the international trade of China. Adv. Mater. Res. 2010, 171–172, 183–187. [Google Scholar] [CrossRef]
- Daly, H.E.; Scott, K.; Strachan, N.; Barrett, J. Indirect CO2 emission implications of energy system pathways: Linking IO and TIMES models for the UK. Environ. Sci. Technol. 2015, 49, 10701–10709. [Google Scholar] [CrossRef]
- Pan, L.; Zhang, T.; Li, W.; Li, Z.; Zhou, C. Sector-level evaluation of China’s CO2 emissions: Trend evolution and index ranking. J. Clean. Prod. 2010, 286, 125453. [Google Scholar] [CrossRef]
- Li, Q.; Duan, H.; Li, T.; Zhou, Y.; Chen, Y.; Zhong, R. Embodied carbon emissions of aluminum-containing commodities in international trade: China’s perspective. Clim. Change 2021, 166, 47. [Google Scholar] [CrossRef]
- Leontief, W.W. The structure of American economy, 1919–1939: An empirical application of equilibrium analysis (No. HC106. 3 L3945 1951). Econom. Soc. 1951, 19, 351–353. [Google Scholar] [CrossRef]
- Aguiar, A.; Chepeliev, M.; Corong, E.L.; McDougall, R.; van der Mensbrugghe, D. The GTAP Data Base: Version 10. J. Glob. Econ. Anal. 2019, 4, 1–27. [Google Scholar] [CrossRef]
- Ou, J.; Huang, Z.; Klimont, Z.; Jia, G.; Zhang, S.; Li, C.; Meng, J.; Mi, Z.; Zheng, H.; Shan, Y.; et al. Role of export industries on ozone pollution and its precursors in China. Nat. Commun. 2020, 11, 5492. [Google Scholar] [CrossRef] [PubMed]
- Meng, J.; Liu, J.; Xu, Y.; Guan, D.; Liu, Z.; Huang, Y.; Tao, S. Globalization and pollution: Tele-connecting local primary PM2.5 emissions to global consumption. Proc. R. Soc. A Math. Phys. Eng. Sci. 2016, 472, 20160380. [Google Scholar] [CrossRef] [PubMed]
- Mi, Z.; Meng, J.; Guan, D.; Shan, Y.; Song, M.; Wei, Y.M.; Liu, Z.; Hubacek, K. Chinese CO2 emission flows have reversed since the global financial crisis. Nat. Commun. 2017, 8, 1712. [Google Scholar] [CrossRef] [PubMed]
- IEA. 2021. Available online: https://www.iea.org/fuels-and-technologies/coal (accessed on 30 November 2021).
- Liang, Y. Strategic thinking of simultaneous exploitation of coal and gas in deep mining. J. China Coal Soc. 2016, 41, 1–6. [Google Scholar] [CrossRef]
- Kuznetsov, P.N.; Ilyushechkin, A.Y. Coal resources, production and use in the Russian Federation. In The Coal Handbook: Towards Cleaner Production; Woodhead Publishing: Sawston, UK, 2013; pp. 148–168. [Google Scholar] [CrossRef]
- Xie, H.P.; Gao, F.; Ju, Y.; Gao, M.Z.; Xie, L.Z. Quantitative definition and investigation of deep mining. Mtan Xuebao/J. China Coal Soc. 2015, 40, 1–10. [Google Scholar] [CrossRef]
- Yang, L.; Xu, M.; Fan, J.; Liang, X.; Zhang, X.; Lv, H.; Wang, D. Financing coal-fired power plant to demonstrate CCS (carbon capture and storage) through an innovative policy incentive in China. Energy Policy 2021, 158, 112562. [Google Scholar] [CrossRef]


| Ranking | Material and Service Input | Indirect CO2 Emission Intensity |
|---|---|---|
| 1 | Electricity | 9.18 |
| 2 | Ferrous metal | 2.31 |
| 3 | Machinery and equipment | 1.07 |
| 4 | Chemical products | 0.75 |
| 5 | Metal products | 0.73 |
| 6 | Coal | 0.65 |
| 7 | Transport | 0.62 |
| 8 | Wood products | 0.40 |
| 9 | Business services | 0.35 |
| 10 | Petroleum, coal products | 0.35 |
| 11 | Financial services | 0.31 |
| 12 | Mineral products | 0.27 |
| 13 | Trade | 0.17 |
| 14 | Construction | 0.08 |
| 15 | Sea transport | 0.08 |
| 16 | Electrical and electronic equipment | 0.06 |
| 17 | Water | 0.04 |
| 18 | Manufactures | 0.03 |
| 19 | Air transport | 0.02 |
| 20 | Other extraction (mineral) | 0.02 |
Publisher’s Note: MDPI stays neutral with regard to jurisdictional claims in published maps and institutional affiliations. |
© 2022 by the authors. Licensee MDPI, Basel, Switzerland. This article is an open access article distributed under the terms and conditions of the Creative Commons Attribution (CC BY) license (https://creativecommons.org/licenses/by/4.0/).
Share and Cite
Yang, Z.; Dou, X.; Jiang, Y.; Luo, P.; Ding, Y.; Zhang, B.; Tang, X. Tracking the CO2 Emissions of China’s Coal Production via Global Supply Chains. Energies 2022, 15, 5934. https://doi.org/10.3390/en15165934
Yang Z, Dou X, Jiang Y, Luo P, Ding Y, Zhang B, Tang X. Tracking the CO2 Emissions of China’s Coal Production via Global Supply Chains. Energies. 2022; 15(16):5934. https://doi.org/10.3390/en15165934
Chicago/Turabian StyleYang, Zheqi, Xuming Dou, Yuqing Jiang, Pengfei Luo, Yu Ding, Baosheng Zhang, and Xu Tang. 2022. "Tracking the CO2 Emissions of China’s Coal Production via Global Supply Chains" Energies 15, no. 16: 5934. https://doi.org/10.3390/en15165934
APA StyleYang, Z., Dou, X., Jiang, Y., Luo, P., Ding, Y., Zhang, B., & Tang, X. (2022). Tracking the CO2 Emissions of China’s Coal Production via Global Supply Chains. Energies, 15(16), 5934. https://doi.org/10.3390/en15165934