
Experimental Investigation of Pore Characteristics and Permeability in Coal-Measure Sandstones in Jixi Basin, China

 ,
,
Abstract
:1. Introduction
2. Geological Setting
3. Samples and Experimental Methods
3.1. Sample Collection and Processing
3.2. Permeability Experiment
3.3. LF-NMR Experiments
4. Results
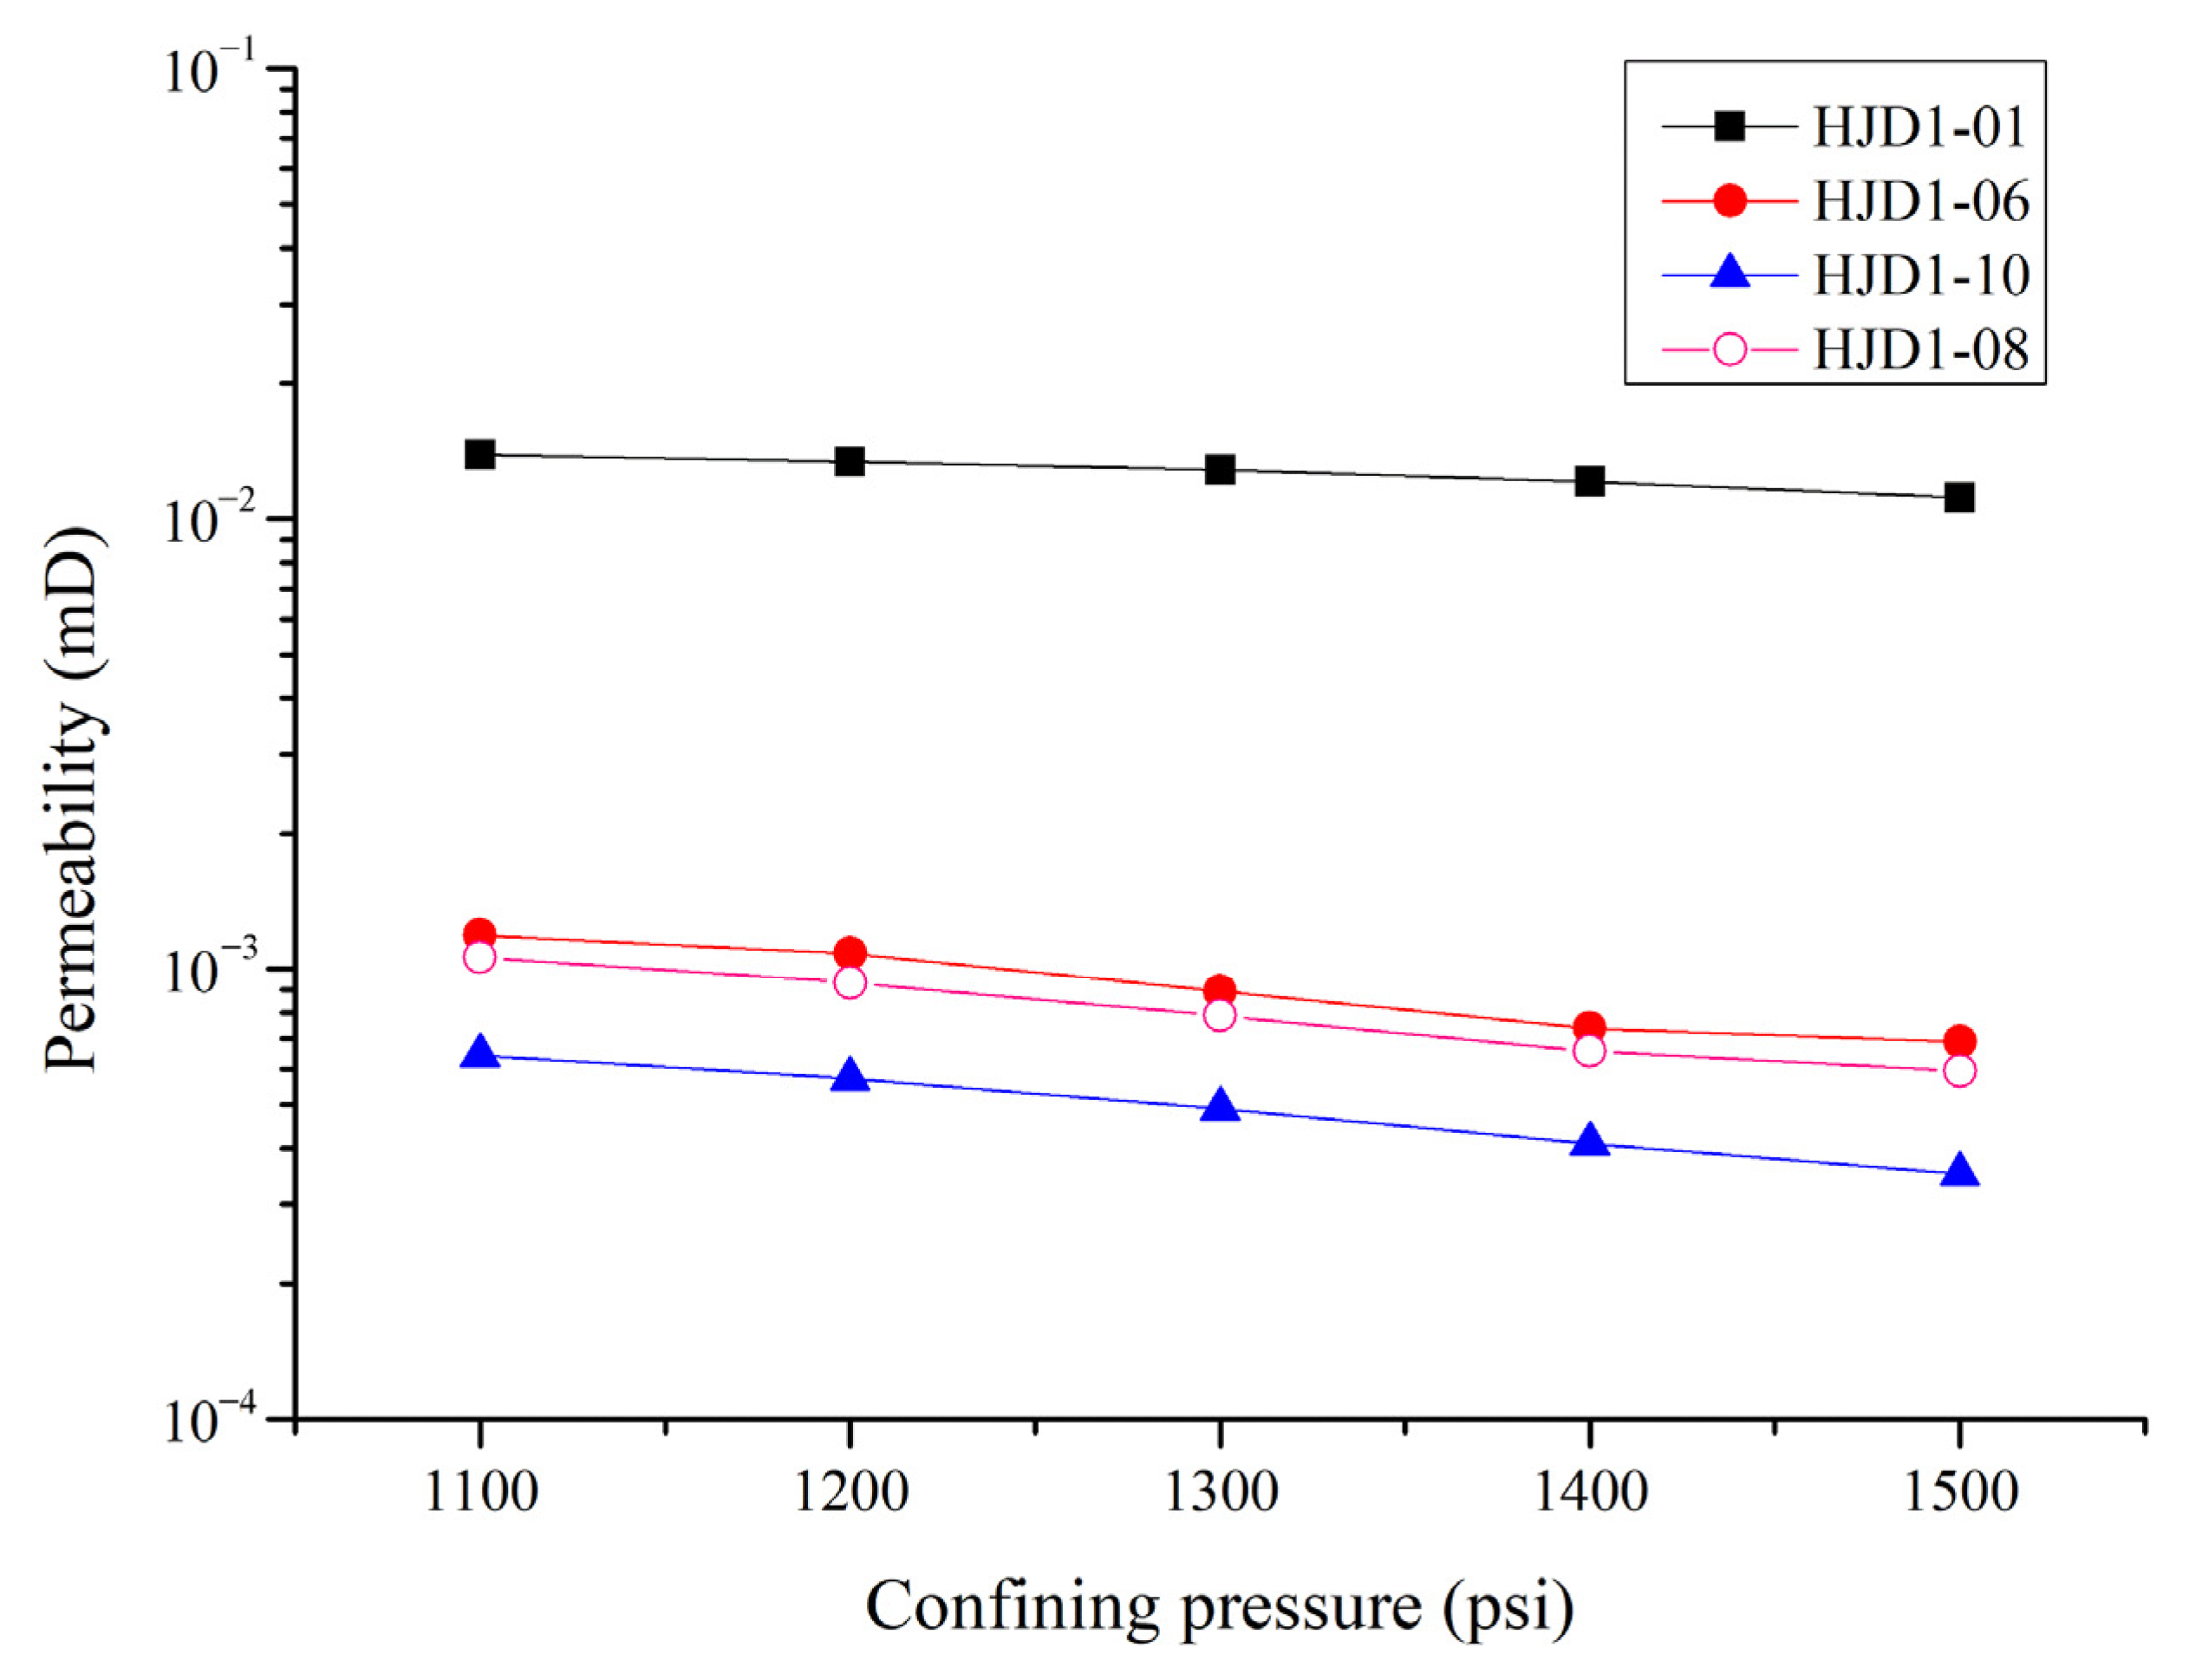
4.1. Permeability
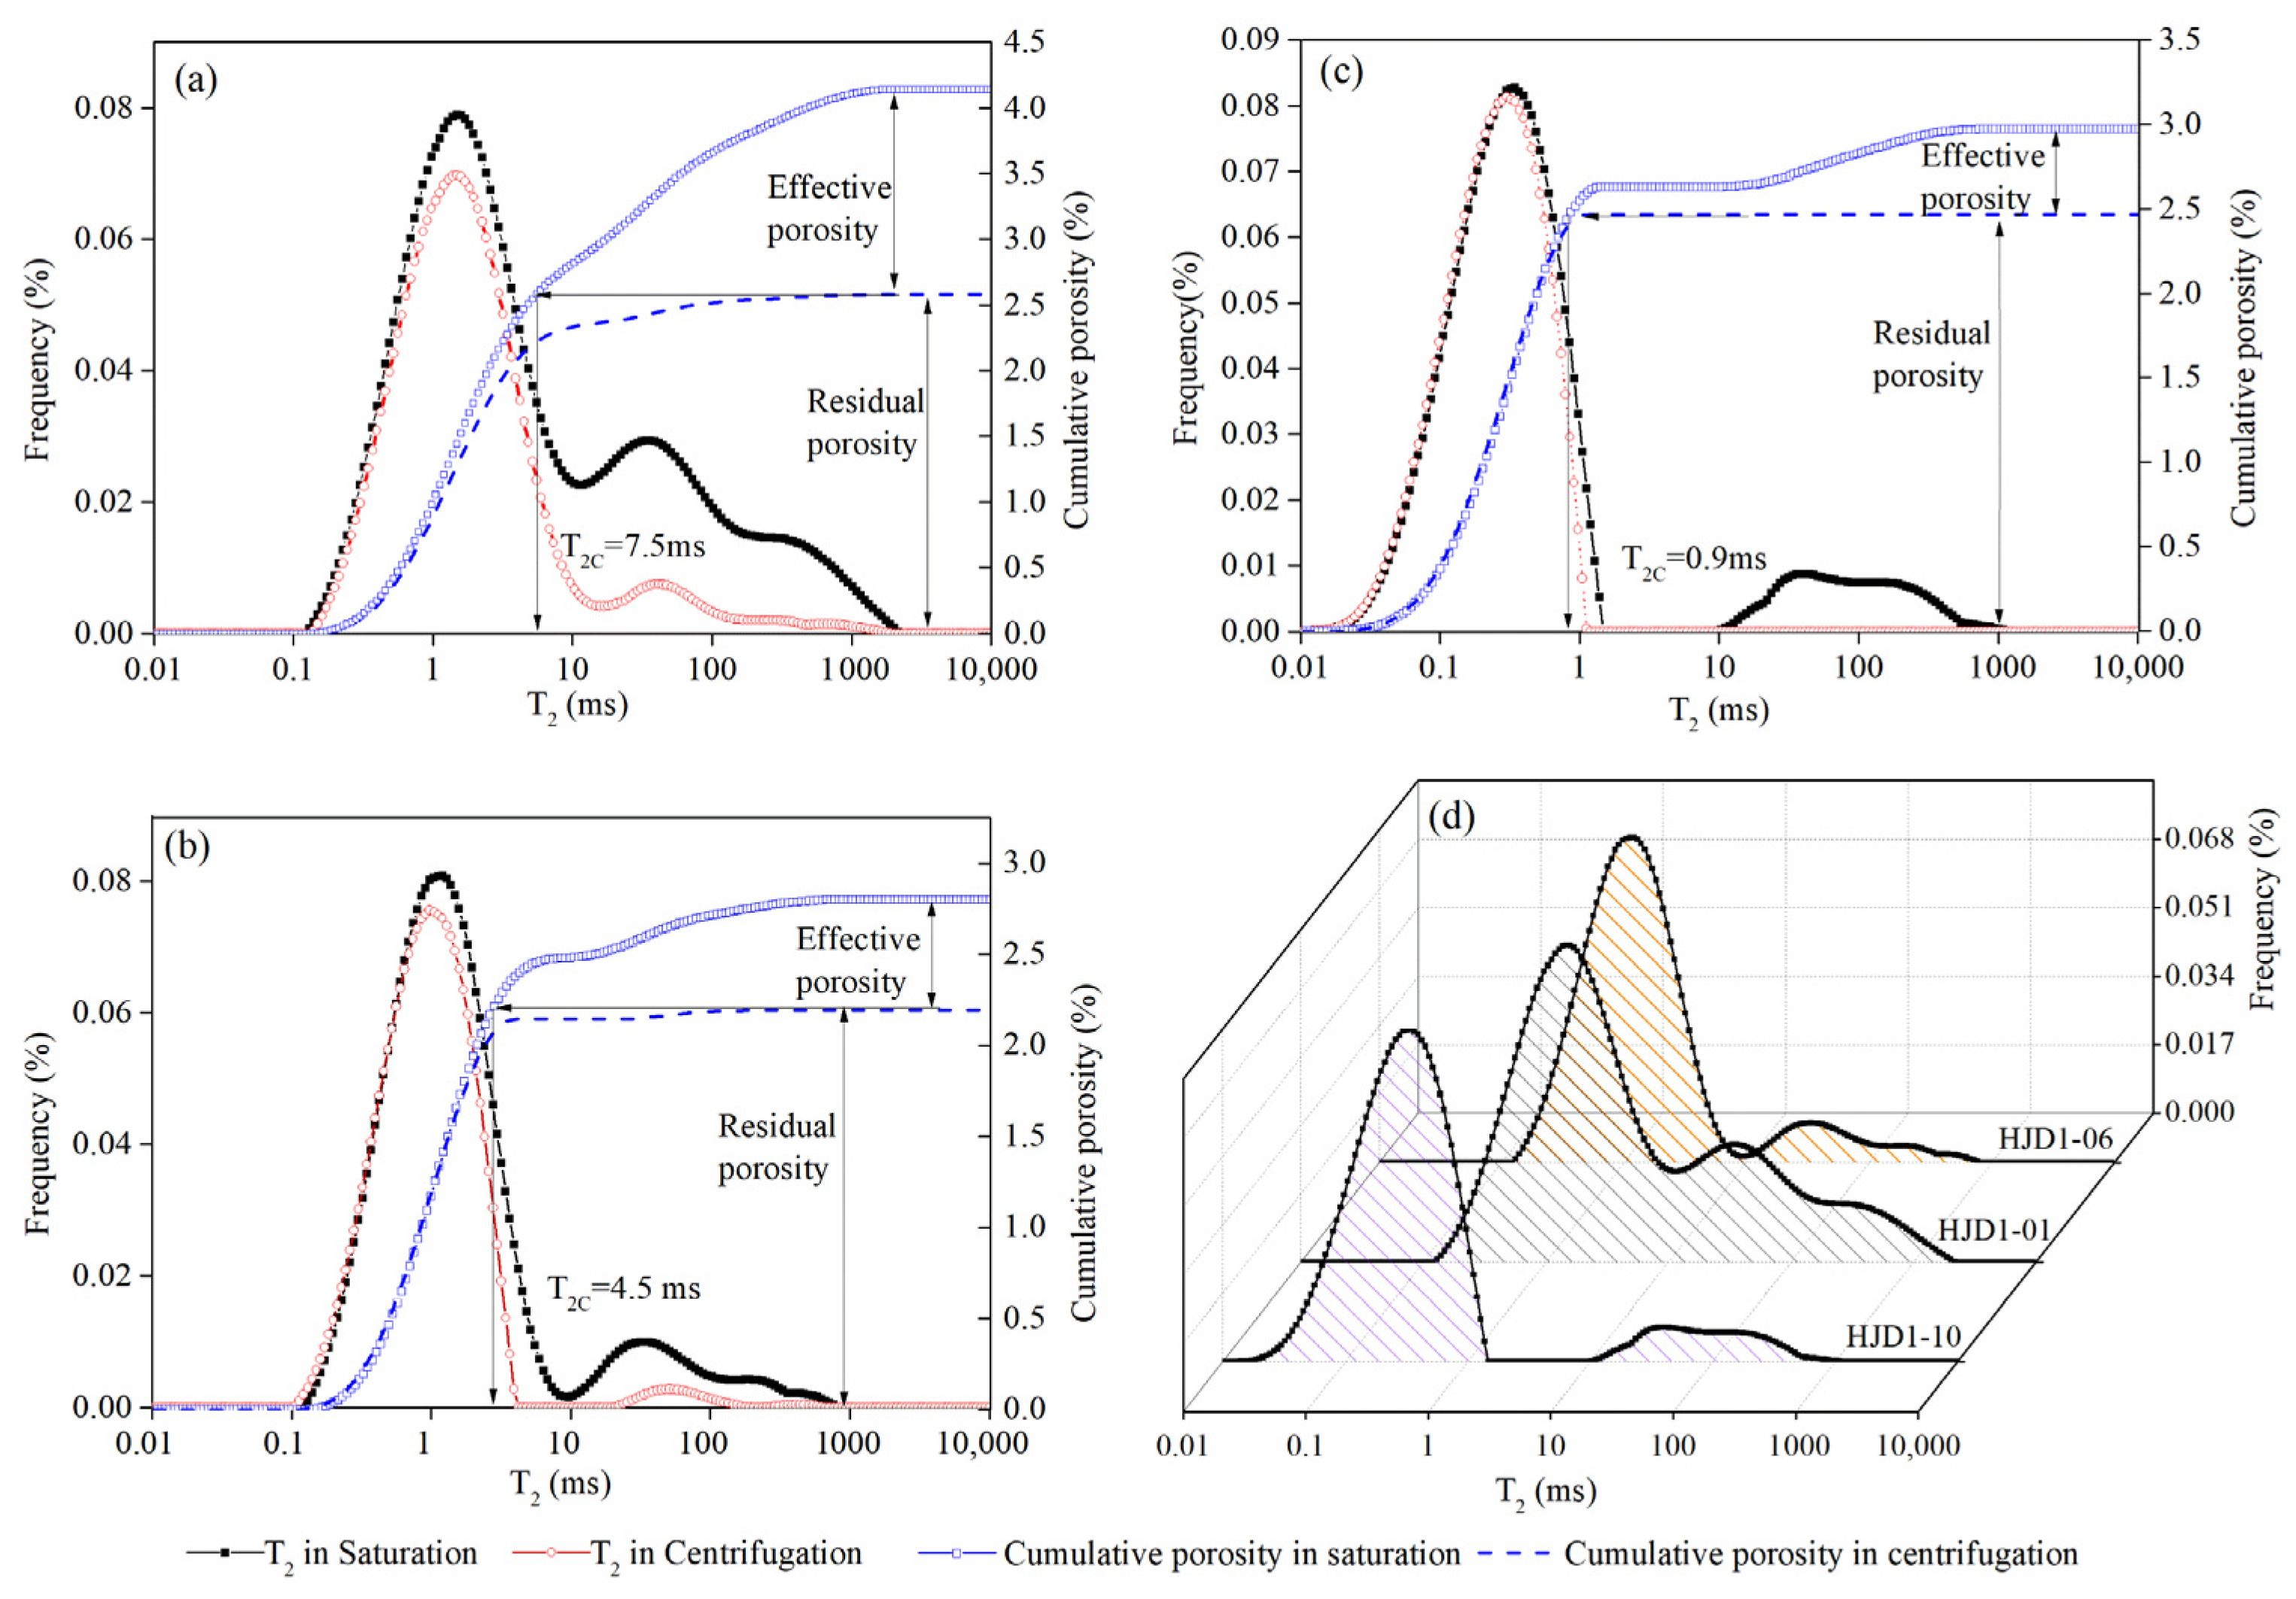
4.2. LF-NMR Pore Characteristics
5. Discussion
5.1. Permeability Variation with Effective Stress and Grains
5.2. Effects of NMR Pore Characteristics on Permeability Variation
6. Conclusions
- (1)
- Although the micropores are the most developed in sandstones from coal-measure, most of the micropores are the immovable pores. The pore characteristics are significantly affected by the grain size of sandstones in coal-measure. The movable pores and effective porosity increase with the grain size of testing sandstones. The pore connectivity ranks from good to poor with decreasing sandstone particle size.
- (2)
- The relationship between the permeability and the effective stress is close to the linear relationship as the effective stress is between 405 psi and 808 psi. The greater the number of movable pores and the effective porosity, the bigger the permeability of the sandstone. The effective porosity of sandstone is a sensitive indicator for evaluating the permeability of tight sandstone reservoirs. Ss would increase for the same sample with the increase of the effective stress, whilst the effective porosity is negatively correlated with Ss. The particle size of sandstone from coal-measure has a great influence on permeability and Ss. Under similar stress conditions, the permeability of the sampling sandstones increases with the increase of the grain size. The sandstone with lower permeability and finer grains has a higher Ss.
Author Contributions
Funding
Informed Consent Statement
Data Availability Statement
Conflicts of Interest
References
- Hou, X.W.; Zhu, Y.M.; Chen, S.B.; Wang, Y.; Liu, Y. Investigation on pore structure and multifractal of tight sandstone reservoirs in coal bearing strata using LF-NMR measurements. J. Pet. Sci. Eng. 2020, 187, 13. [Google Scholar] [CrossRef]
- Su, X.B.; Li, F.; Su, L.A.; Wang, Q. The experimental study on integrated hydraulic fracturing of coal measures gas reservoirs. Fuel 2020, 270, 7. [Google Scholar] [CrossRef]
- Law, B.E.; Curtis, J.B. Introduction to unconventional petroleum systems. AAPG Bull. 2002, 86, 1851–1852. [Google Scholar]
- Sun, W.; Zuo, Y.; Wu, Z.; Liu, H.; Xi, S.; Shui, Y.; Wang, J.; Liu, R.; Lin, J. Fractal analysis of pores and the pore structure of the Lower Cambrian Niutitang shale in northern Guizhou province: Investigations using NMR, SEM and image analyses. Mar. Pet. Geol. 2019, 99, 416–428. [Google Scholar] [CrossRef]
- Wan, L.M.; Hou, B.; Tan, P.; Chang, Z.; Muhadasi, Y. Observing the effects of transition zone properties on fracture vertical propagation behavior for coal measure strata. J. Struct. Geol. 2019, 126, 69–82. [Google Scholar] [CrossRef]
- Hou, X.W.; Zhu, Y.M.; Yao, H.P. Coupled accumulation characteristics of Carboniferous-Permian coal measure gases in the Northern Ordos Basin, China. Arab. J. Geosci. 2018, 11, 13. [Google Scholar] [CrossRef]
- Jiao, P.F.; Wang, P.W.; Zhou, S.W.; Wang, H.C.; Chen, X.Y. Study on the Microscopic Pore Structures of Coal Measure Reservoirs in the Shanxi Formation, Eastern Ordos Basin. Front. Earth Sci. 2022, 10, 903588. [Google Scholar] [CrossRef]
- Jia, J.; Cao, L.; Sang, S.; Yi, T.; Zhou, X. A case study on the effective stimulation techniques practiced in the superposed gas reservoirs of coal-bearing series with multiple thin coal seams in Guizhou, China. J. Pet. Sci. Eng. 2016, 146, 489–504. [Google Scholar] [CrossRef]
- Towler, B.; Firouzi, M.; Underschultz, J.; Rifkin, W.; Garnett, A.; Schultz, H.; Esterle, J.; Tyson, S.; Witt, K. An overview of the coal seam gas developments in Queensland. J. Nat. Gas Sci. Eng. 2016, 31, 249–271. [Google Scholar] [CrossRef]
- Gao, H.; Li, H.A. Pore structure characterization, permeability evaluation and enhanced gas recovery techniques of tight gas sandstones. J. Nat. Gas Sci. Eng. 2016, 28, 536–547. [Google Scholar] [CrossRef]
- Qin, Y. Research progress of symbiotic accumulation of coal measure gas in China. Nat. Gas Ind. B 2018, 5, 466–474. [Google Scholar] [CrossRef]
- Mehmani, A.; Mehmani, Y.; Prodanovi, M.; Balhoff, M. A forward analysis on the applicability of tracer breakthrough profiles in revealing the pore structure of tight gas sandstone and carbonate rocks. Water Resour. Res. 2015, 51, 4751–4767. [Google Scholar] [CrossRef]
- Liu, M.; Xie, R.; Guo, J.; Jin, G. Characterization of Pore Structures of Tight Sandstone Reservoirs by Multifractal Analysis of the NMR T 2 Distribution. Energy Fuels 2018, 32, 12218–12230. [Google Scholar] [CrossRef]
- Yao, Y.B.; Liu, D.M.; Che, Y.; Tang, D.Z.; Tang, S.H.; Huang, W.H. Petrophysical characterization of coals by low-field nuclear magnetic resonance (NMR). Fuel 2010, 89, 1371–1380. [Google Scholar] [CrossRef]
- Hou, X.; Zhu, Y.; Wang, Y.; Liu, Y. Experimental study of the interplay between pore system and permeability using pore compressibility for high rank coal reservoirs. Fuel 2019, 254, 115712. [Google Scholar] [CrossRef]
- Kong, X.; Xiao, D.; Jiang, S.; Lu, S.; Sun, B.; Wang, J. Application of the combination of high-pressure mercury injection and nuclear magnetic resonance to the classification and evaluation of tight sandstone reservoirs: A case study of the Linxing Block in the Ordos Basin. Nat. Gas Ind. B 2020, 7, 433–442. [Google Scholar] [CrossRef]
- Yao, Y.; Liu, D. Comparison of low-field NMR and mercury intrusion porosimetry in characterizing pore size distributions of coals. Fuel 2012, 95, 152–158. [Google Scholar] [CrossRef]
- Xiao, D.; Lu, Z.; Jiang, S.; Lu, S. Comparison and integration of experimental methods to characterize the full-range pore features of tight gas sandstone-A case study in Songliao Basin of China. J. Nat. Gas Sci. Eng. 2016, 34, 1412–1421. [Google Scholar] [CrossRef]
- Hinai, A.A.; Rezaee, R.; Esteban, L.; Labani, M. Comparisons of pore size distribution: A case from the Western Australian gas shale formations. J. Unconv. Oil Gas Resour. 2014, 8, 1–13. [Google Scholar] [CrossRef]
- Li, M.; Wang, D.; Shao, Z. Experimental study on changes of pore structure and mechanical properties of sandstone after high-temperature treatment using nuclear magnetic resonance. Eng. Geol. 2020, 275, 105739. [Google Scholar] [CrossRef]
- Yao, Y.; Liu, D.; Liu, J.; Xie, S. Assessing the Water Migration and Permeability of Large Intact Bituminous and Anthracite Coals Using NMR Relaxation Spectrometry. Transp. Porous Media 2015, 107, 527–542. [Google Scholar] [CrossRef]
- Cai, Y.; Liu, D.; Pan, Z.; Yao, Y.; Li, J.; Qiu, Y. Petrophysical characterization of Chinese coal cores with heat treatment by nuclear magnetic resonance. Fuel 2013, 108, 292–302. [Google Scholar] [CrossRef]
- Kleinberg, R.L.; Straley, C.; Kenyon, W.E.; Akkurt, R.; Farooqui, S.A. Nuclear Magnetic Resonance of Rocks: T1 vs. T2. In Proceedings of the SPE Annual Technical Conference and Exhibition, Houston, TX, USA, 3 October 1993. [Google Scholar]
- Qu, Y.; Sun, W.; Tao, R.; Luo, B.; Chen, L.; Ren, D. Pore–throat structure and fractal characteristics of tight sandstones in Yanchang Formation, Ordos Basin. Mar. Pet. Geol. 2020, 120, 104573. [Google Scholar] [CrossRef]
- Huang, W.; Lu, S.; Hersi, O.S.; Wang, M.; Deng, S.; Lu, R. Reservoir spaces in tight sandstones: Classification, fractal characters, and heterogeneity. J. Nat. Gas Sci. Eng. 2017, 46, 80–92. [Google Scholar] [CrossRef]
- Zhang, N.; He, M.C.; Zhang, B.; Qiao, F.C.; Sheng, H.L.; Hu, Q.H. Pore structure characteristics and permeability of deep sedimentary rocks determined by mercury intrusion porosimetry. J. Earth Sci. 2016, 27, 670–676. [Google Scholar] [CrossRef]
- Moosavi, S.A.; Goshtasbi, K.; Kazemzadeh, E.; Bakhtiari, H.A.; Esfahani, M.R.; Vali, J. Relationship between porosity and permeability with stress using pore volume compressibility characteristic of reservoir rocks. Arab. J. Geosci. 2014, 7, 231–239. [Google Scholar] [CrossRef]
- Shao, X.H.; Pang, X.Q.; Jiang, F.J.; Li, L.L.; Huyan, Y.Y.; Zhene, D.Y. Reservoir Characterization of Tight Sandstones Using Nuclear Magnetic Resonance and Incremental Pressure Mercury Injection Experiments: Implication for Tight Sand Gas Reservoir Quality. Energy Fuels 2017, 31, 10420–10431. [Google Scholar] [CrossRef]
- Li, Y.; Tang, D.Z.; Xu, H.; Meng, Y.J.; Li, J.Q. Experimental research on coal permeability: The roles of effective stress and gas slippage. J. Nat. Gas Sci. Eng. 2014, 21, 481–488. [Google Scholar] [CrossRef]
- Ma, Q.; Harpalani, S.; Liu, S. A simplified permeability model for coalbed methane reservoirs based on matchstick strain and constant volume theory. Int. J. Coal Geol. 2011, 85, 43–48. [Google Scholar] [CrossRef]
- Wu, S.; Tang, D.Z.; Li, S.; Wu, H.Y.; Hu, X.; Zhu, X.G. Effects of geological pressure and temperature on permeability behaviors of middle-low volatile bituminous coals in eastern Ordos Basin, China. J. Pet. Sci. Eng. 2017, 153, 372–384. [Google Scholar] [CrossRef]
- Khormali, A.; Bahlakeh, G.; Struchkov, I.; Kazemzadeh, Y. Increasing inhibition performance of simultaneous precipitation of calcium and strontium sulfate scales using a new inhibitor—Laboratory and field application. J. Pet. Sci. Eng. 2021, 202, 108589. [Google Scholar] [CrossRef]
- Li, X.; Fu, X.H.; Ranjith, P.G.; Xu, J. Stress sensitivity of medium- and high volatile bituminous coal: An experimental study based on nuclear magnetic resonance and permeability-porosity tests. J. Pet. Sci. Eng. 2019, 172, 889–910. [Google Scholar] [CrossRef]
- Tao, S.; Wang, Y.; Tang, D.; Xu, H.; Lv, Y.; He, W.; Li, Y. Dynamic variation effects of coal permeability during the coalbed methane development process in the Qinshui Basin, China. Int. J. Coal Geol. 2012, 93, 16–22. [Google Scholar] [CrossRef]
- Li, S.; Tang, D.Z.; Pan, Z.J.; Xu, H.; Huang, W.Q. Characterization of the stress sensitivity of pores for different rank coals by nuclear magnetic resonance. Fuel 2013, 111, 746–754. [Google Scholar] [CrossRef]
- Shen, J.; Qin, Y.; Li, Y.P.; Yang, Y.H.; Ju, W.; Yang, C.L.; Wang, G. In situ stress field in the FZ Block of Qinshui Basin, China: Implications for the permeability and coalbed methane production. J. Pet. Sci. Eng. 2018, 170, 744–754. [Google Scholar] [CrossRef]
- Meng, Y.F.; Luo, C.B.; Li, G.; Liu, H.B. An experimental study on stress sensitivity of tight sandstone gas reservoirs during nitrogen drilling. Arab. J. Geosci. 2019, 12, 11. [Google Scholar] [CrossRef]
- Zhang, H.; Zhong, Y.; Kuru, E.G.; Kuang, J.C.; Sh, J.P. Impacts of permeability stress sensitivity and aqueous phase trapping on the tight sandstone gas well productivity—A case study of the Daniudi gas field. J. Pet. Sci. Eng. 2019, 177, 261–269. [Google Scholar] [CrossRef]
- Zhang, K.; Sang, S.X.; Liu, C.J.; Ma, M.Y.; Zhou, X.Z. Experimental study the influences of geochemical reaction on coal structure during the CO2 geological storage in deep coal seam. J. Pet. Sci. Eng. 2019, 178, 1006–1017. [Google Scholar] [CrossRef]
- Li, S.J.; Wang, Z.H.; Sun, Y.X.; Xie, J.B. Stress Sensitivity of Low-permeability Sandstone Reservoir. In Materials Processing and Manufacturing III, Pts 1–4; Advanced Materials Research; Sang, X., Kim, Y.H., Eds.; Trans Tech Publications Ltd.: Durnten-Zurich, Switzerland, 2013; Volume 753–755, pp. 686–689. [Google Scholar]
- Archer, R. Impact of Stress Sensitive Permeability on Production Data Analysis. In Proceedings of the SPE Unconventional Reservoirs Conference, Keystone, CO, USA, 10–12 February 2008. [Google Scholar] [CrossRef]
- Fatt, I.; Davis, D.H. Reduction in Permeability with Overburden Pressure. J. Pet. Technol. 1952, 4, 16. [Google Scholar] [CrossRef]
- Liu, J.-Q.; Zhang, C.-M.; Zhang, Z. Combine the capillary pressure curve data with the porosity to improve the prediction precision of permeability of sandstone reservoir. J. Pet. Sci. Eng. 2016, 139, 43–48. [Google Scholar] [CrossRef]
- Davies, J.P.; Davies, D.K. Stress-Dependent Permeability: Characterization and Modeling. Spe J. 2001, 6, 224–235. [Google Scholar] [CrossRef]
- Volokitin, Y.; Looyestijn, W.J.; Sli, J.; Kerman, W.; Hofman, J.P. A practical approach to obtain primary drainage capillary pressure curves from NMR core and log data. Petrophysics 2001, 42, 334–343. [Google Scholar]
- Ghomeshi, S.; Kryuchkov, S.; Kantzas, A. An investigation into the effects of pore cconnectivity on T2 NMR relaxation. J. Magn. Reson. 2018, 289, 79–91. [Google Scholar] [CrossRef] [PubMed]
- Zhang, Z.; Qin, Y.; Zhuang, X.; Li, G.; Wang, X. Poroperm characteristics of high-rank coals from Southern Qinshui Basin by mercury intrusion, SEM-EDS, nuclear magnetic resonance and relative permeability analysis. J. Nat. Gas Sci. Eng. 2018, 51, 116–128. [Google Scholar] [CrossRef]
- Straley, C.; Rossini, D.; Vinegar, H.J.; Tutunjian, P.N.; Morriss, C.E. Core analysis by low-field NMR. Log. Anal. 1997, 38, 84–93. [Google Scholar]
- Al-Mahrooqi, S.H.; Grattoni, C.A.; Moss, A.K.; Jing, X.D. An investigation of the effect of wettability on NMR characteristics of sandstone rock and fluid systems. J. Pet. Sci. Eng. 2003, 39, 389–398. [Google Scholar] [CrossRef]
- Lai, J.; Wang, G.; Cao, J.; Xiao, C.; Wang, S.; Pang, X.; Dai, Q.; He, Z.; Fan, X.; Yang, L.; et al. Investigation of pore structure and petrophysical property in tight sandstones. Mar. Pet. Geol. 2018, 91, 179–189. [Google Scholar] [CrossRef]
- Song, Z.Y.; Ji, H.G.; You, S.; Tan, J.; Wang, H. Experimental Study on Sensitivity to Temperature Stress of the Permeability of Weakly Cemented Sandstone. In Proceedings of the 3rd International Conference on Advances in Energy Resources and Environment Engineering, Harbin, China, 8–10 December 2017; IOP Conference Series-Earth and Environmental Science. IOP Publishing Ltd.: Bristol, UK, 2018; Volume 113. [Google Scholar]
- Mclatchie, A.S.; Hemstock, R.A.; Young, J.W. The Effective Compressibility of Reservoir Rock and Its Effects on Permeability. J. Pet. Technol. 1958, 10, 49–51. [Google Scholar] [CrossRef]
- Vairogs, J.; Hearn, C.L.; Dareing, D.W.; Rhoades, V.W. Effect of Rock Stress on Gas Production From Low-Permeability Reservoirs. J. Pet. Technol. 1971, 23, 1161–1167. [Google Scholar] [CrossRef]
- Yin, S.; Dong, L.; Yang, X.; Wang, R. Experimental investigation of the petrophysical properties, minerals, elements and pore structures in tight sandstones. J. Nat. Gas Sci. Eng. 2020, 76, 103189. [Google Scholar] [CrossRef]
- Li, Z.; Wu, S.; Xia, D.; He, S.; Zhang, X. An investigation into pore structure and petrophysical property in tight sandstones: A case of the Yanchang Formation in the southern Ordos Basin, China. Mar. Pet. Geol. 2018, 97, 390–406. [Google Scholar] [CrossRef]
- Zhao, H.; Ning, Z.; Zhao, T.; Zhang, R.; Wang, Q. Effects of mineralogy on petrophysical properties and permeability estimation of the Upper Triassic Yanchang tight oil sandstones in Ordos Basin, Northern China. Fuel 2016, 186, 328–338. [Google Scholar] [CrossRef]
- Zhong, D.; Zhou, L.; Sun, H. Influences of petrologic features on diagenesis and pore development: An example from the Triassic Yanchang Formation in Longdong Area, Ordos Basin. Oil Gas Geol. 2012, 33, 280–289. [Google Scholar]


| Sample No. | Clastic Constituents/% | Matrix/% | Grain Size/mm | Lithology | |||
|---|---|---|---|---|---|---|---|
| Quartz | Feldspar | Detritus | Mica | Clay | |||
| HJD1-01 | 56 | 12 | 13 | 3 | - | 0.30–0.50 | Medium sandstone |
| HJD1-06 | 32 | 28 | 13 | 2 | 23 | 0.05–0.10 | Fine sandstone |
| HJD1-08 | 55 | 18 | 11 | 1 | 10 | 0.06–0.12 | Fine sandstone |
| HJD1-10 | 15 | 11 | - | - | 72 | 0.03–0.06 | Siltstone |
| Sample Number | Test Gas | Confining Pressure/psi | Average Pore Pressure/psi | Permeability/×10−3 mD | Lithology | Sampling Depth/m |
|---|---|---|---|---|---|---|
| HJD1-01 | N2 | 1100 | 695 | 13.910 | Medium sandstone | 1201.60–1201.88 |
| N2 | 1200 | 700 | 13.410 | |||
| N2 | 1300 | 699 | 12.860 | |||
| N2 | 1400 | 704 | 12.110 | |||
| N2 | 1500 | 704 | 11.160 | |||
| HJD1-06 | N2 | 1100 | 687 | 1.188 | Fine sandstone | 1300.12–1300.54 |
| N2 | 1200 | 695 | 1.081 | |||
| N2 | 1300 | 697 | 0.891 | |||
| N2 | 1400 | 697 | 0.738 | |||
| N2 | 1500 | 703 | 0.689 | |||
| HJD1-08 | N2 | 1100 | 691 | 1.060 | Fine sandstone | 1301.88–1302.5 |
| N2 | 1200 | 700 | 0.932 | |||
| N2 | 1300 | 705 | 0.788 | |||
| N2 | 1400 | 705 | 0.656 | |||
| N2 | 1500 | 704 | 0.594 | |||
| HJD1-10 | N2 | 1100 | 693 | 0.643 | Siltstone | 1380.95–1381.82 |
| N2 | 1200 | 707 | 0.571 | |||
| N2 | 1300 | 682 | 0.489 | |||
| N2 | 1400 | 698 | 0.410 | |||
| N2 | 1500 | 699 | 0.351 |
| Sample | T2C | Total Porosity | Residual Water Porosity | Effective Porosity | Pore Proportion (%) | ||
|---|---|---|---|---|---|---|---|
| ID | (ms) | (%) | (%) | (%) | T2 < T2C | T2 > T2C | Effective Porosity/Total Porosity |
| HJD1-01 | 5.54 | 4.14 | 2.58 | 1.56 | 61.50 | 38.50 | 37.68 |
| HJD1-06 | 2.77 | 2.80 | 2.20 | 0.60 | 79.07 | 20.93 | 21.42 |
| HJD1-10 | 0.85 | 2.97 | 2.46 | 0.51 | 81.95 | 18.05 | 17.17 |
| Sample | Fitting Liner Equations | R2 |
|---|---|---|
| HJD1-01 | y = −6.95 × 10⁻⁶x + 16.86 × 10⁻³ | 0.9757 |
| HJD1-06 | y = −1.39 × 10⁻⁶x + 1.76 × 10⁻³ | 1 |
| HJD1-08 | y = −1.24 × 10⁻⁶x + 1.55 × 10⁻³ | 1 |
| HJD1-10 | y = −0.75 × 10⁻⁶x + 0.94 × 10⁻³ | 1 |
| Sample Number | Lithology | Effective Stress/psi | Permeability/×10−3 mD | SS |
|---|---|---|---|---|
| HJD1-01 | Medium sandstone | 405 | 13.91 | - |
| 500 | 13.41 | 0.1325 | ||
| 601 | 12.86 | 0.1506 | ||
| 696 | 12.11 | 0.1920 | ||
| 796 | 11.16 | 0.2412 | ||
| HJD1-06 | Fine sandstone | 413 | 1.188 | - |
| 505 | 1.081 | 0.3546 | ||
| 603 | 0.891 | 0.5563 | ||
| 703 | 0.738 | 0.6352 | ||
| 797 | 0.689 | 0.5816 | ||
| HJD1-08 | Fine sandstone | 409 | 1.06 | - |
| 500 | 0.932 | 0.4813 | ||
| 595 | 0.788 | 0.5781 | ||
| 695 | 0.656 | 0.6420 | ||
| 796 | 0.594 | 0.6071 | ||
| HJD1-10 | Siltstone | 407 | 0.643 | - |
| 493 | 0.571 | 0.4662 | ||
| 618 | 0.489 | 0.4808 | ||
| 702 | 0.41 | 0.5884 | ||
| 801 | 0.351 | 0.6215 |
Publisher’s Note: MDPI stays neutral with regard to jurisdictional claims in published maps and institutional affiliations. |
© 2022 by the authors. Licensee MDPI, Basel, Switzerland. This article is an open access article distributed under the terms and conditions of the Creative Commons Attribution (CC BY) license (https://creativecommons.org/licenses/by/4.0/).
Share and Cite
Huang, H.; Sun, Y.; Chang, X.; Wu, Z.; Li, M.; Qu, S. Experimental Investigation of Pore Characteristics and Permeability in Coal-Measure Sandstones in Jixi Basin, China. Energies 2022, 15, 5898. https://doi.org/10.3390/en15165898
Huang H, Sun Y, Chang X, Wu Z, Li M, Qu S. Experimental Investigation of Pore Characteristics and Permeability in Coal-Measure Sandstones in Jixi Basin, China. Energies. 2022; 15(16):5898. https://doi.org/10.3390/en15165898
Chicago/Turabian StyleHuang, Huazhou, Yuantao Sun, Xiantong Chang, Zhengqing Wu, Mi Li, and Shulei Qu. 2022. "Experimental Investigation of Pore Characteristics and Permeability in Coal-Measure Sandstones in Jixi Basin, China" Energies 15, no. 16: 5898. https://doi.org/10.3390/en15165898
APA StyleHuang, H., Sun, Y., Chang, X., Wu, Z., Li, M., & Qu, S. (2022). Experimental Investigation of Pore Characteristics and Permeability in Coal-Measure Sandstones in Jixi Basin, China. Energies, 15(16), 5898. https://doi.org/10.3390/en15165898