


Dynamic Characteristics of Transverse-Magnetic-Field Induced Arc for Plasma-Jet-Triggered Protective Gas Switch in Hybrid UHVDC System


Abstract
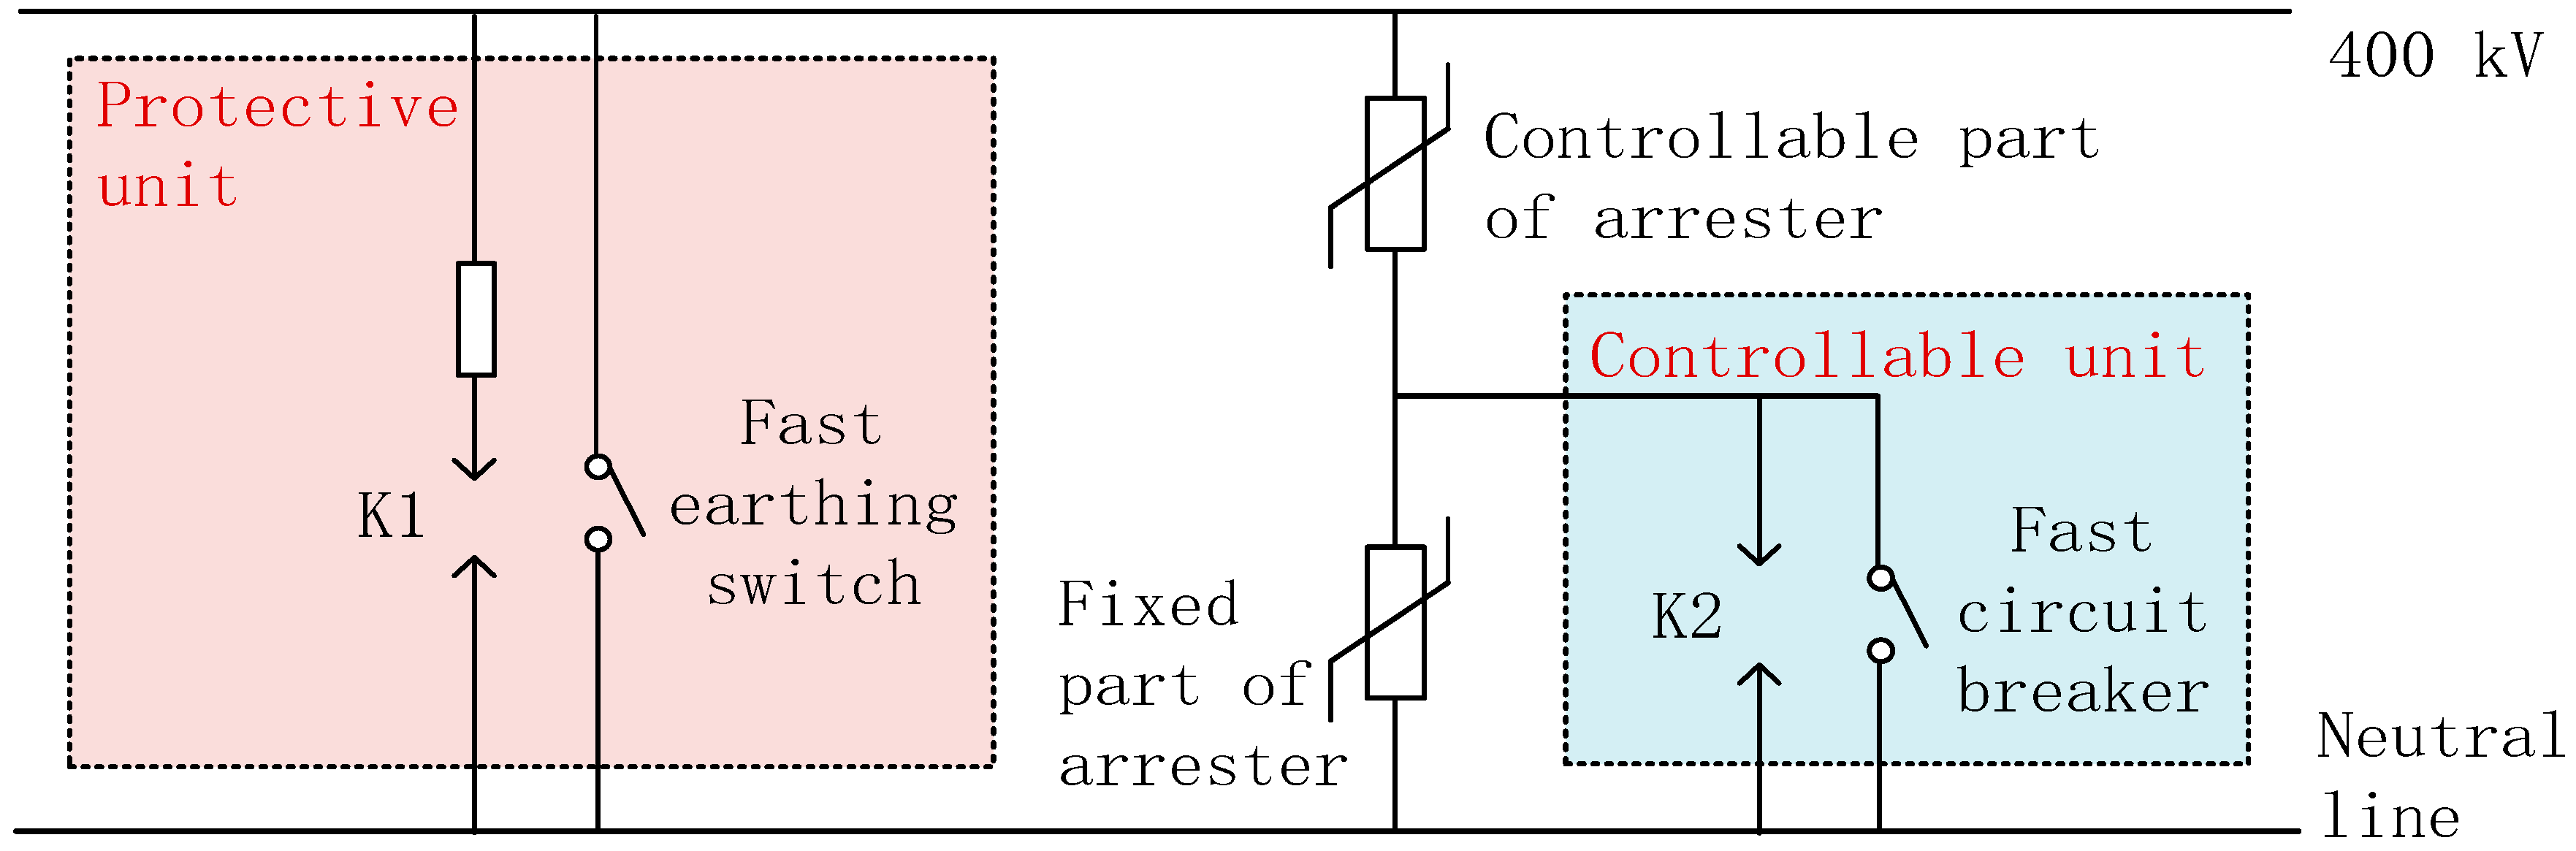
:1. Introduction
2. 3D Mathematical Arc Model Establishment and Experimental Setup
2.1. Establishment of the 3D MHD-Based Mathematical Arc Model
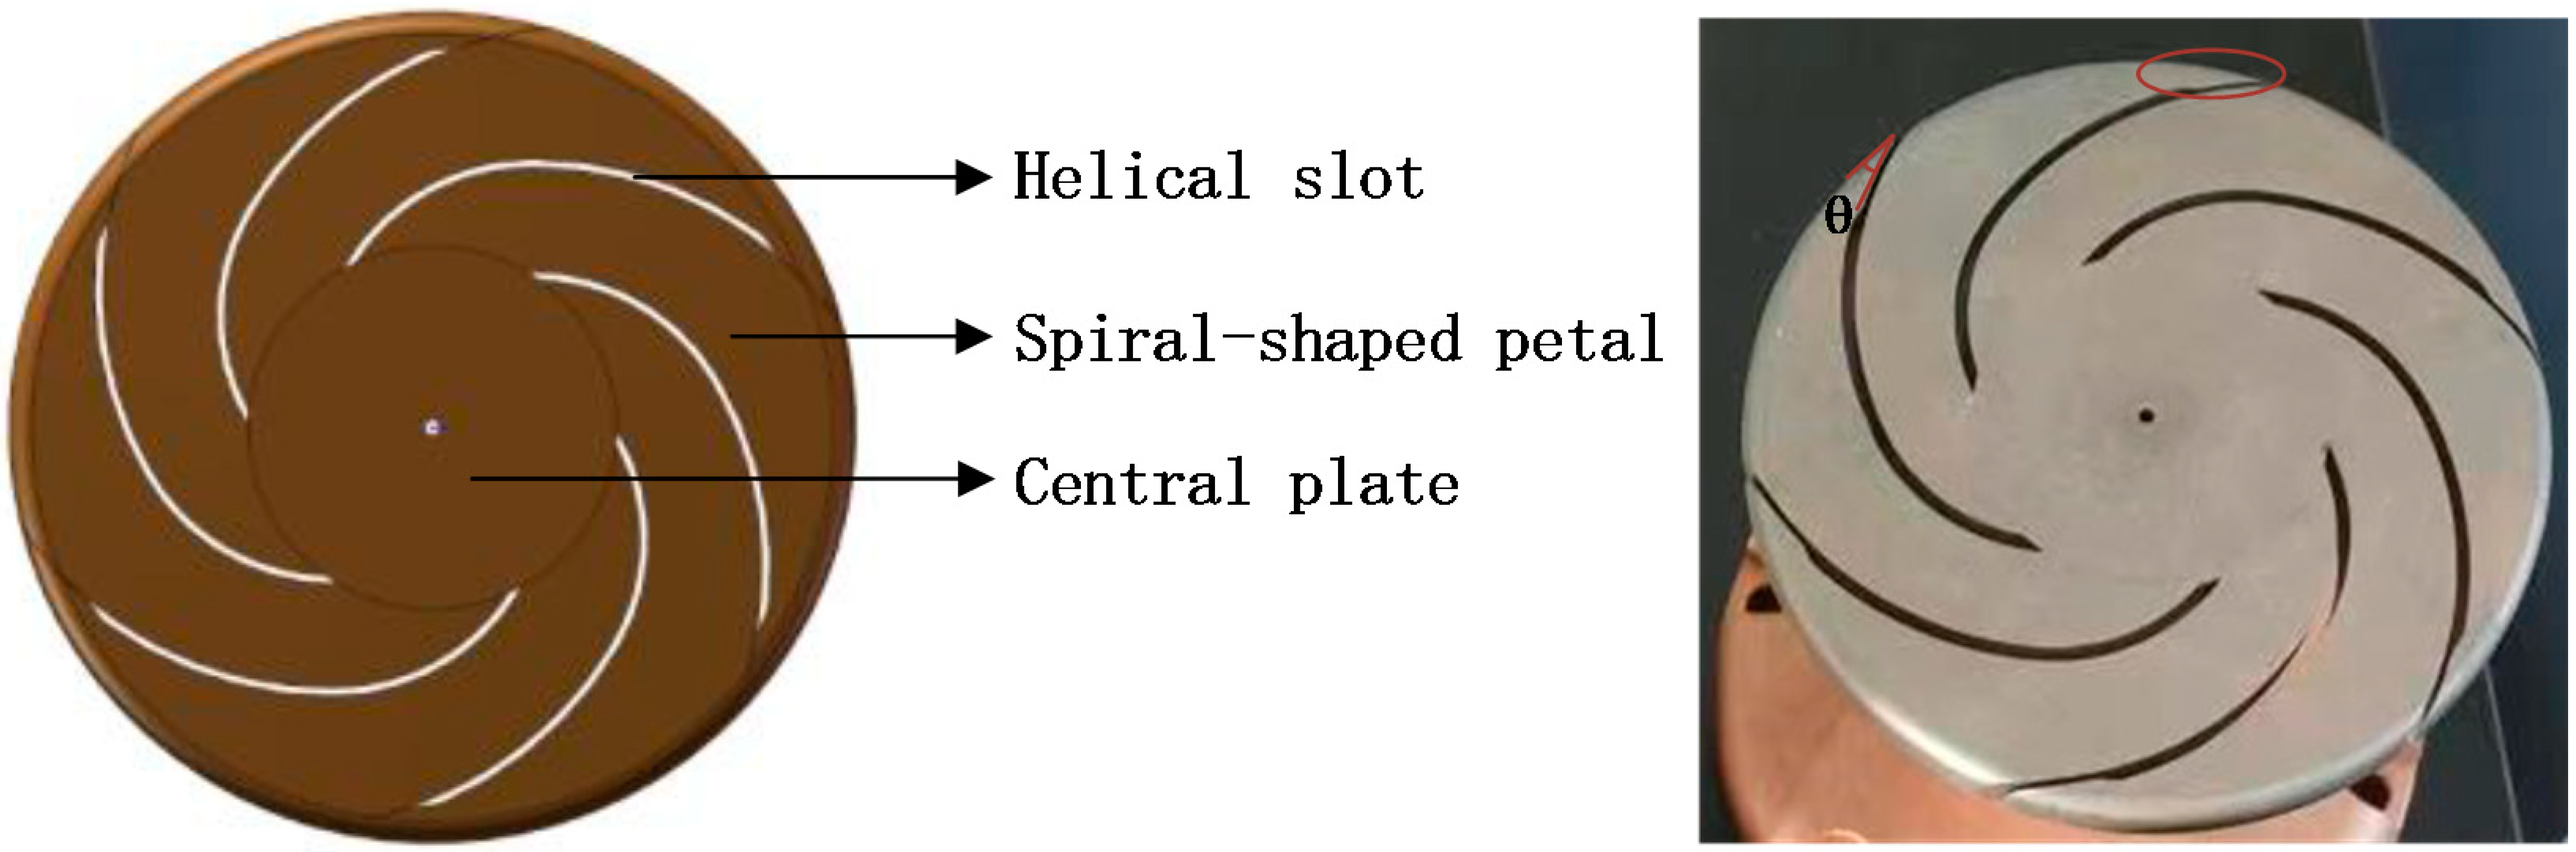
2.2. Structural Design of the PJT-GS and Electrode
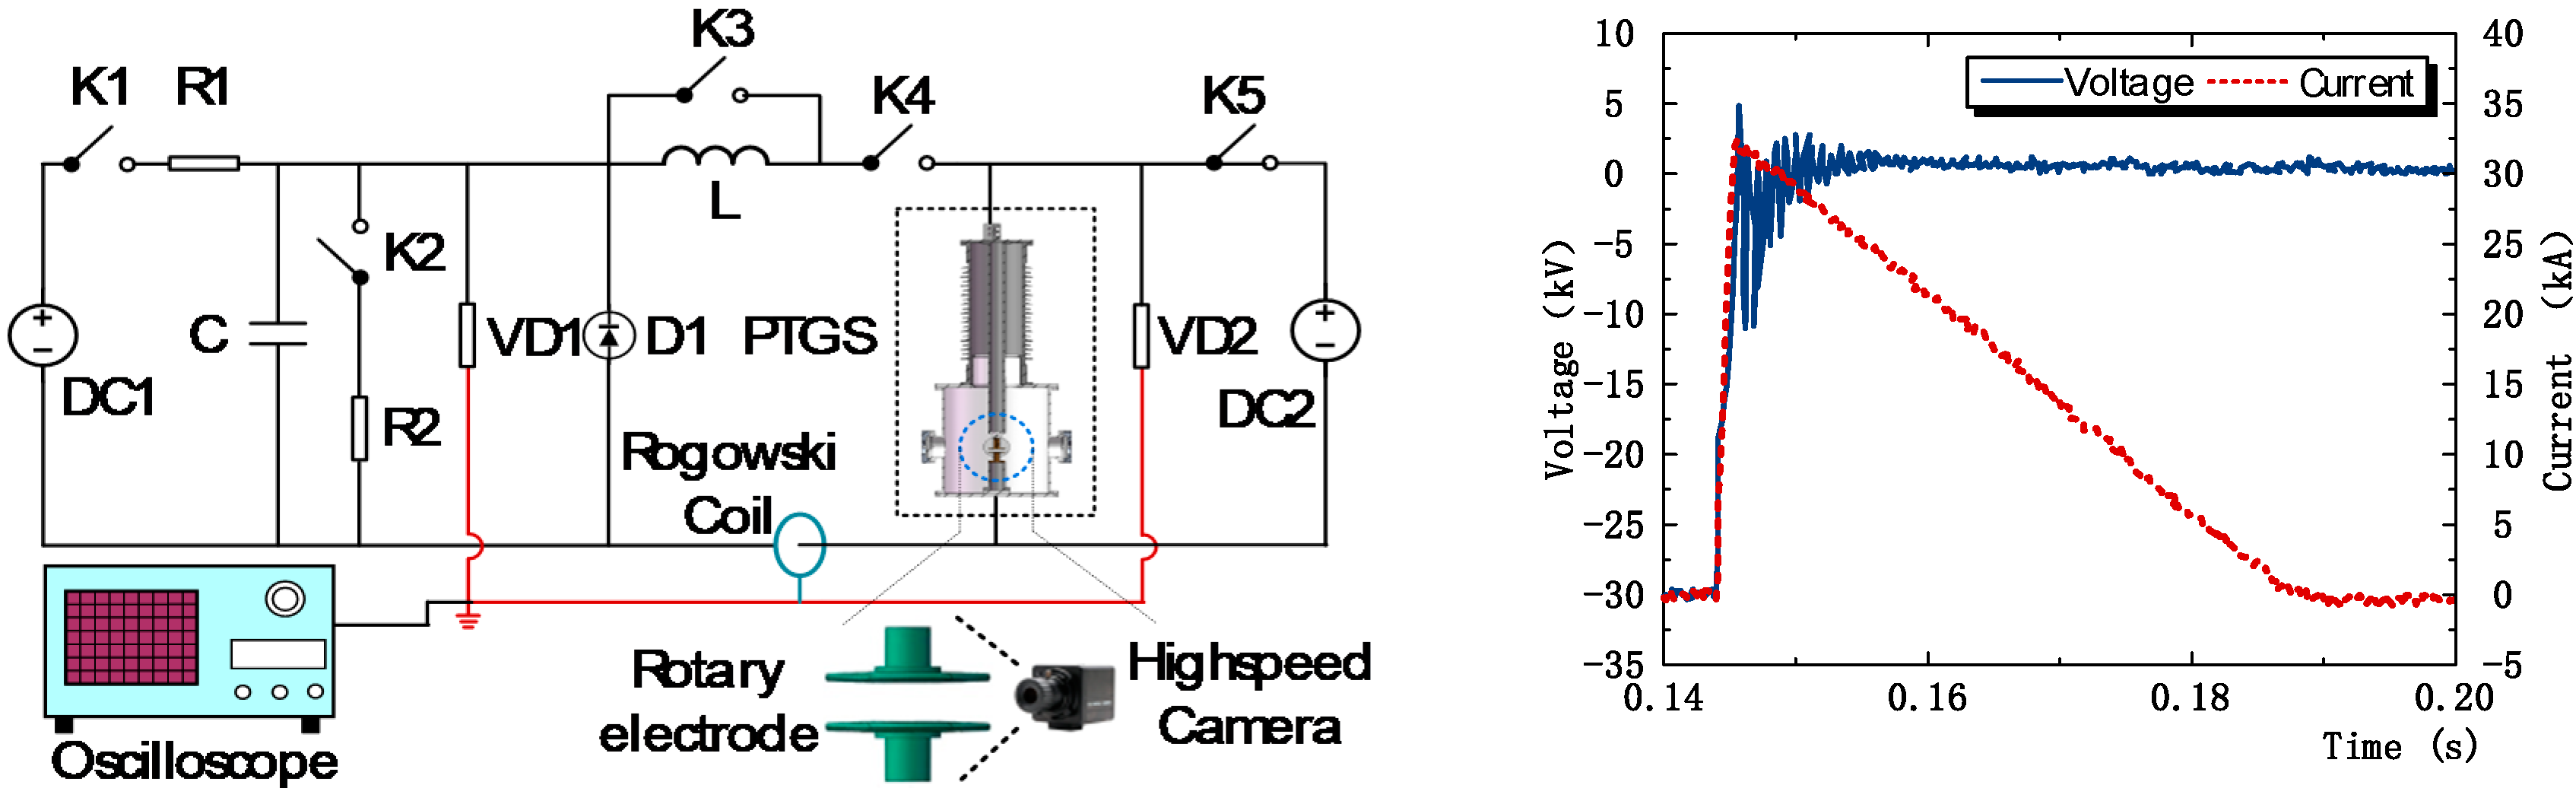
2.3. Experimental Setup and Results
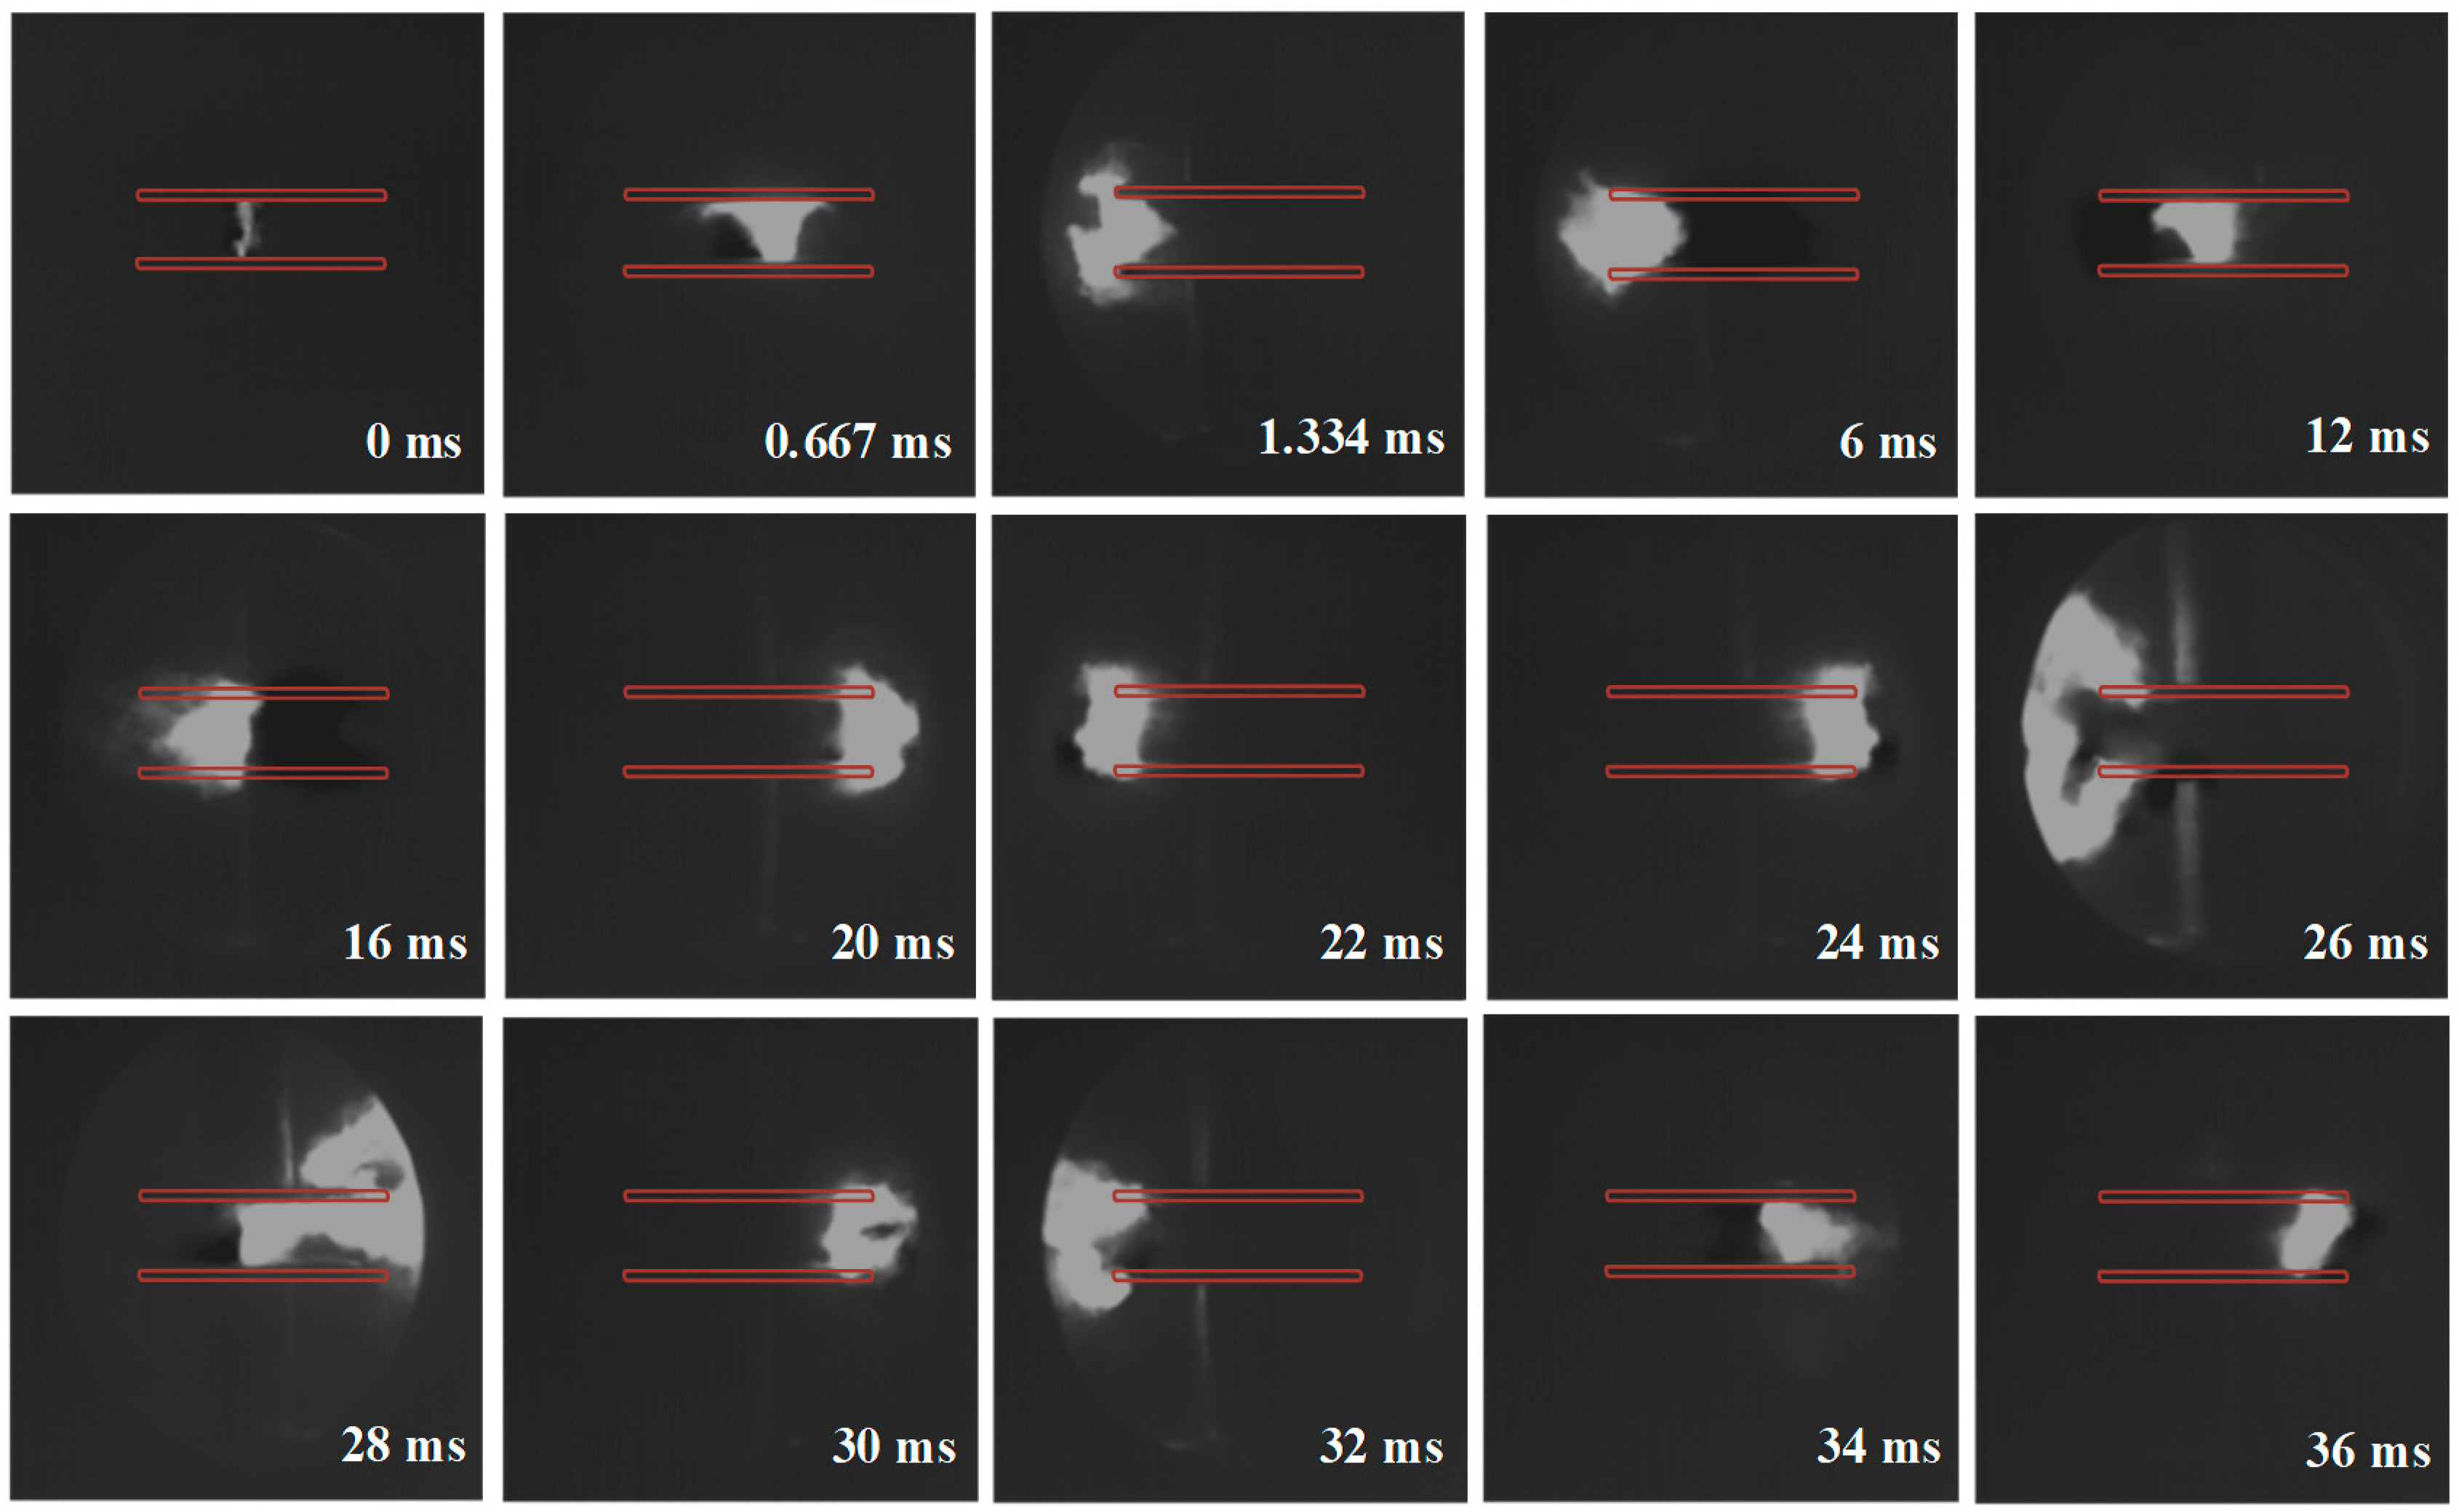
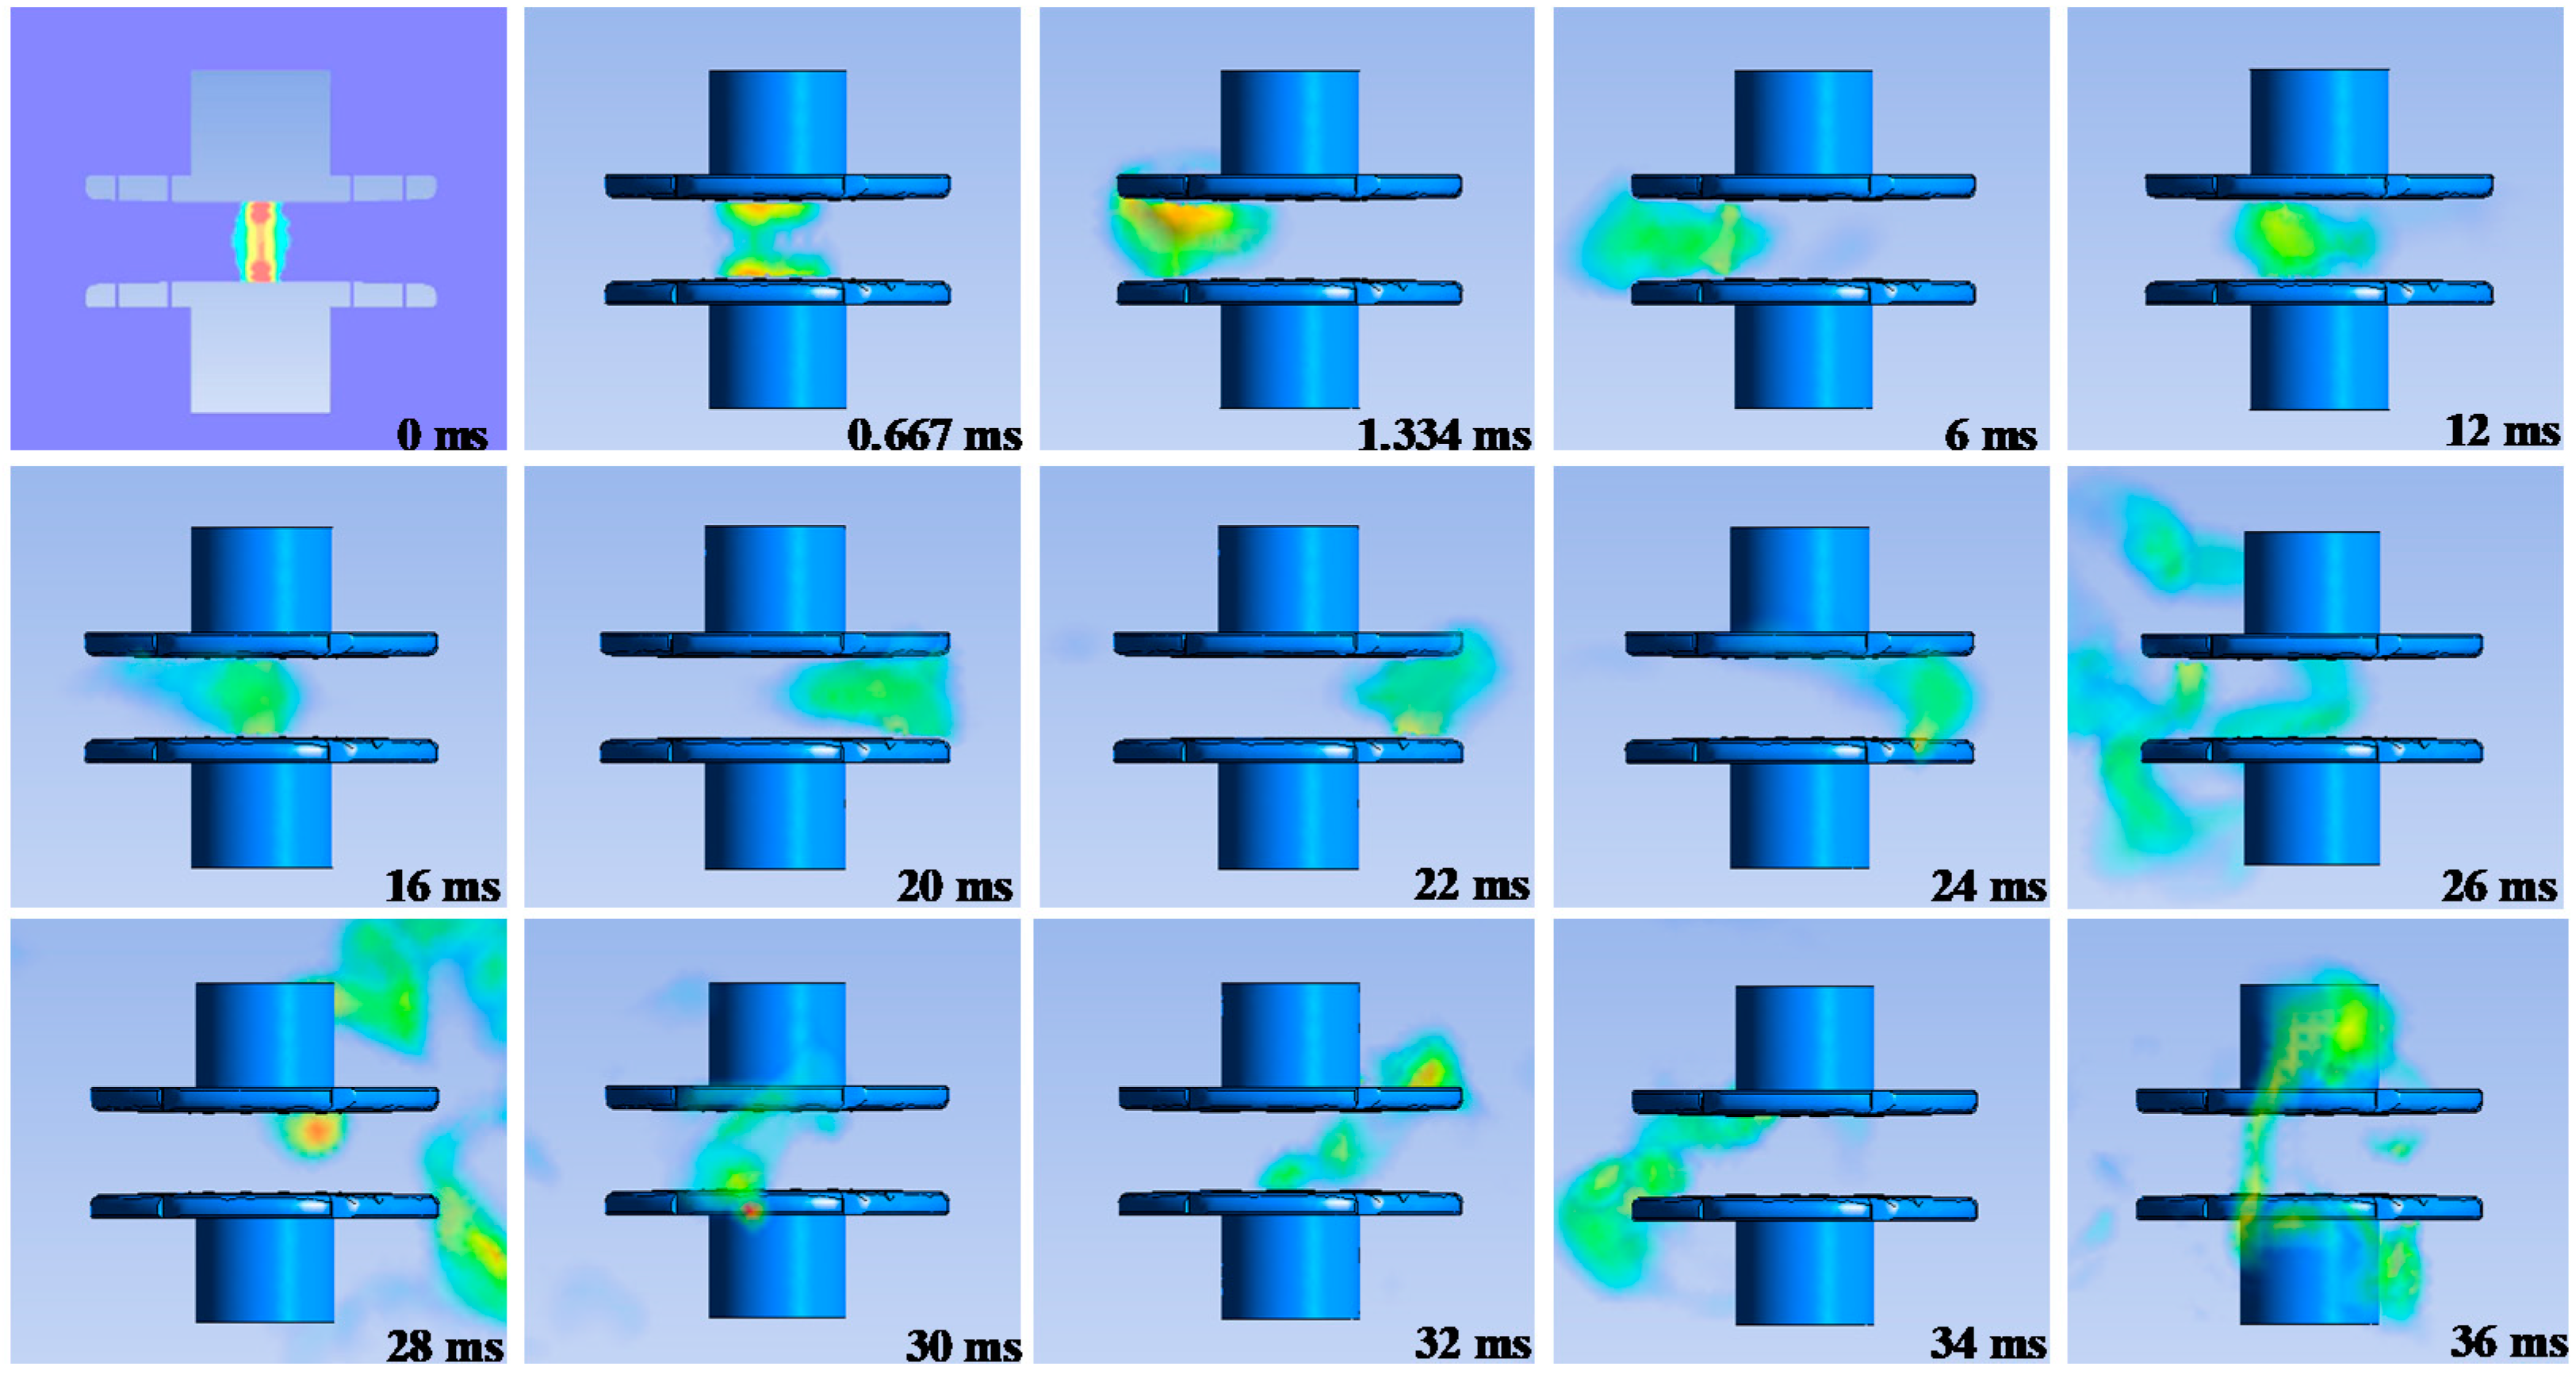
2.4. Comparison between Calculation and Experiment
3. Analysis of the Variation of the Arc Dynamic Characteristics
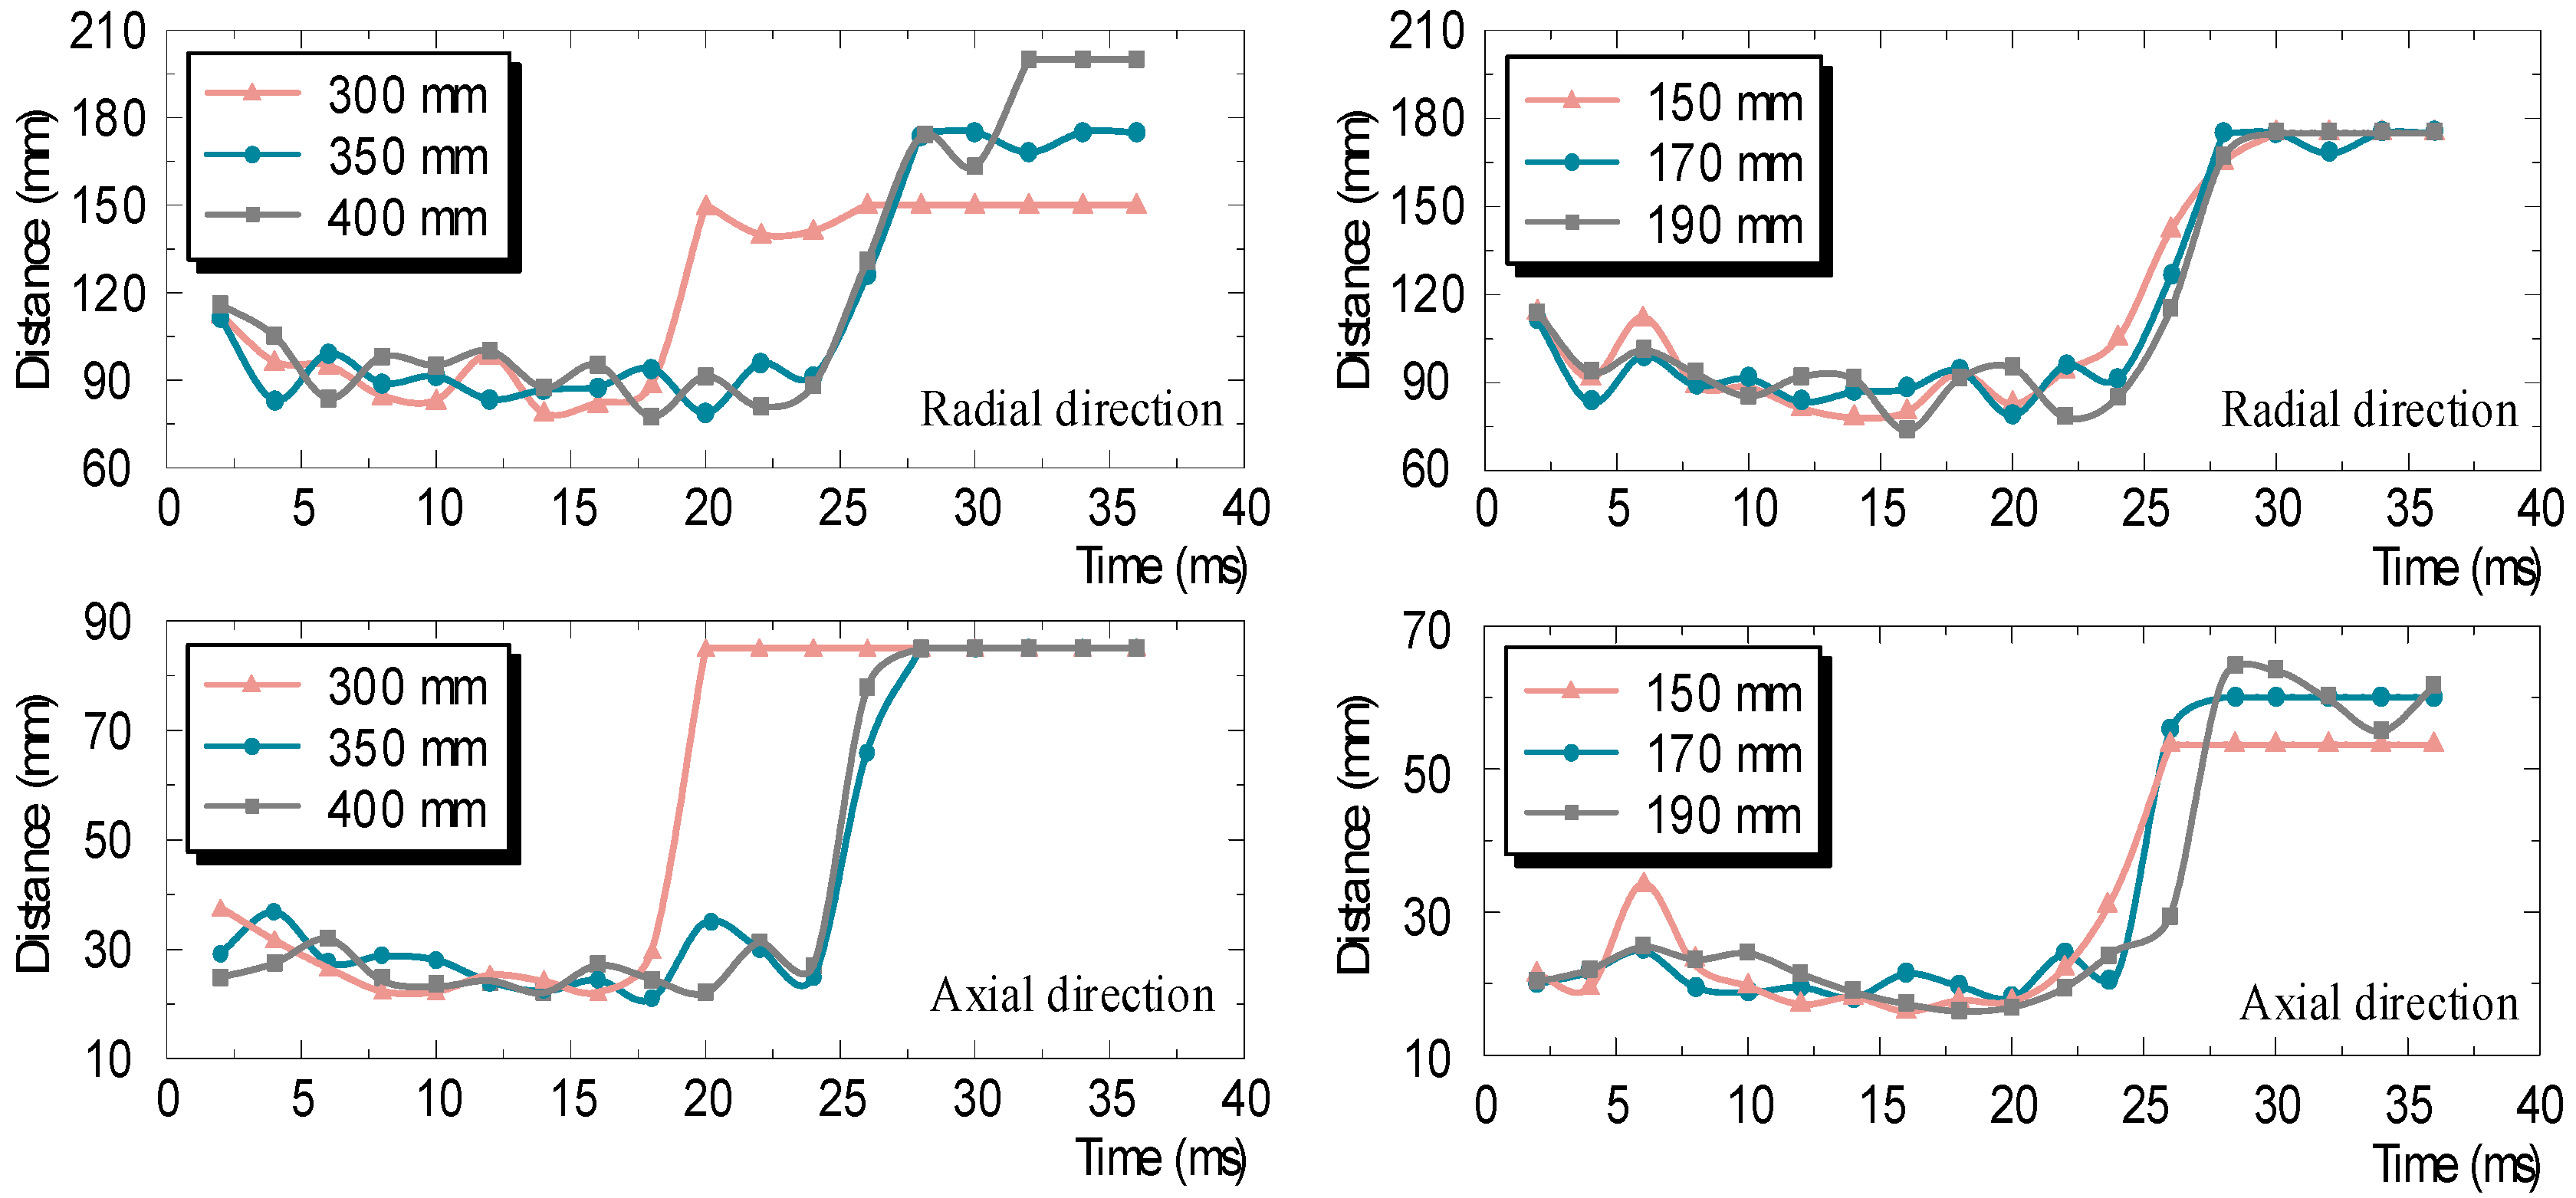
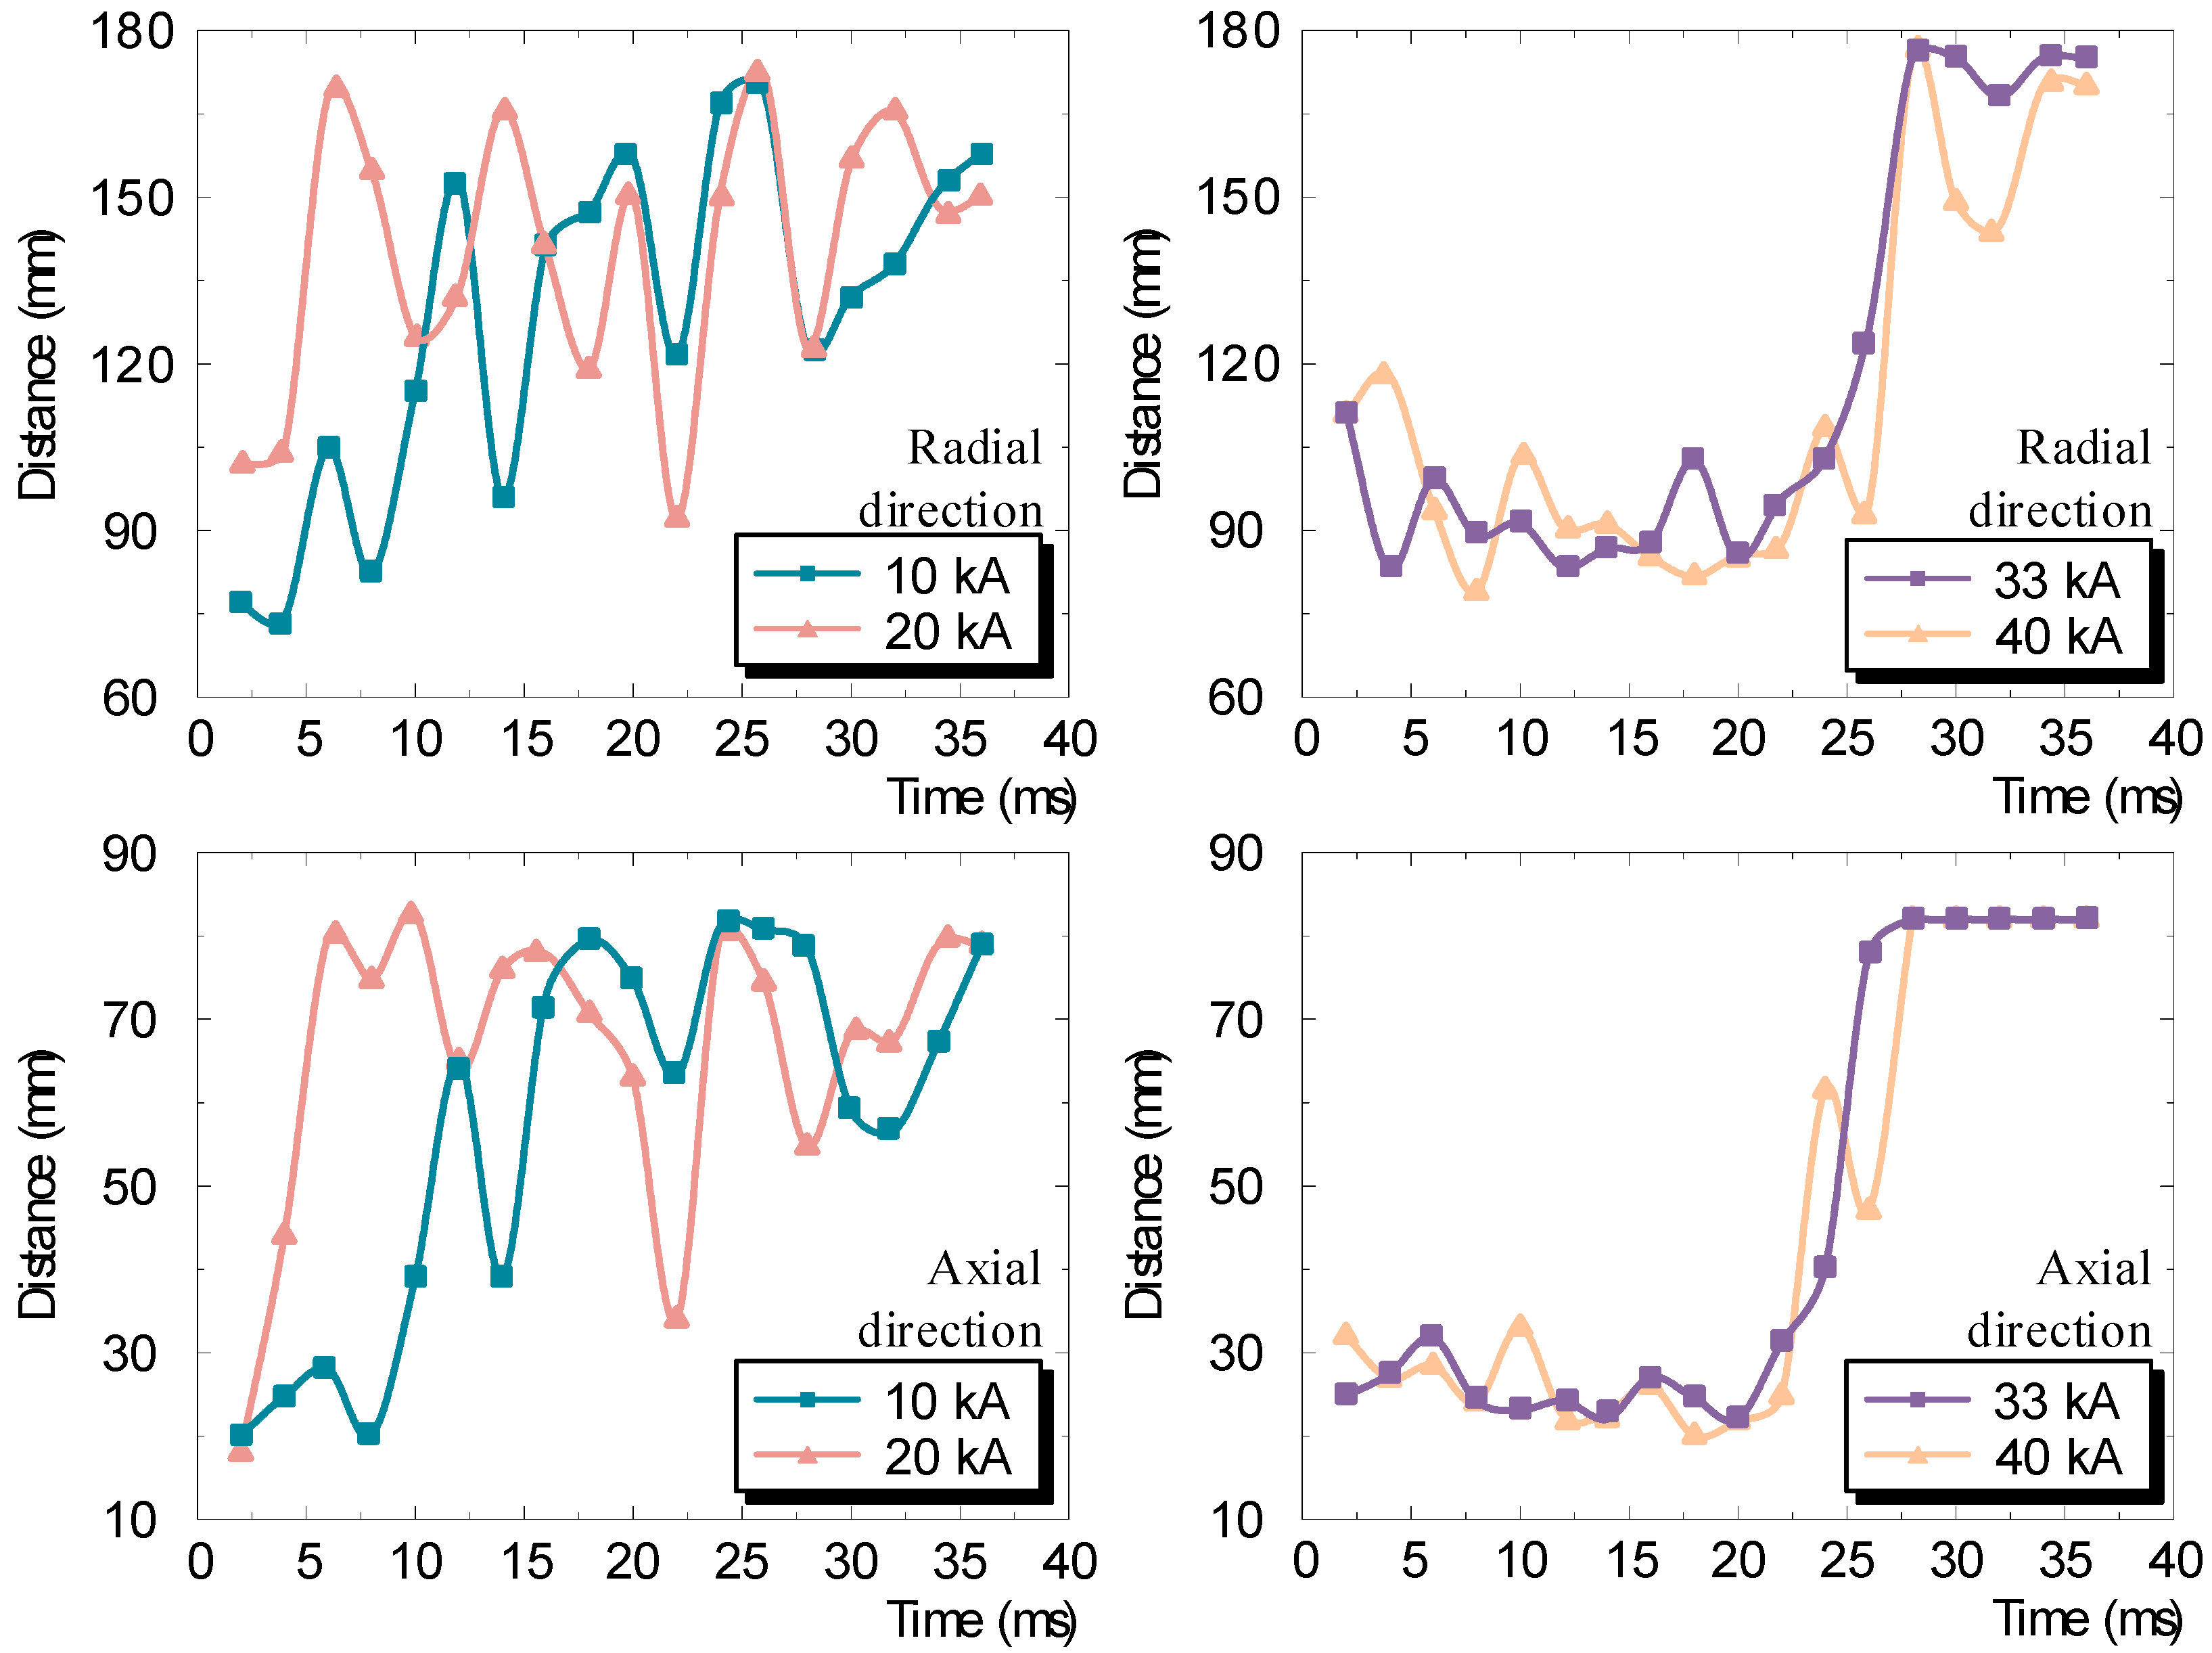
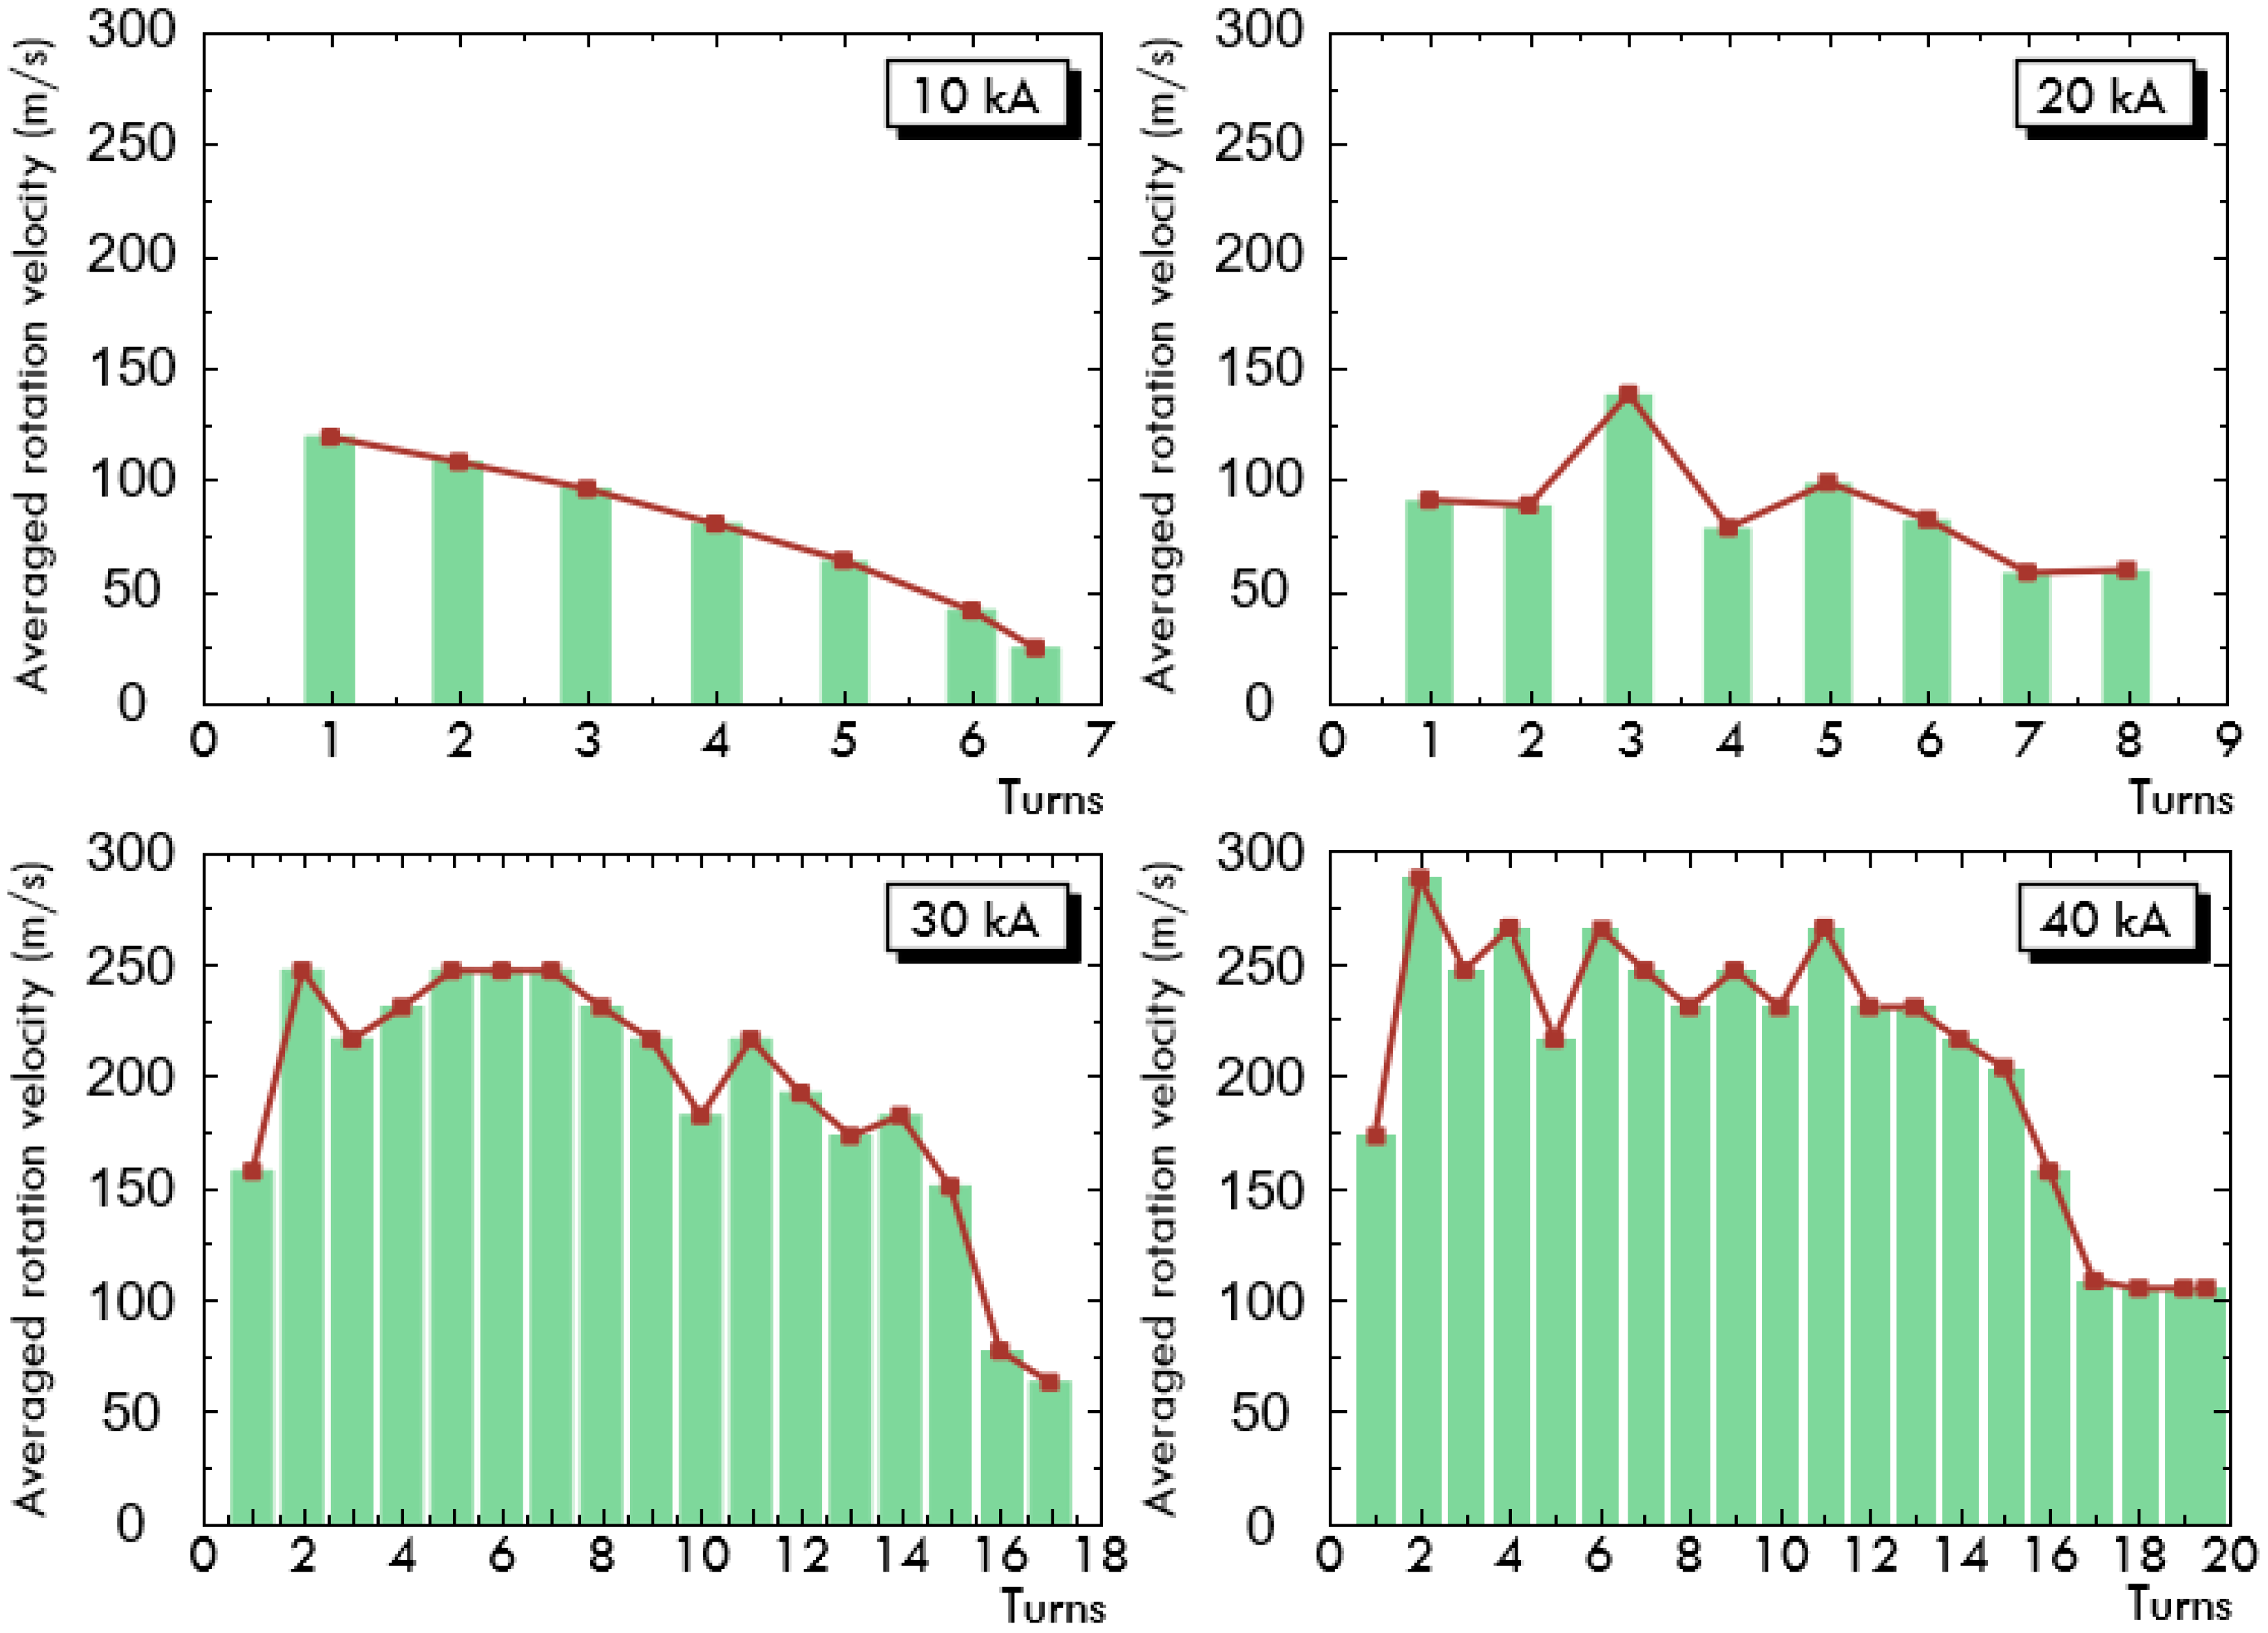
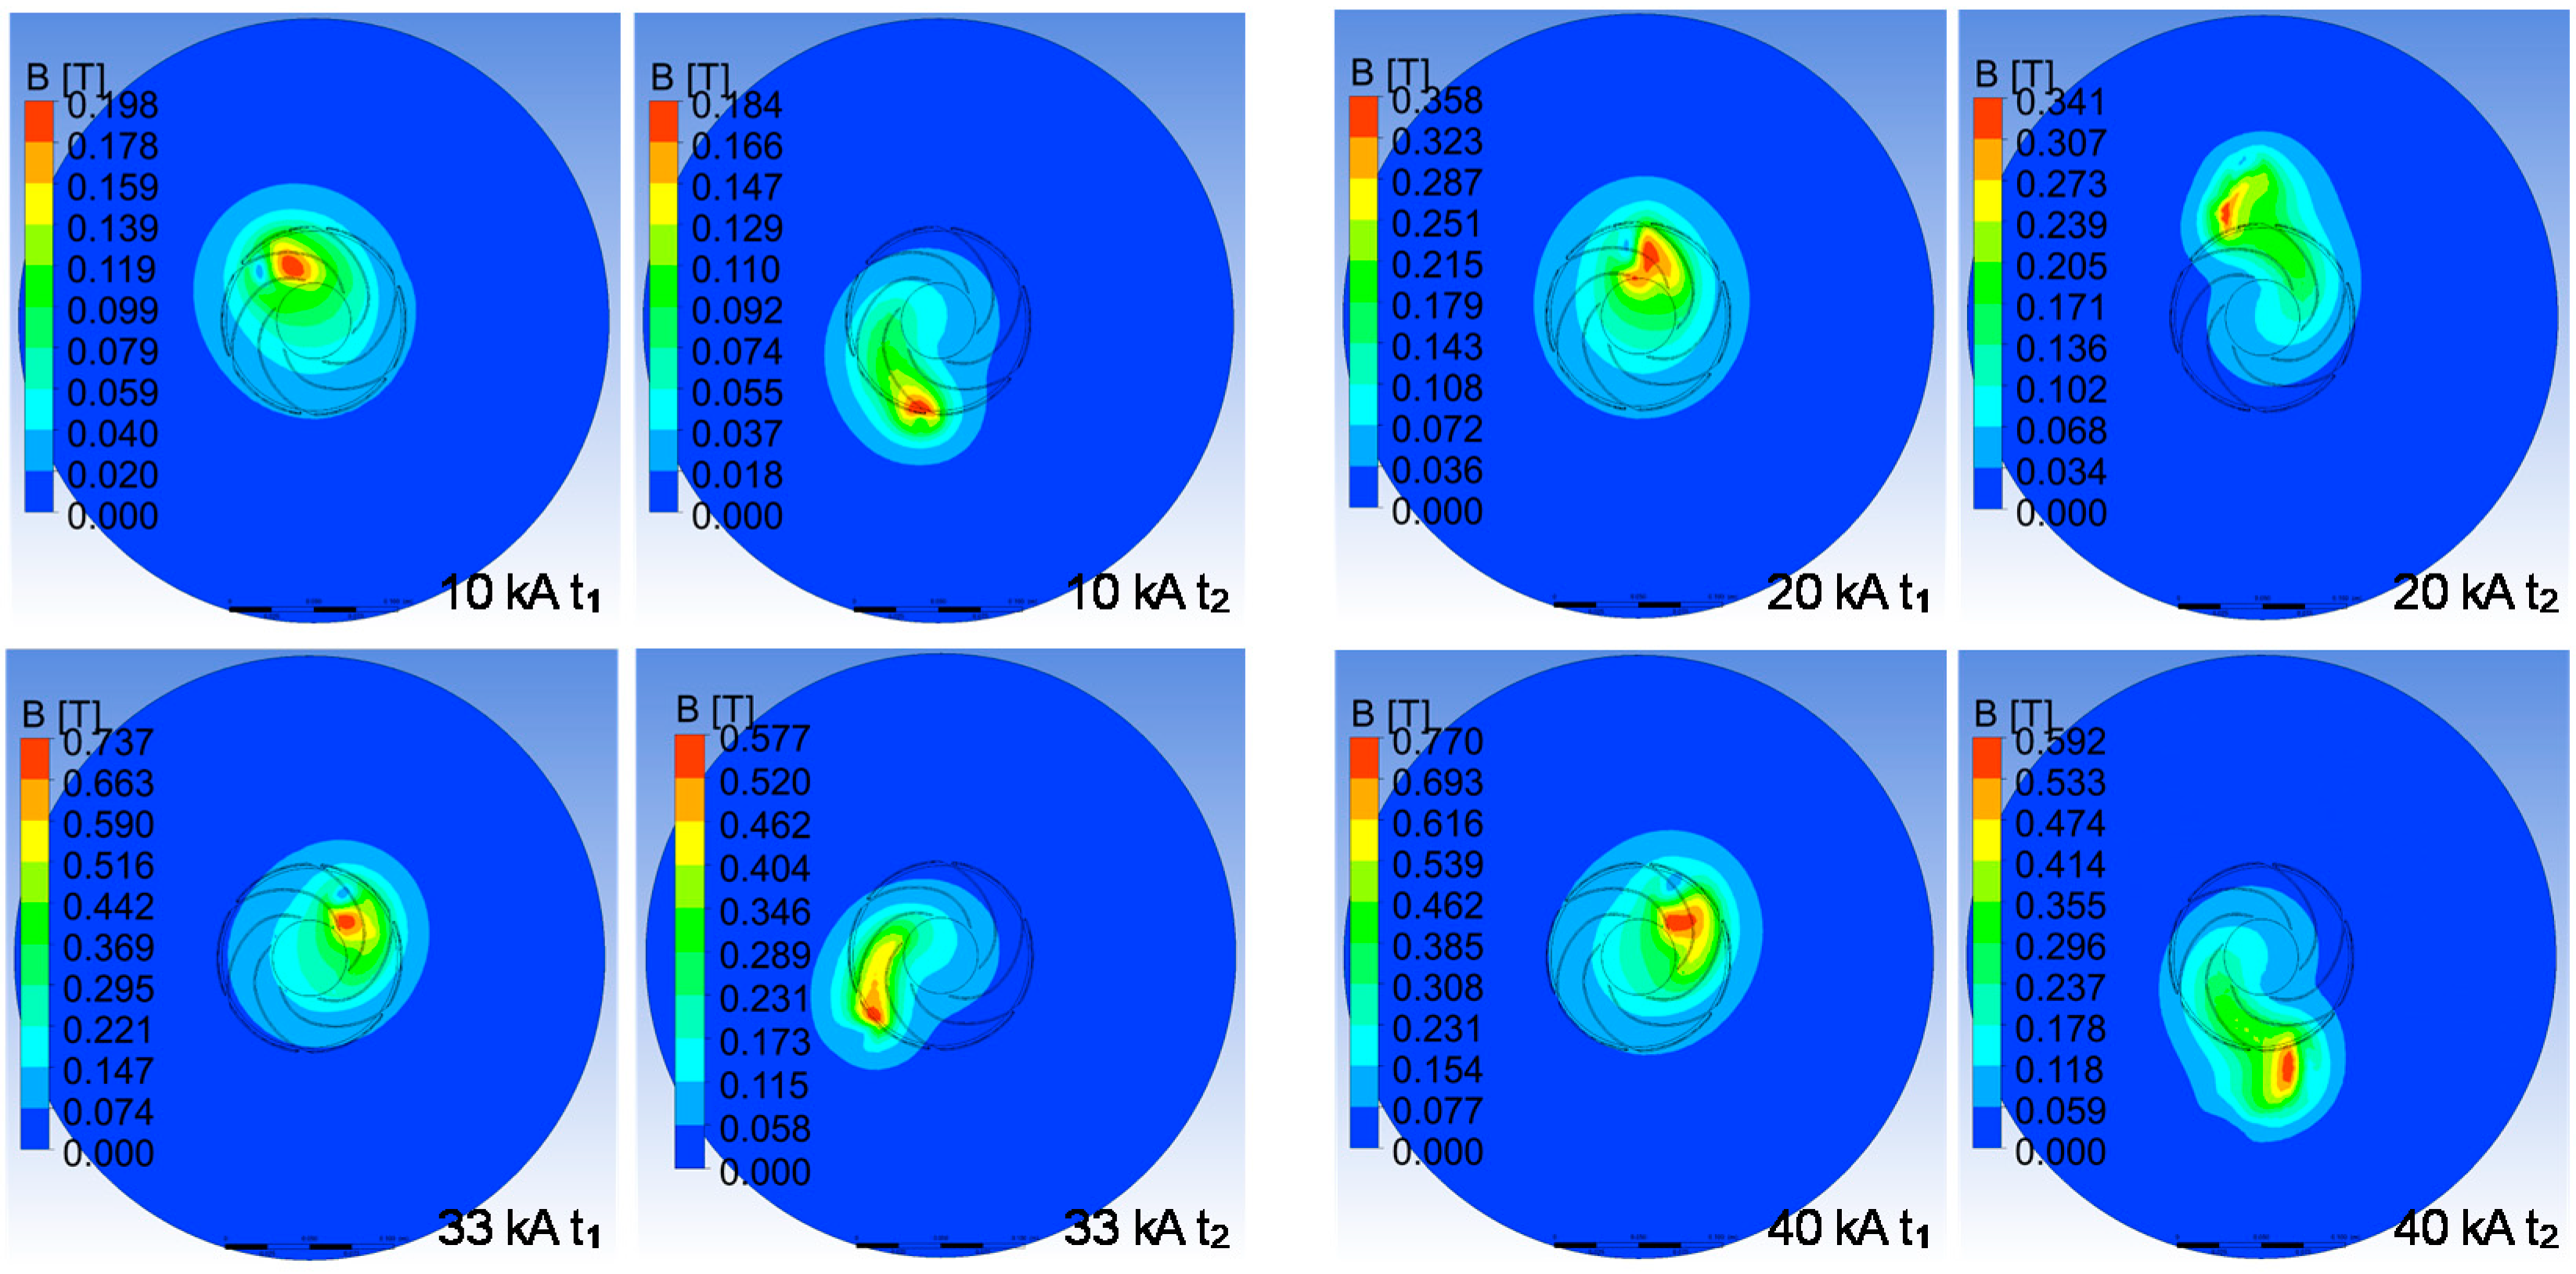
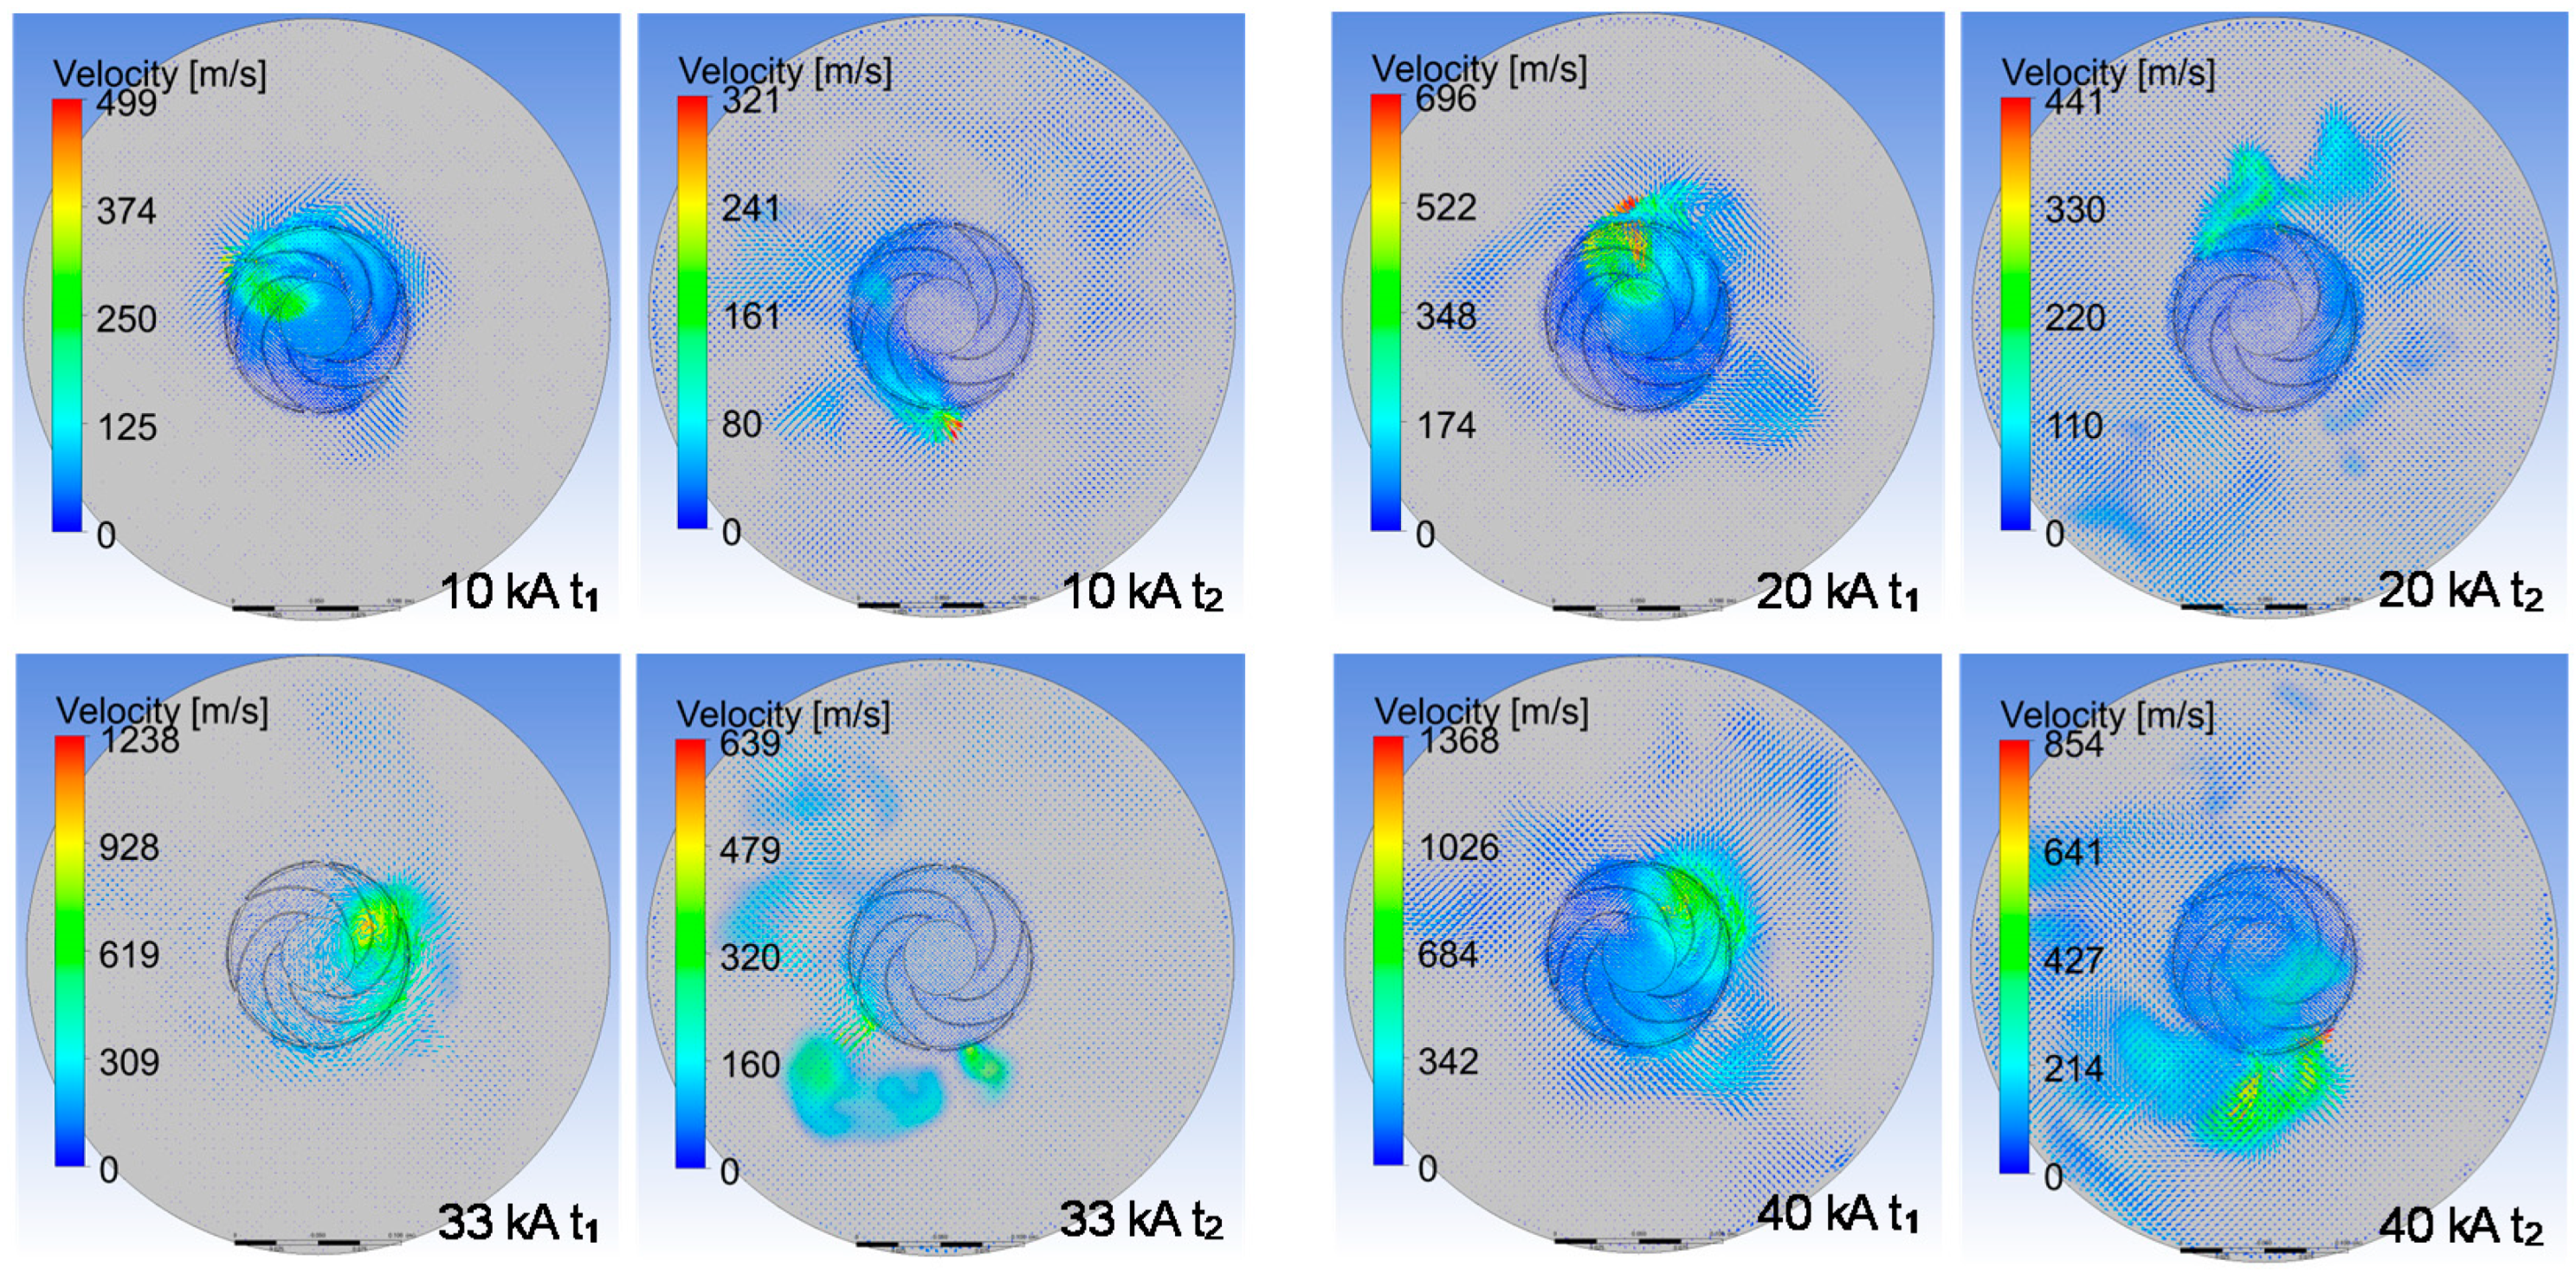
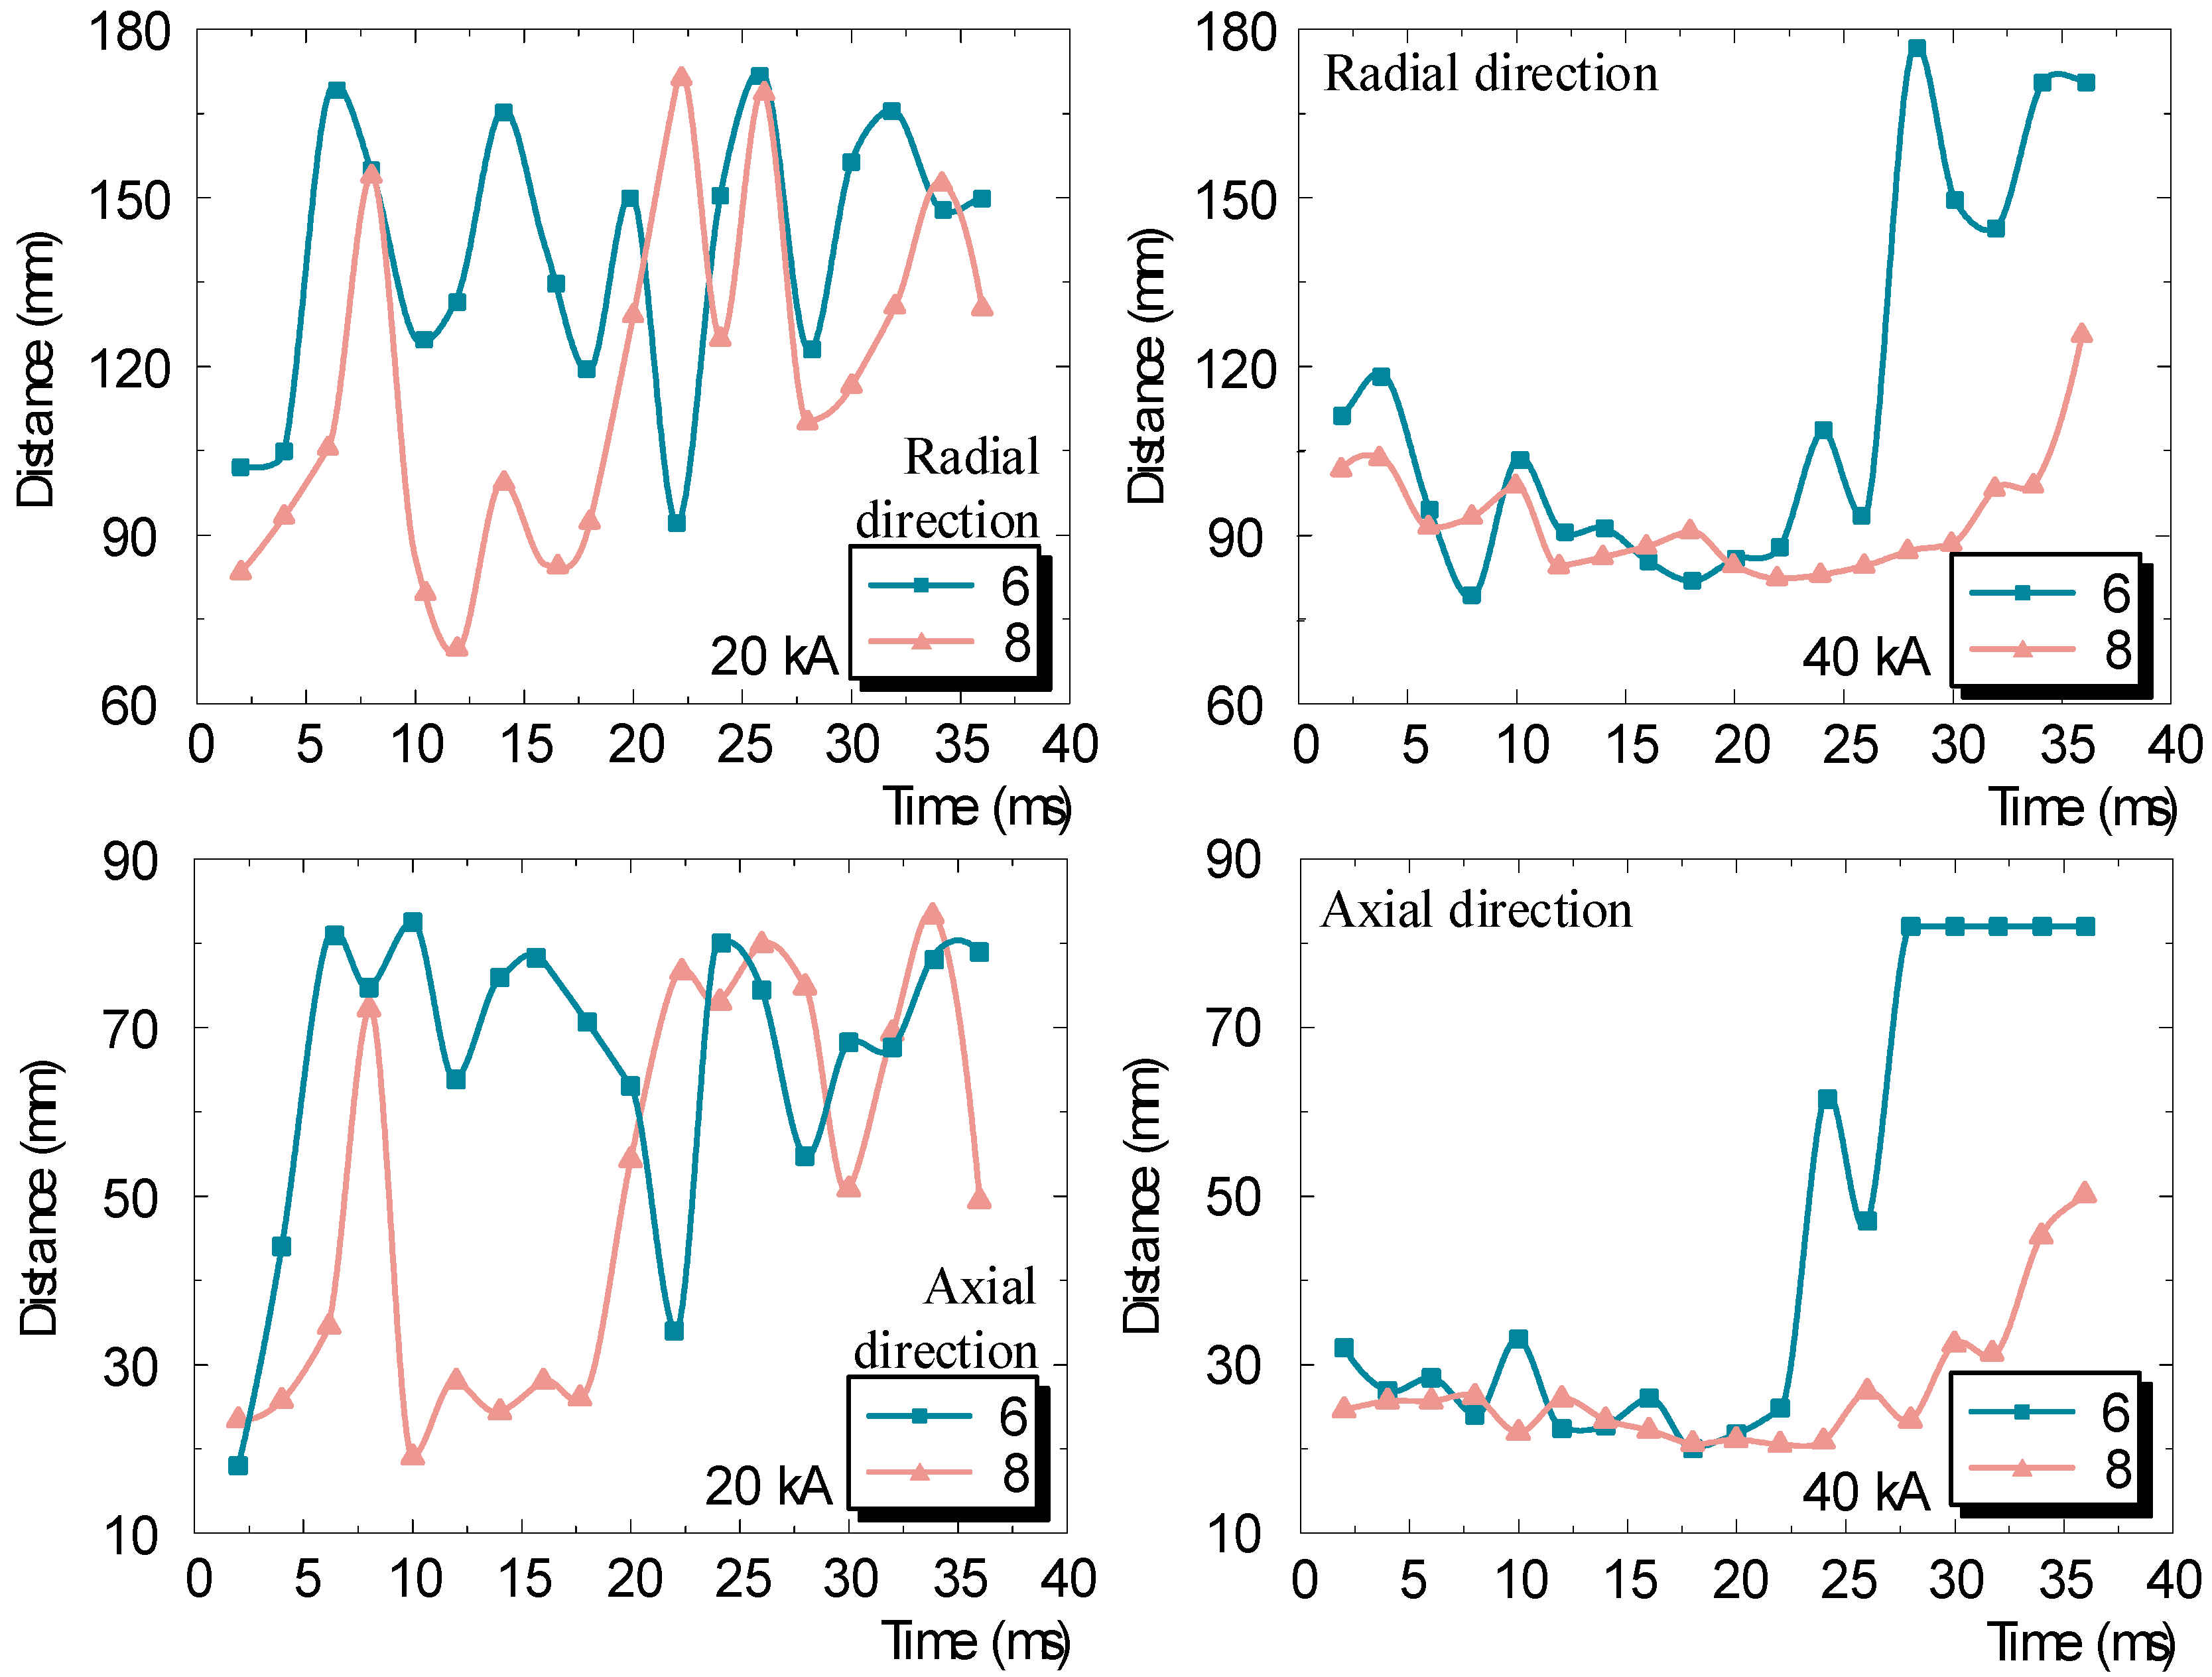
3.1. Effects of the Flowed Current Level
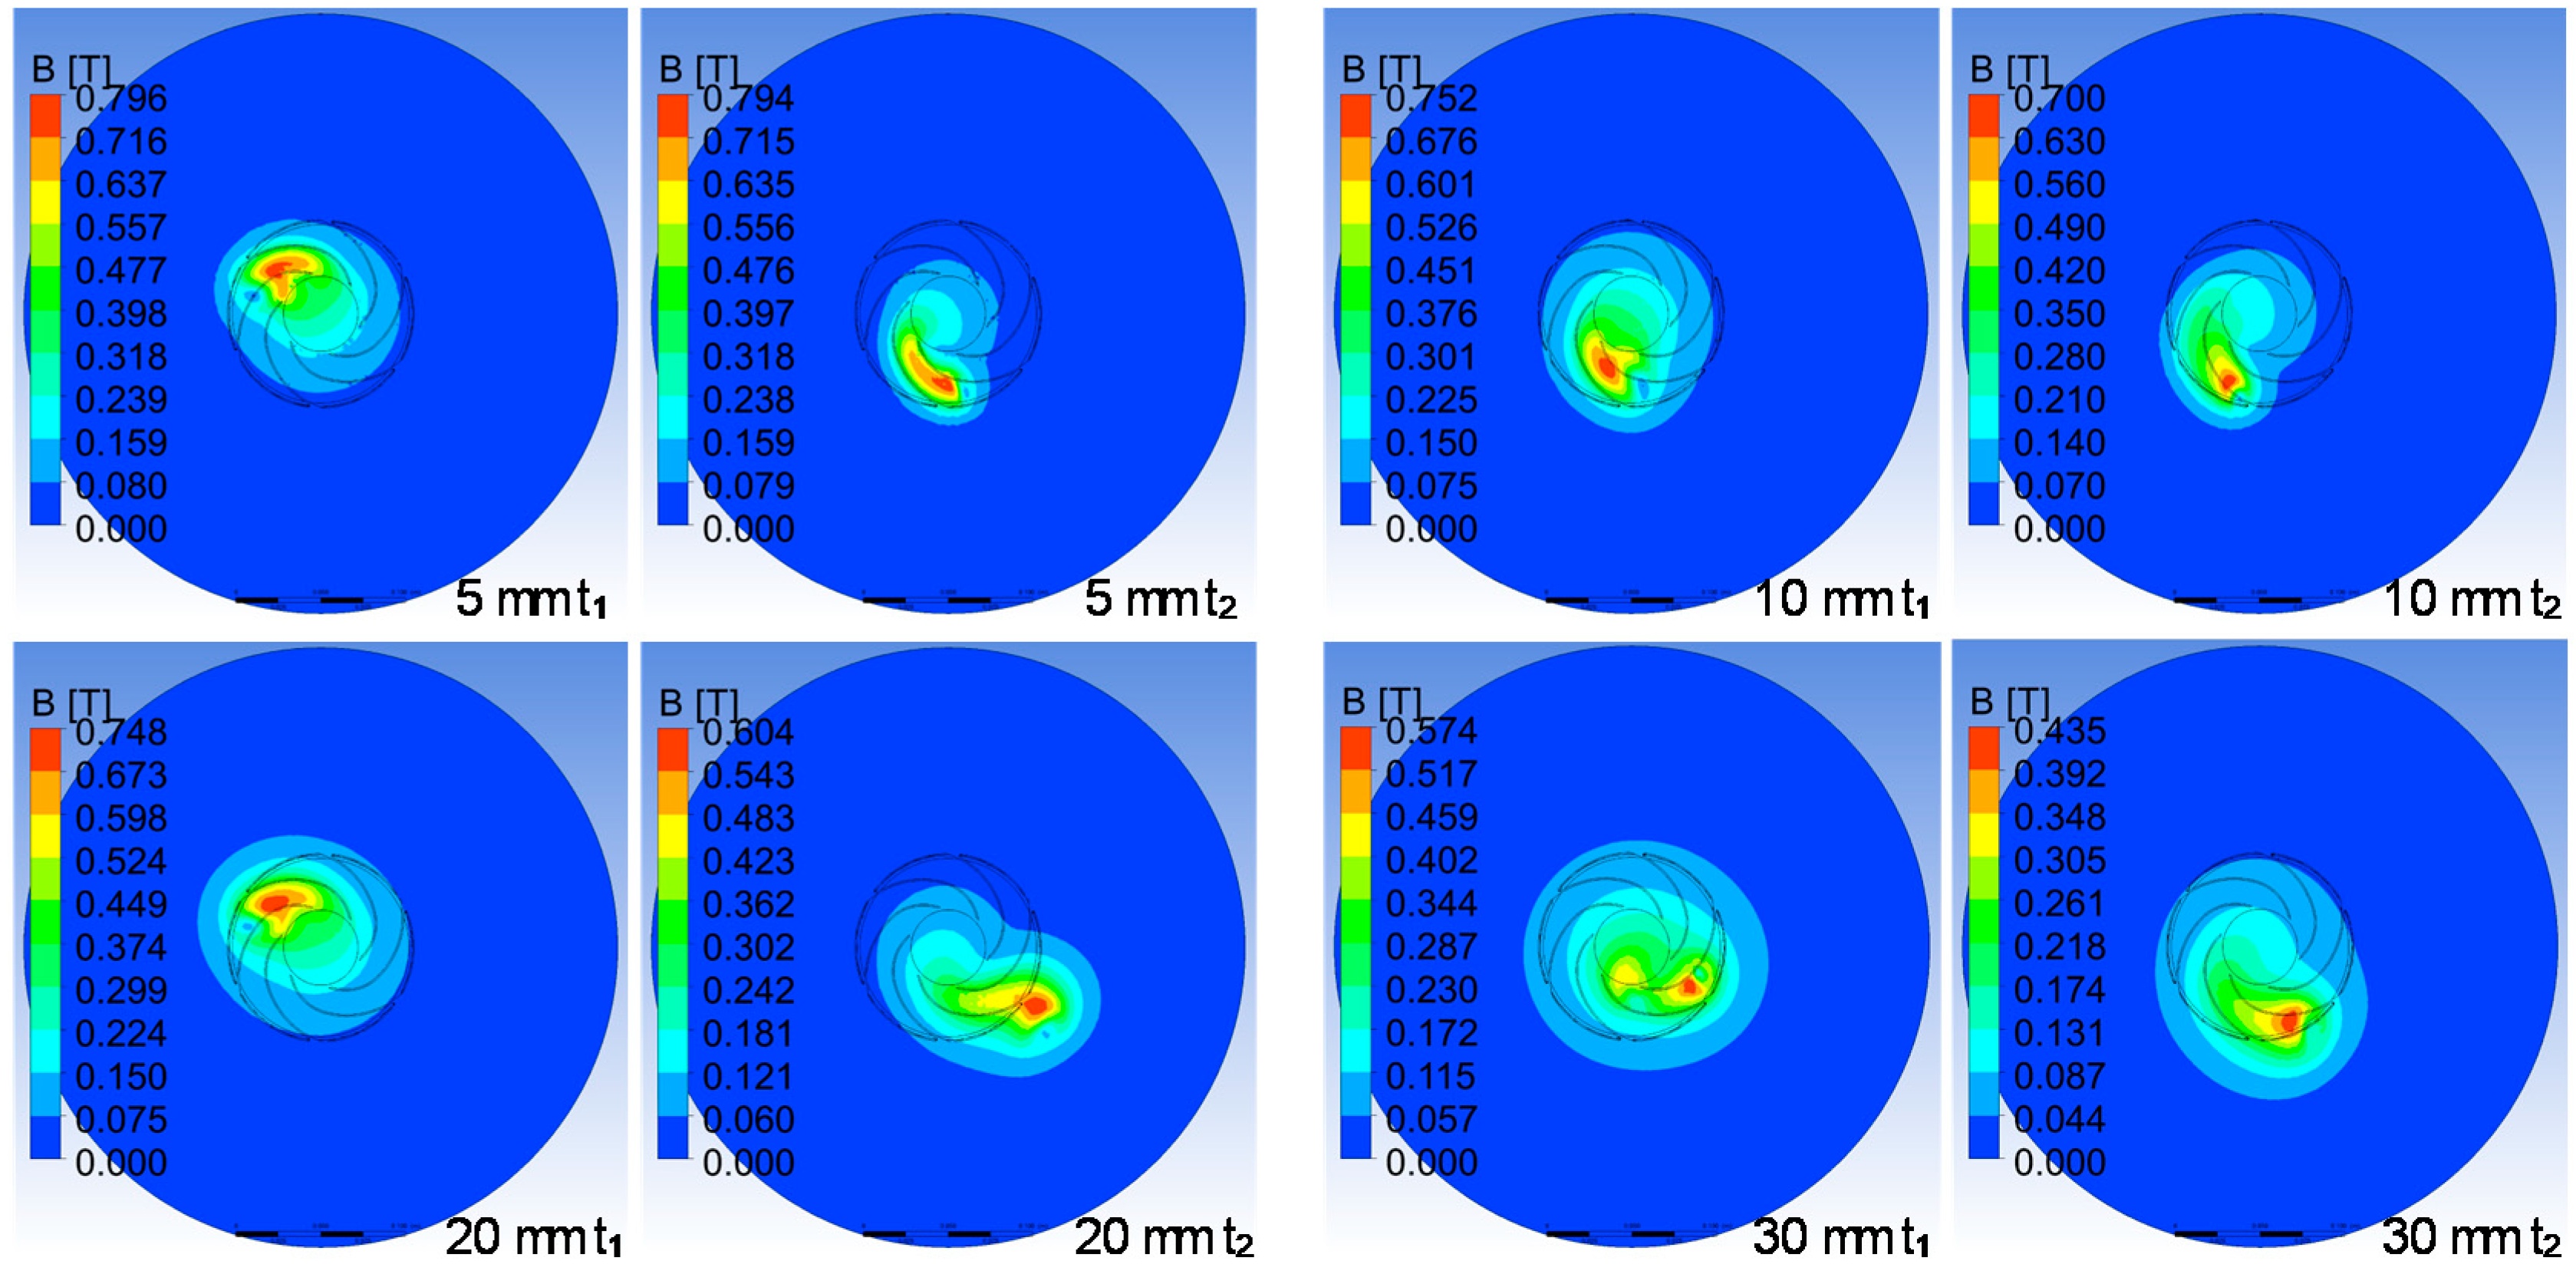
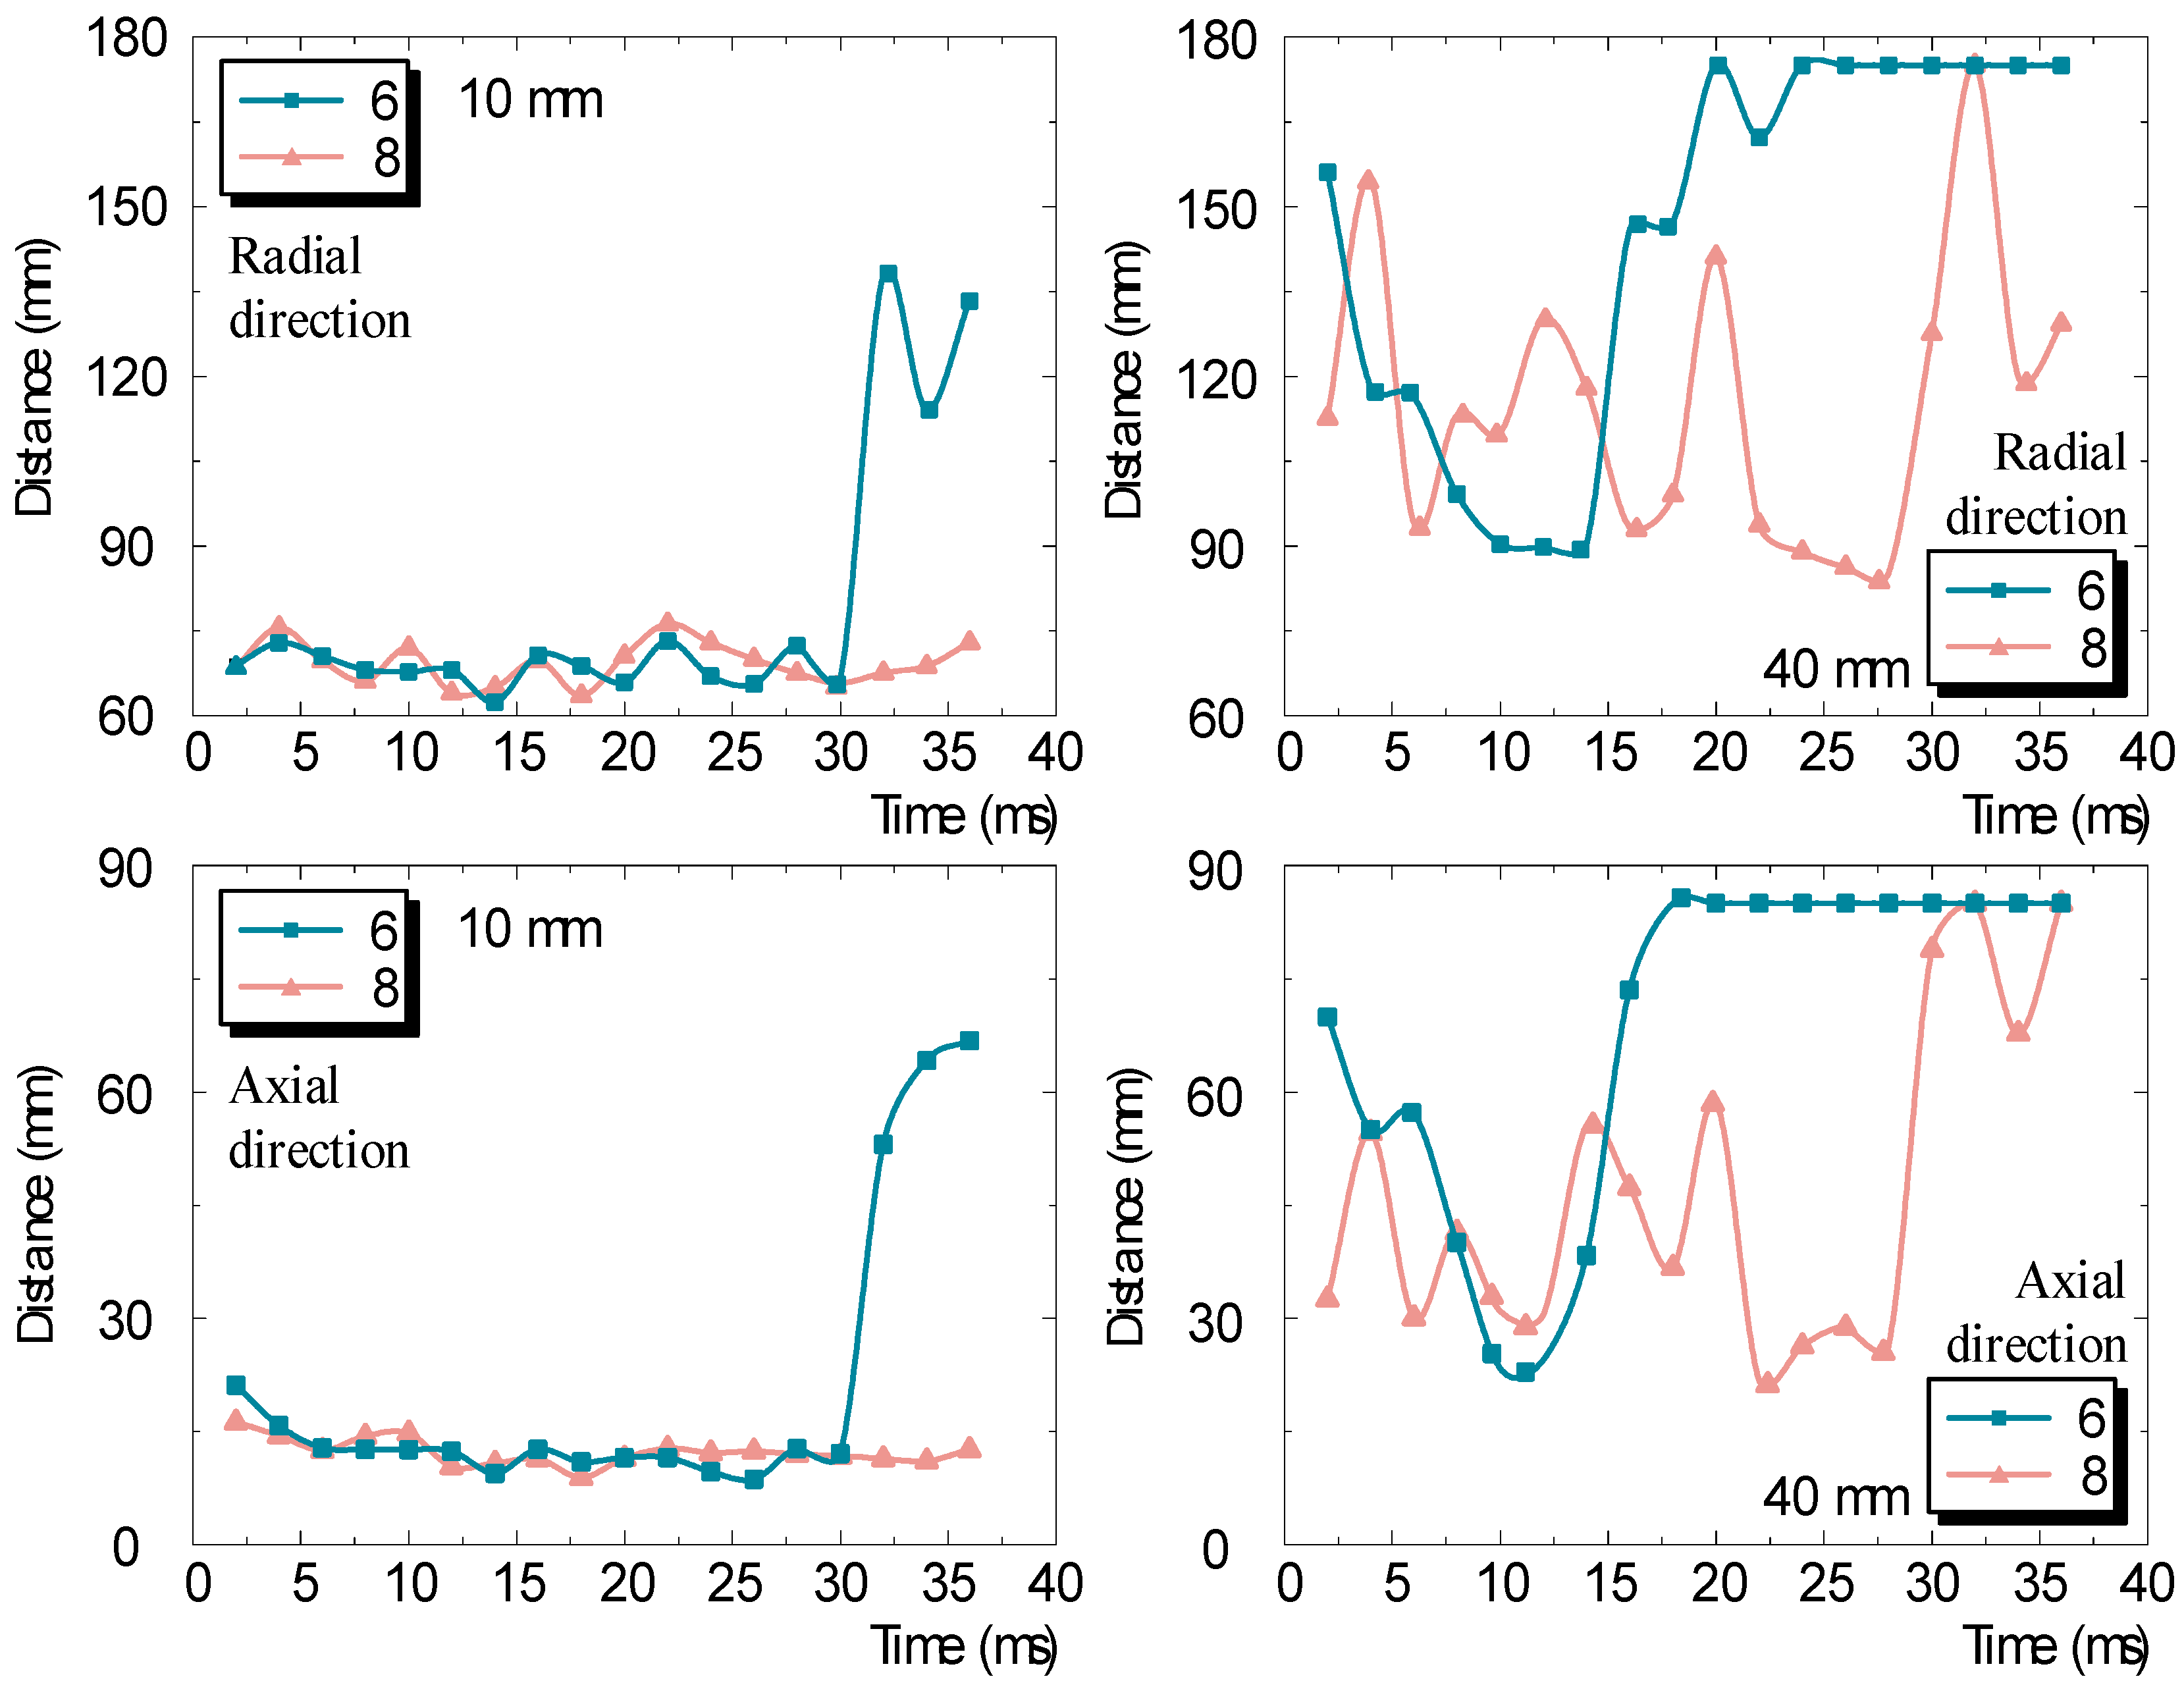
3.2. Effects of the Gap Distance between Two Electrodes
4. Conclusions
- (1)
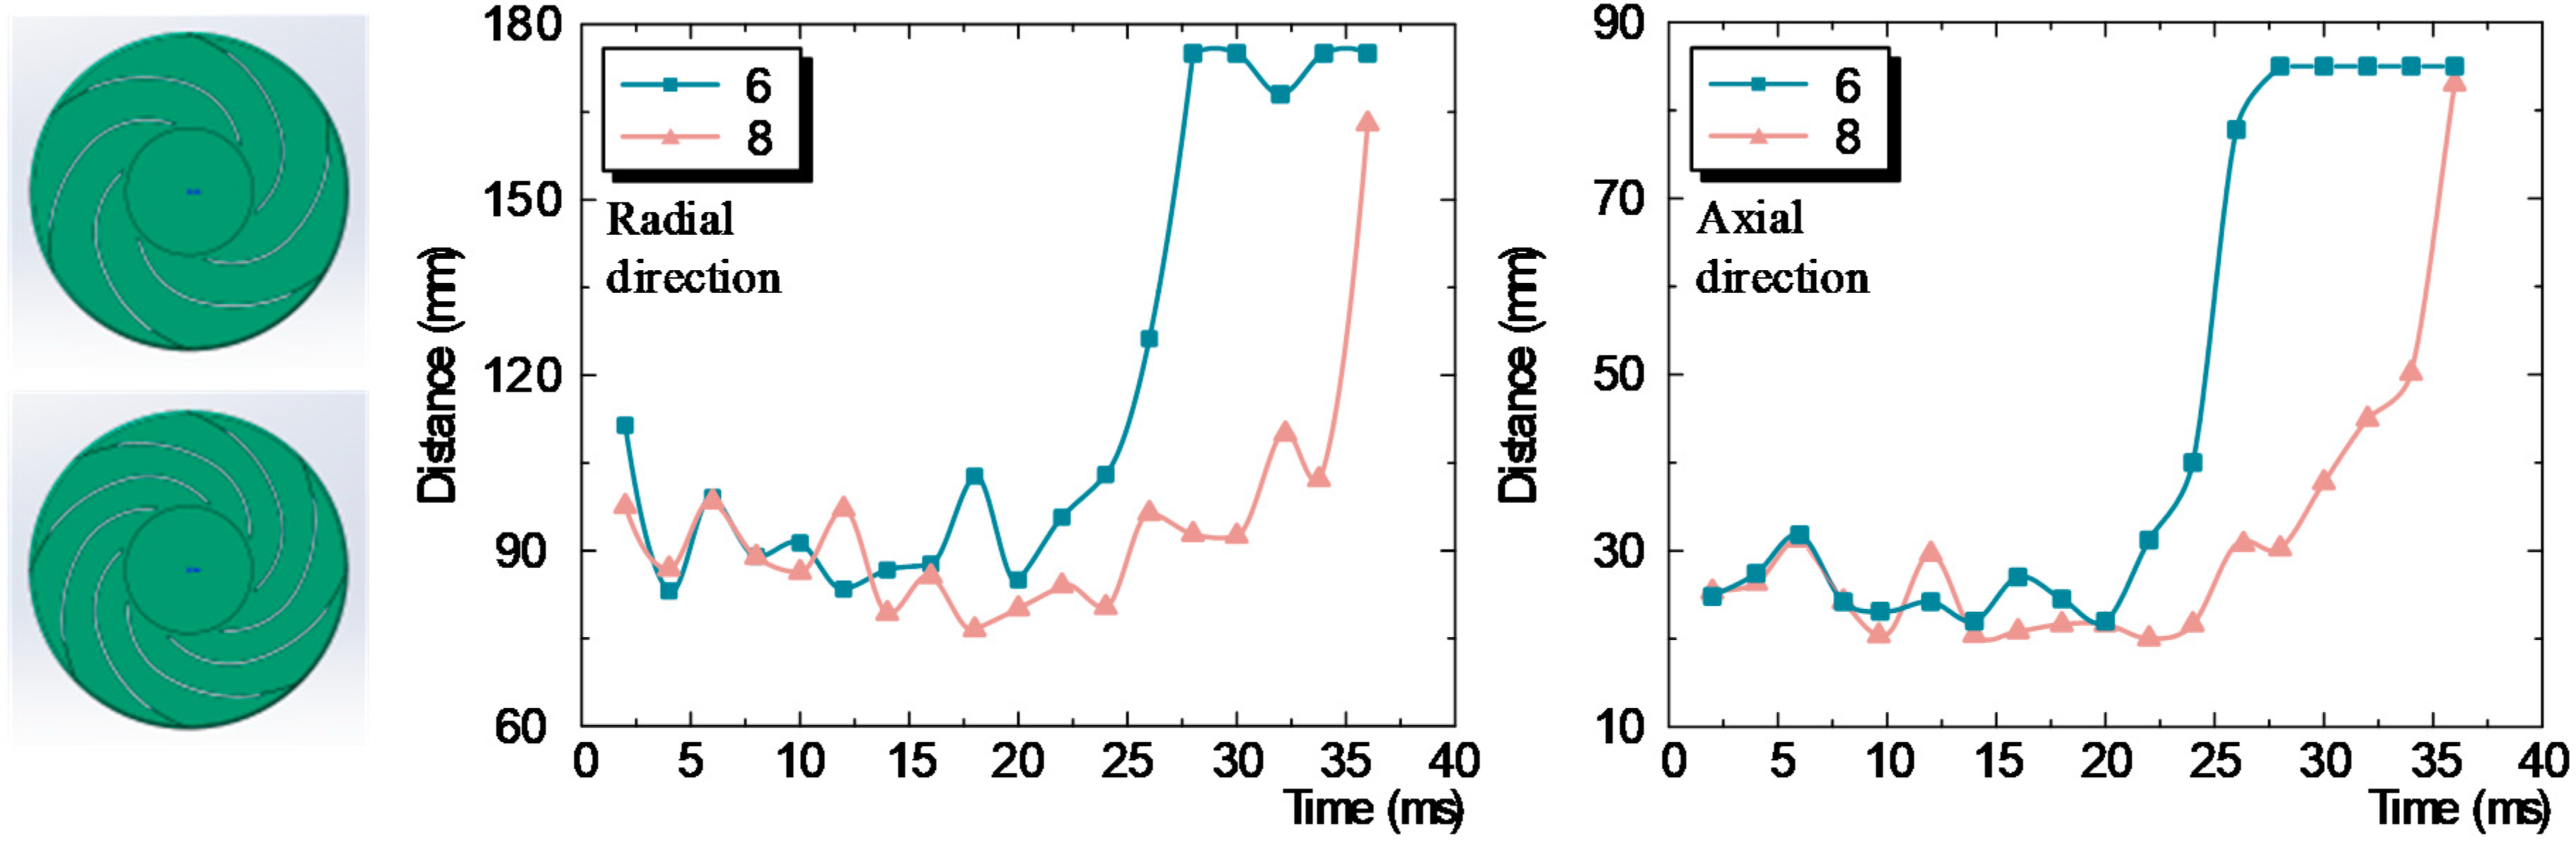
- In the present work, the computation results are comparatively studied by comparing them with the experimental results. The calculated arc morphology during its rotation within the whole 36 ms arc duration is firstly compared to the photographed results from the experiments, and it is found that the arc evolution process during the whole arc duration is comparable with the photographed results. The overall change in the velocity of the arc during its rotation and the change in velocity during each rotating turn are also compared. From the comparison, it could be found that the 3D arc model can reasonably describe the dynamic characteristics of the rotating arc. The calculated arc rotation velocity is also comparable with that obtained from the experiments, which indirectly proves the feasibility of the established mathematical model;
- (2)
- The diffusing and rotating characteristics of the arc during the arcing process are largely affected by the operation conditions of the PJT-GS as follows:
- (i)
- With the increased current level that the PJT-GS withstands during its operation, the averaged rotation velocity of the arc also becomes speedier, respectively from 76.3 m/s to 86.9 m/s, 192.4 m/s and 206.7 m/s. With the increased rotation velocity, the arc is well controlled by the rotary electrode, and it could rotate within a smaller diffusion range at high currents;
- (ii)
- With the increased gap distance between the two rotary electrodes inside the PJT-GS chamber, the averaged rotation velocity of the arc decreases from 245.4 m/s to 127.6 m/s and it is also largely diffused within the domain, which implies that the arc becomes increasingly difficult to control during its rotation;
- (3)
- The arc rotation velocity and the extent to which it diffuses outwards during the arcing process, especially in the high current phase, could reasonably provide a good assessment of the arc controlling performance presented by the designed electrode. The study of the dynamic characteristics of the arc under different conditions could effectively guide the design of the electrode and PJT-GS to achieve the improvement of their lifetime. This is because the better the arc is controlled, the less damage the electrode and the inner wall of the chamber will suffer. The erosion of the solid materials by the high-temperature arc would be reduced and the lifetime of the solid objects would be relatively improved to some extent.
Author Contributions
Funding
Institutional Review Board Statement
Informed Consent Statement
Data Availability Statement
Conflicts of Interest
References
- Li, Y.; Liu, J.; Xiao, H.; Zhang, Z.; Zhang, X.; He, M. A plasma-triggered gas switch. Rev. Sci. Instrum. 2018, 89, 094707. [Google Scholar] [CrossRef] [PubMed]
- Hashemi, E.; Niayesh, K. DC current interruption based on vacuum arc impacted by ultra-fast transverse magnetic field. Energies 2020, 13, 4644. [Google Scholar] [CrossRef]
- Wolf, C.; Kurrant, M.; Lindmayer, M.; Gentsch, D. Arcing behavior on different TMF contacts at high-current interrupting operations. IEEE Trans. Plasma Sci. 2011, 39, 1284–1290. [Google Scholar] [CrossRef]
- Ma, H.; Zhang, Z.Q.; Geng, Y.S.; Wang, J.H.; Liu, Z.Y.; Yuan, F.X. Rotation characteristics of vacuum arcs drive by transverse magnetic fields. IEEE Trans. Plasma Sci. 2018, 46, 2181–2190. [Google Scholar] [CrossRef]
- Wang, L.J.; Shi, W.X.; Lin, R.J.; Wang, Y.; Ma, J.W.; Jia, S.L. Experimental investigation of vacuum arc behavior under different contacts in vacuum interrupters. In Proceedings of the 2018 28th International Symposium on Discharges and Electrical Insulation in Vacuum (ISDEIV), Greifswald, Germany, 23–28 September 2018; pp. 223–226. [Google Scholar]
- Delachaux, T.; Fritz, O.; Gentsch, D.; Schade, E.; Shmelev, D.L. Numerical simulation of a moving high-current vacuum arc driven by a transverse magnetic field (TMF). IEEE Trans. Plasma Sci. 2007, 35, 905–911. [Google Scholar] [CrossRef]
- Zhu, L.Y.; Wu, J.W.; Zhang, X.M. Arc Movement of intermediate-frequency vacuum arc on TMF contacts. IEEE Trans. Power Deliv. 2013, 28, 2014–2021. [Google Scholar]
- Liu, Z.Y.; Wang, Z.Y.; Zhang, X.; Wang, J.M. Analysis of axial magnetic field characteristics of coil type axial magnetic field vacuum interrupters. Trans. China Electrotech. Soc. 2007, 22, 47–53. [Google Scholar]
- Duan, X.L.; Xiu, S.X.; Wu, S.F.; Feng, D.Y.; Ye, H.S.; Li, Q. Characteristic of wan-type transverse magnetic field contacts of vacuum circuit breaker. High Volt. Appar. 2017, 53, 57–63. [Google Scholar]
- Xiu, S.X.; Pang, L.; Wang, J.M. A new electrode applied to high voltage vacuum interrupter and its performance. Proc. CSEE 2008, 28, 124–129. [Google Scholar]
- Deng, J.; Wang, L.J.; Qin, K.; Zhang, X.; Jia, S.L.; Shi, Z.Q. Experimental and simulation of triggered vacuum arc under TMF-AMF contact. In Proceedings of the 2016 27th International Symposium on Discharges and Electrical Insulation in Vacuum (ISDEIV), Suzhou, China, 18–23 September 2016; pp. 1–4. [Google Scholar]
- Lei, B.S.; Cheng, K.; Kong, C.C.; Yang, Z.M. Progress of magnetic contacts in vacuum interrupter. Vac. Electron. 2019, 5, 1–6. [Google Scholar]
- Johnsen, S.G.; Simonsen, A. CFD modeling of a rotating arc plasma reactor. In Proceedings of the 10th International Conference on CFD in Oil & Gas, Metallurgical and Process Industries, Trondheim, Norway, 17–19 June 2014. [Google Scholar]
- Kadivar, A.; Kaveh, N. Effects of fast elongation on switching arcs characteristics in fast air switches. Energies 2020, 13, 4846. [Google Scholar] [CrossRef]
- Verite, J.C.; Boucher, T.; Comte, A.; Delalondre, C.; Simonin, O. Arc modelling in circuit breakers: Coupling between electromagnetics and fluid mechanics. IEEE Trans. Magn. 1995, 31, 1843–1848. [Google Scholar] [CrossRef]
- Versteeg, H.K.; Malalasekera, W. An Introduction to Computational Fluid Dynamics: The Finite Volume Method, 2nd ed.; Prentice Hall: Hoboken, NJ, USA, 2007; Volume 520, pp. 9–38. [Google Scholar]
- Shercliff, J.A. Magnetohydrodynamics; Pergamon Press: Oxford, UK, 1965. [Google Scholar]
- Alberghi, C.; Candido, L.; Testoni, R.; Utili, M.; Zucchetti, M. Verification and validation of COMSOL magnetohydrodynamic models for liquid metal breeding blankets technologies. Energies 2021, 14, 5413. [Google Scholar] [CrossRef]
- Wang, G.; Wang, Y.; Zhang, L.; Xue, S.; Dong, E.; Zou, J. A novel model of electromechanical contactors for predicting dynamic characteristics. Energies 2021, 14, 7466. [Google Scholar] [CrossRef]
- Yan, J.D.; Fang, M.T.C.; Hall, W. The development of PC based CAD tools for auto-expansion circuit breaker design. IEEE Trans. Power Deliv. 1999, 14, 176–181. [Google Scholar] [CrossRef]
- Tang, K.M.; Yan, J.D.; Chapman, C.; Fang, M.T.C. Three-dimensional modelling of a dc arc plasma in a twin-torch system. J. Phys. D. 2010, 43, 345201. [Google Scholar] [CrossRef]
- Wu, Y.; Rong, M.Z.; Yang, Q.; Hu, G.X. Simulation on dynamic characteristics of arc in low voltage circuit breaker modelling. Proc. CSEE 2005, 25, 143–148. [Google Scholar]
- Blais, A.; Proulx, P.; Boulos, M. Three-dimensional numerical modelling of a magnetically deflected dc transferred arc in argon. J. Phys. D. 2003, 36, 488. [Google Scholar] [CrossRef]
- Phanoraj, V.; Phadke, A.G. Modelling of circuit breakers in the electromagnetic transients program. Physics 1988, 3, 799–805. [Google Scholar] [CrossRef]
- Hsu, K.C.; Ptender, E. Analysis of the cathode region of a free-burning high intensity argon arc. J. Phys. D 1983, 54, 3818–3824. [Google Scholar] [CrossRef]
- Trelles, J.P. Nonequilibrium Phenomena in (Quasi-)thermal Plasma Flows. Plasma Chem. Plasma Process. 2020, 40, 727–748. [Google Scholar] [CrossRef]
- Mohsni, C.; Baeva, M.; Franke, S.; Gortschakow, S.; Araoud, Z.; Charrada, K. Effect of a bidirectional coupling of an LTE arc column to a refractory cathode in atmospheric pressure argon. Phys. Plasmas 2020, 27, 073514. [Google Scholar] [CrossRef]
- Baeva, M.; Benilov, M.S.; Almeida, N.A.; Uhrlandt, D. Novel non-equilibrium modelling of a DC electric arc in argon. J. Phys. D Appl. Phys. 2016, 49, 245205. [Google Scholar] [CrossRef]
- Bhigamudre, V.G.; Trelles, J.P. Characterization of the arc in crossflow using a two-temperature nonequilibrium plasma flow model. J. Phys. D Appl. Phys. 2018, 52, 015205. [Google Scholar] [CrossRef]
- Saifutdinov, A.I. Unified simulation of different modes in atmospheric pressure DC discharges in nitrogen. J. Appl. Phys. 2021, 129, 093302. [Google Scholar] [CrossRef]
- Pei, Y.Q.; Zhong, J.Y.; Zhang, J.M.; Yan, J.D. A comparative study of arc behaviour in an auto-expansion circuit breaker with different arc durations. J. Phys. D Appl. Phys. 2014, 47, 335201. [Google Scholar] [CrossRef]
- Xi’an Jiaotong University: Gas Discharge Plasma Database. Available online: https://plasma-data.net/index (accessed on October 2021).
- Guo, R.; He, J.J.; Zhao, C.; Chen, L.X.; Pan, Y. A Rotating Arc Gap Switch and its Arc Velocity Characteristics. Proc. CSEE 2011, 31, 125–129. [Google Scholar] [CrossRef]
- He, J.J.; Guo, R. Measurement of arc velocity in a rotating arc pulsed power switch based on B-dot probes. IEEE Trans. Plasma Sci. 2010, 38, 2669–2674. [Google Scholar] [CrossRef]
- Dullni, E. Motion of high-current vacuum arcs on spiral-type contacts. IEEE Trans. Plasma Sci. 1989, 17, 875–879. [Google Scholar] [CrossRef]


| Equation | |||
|---|---|---|---|
| Mass | 1 | 0 | 0 |
| x-Momentum | u | ||
| y-Momentum | v | ||
| z-Momentum | w | ||
| Energy | T | ||
| Current continuity | 0 |
| Symbols | Explanations | Symbols | Explanations |
|---|---|---|---|
| P | Pressure | Electrical conductivity | |
| T | Temperature | Laminar thermal conductivity | |
| Laminar viscosity | Turbulent thermal conductivity | ||
| Turbulent viscosity | Net radiation loss per unit volume | ||
| Electric potential | Permeability of free space | ||
| ) | Current density | ) | Magnetic vector potential |
| ) | Magnetic flux density | ) | Electric field |
| Symbols | Explanations | Symbols | Explanations |
|---|---|---|---|
| DC1 | DC voltage source (Vmax = 40 kV) | L | ) |
| K1 | Charging switching | K3 | Fast interrupter for protection |
| R1 | ) | D1 | Freewheeling diode |
| C | /36 kV) | K4 | Vacuum circuit breaker |
| K2 | Discharging switch | K5 | Vacuum circuit breaker |
| R2 | ) | VD2 | Resistor voltage divider |
| VD1 | Resistor voltage divider | DC2 | DC voltage source (Vmax = 150 kV) |
| Turns | Momentary Current (kA) | Time Duration (ms/pc) | Average Velocity (m/s) | Turns | Momentary Current (kA) | Time Duration (ms/pc) | Average Velocity (m/s) |
|---|---|---|---|---|---|---|---|
| 1st | 31.30~29.37 | 2.33 | 148.3 | 10th | 24.63~23.10 | 1.50 | 230.4 |
| 2nd | 29.37~29.36 | 1.00 | 345.6 | 11th | 23.10~22.70 | 2.00 | 172.8 |
| 3rd | 29.36~28.89 | 1.67 | 206.9 | 12th | 22.70~21.14 | 1.67 | 206.9 |
| 4th | 28.89~27.41 | 1.00 | 345.6 | 13th | 21.14~20.75 | 2.00 | 172.8 |
| 5th | 27.41~26.63 | 1.33 | 259.8 | 14th | 20.75~19.57 | 2.33 | 148.3 |
| 6th | 26.63~26.62 | 1.33 | 259.8 | 15th | 19.57~18.70 | 2.00 | 172.8 |
| 7th | 26.62~26.20 | 1.33 | 259.8 | 16th | 18.70~15.65 | 3.34 | 103.5 |
| 8th | 26.20~24.67 | 1.67 | 206.9 | 17th | 15.65~12.94 | 2.67 | 129.4 |
| 9th | 24.67~24.63 | 1.67 | 206.9 | 18th | 12.94~11.33 | 3.34 | 103.5 |
| Turns | Time Duration (ms/pc) | Average Velocity (m/s) | Turns | Time Duration (ms/pc) | Average Velocity (m/s) |
|---|---|---|---|---|---|
| 1st | 2.2 | 157.1 | 10th | 1.9 | 181.9 |
| 2nd | 1.4 | 246.8 | 11th | 1.6 | 216.0 |
| 3rd | 1.6 | 216.0 | 12th | 1.8 | 192.0 |
| 4th | 1.5 | 230.4 | 13th | 2.0 | 172.8 |
| 5th | 1.4 | 246.8 | 14th | 1.9 | 181.9 |
| 6th | 1.4 | 246.8 | 15th | 2.3 | 150.3 |
| 7th | 1.4 | 246.8 | 16th | 4.5 | 76.8 |
| 8th | 1.5 | 230.4 | 17th | 5.5 | 62.8 |
| 9th | 1.6 | 216.0 |
Publisher’s Note: MDPI stays neutral with regard to jurisdictional claims in published maps and institutional affiliations. |
© 2022 by the authors. Licensee MDPI, Basel, Switzerland. This article is an open access article distributed under the terms and conditions of the Creative Commons Attribution (CC BY) license (https://creativecommons.org/licenses/by/4.0/).
Share and Cite
Wang, W.; Li, Z.; Gao, K.; Dong, E.; Qu, X.; Xu, X. Dynamic Characteristics of Transverse-Magnetic-Field Induced Arc for Plasma-Jet-Triggered Protective Gas Switch in Hybrid UHVDC System. Energies 2022, 15, 5871. https://doi.org/10.3390/en15165871
Wang W, Li Z, Gao K, Dong E, Qu X, Xu X. Dynamic Characteristics of Transverse-Magnetic-Field Induced Arc for Plasma-Jet-Triggered Protective Gas Switch in Hybrid UHVDC System. Energies. 2022; 15(16):5871. https://doi.org/10.3390/en15165871
Chicago/Turabian StyleWang, Wen, Zhibing Li, Keli Gao, Enyuan Dong, Xuebin Qu, and Xiaodong Xu. 2022. "Dynamic Characteristics of Transverse-Magnetic-Field Induced Arc for Plasma-Jet-Triggered Protective Gas Switch in Hybrid UHVDC System" Energies 15, no. 16: 5871. https://doi.org/10.3390/en15165871
APA StyleWang, W., Li, Z., Gao, K., Dong, E., Qu, X., & Xu, X. (2022). Dynamic Characteristics of Transverse-Magnetic-Field Induced Arc for Plasma-Jet-Triggered Protective Gas Switch in Hybrid UHVDC System. Energies, 15(16), 5871. https://doi.org/10.3390/en15165871