Article

Flexibility as the Key to Stability: Optimization of Temperature and Gas Feed during Downtime towards Effective Integration of Biomethanation in an Intermittent Energy System

by
Brian Dahl Jønson
1,2,
Lars Ole Lykke Mortensen
2,
Jens Ejbye Schmidt
3,*,
Martin Jeppesen
2 and
Juan-Rodrigo Bastidas-Oyanedel
1
1
SDU-Biotechnology, Department of Green Technology, University of Southern Denmark, DK-5230 Odense, Denmark
2
Nature Energy A/S, DK-5220 Odense, Denmark
3
Department of Green Technology, University of Southern Denmark, DK-5230 Odense, Denmark
*
Author to whom correspondence should be addressed.
Energies 2022, 15(16), 5827; https://doi.org/10.3390/en15165827
Submission received: 25 July 2022 / Revised: 9 August 2022 / Accepted: 10 August 2022 / Published: 11 August 2022
(This article belongs to the Topic Anaerobic Digestion Processes)

Abstract

:
Biological methanation is the production of CH4 from CO2 and H2. While this approach to carbon capture utilization have been widely researched in the recent years, there is a gap in the technology. The gap is towards the flexibility in biomethanation, utilizing biological trickling filters (BTF). With the current intermittent energy system, electricity is not a given surplus energy which will interfere with a continuous operation of biomethanation and will result in periods of operational downtime. This study investigated the effect of temperature and H2 supply during downtimes, to optimize the time needed to regain initial performance. Short (6 h), medium (24 h) and long (72 h) downtimes were investigated with combinations of three different temperatures and three different flow rates. The results from these 27 experiments showed that with the optimized parameters, it would take 60 min to reach 98.4% CH4 in the product gas for a short downtime, whereas longer downtimes needed 180 min to reach 91.0% CH4. With these results, the flexibility of biomethanation in BTFs have been proven feasible. This study shows that biomethanation in BTFs can be integrated into any intermittent energy system and thereby is a feasible Power-2-X technology.

1. Introduction

Greenhouse gas (GHG) emissions are continuously growing world-wide which puts an increased focus on renewable energy and utilization of wind, solar and hydro power. Due to this, the share of renewable energy in the electricity consumption in the European Union (EU) has more than doubled since 2004 to 2020 [1]. This is a positive step towards completing the EU energy strategy goals for 2030 where it is sought to reduce greenhouse gas emissions by 55% [2] and 2050 where net-zero greenhouse gas emissions are the goal, thereby fulfilling the Paris Agreement goals [3]. The increase in renewable shares in electricity does not remove the issue of surplus electricity. Surplus electricity refers to the production of electricity that exceeds the consumption. Some strategies have been suggested for the utilization of surplus electricity [4]; electricity is not cheap or easy to store, e.g., in batteries, but newer studies show other possibilities. The possibility is Power-to-X (P2X) [5].
Power-to-X is essentially a way to store energy (power) into another product, X. This includes storages such as mechanical energy which is called power-to-power and could be stored in small to medium scale batteries [6]. Power-to-hydrogen is the most developing storage system. This system is based on the production of hydrogen (H2) from electricity via electrolysis. The electrolysis technology has advanced in the later years [7], but other technologies of hydrogen production have become more of interest. This includes production of biohydrogen [8] as it does not require chemicals or as high energy inputs as conventional water electrolysis. The H2 can be produced with market surplus electricity to be further processed into X-fuels. These fuels are often called electro fuels (e-fuels) which can substitute the fuels used in shipping, aviation, and gasoline [9]. One of the most promising P2X paths is Power-to-Gas (P2G). P2G is promising due to an already established gas grid in the EU and would contribute to the needed independency of fossil fuels. This gas grid transport methane (CH4) from natural gas and production of biogas, which in 2020 consumed a gross total of 15.2 Exajoules (1018 J) [10]. Due to this, power-to-Methane (P2M) is a highly researched area.
P2M is a technology where the power is converted into CH4. First the power is used to produce H2, through electrolysis (Equation (1)), and then H2 is converted together with carbon dioxide (CO2) into CH4 through methanation, also known as the Sabatier reaction (Equation (2)).
Electrolysis :   2 H 2 O 2 H 2 + O 2    Δ G ° = + 237.2   kJ   mol H 2 1
Methanation :   CO 2 + 4 H 2 CH 4 + 2 H 2 O    Δ G ° = 130.8   kJ   mol CH 4 1
Both   Δ G ° are at   25   ° C   and   1   bar
Furthermore, the utilization of CO2 in methanation makes P2M a carbon capture technology. One of the largest CO2 sources are from biogas production. Raw biogas consists primarily of CH4 and CO2 with traces of H2S [11], and before the biogas enters the gas grid it is cleaned of CO2 and H2S to have a pure CH4 product. There are two types of P2M, catalytic and biological. The catalytic technology utilizes H2 and CO2, with a catalyst under high pressures and temperature, 10 bar and >350 °C, respectively [12]. This technology has also been operated in pilot scale experiments with successful results [13]. Some of the disadvantages with the catalytic methanation are the high operating costs (OPEX) from operating under the high pressure and temperature along with the need of cleaned feedstock gas, i.e., removal of H2S from raw biogas to protect the catalyst used [14]. These disadvantages can be solved by using biological methanation (biomethanation). The biomethanation technology is a widely researched area with a strong focus into biological trickling (biotrickling) filters [15]. This type of reactor utilizes the surface area of immobilized hydrogenotrophic methanogens on a packed bed.
One advantage all P2X technologies have is the potential to utilize surplus electricity, thereby the cheap electricity and in addition storage of the energy. This surplus electricity will not always be available, and therefore P2X needs to be a flexible technology. To illustrate the need of flexibility, electrical spot prices from Denmark in 2020 [16] (Figure 1) clearly show the variation in electrical prices. The prices can vary within hours, showing the change from being in surplus to high in demand.
A price limit of 28 $US/MWh, shown in Figure 1a, is used as a representation for a limit to separate the electrical prices from surplus to demand. It is not known if this limit is estimated too high or too low for a feasible P2X production. The price for this limit would vary from each country and a business case could determine what electrical spot price could be the limit for feasible P2X for the specific case. Variations in electrical spot prices are not limited to day-to-day but can vary within hours (Figure 1b). On 15 October a 123% increase in electricity spot prices was seen from 06:00 to 09:00, which indicates how fast the spot prices can vary and make biomethanation non-feasible in Denmark.
The catalytic P2M technology is very flexible, has a quick response time, can start up from a cooled reactor and reach a steady state within minutes [17]. On the contrary, the intrinsic biological activity of the biological P2M technology becomes a disadvantage during this downtime operation. This biological activity must be kept active during the downtime, otherwise the bioreactors performance might be diminished or even lost. Downtime periods of under 1 h are not of interest due to it being assumed not to have a big influence on the performance of the metabolism of the microorganisms, and therefore the catalytic and biological methanation will be equal in these downtime periods. The flexibility of biomethanation have been investigated briefly. Studies have investigated downtime periods of 1 to 8 days [18] and optimization of the start-up sequence [19]. Other authors have studied the starvation of hydrogenotrophic methanogens (HMs) for 1 and 2 weeks [20] and up to 4 weeks [21] in batch experiments. All these studies show that the HMs are resilient and robust. Nonetheless, downtime periods do affect their performance. Yet, they will return to their original steady state of performance in shorter periods of 12 to 24 h and up to 1 week.
The purpose of the present study was to optimize the flexibility of biomethanation, and to provide an optimization of the flexibility of this technology. To do this, the effects of two different parameters have been investigated towards minimizing the time to regain initial performance after downtimes of 6, 24 and 72 h. The combination of temperature and gas flow would ensure the shortest time needed to reach initial performance with a product gas of gas grid quality ≥ 95.4% CH4 [22]. Four biological trickling filters (BTFs) were operated in steady-state shifting between the different downtime periods and normal steady-state operation. The refeeding strategy of the BTFs the first 60 min was based on Strübing et al. (2019) [19]. The product gas from the reactors was measured continuously for 3 h after the start up.

2. Materials and Methods

2.1. Reactor Configurations

The four BTFs used in the present study were identical in terms of design and construction. The design of these BTFs was a scaled-up version of the configuration used in Jønson et al. (2020) [23]. The BTF were built with transparent PVC pipe, Ø160 mm and wall thickness of 4.7 mm. The height of the packing material was 45 cm, giving a height:diameter ratio of 3:1 and a working volume of 8 L. The BTFs were sealed off with cap nuts and airtight with PVC cement (UNI-100® PVC Cement, Griffon, Rotterdam, The Netherlands).
The BTFs had a hydraulic atomizing spray nozzle (4LN-SS3, MT-Spray, Herlev, Denemark) installed inside of the top to ensure uniform trickling. The liquid was pumped from the bottom of the BTF (the sump) to the top via a peristaltic dispensing pump (LabF3-II with YZ2515x pump head, Shenchen), the tubing to the top was insulated to minimize the heat loss during trickling.
The packed bed consisted of polyethylene Raschig ring with a surface area >3500 m2/m3, void volume fraction of 76% and 5 × 10 mm in size (MBBR PE08, Tongxiang Small Boss Special Plastic Products Co., Ltd., Tongxiang, China), same packing had been used in the study of Ashraf et al. (2021) [24]. The BTFs were randomly packed with the Raschig rings.
To keep the operating temperature a water bath (Dyeno DD-BC6 Heating Circulator, Julabo, Allentown, PA, USA) was set at 52 °C. The BTFs were coiled in tubing and insulated to ensure minimal heat loss. This was sufficient to keep the BTFs at thermophilic temperature. The temperature was measured in the middle of each BTF working volume with a thermometer (EBI 310, EBRO) and the temperature data was logged once every hour.

2.2. Biotrickling Filter Operation

2.2.1. Inoculation of BTFs

The inoculation of the BTFs was performed by flooding the BTF with inoculum to ensure that all packing material has been inoculated for maximum growth of biofilm. The inoculum used was the liquid fraction from biogas digestate (Nature Energy Videbæk A/S, Videbæk, Denmark), with a particle size < 500 µm. This biogas plant is a thermophilic biogas plant, which have a temperature of 50 °C in the digestors. After the flooding of the BTFs, they were emptied of decanted digestate and heated to 52 °C to ensure thermophilic conditions for the HMs and supply of gas was initiated.

2.2.2. Operational Conditions

The BTFs were operated at a gas retention time (GRT) of 45 min from start-up to the end of the experimental period. The retention time was calculated with the empty reactor volume (Vr) and the gas flow rate of H2 (FH2), gas flow rate of CO2 (FCO2), and gas flow rate of CH4 (FCH4), Equation (3). The GRT is a measure of the normal volume of active reactor ( Nm r 3 ) per normal volume of total gas inlet ( Nm F in 3 ) per day.
GRT = V r F H 2 + F CO 2 + F CH 4   [ Nm r 3 Nm F in 3 d ]
The total flowrate ( F H 2 + F CO 2 + F CH 4 ) was 31 . 9   Nm 3   Nm R 3   d 1 throughout the normal operation and was not changed except during the downtime periods. In the present study, the biomethanation was performed with mixtures of pure H2, CO2, and CH4 gases, >99.5% (Strandmøllen, Denmark). These gasses were supplied co-currently with the trickling and in a ratio that simulates real biogas of 60% CH4 and 40% CO2, and a H2:CO2 ratio of 3.8:1. This gave an inlet composition of 60.3% H2, 15.9% CO2 and 23.8% CH4. The supply of gasses was controlled by mass flow controllers (SmartTrak® C100L, SIERRA, Monterey, CA, USA) and the outlet gas flow was measured by mass flow meters (Low-ΔP-Flow F-101D, Bronkhorst, AK Ruurlo, The Netherlands) and logged through Bronkhorst software (Bronkhorst FlowPlot, Ruurlo, The Netherlands). The performance of the BTFs was based on the gas composition of the product gas and the flow of each BTF.

2.2.3. Liquid Nutrient Supply

The BTFs were supplied with liquid synthetic nutrients. The composition of this nutrient solution was a modified recipe from Angelidaki et al. (2009) [25] which was 10× as concentrated regarding the concentrations of bicarbonate buffer, trace metals and vitamins. This ensured sufficient nutrients and less frequently addition of new nutrient media to the BTFs. During the operation of the BTFs a problem was encountered with this nutrient recipe, when the nozzles clogged due to crystallisation. To solve this issue, a two-step plan was put in practice. First, the recipe was changed to minimize the chance of crystallisation by substituting the trace elements from the recipe with another pre-manufactured trace elements solution (BC. TEplex AKUT, Schaumann BioEnergy GmbH, Pinneberg, Germany). The second step was to change the way of suppling the nutrient solution. Instead of trickling the bed of the BTF, the whole volume was flooded to ensure equal distribution of nutrients to the whole bed. The study of Ashraf et al. (2021) [24] have shown that flooding a BTF was efficient enough to provide nutrients for biomethanation, while the study of Sieborg et al. (2021) [26] found the HMs would not be negatively affected without trickling for up to 7 days. The flooding was conducted twice a week to ensure no loss of performance.

2.2.4. Gas and Liquid Analysis

Gas composition was analysed daily through a gas analyser (Pronova SSM6000 LT, Maryville, TN, USA) which measured CH4, H2, CO2 and O2. Gas analysis was conducted along with reading of the flow meters and temperature check. Analysis of the liquid (samples from the sump) consisted of quantification of volatile fatty acids (VFA) along with pH measurements. The VFAs was measured using GC (7820A GC Systems with 7693 Autosampler, Agilent Technologies, Santa Clara, CA, USA) with an equipped flame ionisation detector (FID) and a 30 m × 0.320 mm × 0.23 µm column (DB-FFAP, WAX GC Columns, Agilent Technologies, Santa Clara, CA, USA). The method used helium as carrier gas and a temperature gradient program of an initial temperature of 95 °C for 1 min then 130 °C for 3 min cooled to 120 °C for 1.12 min and increased to 180 °C for 2.4 min at the end. The samples were prepared for the VFA analysis by diluting the sample with an intern standard, 1:4, respectively, which consists of 0.3 M oxalic acid and 0.01 M 2-ethylbuturic acid. The samples were then centrifuged (VWR® Mega Star 1.6, Radnor, PA, USA) at 4700 rpm for 15 min, and the supernatant was filtered through a 0.20 µm nylon filter (Labsolute®) into a GC vial. The pH of the sump in the BTFs was measured with a pH meter (InLab® Science Lab Pro-ISM, Mettler Toledo, Columbus, OH, USA) which was frequently calibrated.

2.3. Downtime Experimental Setup

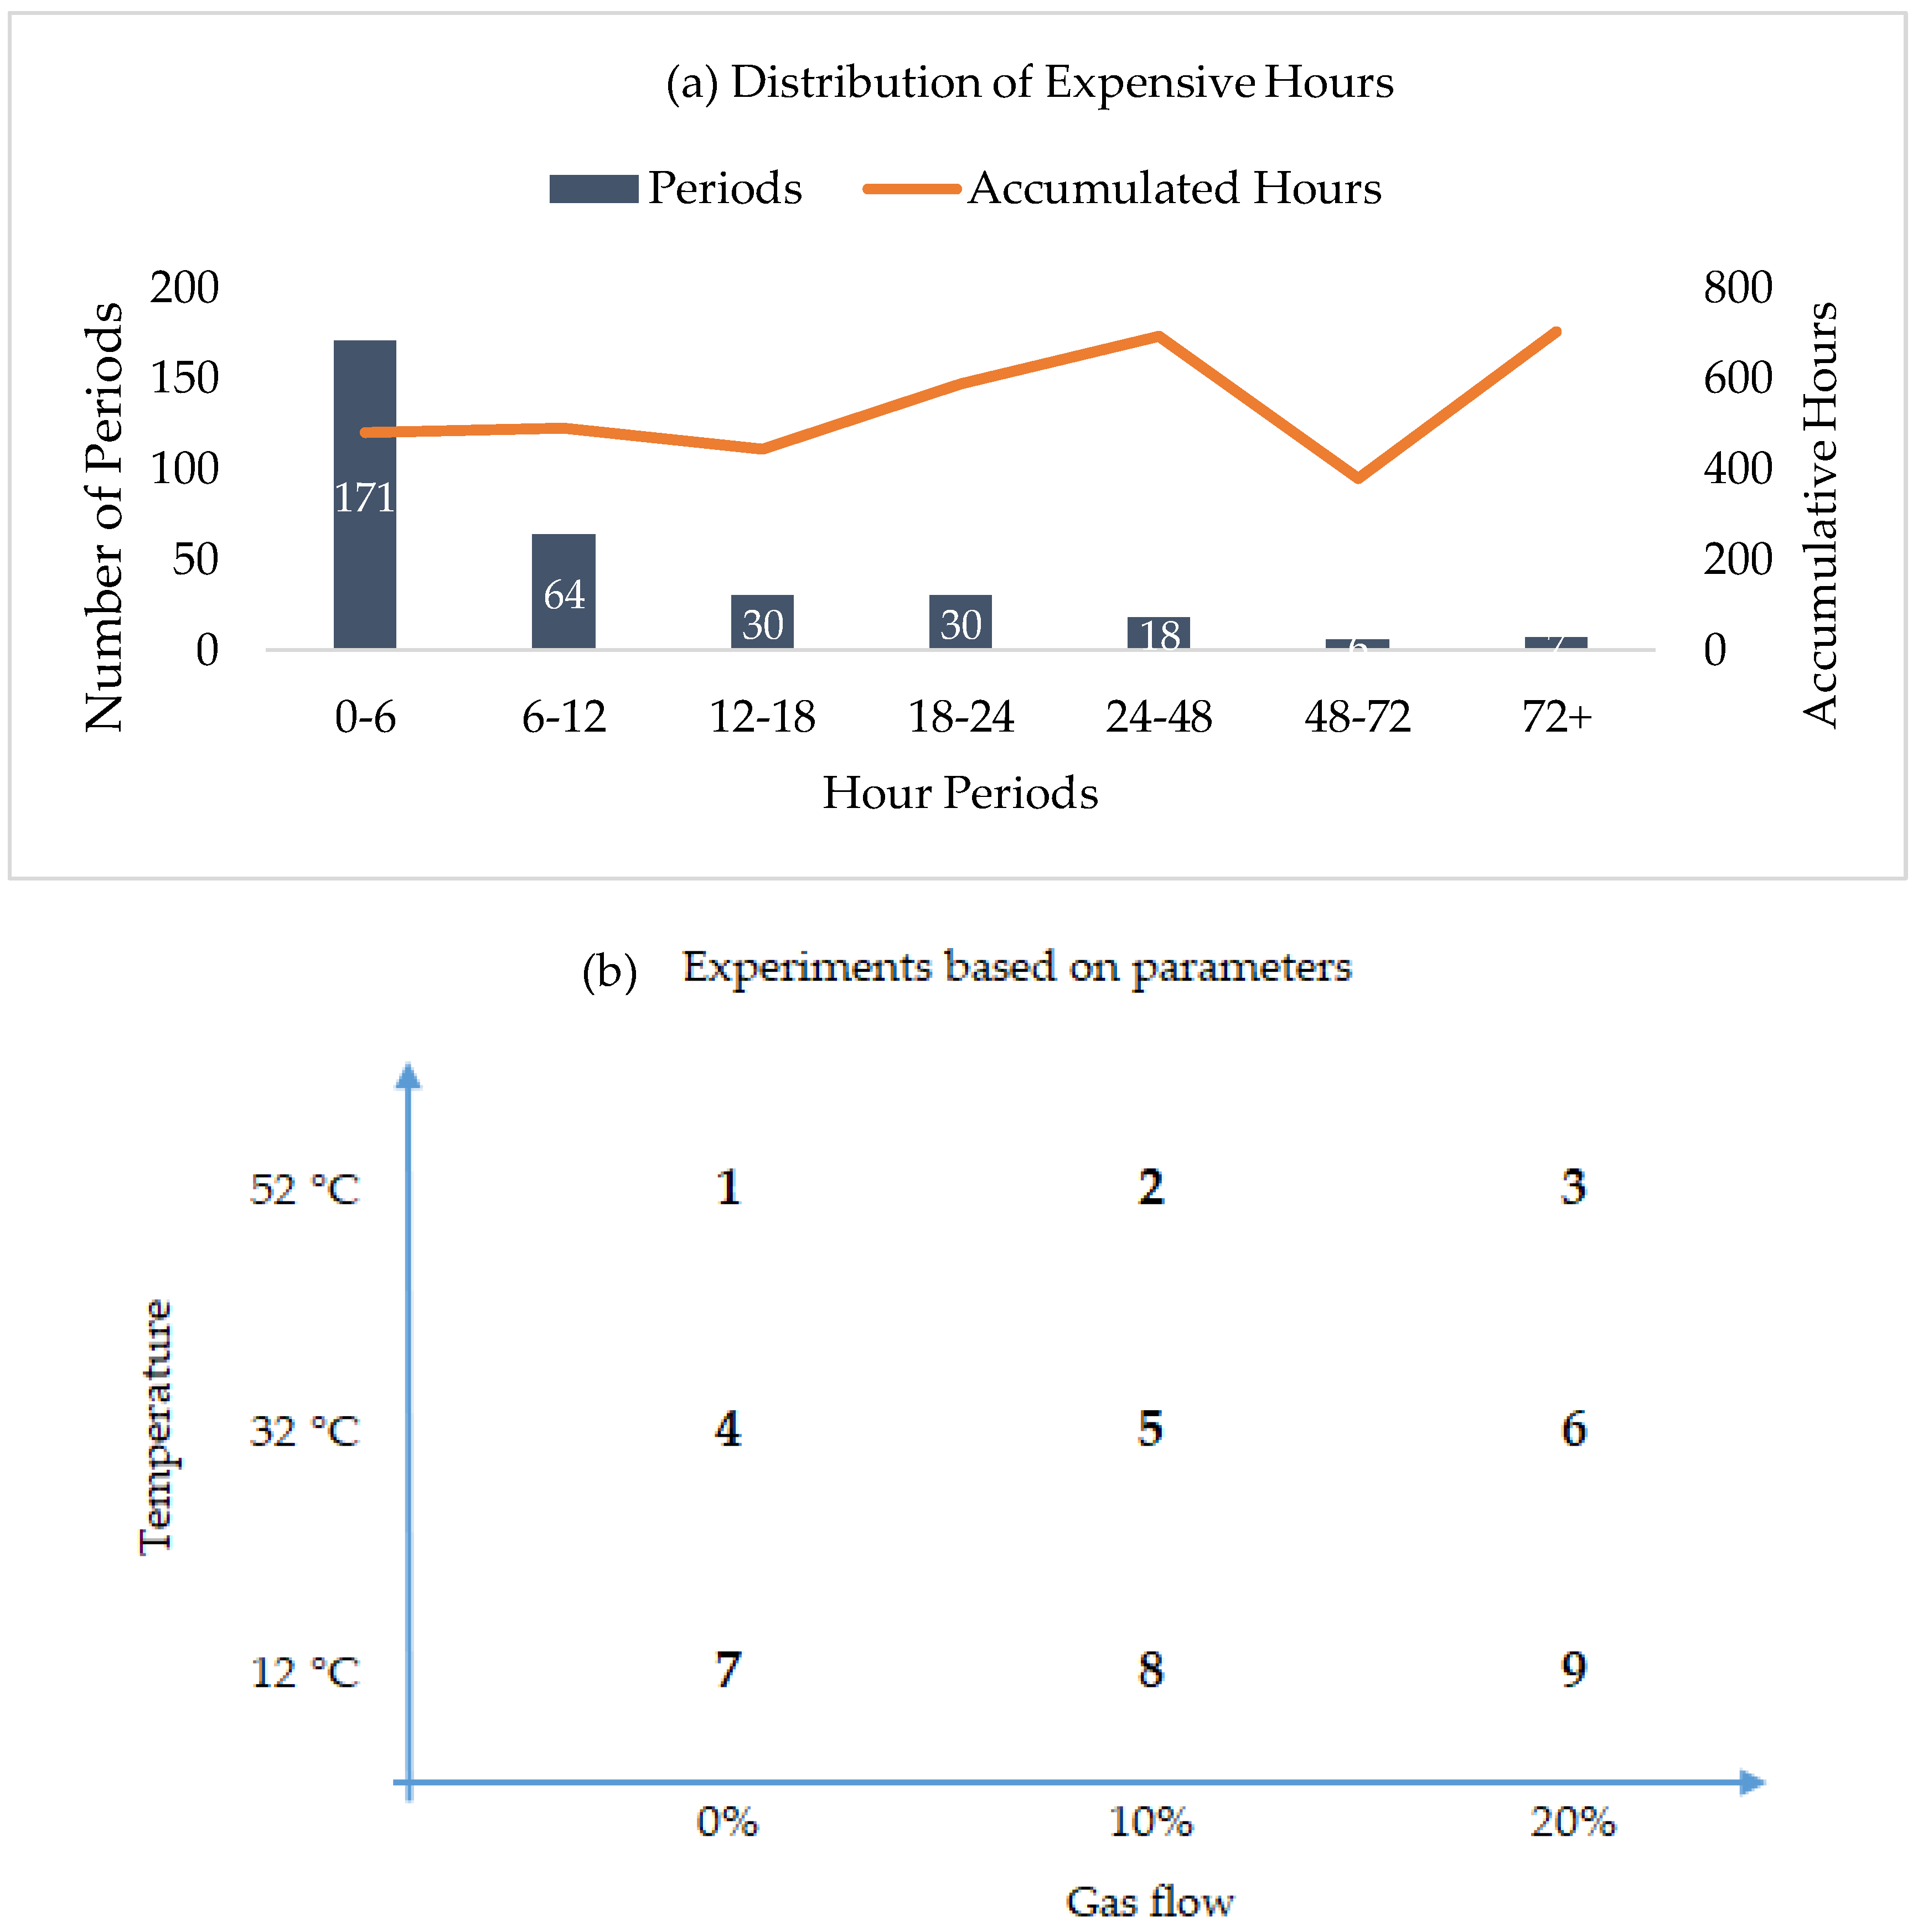
2.3.1. Design of Experiment

The present study focused on minimizing the time to regain the initial performance. To determine the downtime periods, the electrical spot prices from Denmark in 2020 (Figure 1) was chosen. This was chosen as data was easily accessible, but the setup does not limit to these prices, as they were only used for choosing downtimes. The downtime periods were based on the total amount of consecutive hours of electrical spot prices above the set limit in Figure 1a. This resulted in a distribution which indicated that downtime periods of 6, 24 and 72 h would be most relatable to investigate (Figure 2), based on these data.
Figure 2a show the 6, 24 and 72 h periods of consecutive expensive hours were some of the most accumulated hours. The three time periods were estimated to indicate a short downtime (6 h), medium downtime (24 h) and longer downtimes (72 h), which was why they were chosen for this study. For the optimization of time to regain performance, two parameters were tested during the downtime of the BTFs, temperature and gas flow. A combination of these two parameters were expected to have a positive effect on minimizing the time to regain initial performance. The studied temperatures were 12, 32, and 52 °C. 12 °C was active cooling of the BTFs, 32 °C simulating no active heating in a fully isolated BTF during downtime and 52 °C was normal operating temperature. The gas flows used during the downtimes were 0, 10 and 20% of normal operating gas flow, including H2. Combining the two parameters gave 9 experiments (Figure 2b) for each downtime period. The temperature of the BTFs study and the product gas was measured continuously every 15 min for 3 h after refeeding.
The frequency of the experiments was limited to 1–2 per week, depending on the downtime periods. To monitor normal operation between the downtime experiments, 6 and 24 h downtimes were tested two times a week with 3 consecutive days of normal operation between each experiment. The downtime of 72 h was tested once a week with 4 consecutive days of normal operating between each downtime experiment. This was constructed in a way to monitor that the BTFs did not get negatively affected by the downtime experiments, which could invalidate the results obtained.

2.3.2. Data Analysus Using MODDE®

For data analysis of the experiments the experiment design program MODDE® (Sartorius AG, Göttingen, Germany) have been used. The program has been used to construct contour plots on the effect of the studied parameters, and to clearly define the more sensitive parameters that maximize the output in the shortest time possible in the BTFs after refeeding.
The data used for MODDE® was the temperature and product gas measurement for every 15 min after initiation of the refeeding strategy. Outliers were determined prior to using the data for the modelling. Based on this data MODDE® could create contour plots for comparison of the influence from parameters of flow and temperature on the product gas quality.
Due to the refeeding strategy taking 60 min, but the GRT in steady-state being 45 min, a delayed response in the product gas quality could occur. Due to this, results were used from 120 min and 180 min for making contour plots. The times were chosen due to the refeeding strategy of 60 min with the delayed response due to GRT, which makes 120 min interesting as effects should be observed, and 180 min due to it being the last obtained results for each experiment. This would provide insight into the change in product gas as well as what parameters might be most beneficial compared to the downtime length.

3. Results and Discussion

The downtime experiments were conducted during a period of 230 days. In between the downtime experiments the product gas had a conversion of >97% of H2. This corresponded to a production capacity of 5.1 Nm CH 4 3   Nm R 3   day 1 with a gas quality of 96.9 ± 1.6% CH4, 1.9 ± 0.6% CO2 and 1.2 ± 1.4% H2 in the product gas. This was excluding the days of downtime experiments.

3.1. Effect of Parameters on Downtime Lengths

The most and least effective combinations of parameters from the three downtimes are shown in Table 1. The optimal combination of parameters differed between each downtime period and would yield between 98.4% and 91.0% CH4 in the product gas during the first 180 min after initiating refeed.

3.1.1. Downtime of 6 h

The downtime experiments of 6 h were expected to have the least negative effect of the parameters due to the short downtime length. The best parameters of 52 °C and 0% flow yielded a product gas of 98.4% CH4 within 60 min of refeeding (Table 1). This corresponded to the time it took for the 4-step refeed to reach 100% gas load. The high-quality product gas was above gas grid quality and would not require further removals of CO2 or H2 to enter the gas grid. The least efficient combination of parameters on a short downtime was 12 °C and 0% flow which resulted in a product gas of 30.8% CH4 at 180 min after refeeding (Table 1). This combination of temperature and flow was clearly the least efficient compared with the 8 other combinations of temperature and flow, which had an average of 97.2 ± 1.1% CH4 between them all after 180 min.

3.1.2. Downtime of 24 h

By increasing the downtime by a four-fold from 6 to 24 h, it was expected that temperature and flow during downtime would affect the product gas more. With a combination of 52 °C and 20% flow a gas grid quality product gas of 96.6 ± 0.7% CH4 was reached after 90 min. The theory of having higher downtime temperature which would negatively impact the metabolism and conversion of the HMs, was not seen for downtimes of 24 h.
When comparing these results with Strübing et al. [18] and Strübing et al. [19], the impact of having a flow have improved the reactivity of the HMs significantly. From [18] it took 230–240 min to reach 94.6% CH4 in their product gas after same downtime period, and similar temperature. To reach 96% CH4 a time of 281 min was needed, which was a 3-fold increase from this study. In [19] they lowered the temperature to 25 °C during the same downtime length and reached 94.6% CH4 in their product gas after just 120 min. From this study an addition of flow during the downtime length improved the product gas quality faster after initiation of the refeed. It is worth noting that the GRT of the studies [18,19] where significantly lower than in this study, which could have an impact on the results.

3.1.3. Downtime of 72 h

It was expected that long downtimes of 72 h would benefit from having a lower temperature and a higher flow. This would correspond with lowering the metabolism rates and having a flow during a longer downtime would maintain the activity of HMs with supply of H2 and CO2. From the 9 different parameters tested the best combination was 12 °C and 20% flow, which resulted in a product gas of 91.0 ± 3.3% CH4 after 180 min (Table 1).
In the study of Strübing et al. [18] a downtime length of 96 h was tested at 25 °C. This resulted in a product gas of 96% CH4 after 216 min. This was a similar result to the effect found with 12 °C in this study. This validates that the need for lowering the temperature, compared to normal operation, during a longer downtime would be beneficial.
While the product gas from this study was not of quality for direct gas grid injection, it was the most efficient combinations of parameters. The effect of having the normal operating temperature during a long downtime length was seen with 52 °C and 0% flow which resulted in a product gas with 30.6 ± 3.6% CH4, 180 min after initiation of refeed.

3.2. Behaviour of BTFs during Downtime Experiments

3.2.1. Temperature Change during Downtime

The temperature of the BTFs were controlled with a heating bath and heating on the outside of the reactor. This results in a slow temperature change when such was implied. For downtime experiments with a different temperature than normal operating temperature, it would take 2–3 h to reach the desired temperature of either 32 °C or 12 °C in the middle of the BTF. The temperature setpoint was changed 150 min before the start of refeeding as in the study of Strübing et al. (2018) [18].
The temperature inside the BTFs were measured from start of refeed, and not in the previous 150 min of reheating. The temperatures at the start of refeed for 32 °C, across all three downtime lengths, was 45.8 ± 1.9 °C and for 12 °C it was 36.4 ± 2.7 °C. The least variation in start temperature was shown for the downtime experiments at 52 °C which had a temperature of 51.3 ± 0.2 °C, at the start of refeed. A reasoning for the lower than 52 °C would be the ambient room temperature where the BTFs was placed was 18–20 °C and would cool down the reactors a bit due to poor insulation of the BTFs. With the methanation reaction being exothermic (Equation (2)) the temperature naturally increased when the conversion rate increased. For further studies an optimization of the re-heating strategy or the way the reactors are configurated should be investigated. The lower temperature did make the comparison a bit less reliable as it is well known that temperature directly effects thermophilic methanogens metabolism rates. This indicated that in the 12 °C and 32 °C studies the results obtained during refeeding were not only an effect of the downtime parameters during the length of downtime but could also be affected by poor reactor configuration which did not results in equal temperatures at initiation of refeed.

3.2.2. Volatile Fatty Acids and pH

The pH and VFA concentration have been measured regularly to monitor how the reactors were affected by the constant change in parameters during operation. The pH has been stable between 8 and 9 throughout the 230 days of downtime experiments. The stable pH was kept due to the NaHCO3 buffer which was used in the nutrient medium along with the lowered H2:CO2 ratio of 3.8:1 [27]. During the methanation some CO2 and H2 have been converted into VFA which was measured. The most abundant VFA in biomethanation was acetate, also reported by other studies as well [27,28,29,30]. In this study acetate concentrations averaged 0.85 ± 0.19 gAcetate L−1 with a maximum of 1.7 gAcetate L−1, which was in the range of other studies. Although acetate concentrations were a bit lower, the total VFA concentrations was 2.3 ± 0.3 gVFA L−1 with a maximum of 4.7 gVFA L−1 at day 8 of the downtime experiments. The VFA concentrations and the pH did not reach levels which would affect the normal operation of the BTFs performance negatively. The measured acetate concentration during the experimental period of 0.85 ± 0.19 gAcetate L−1 with a peak of 1.7 gAcetate L−1 was within other studies which also did not find any negatively effects of these levels [31,32].

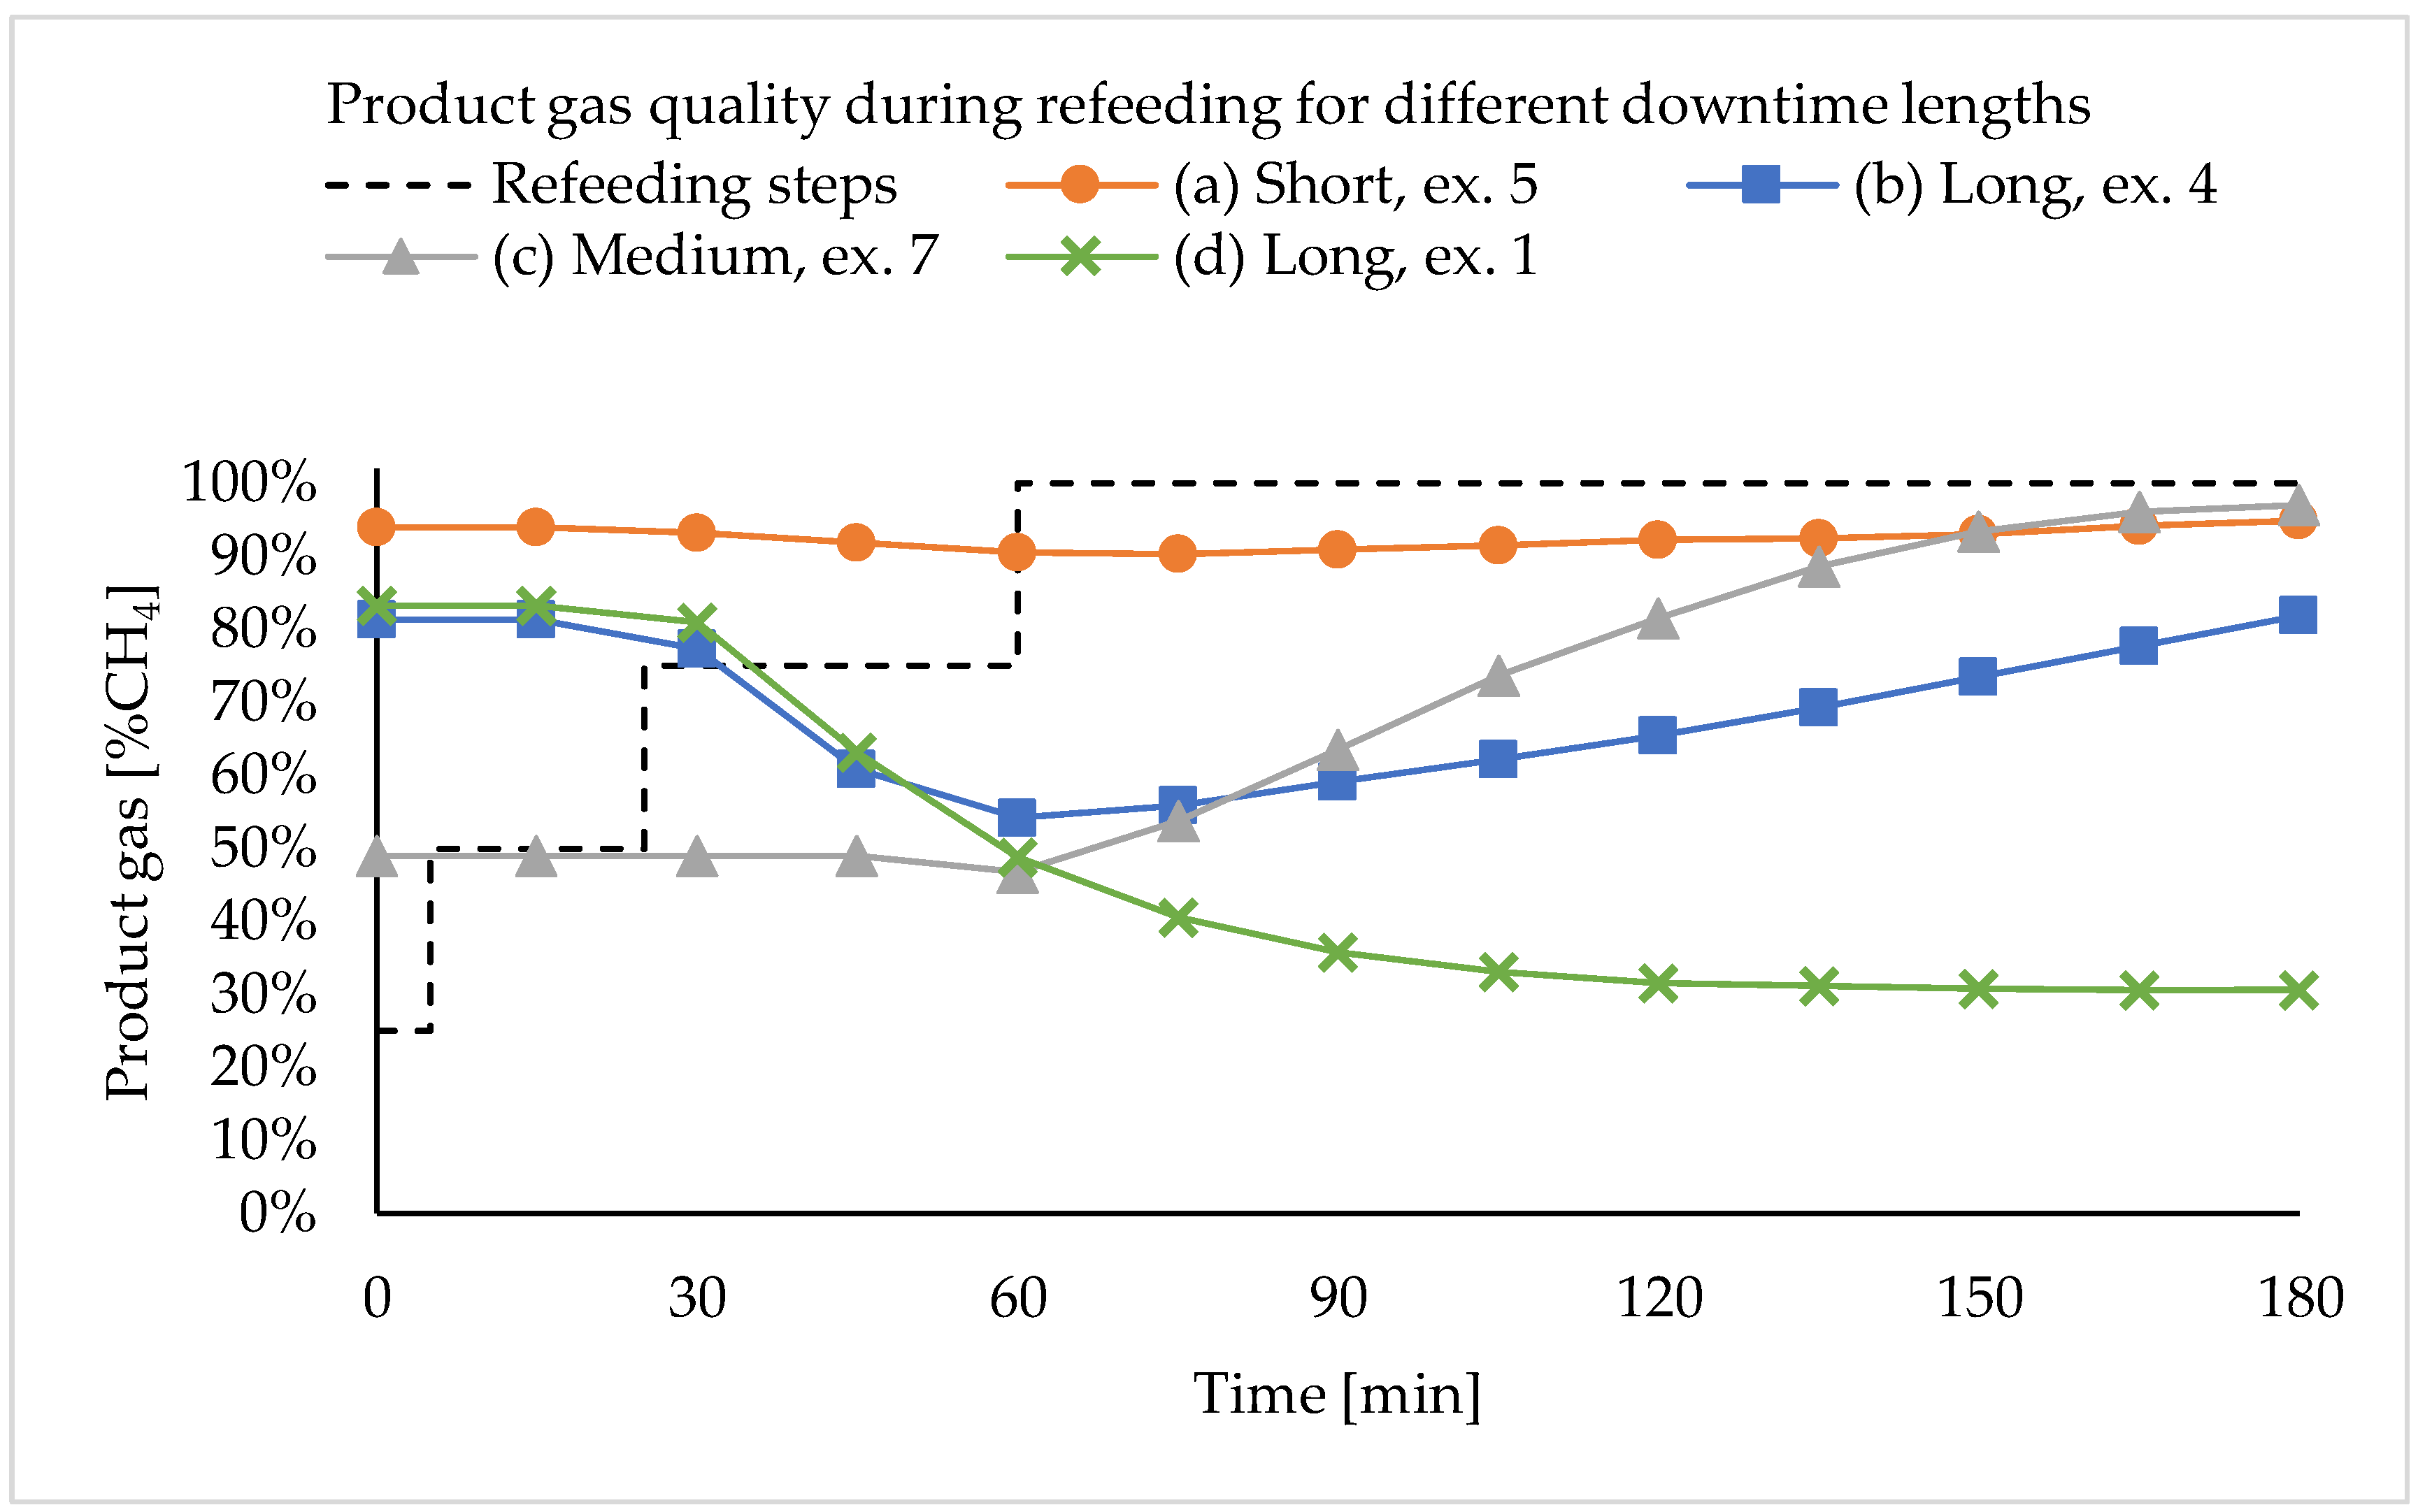
3.3. Product Gas Development after Initiation of Refeeding

When refeeding was initiated, the initial concentrations would reflect the conversion during the downtime and not from the load from refeeding. At full load the retention time was 45 min, and the refeeding program was in 4 steps to reach 100% load in 60 min. The combinations tested showed multiple tendencies throughout the experiments, three of which can be described as drop, lag phase and decrease. Figure 3 shows examples of these tendencies, one for each downtime period to show they were experienced in all downtime periods, and therefore not only a result of the downtime.

3.3.1. Drop Tendency

Drop-tendency was observed after reaching 50% load at 25 min. This drop varied from a few percentages of CH4 in the product gas as seen for 6 h downtime with 32 °C and 10% flow (Figure 3a), to larger drops of almost 30% CH4 as seen for 72 h downtime with 32 °C and 0% flow (Figure 3b). This tendency was also observed in the study of Strübing et al. (2019) [19], but with the same refeeding strategy as used in this study, they only observed drops around 10% in CH4. The larger drop seen for Figure 3b could be explained by the longer downtime along with no gas flow when compared to Figure 3a. Another explanation is the long GRT in this study, while the temperature has also been lower at the initiation of refeed, this could result in a delayed effect on the product gas.

3.3.2. Lag Phase Tendency

Lag phase tendency was observed on all the downtime experiments with temperature of 12 °C. Figure 3c shows the refeeding period of 24 h downtime with 12 °C and 0% flow, where a lag time of 60 min was observed, which also corresponded to the time to reach 100% load. This lag phase was observed for all downtime experiments at 12 °C. When having 10 or 20% flow, the lag phase was halved compared to 0% flow, but still had the slow increase in CH4 in the product gas. The biggest influence on this tendency was the operating temperature. During the downtime the temperature of 12 °C should stop the metabolism of the HMs, but with the still low temperature during initiation of refeed, the metabolism was still very affected by the temperature. The metabolism is highly dependent on the temperature of the reactor and HMs have an optimum between 55 °C and 70 °C, depending on the species [33,34]. The low temperature of 36.4 ± 2.7 °C at the start of refeeding can be related to the metabolism rates found in the study of Gray et al. (2009) [34]. A temperature of 36.4 °C was near the lowest temperature where a CH4 production rate was observed in their study. This would explain the lag-phase observed for all the experiments where 12 °C were used during downtime. From Equation (2) the free energy in the system is −130.8 kJ mol−1 under standard conditions, but when corrected with the conditions of 36.4 °C and having an inlet concentration of 23.8% CH4 the experimental free energy would change. See Equations (4)–(6) for temperature and partial pressure free energy correction (Bastidas-Oyanedel et al. (2008) [35]).
Δ G j o = i n υ i j · Δ G f i o   &   Δ H j o = i n υ i j · Δ H f i o
Δ G j T o = Δ G j o T T o + Δ H j o T o T T o
Δ G j = Δ G j T o + R · T i n υ i j · l n ( C i )
Equation (4) describes the standard Gibbs energy (kJ mol−1) with change in reaction ( Δ G j o ), or standard Enthalpy energy ( Δ H j o ). The free energy (kJ mol−1) is calculated from standard Gibbs, or Enthalpy, energy of formation along with stoichiometric coefficients ( υ i j ) for the reaction, under STP conditions. To correct the Gibbs free energy from standard temperature to operational temperatures ( Δ G j T o ), Equation (5) uses the relation between STP temperature ( T ° ) and operational temperature ( T ). To calculate the experimental Gibbs free energy ( Δ G j ) (Equation (6)), the obtained Δ G j T o is used with the gas constant, 8.314 ∗ 10−3 kJ K−1 mol−1, operational temperature (T), stoichiometric coefficients ( υ i j ) and the actual concentration (Ci). For the concentration, the inlet concentration was used.
It was found that the experimental free energy has increased to −118.4 kJ mol−1, i.e., a slightly less exothermic reaction than at STP conditions. At a normal operating temperature of 52 °C, the methanation would still be an exothermic reaction but would only have a free energy of −111.1 kJ mol−1. Even with the smaller increase in free energy, the HMs would still release heat when converting CO2 and H2 into CH4. The release of energy would be beneficial due to the increase in temperature in the BTF, while higher temperature allows for a higher CH4 production rate [34]. After 60 min of initiation of refeed, the temperature had increased from 34.7 °C to 42.7 °C in the BTF and would have increased the HMs production rate, which could be a beneficial factor to the increase in CH4 in the product gas.

3.3.3. Decreasing Tendency

Decrease-tendency was only observed for the 72 h downtime experiment at 52 °C. For all three gas flows the same decreasing tendency was experienced (Figure 3d). Figure 3d for 52 °C and 0% gas flow was the parameter conditions that reached the largest decrease during refeeding, from 83.2% CH4 at 0 min to 30.6% CH4 at 180 min, which was only a bit higher than inlet CH4 of 23.8%. When the same experiment was conducted with 10% gas flow, the decrease was minimized significantly from 97.5% CH4 at 0 min to 74.7% CH4 at 180 min. These results showed the importance of not having a starvation during longer downtimes, as the results of Figure 3d could be a result of substrate inhibition after a loss of active HMs due to starvation from high downtime temperature and metabolism rates.
It was generally observed throughout all experiments that the three observed and described tendencies were either eliminated or reduced significantly when a gas flow was applied during the downtime. This shows the benefit of having a gas flow which could act as a maintenance flow which would ensure a minimum of activity during downtimes and would help minimize the time needed to reach initial performance.

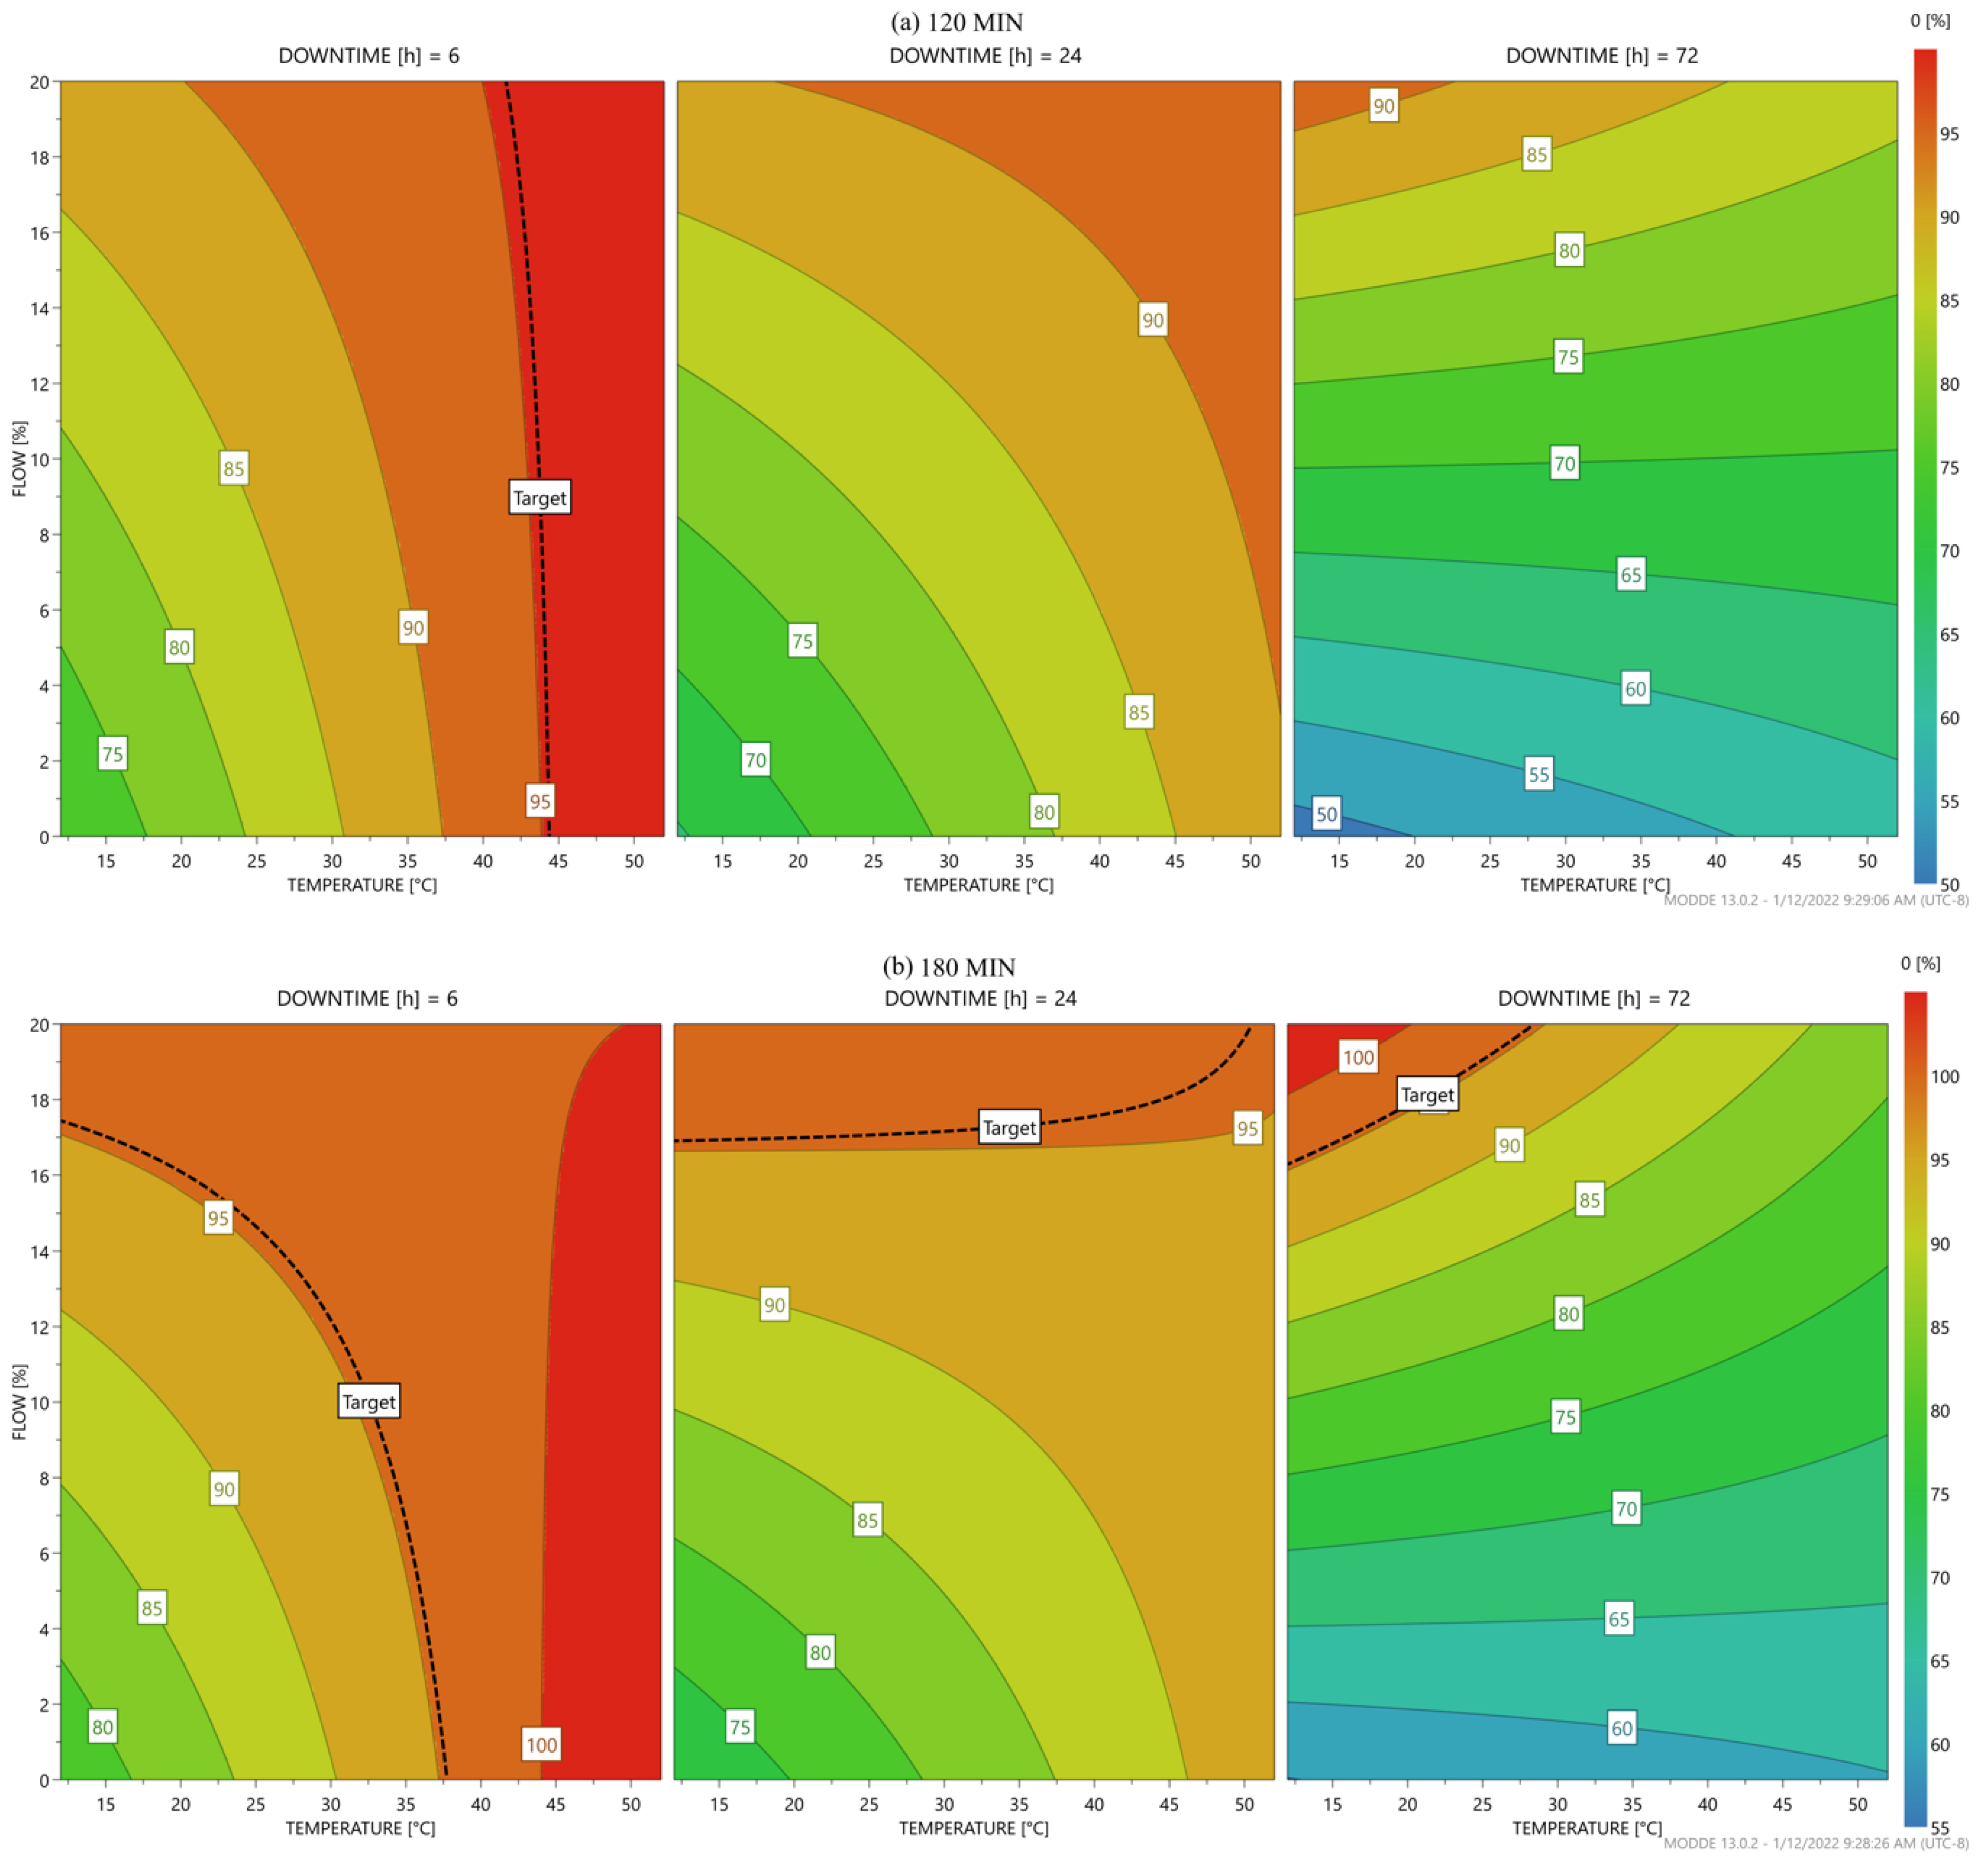
3.4. Estimation of Optimal Parameters for Variating Downtime Lengths

To simulate the optimal parameters based on the results obtained in this study, the software MODDE® was used. MODDE® was used to make contour plots which were based on the data from the experiments including all duplicates and triplicates, when available. Due to the previously discussed change in product gas after initiating the refeeding strategy the contour plots are made for two timestamps; 120 and 180 min after initiating refeed. This would show what combinations of parameters, during the specific downtime, would yield a product gas which had a CH4 content above the gas grid level of 95.4% CH4, which was a requirement for this study. The contour plots constructed with the experimental data in MODDE® are found in Figure 4. The contour plots are constructed in the way that the darker colour corresponds to the higher concentration of CH4. The dotted line on the contour plots named ‘target’ are the gas grid level of 95.4% CH4.
From Figure 4a, the effect of having a gas flow was clear for all downtime periods but became the more dominating factor to reach higher CH4 in the product gas, when the downtime length increased. It is observed that after 120 min of initiating refeed (Figure 4a) only short downtimes of 6 h were able to reach the target product gas quality. It was also observed the shorter downtimes were more affected by the operating temperature during the downtime, compared to a gas flow. Figure 4b shows the contour plots based on the product gas after 180 min from initiating refeed. These contour plots show that it was possible for all downtime periods to reach gas grid levels of product gas. For 6 h downtime, the combination of parameters has not changed significantly between 120 min and 180 min which was higher temperature, >38 °C, combined with gas flows of 0–20% would result in reaching gas grid levels of product gas. If the downtime period was changed to 24 h, the combination needed to involve gas flows of 17–20%, but the temperature was less of significance as it could vary between 12 °C and 50 °C to reach the target value. Longer downtimes of 72 h required a high gas flow of 16–20% along with temperatures <27.5 °C during the downtime, to reach product gas which was of gas grid quality.
Using MODDE® to model all the results obtained in this study (Figure 4) amplified the importance of certain parameter effects based on the downtime lengths. Having a high gas flow during the downtime periods would act beneficially to reach the wanted gas grid levels of 95.4% CH4. The only exception to this was found in the shorter downtime periods of 6 h, where gas flow did not have an influence, but was only affected by temperature. A reasoning for this could be the short time for cooling down the reactor before reheating it, which did not affect the microbial activity compared to longer downtimes. For both downtime periods of 24 h and 72 h a combination high gas flow with a lower temperature benefitted the product gas after 180 min. The hypothesis of a positive effect from cooling the reactor to slow the metabolism was confirmed by the contour plots at Figure 4b.

4. Perspective

For future research within flexibility and downtime, some areas need more investigation. One of these is the control of cooling and heating, which includes the design and configuration of the reactors. This needs to be optimized for better more precise insight in the effect of the tested parameters in this study. It is unknown exactly which effect the lower start temperature during refeeding have had. Another unknown area is the effect of GRT and how a lower GRT would change these results, and how reliable the results found in this study would be. A lower GRT might benefit the process as it is a result of higher productivity, but this could also have a negative effect as this study was a feed limiting experiment. These areas require further investigation to fully understand how this technology scales.
With the modelling and contour plots from MODDE®, the most realistic to use for upscaling would be Figure 4b. Given this shows the end results after 180 min, and therefore the effect of start temperature should be eliminated. This would be the most reliable results for further testing in larger scale. If possible, it would be most optimal to validate all experiments, downtime lengths and combinations, in larger scale BTFs to see the scalability of these results with the biomethanation technology used in this study. As the upscaling of this biomethanation technology have been primarily focused on steady-state operation, there have been no published results of controlled downtime experiments in larger scales.

5. Conclusions

This study successfully demonstrated a way to optimize the flexibility of biomethanation using biological trickling filters. By adjusting the temperature and gas flow during a downtime period, a gas grid quality product gas could be regained within 60 min from initiation of refeeding strategy. The results from this study have provided further foundation to the flexibility of biomethanation in BTFs, and a clear indication that this technology is feasible for commercial scale operations. It indicates how this can be implemented in an intermittent energy system, which is needed with the current energy systems.

Author Contributions

B.D.J.: Conceptualization, Methodology, Software, Visualization, Investigation, Data curation, Formal analysis, Validation, Writing—original draft. L.O.L.M.: Data curation, Writing—review & editing. J.E.S.: Supervision, Writing—review & editing, M.J.: Conceptualization, Methodology, Supervision, Writing—review & editing. J.-R.B.-O.: Visualization, Supervision, Writing—review & editing. All authors have read and agreed to the published version of the manuscript.

Funding

This research was supported by the project “eFuel—Electrofuel from a bio-trickling filter”, which is a Energiteknologisk Udviklings- og Demonstrationsprogram (EUDP) project [Project ID 64018-0559].

Acknowledgments

A great acknowledgement to Niclas Græns from Nature Energy A/S with market analysis and to understand the electrical fluctuations and prices in the market, while also supporting to the illustrations of the electrical market.

Conflicts of Interest

The authors declare no conflict of interest. The funders had no role in the design of the study; in the collection, analyses, or interpretation of data; in the writing of the manuscript; or in the decision to publish the results.

References

  1. European Commission. Energy from Renewable Sources. 2020. Available online: https://ec.europa.eu/eurostat/web/energy/data/shares (accessed on 14 October 2021).
  2. European Commission. 2030 Climate & Energy Framework. 2014. Available online: https://ec.europa.eu/clima/eu-action/climate-strategies-targets/2030-climate-energy-framework_en (accessed on 19 October 2021).
  3. European Commission. 2050 Long-Term Strategy. 2020. Available online: https://ec.europa.eu/clima/eu-action/climate-strategies-targets/2050-long-term-strategy_en (accessed on 19 October 2021).
  4. Lund, H.; Münster, E. Management of surplus electricity-production from a fluctuating renewable-energy source. Appl. Energy. 2003, 76, 65–74. [Google Scholar] [CrossRef]
  5. Sternberg, A.; Bardow, A. Power-to-What?—Environmental assessment of energy storage systems. Energy Environ. Sci. 2015, 8, 389–400. [Google Scholar] [CrossRef]
  6. Díaz-González, F.; Sumper, A.; Gomis-Bellmunt, O.; Villafafila-Robles, R. A review of energy storage technologies for wind power applications. Renew. Sustain. Energy Rev. 2012, 16, 2154–2171. [Google Scholar] [CrossRef]
  7. Thema, M.; Bauer, F.; Sterner, M. Power-to-Gas: Electrolysis and methanation status review. Renew. Sustain. Energy Rev. 2019, 112, 775–787. [Google Scholar] [CrossRef]
  8. Maroušek, J. Review: Nanoparticles can change (bio)hydrogen competitiveness. Fuel 2022, 328, 125318. [Google Scholar] [CrossRef]
  9. Götz, M.; Lefebvre, J.; Mörs, F.; McDaniel Koch, A.; Graf, F.; Bajohr, S.; Reimert, R.; Kolb, T. Renewable Power-to-Gas: A technological and economic review. Renew. Energy 2016, 85, 1371–1390. [Google Scholar] [CrossRef]
  10. Eurostat. Natural Gas Supply Statistics. 2020. Available online: https://ec.europa.eu/eurostat/statistics-explained/index.php?title=Natural_gas_supply_statistics (accessed on 19 October 2021).
  11. Rasi, S.; Veijanen, A.; Rintala, J. Trace compounds of biogas from different biogas production plants. Energy 2007, 32, 1375–1380. [Google Scholar] [CrossRef]
  12. Younas, M.; Kong, L.L.; Bashir, M.J.K.; Nadeem, H.; Shehzad, A.; Sethupathi, S. Recent Advancements, Fundamental Challenges, and Opportunities in Catalytic Methanation of CO2. Energy Fuels 2016, 30, 8815–8831. [Google Scholar] [CrossRef]
  13. Dannesboe, C.; Hansen, J.B.; Johannsen, I. Catalytic methanation of CO2 in biogas: Experimental results from a reactor at full scale. React. Chem. Eng. 2019, 5, 183–189. [Google Scholar] [CrossRef]
  14. Struis, R.P.; Schildhauer, T.J.; Czekaj, I.; Janousch, M.; Biollaz, S.M.; Ludwig, C. Sulphur poisoning of Ni catalysts in the SNG production from biomass: A TPO/XPS/XAS study. Appl. Catal. A Gen. 2009, 362, 121–128. [Google Scholar] [CrossRef]
  15. Burkhardt, M.; Jordan, I.; Heinrich, S.; Behrens, J.; Ziesche, A.; Busch, G. Long term and demand-oriented biocatalytic synthesis of highly concentrated methane in a trickle bed reactor. Appl. Energy 2019, 240, 818–826. [Google Scholar] [CrossRef]
  16. Nord Pool. Historical Market Data|Nord Pool. 2021. Available online: https://www.nordpoolgroup.com/historical-market-data (accessed on 15 November 2021).
  17. Matthischke, S.; Roensch, S.; Güttel, R. Start-up time and load range for the methanation of carbon dioxide in a fixed-bed recycle reactor. Ind. Eng. Chem. Res. 2018, 57, 6391–6400. [Google Scholar] [CrossRef]
  18. Strübing, D.; Moeller, A.B.; Mößnang, B.; Lebuhn, M.; Drewes, J.E.; Koch, K. Anaerobic thermophilic trickle bed reactor as a promising technology for flexible and demand-oriented H2/CO2 biomethanation. Appl. Energy 2018, 232, 543–554. [Google Scholar] [CrossRef]
  19. Strübing, D.; Moeller, A.B.; Mößnang, B.; Lebuhn, M.; Drewes, J.E.; Koch, K. Load change capability of an anaerobic thermophilic trickle bed reactor for dynamic H2/CO2 biomethanation. Bioresour. Technol. 2019, 289, 121735. [Google Scholar] [CrossRef]
  20. Logroño, W.; Popp, D.; Nikolausz, M.; Kluge, P.; Harms, H.; Kleinsteuber, S. Microbial communities in flexible biomethanation of hydrogen are functionally resilient upon starvation. Front. Microbiol. 2021, 12, 619632. [Google Scholar] [CrossRef] [PubMed]
  21. Nan, L.B.; Trably, E.; Santa-Catalina, G.; Bernet, N.; Delgenes, J.-P.; Escudie, R. Microbial community redundance in biomethanation systems lead to faster recovery of methane production rates after starvation. Sci. Total Environ. 2022, 804, 150073. [Google Scholar] [CrossRef]
  22. Bekendtgørelse Om Gaskvalitet, (n.d.). Available online: https://www.retsinformation.dk/eli/lta/2018/230 (accessed on 10 January 2022).
  23. Jønson, B.D.; Sieborg, M.U.; Ashraf, M.T.; Yde, L.; Shin, J.; Shin, S.G.; Triolo, J.M. Direct inoculation of a biotrickling filter for hydrogenotrophic methanogenesis. Bioresour. Technol. 2020, 318, 124098. [Google Scholar] [CrossRef]
  24. Ashraf, M.T.; Yde, L.; Triolo, J.M.; Wenzel, H. Optimizing the dosing and trickling of nutrient media for thermophilic biomethanation in a biotrickling filter. Biochem. Eng. J. 2021, 176, 108220. [Google Scholar] [CrossRef]
  25. Angelidaki, I.; Alves, M.M.; Bolzonella, D.; Borzacconi, L.; Campos, J.L.; Guwy, A.J.; Kalyuzhnyi, S.; Jenicek, P.; Van Lier, J.B. Defining the biomethane potential (BMP) of solid organic wastes and energy crops: A proposed protocol for batch assays. Water Sci. Technol. 2009, 59, 927–934. [Google Scholar] [CrossRef]
  26. Sieborg, M.U.; Jensen, M.B.; Jensen, B.; Kofoed, M.V.W. Effect of minimizing carrier irrigation on H2 conversion in trickle bed reactors during ex situ biomethanation. Bioresour. Technol. Rep. 2021, 16, 100876. [Google Scholar] [CrossRef]
  27. Ashraf, M.T.; Sieborg, M.U.; Yde, L.; Rhee, C.; Shin, S.G.; Triolo, J.M. Biomethanation in a thermophilic biotrickling filter—pH control and lessons from long-term operation. Bioresour. Technol. Rep. 2020, 11, 100525. [Google Scholar] [CrossRef]
  28. Sieborg, M.U.; Jønson, B.D.; Ashraf, M.T.; Yde, L.; Triolo, J.M. Biomethanation in a thermophilic biotrickling filter using cattle manure as nutrient media. Bioresour. Technol. Rep. 2020, 9, 100391. [Google Scholar] [CrossRef]
  29. Tsapekos, P.; Treu, L.; Campanaro, S.; Centurion, V.B.; Zhu, X.; Peprah, M.; Zhang, Z.; Kougias, P.G.; Angelidaki, I. Pilot-scale biomethanation in a trickle bed reactor: Process performance and microbiome functional reconstruction. Energy Convers. Manag. 2021, 244, 114491. [Google Scholar] [CrossRef]
  30. Savvas, S.; Donnelly, J.; Patterson, T.; Chong, Z.S.; Esteves, S.R. Methanogenic capacity and robustness of hydrogenotrophic cultures based on closed nutrient recycling via microbial catabolism: Impact of temperature and microbial attachment. Bioresour. Technol. 2018, 257, 164–171. [Google Scholar] [CrossRef]
  31. Ghofrani-Isfahani, P.; Tsapekos, P.; Peprah, M.; Kougias, P.; Zhu, X.; Kovalovszki, A.; Zervas, A.; Zha, X.; Jacobsen, C.S.; Angelidaki, I. Ex-situ biogas upgrading in thermophilic up-flow reactors: The effect of different gas diffusers and gas retention times. Bioresour. Technol. 2021, 340, 125694. [Google Scholar] [CrossRef]
  32. Thapa, A.; Park, J.-G.; Jun, H.-B. Enhanced ex-situ biomethanation of hydrogen and carbon dioxide in a trickling filter bed reactor. Biochem. Eng. J. 2022, 179, 108311. [Google Scholar] [CrossRef]
  33. Figeac, N.; Trably, E.; Bernet, N.; Delgenès, J.-P.; Escudié, R. Temperature and Inoculum Origin Influence the Performance of Ex-Situ Biological Hydrogen Methanation. Molecules 2020, 25, 5665. [Google Scholar] [CrossRef]
  34. Gray, N.D.; Sherry, A.; Larter, S.; Erdmann, M.; Leyris, J.; Liengen, T.; Beeder, J.; Head, I.M. Biogenic methane production in formation waters from a large gas field in the North Sea. Extremophiles 2009, 13, 511–519. [Google Scholar] [CrossRef]
  35. Bastidas-Oyanedel, J.-R.; Aceves-Lara, C.-A.; Ruiz-Filippi, G.; Steyer, J.-P. Thermodynamic Analysis of Energy Transfer in Acidogenic Cultures. Eng. Life Sci. 2008, 8, 487–498. [Google Scholar] [CrossRef]
Figure 1. Illustration of the variation in electricity spot prices. (a) A representation of the electricity spot price variation that can occur during a full calendar year. (b) Variation that can occur during a 24-h period. Data used for this figure was from Nord Pool [16].
Energies 15 05827 g001
Figure 2. Grouped electrical spot prices for 2020, with overview of periods with consecutive too high electrical price, compared to preset limit, to find downtime lengths that needs investigation. (a) Grouping of electrical spot prices. Blocks indicate the number of periods with that number of periods within that grouping. Line indicates the accumulative number of hours from the number of periods in that hour range. (b) Experimental overview for each length of downtime. The influence of temperature and gas flow gave 9 combinations for each downtime length.
Energies 15 05827 g002
Figure 3. Examples of the drop-, lag phase-, and decrease-tendency observed of product gas quality after start of refeeding. Illustrating the effect of the parameters set during downtime have on the product gas after refeed initiation. Each line represents an experiment for a certain downtime length. (a) Short downtime of 6 h at 32 °C and 10% flow; (b) Long downtime of 72 h at 32 °C with 0% flow; (c) Medium downtime of 24 h at 12 °C with 0% flow; (d) Long downtime of 72 h at 52 °C with 0% flow.
Energies 15 05827 g003
Figure 4. CH4-% in product gas in relation to the effect of the parameters set during downtime lengths for three specific times after initiation of refeeding strategy. The contour plots are divided into three graphs for each downtime length; left graph (6 h), middle graph (24 h) and right graph (72 h). (--) Target product gas quality of 95.4% CH4. Product gasses are shown for periods of (a) 120 min after initiating the refeed of the BTFs; (b) 180 min after initiating the refeed of the BTFs.
Energies 15 05827 g004
Table 1. An overview of the most and least efficient parameters for each downtime period. The most efficient parameters are determined as the fastest time to reach the target gas grid quality. If the target gas quality was not reached for the best performing parameters, the highest gas quality from the operational conditions was used.
DowntimeTemperatureFlowTime after RefeedingCH4SDTarget
[h][°C][%][min][%][%]Quality
Best performing65206098.4- *Yes
parameters2452209096.6±0.7Yes
72122018091.0±3.3No
Least performing612018030.8- *-
parameters24121018090.3±1.2-
7252018030.6±3.6-
* Due to experimental setup, there was not sufficient data for standard deviation.
Publisher’s Note: MDPI stays neutral with regard to jurisdictional claims in published maps and institutional affiliations.

