Article

Relationship between Renewable Biogas Energy Sources and Financial Health of Food Business Operators

by
Marek Cierpiał-Wolan
1,
Jolanta Stec-Rusiecka
2,
Dariusz Twaróg
3,*,
Katarzyna Bilińska
4,
Anna Dewalska-Opitek
5 and
Bogdan Wierzbiński
6
1
Institute of Economics and Finance, University of Rzeszów, 35-601 Rzeszów, Poland
2
The Faculty of Management, Rzeszów University of Technology, 35-959 Rzeszów, Poland
3
Department of Physics and Medical Engineering, Rzeszów University of Technology, 35-959 Rzeszów, Poland
4
Department of Marketing Management and Tourism, University of Economics in Katowice, 40-287 Katowice, Poland
5
Department of Organisational Relationship Management, University of Economics in Katowice, 40-287 Katowice, Poland
6
Department of Marketing and Entrepreneurship, University of Rzeszów, 35-601 Rzeszów, Poland
*
Author to whom correspondence should be addressed.
Energies 2022, 15(16), 5797; https://doi.org/10.3390/en15165797
Submission received: 4 July 2022 / Revised: 4 August 2022 / Accepted: 8 August 2022 / Published: 10 August 2022
(This article belongs to the Special Issue Market in Low-Carbon Energy Transition)

Abstract

:
Biogas production within cooperatives and energy clusters that include both food businesses and biogas plants seems to be a good way to both improve financial health and increase energy self-sufficiency. The paper assesses the financial health of more than 2100 food businesses operating during the period of 2014–2020; the analysis was based on data from public statistics. The financial analysis carried out using the ROS (Return on Sale) indicator and the SI for the study (saving indicator) showed that the average SI/ROS increased by more than 2.78-fold over the study period. Moreover, for 185 powiats, the observed growth remained above average over a period of one to five years. The application of the Data Envelopment Analysis (DEA) method allowed the relative efficiency of biogas utilization to be calculated at the powiat level (former LAU level 1). It was found that the utilization of biogas potential within cooperatives and energy clusters grouping food businesses is most effective mainly for urban powiats.

1. Introduction

The increase in consumption and prices of energy carriers is accompanied by a growing interest in renewable energy sources. The issue of energy efficiency in sustainable development has become very important [1,2]. This problem can be addressed by using renewable energy sources, which, in fact, is gaining much popularity recently. Among the renewable sources currently in use, only low-grade heat [3]; geothermal and bioenergy (e.g., wood, straw, biodegradable waste, biogas, etc.) are independent from weather conditions. This translates into stability of the energy supply, while, in the case of biogas use, it allows waste management and a closed-loop economy [4,5]. In order to be able to reach the goals of the European Union regarding energy and climate by 2030, all Member States must rethink their policy on the production and use of energy sources. It is worth noting that biogas is one of the more stable sources of renewable energy. A stable and predictable energy policy and cross-sectoral cooperation are needed [6] to show the public the full potential of biogas technology. It should be emphasized that Poland reduced the energy production from coal to over 73% in 2019 by adapting its economy to the EU’s energy policy. However, the concept of an energy mix being built is contributing the most to increasing energy security and minimizing the emissions of greenhouse gases. Poland is aiming to increase the share of renewable energy sources, including biogas. The energy transition will be achieved, in part, through the creation of around 300 areas of independent energy cooperatives or energy clusters by 2030 [7]. Achieving this will require, among other things, intensive development of the biogas sector. The development of this sector is widely known in Poland, and many articles describing the potential or development of the biogas sector on a national scale have been published to date [8,9,10]. In some publications, the authors focused on describing investments in selected regions [11,12], the use of one product in a circular economy [13] or described investment costs for selected biogas plants [14]. However, there is still a lack of studies describing the feasibility of energy transition at the level of individual economic sectors in a more interdisciplinary way: combining energy transition plans (government strategies [7], EU directives [15]), economic viability and environmental requirements. The main aim of the paper is to characterize the potential of biogas production at the level of Polish powiats and its impact on the improvement of the effectiveness of operators with particular consideration of the food sector, which could naturally become a partner and beneficiary of a successful energy transition. Taking into consideration the literature studied and the collected research material, the following research hypotheses were formulated in the paper:
Hypothesis 1 (H1).
The large diversity of biogas production potentials in the powiats based on local resources, as well as waste generated by food business operators.
Hypothesis 2 (H2).
The significant impact of biogas potential on the profitability of powiat operators’ sales, with a focus on waste-generating food business operators.

2. Research Methodology

The research was carried out from a local point of view, with the assumption that biogas production is possible throughout the country. This results from the fact that each powiat (former LAU level 1), irrespective of population, location or type of predominant economic activity, is primarily a source of biodegradable waste. The spatial scope of this study covered all powiats in Poland.

2.1. Biogas Potential—Data Sources and Estimation Methods

Biogas is a result of a process called the anaerobic digestion of organic waste, during which organic substances are separated into simple compounds by bacteria. Biogas has its own ecological implications. It is organic in nature, comes from organic waste released from plants (mainly food scraps) and can be used as a substitute for petroleum products in power production. In this process, up to 60% of the organic matter is transformed into biogas. Biogas consists of 50–70% methane (CH4), 25–45% carbon dioxide (CO2), 2–7% water (H2O), 2–5% nitrogen (N2), 0–2% oxygen (O2), less than 1% hydrogen (H2), 0–1% ammonia (NH3) and 0–6000 ppm hydrogen sulfur (H2S) [16]. In landfills, organic waste is being fermented into biogas, which is then used for energy purposes. From the calculations, it was assumed that one ton of waste can produce up to 200 m3 of biogas [17]. The waste generated during agricultural production (manure and crop losses) can also be a source of biogas. In livestock farms, significant amounts of natural fertilizers are produced, which can be used to produce biogas. For the purpose of the calculations, it was assumed that, on average, 1 ton of cattle manure can produce 13.6 m3 of methane, 1 ton of dairy cow manure can produce 15.6 m3 of methane, 1 ton of pig manure can produce 14.4 m3 of methane, 1 ton of dairy sheep/goat manure can produce 48 m3 of methane and 1 ton of poultry manure can produce 51.2 m3 of methane [18,19,20,21,22]. The basis for the calculation of biogas emissions from animal manure originating from particular animal species was the statistical data of Statistics Poland [23]. The analyzed data included livestock population by species (cattle, swine, horses, sheep, poultry and goats) and by functional groups, as well as the average annual production, natural fertilizers depending on the animal species, its age and productivity and the maintenance system. Another source used for biogas production is sludge in sewage treatment plants. According to the data of Statistics Poland [23], in Poland in 2014, there were 968 industrial treatment plants and 3288 municipal treatment plants. In 2018, the number of industrial treatment plants decreased to 882, while the number of municipal treatment plants increased to 3257. In order to calculate biogas emissions from sewage treatment plants, it is assumed that 1 ton of organic dry matter (ODM) can yield 315–400 Nm3 of biogas and 190–240 Nm3 from secondary sludge or activated sludge [24]. In the calculations of the biogas potential from crop losses, the following crops were used: basic cereals with mixtures, potatoes, vegetables, fruits, maize, legumes and oil plants. The data on the losses and wastage of these crops were taken from the Agricultural Statistical Yearbooks [25,26]. In order to estimate the amount of biogas possible to obtain from a plant biomass, data from the publication of S. Martinát et al. [27] and B. Bharathirajaa et al. [28] were used. Further calculations assume that biogas is combusted in cogeneration systems, providing a higher efficiency and allowing a more economical energy production. The calorific value of biogas is about 23 MJ/m3, and further calculations assume that 2.1 kWh of electricity and 9 MJ of heat can be produced from 1 m3 of biogas [29]. The obtained energy production values were compared with the data included in the energy carriers and heating infrastructure balance report prepared by Statistics Poland. Some powiats can have a high consumption of electricity (the so-called parasite power) due to the locations of large utility power plants there. Therefore, further calculations took into account the consumption of electricity, excluding the power industry (Section “D” of the Polish Classification of Activities—PKD) and lignite mining (lignite-fired power plants and lignite mines are, in fact, the same complexes). The model in question assumes that all of the biogas obtained is used to produce electricity and heat distributed using the existing infrastructure.

2.2. Evaluation of Financial Condition—Selected Indicators

In the examined model, it was decided to check to what extent the financial condition of food companies could change in the event that local biogas plants buy biodegradable waste from enterprises (annual average waste collection prices) in exchange by selling them electricity at reduced costs. For the purpose of the calculations, the costs of an electricity purchase were assumed to be 10% lower than the average annual prices of this energy carrier in the competitive market [30]. This type of cooperation and lowering energy prices is possible within cooperatives or energy clusters. This is due to the fact that the energy cooperative does not charge a RES fee, capacity fee, cogeneration fee and excise duty, provided that the total capacity of the installed RES installations does not exceed 1 MW. On the other hand, the economic benefits of participation in the energy cluster translate, among other things, into lower costs of their distribution service and allow to avoid the capacity fee [31].
The calculations were made for operators in Section “C” (industrial processing) of the PKD classification, limited to Divisions: 10 (production of foodstuffs covering: processing and preserving of meat, processing and preservation of fish, processing and preservation of fruit and vegetables, the production of oils and fats of vegetable and animal origin, the manufacture of dairy products, manufacture of cereal milling products and manufacture of bakery products); 11 (production of beverages, including: distillation, rectification and mixing of spirits; production of grape wines, cider and other fruit wines; beer; malt and soft drinks) and 12 (production of tobacco products, which includes the preprocessing of raw tobacco), which produce biodegradable waste as a result of their production. By examining the financial conditions of the operators, the ROS (Return on Sale) indicator was calculated before and after the implementation of the proposed scenario. The ROS indicator was calculated at the powiat level separately for each of the years under study and for the sum of the results and sales revenue from the period 2014–2020, whereas the savings indicator: SI (saving indicator) was calculated as follows:
S I = r e s u l t   o n   s a l e s + s a v i n g s   ( w a s t e   s a l e   a n d   c h e a p e r   e n e r g y ) r e v e n u e   f r o m   s a l e s
where: savings (waste sale and cheaper energy) is the sum resulting from the savings due to the waste sale and purchase of electricity at a reduced price.

2.3. Relative Efficiency

The relative efficiency resulting from the implementation of the studied scenario for the operators in Section “C” at the powiat level was demonstrated by using the Data Envelopment Analysis (DEA) method. This method is based on a set of variables denoting inputs and a set of variables denoting outputs. DEA is a nonparametric linear programming method. The efficiency is given by the quotient of the weighted sum of outputs to the weighted sum of inputs [32]. DEA calculates the maximal efficiency of each Decision-Making Unit (DMU) by selecting weights assigned to inputs and outputs [33]. As a result, relatively effective and ineffective units are identified. This approach also allows the comparison of DMUs with very different structures, nature of outputs and inputs and estimation of unobservable elements resulting from inputs and outputs without using restrictive assumptions about the parameters of the production process [34]. At least one object is always 100% efficient. All units with efficiencies below 100% are compared with the units, which are 100% efficient. This gives the relative efficiencies.
In presenting the idea of the basic DEA model, it should be pointed out that:   y j k   ( j = 1 , , n ) stands for the outputs, and x i k   ( i = 1 , , m ) denotes inputs; k -this are the DMU ( k = 1 , , r ) . In DEA, for each fixed DMU (say t ), an array of weights must be found for the inputs v i t   ( i = 1 , , m ) and outputs w j t   ( j = 1 , , n ) , maximizing the expression:
E f t = j n w j t y j t i m v i t x i t
and satisfying a set of conditions:
w j t > 0   ( j = 1 , , n ) , v i t > 0   ( i = 1 , , m )   i m v i t x i t = 1
E f k = j n w j t y j k i m v i t x i k 1
where: k = 1 , , r .
In this study, the CCR model [35,36] with constant returns to scale described above, with one input and one output, was applied. The inputs were assumed to be sales results, while the outputs were assumed to be savings resulting from sales of biodegradable waste and the purchase of electricity at a lower price.

3. Results

This section presents the results of the ROS calculation by powiat and the impact of the resulting savings (SI—saving indicator). The main focus is on presenting the savings made by the selected operators (Section “C”) as a result of a waste sale for biogas production and the possibility to purchase energy produced from waste at a 10% lower cost.
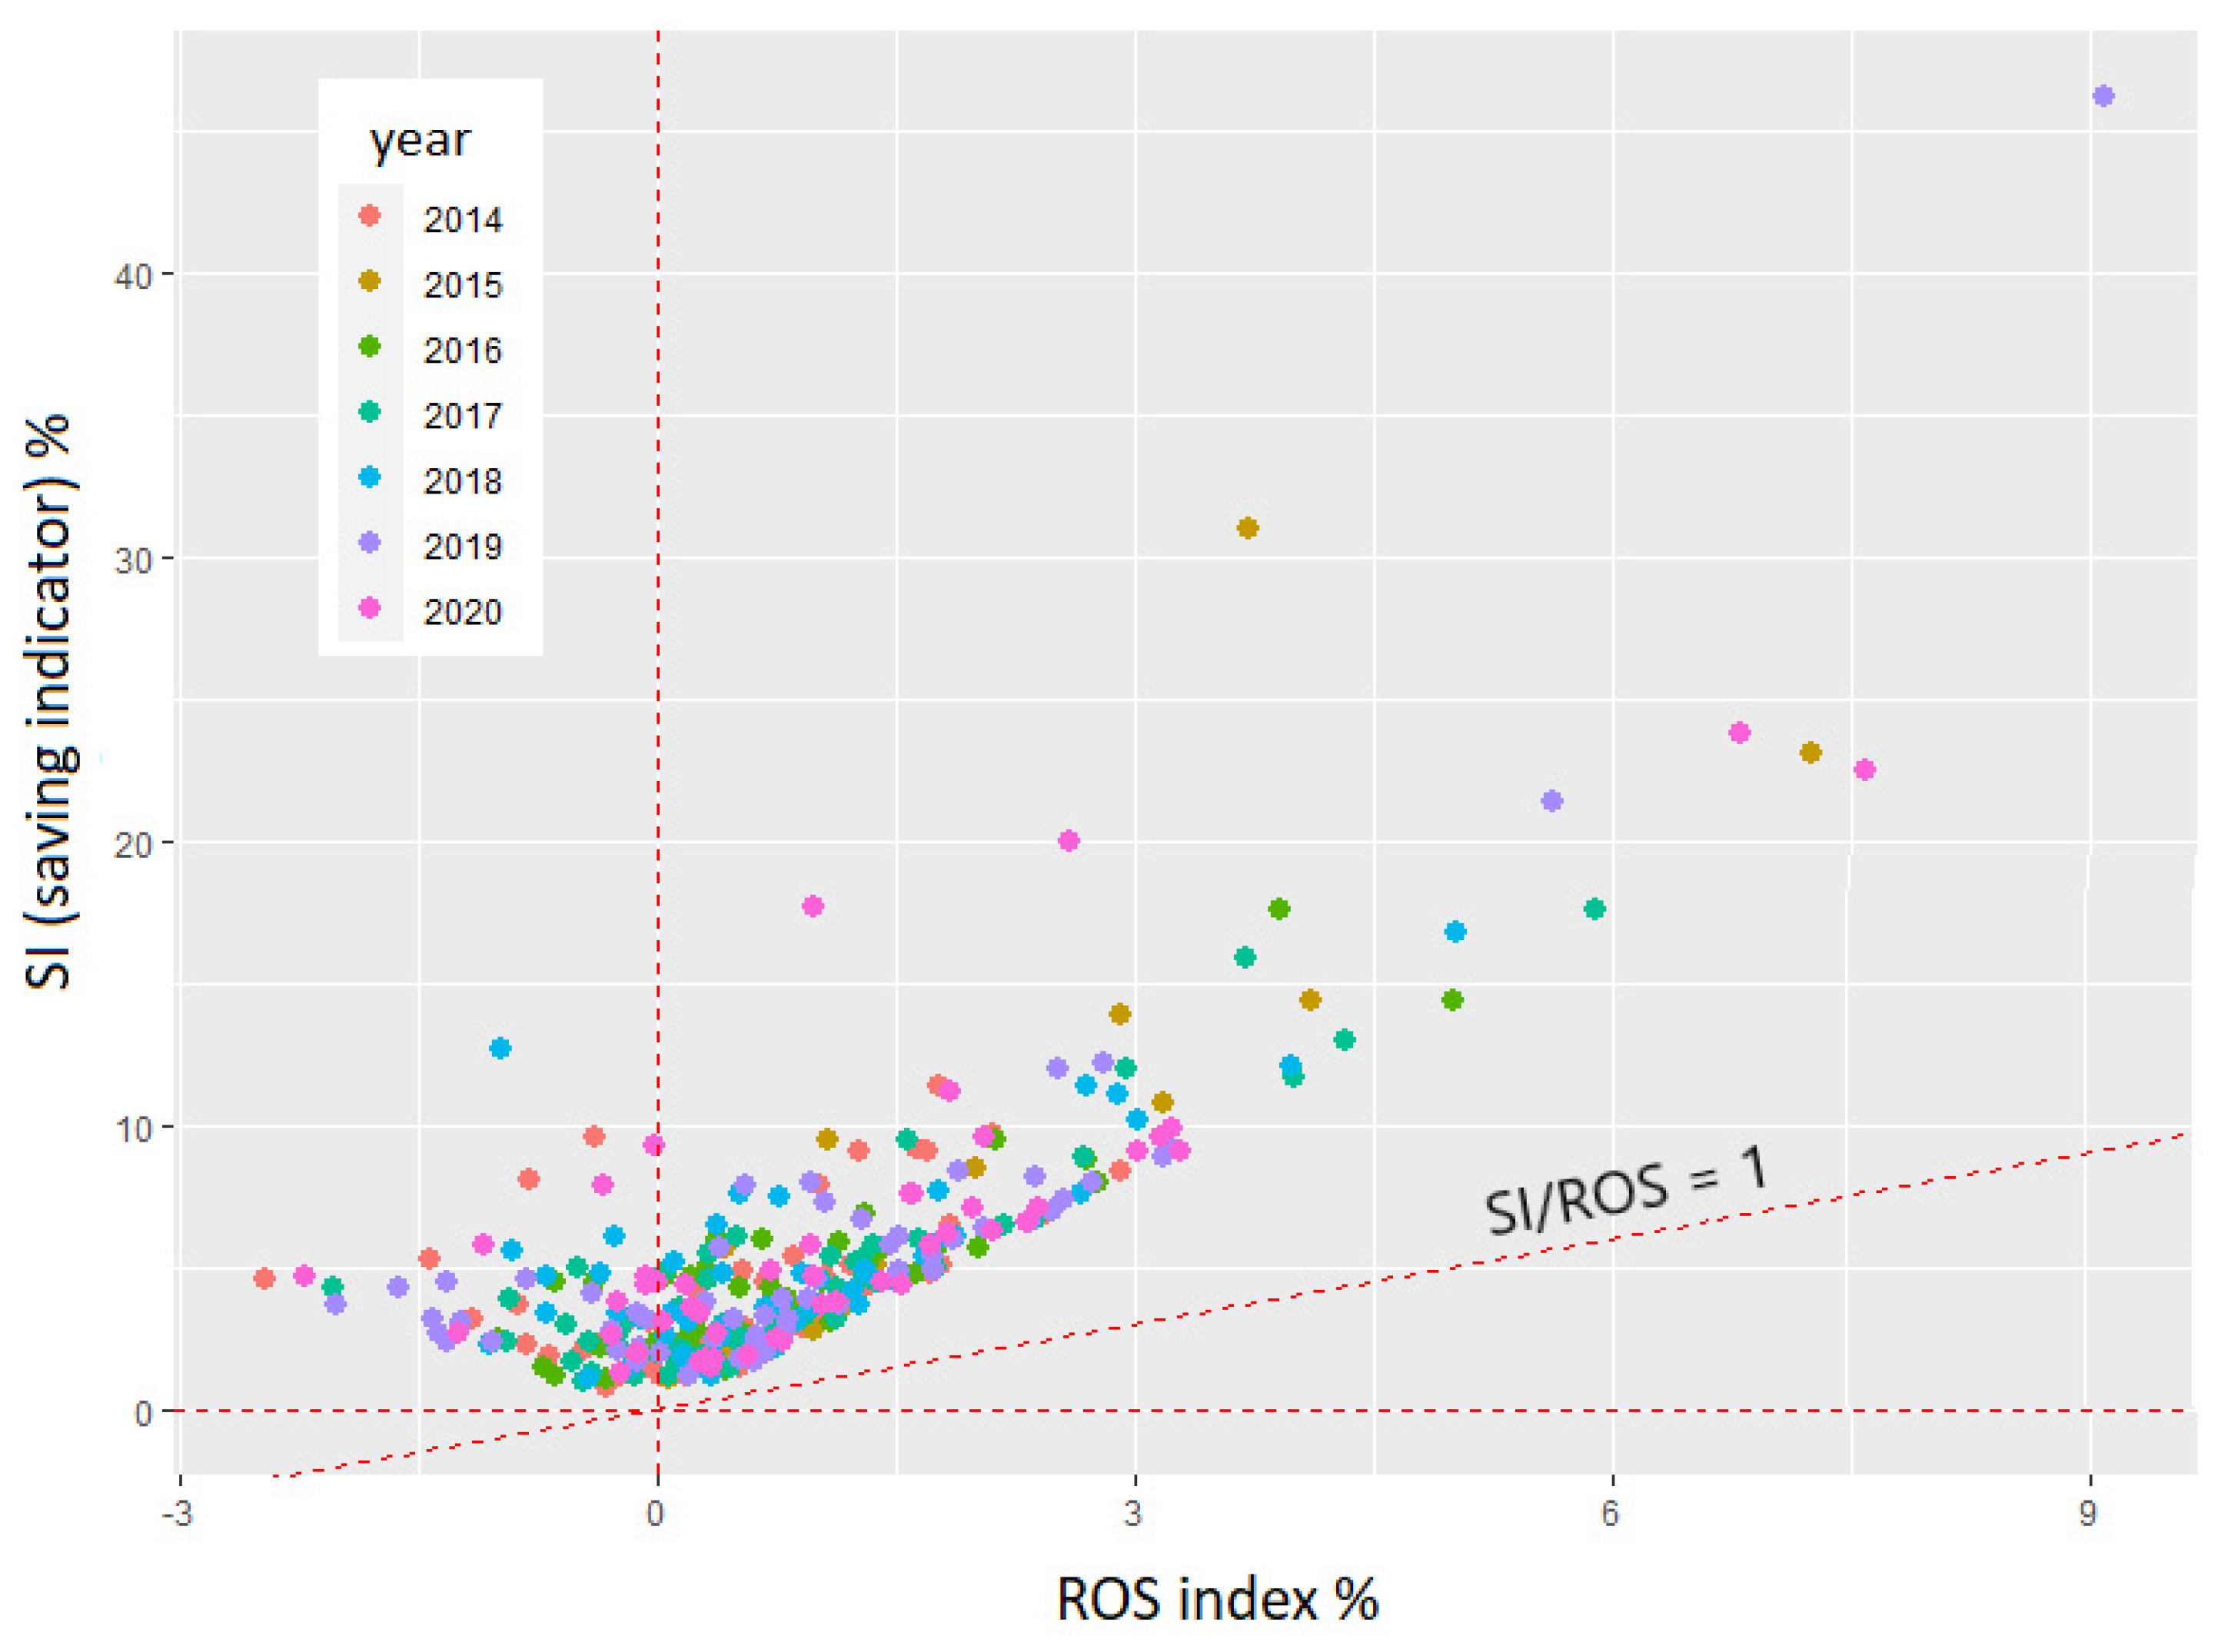
Figure 1 shows the relationship of the ROS index to SI for the sum of 2285 powiats from the period 2014–2020. Powiats in which operators of Section “C” of the PKD classification operate were taken into account. From among this group, only 290 powiats show a negative value of ROS. Taking into account the savings resulting from the sale of biodegradable waste by food business operators and the purchase of electricity from biogas plants at a cost lower by 10% results in a reduction of this number to 118 powiats. Among this group, one rural powiat shows a negative SI value in as many as five years, whereas one urban powiat (city) and three rural powiats show negative values in three researched years. In the examined years, the most powiats show negative values of SI in 2015, but only 6 of these 25 powiats show negative values of SI in the remaining years. It should be noted that the introduction of the studied scenario results in an increase in SI/ROS > 1 for 2167 powiats. Within this group, 108 powiats record a value of SI/ROS > 1 for a period of 7 years, 184 powiats for a period of 6 years, 35 powiats for a period of 5 years, 18 powiats for a period of 4 years, 13 powiats for a period of 3 years, 8 powiats for a period of 2 years and 5 powiats for a period of 1 year. On the other hand, the group showing an increase in SI/ROS < 1 includes 118 powiats, of which only one rural powiat shows such an increase for five years.
The average ROS value seen in Figure 1 is 2.02%, while applying the savings scenario results in an increase to a value of 5.62% (SI ratio). Thus, applying the savings scenario results in an increase of the SI/ROS indicator by more than 2.78 times. This is also the value above which the implementation of the savings scenario would be most advisable. The group of powiats showing an increase in SI/ROS > 2.78 is shown in Figure 2. In 2014, 59 powiats showed values of an increase in SI/ROS > 2.78; in 2015, it was 18 powiats (incomplete national data), 50 powiats in 2016, 63 powiats in 2017, 55 powiats in 2018, 58 powiats in 2019 and 50 powiats in 2020.
Thus, a slight upward trend can be noticed in the studied period. In turn, Figure 3 shows the spatial distribution of the same group of powiats, where the selected colors indicate the powiats showing growth (SI/ROS > 2.78) for a period of one to five years.
During the study period, 353 powiats show more than a 2.78-fold increase in the SI/ROS, out of which only 3 rural and 1 urban powiats maintained this increase for a period of five years, while, for a period of four years, the number increased to 15 powiats (5 urban powiats and 7 rural powiats); for a period of three years, it was 24 powiats and 59 powiats for a period of two years. Spatially, a clustering of powiats showing a 1 to 2-year increase in SI/ROS values > 2.78 is evident in the northern areas of the state.
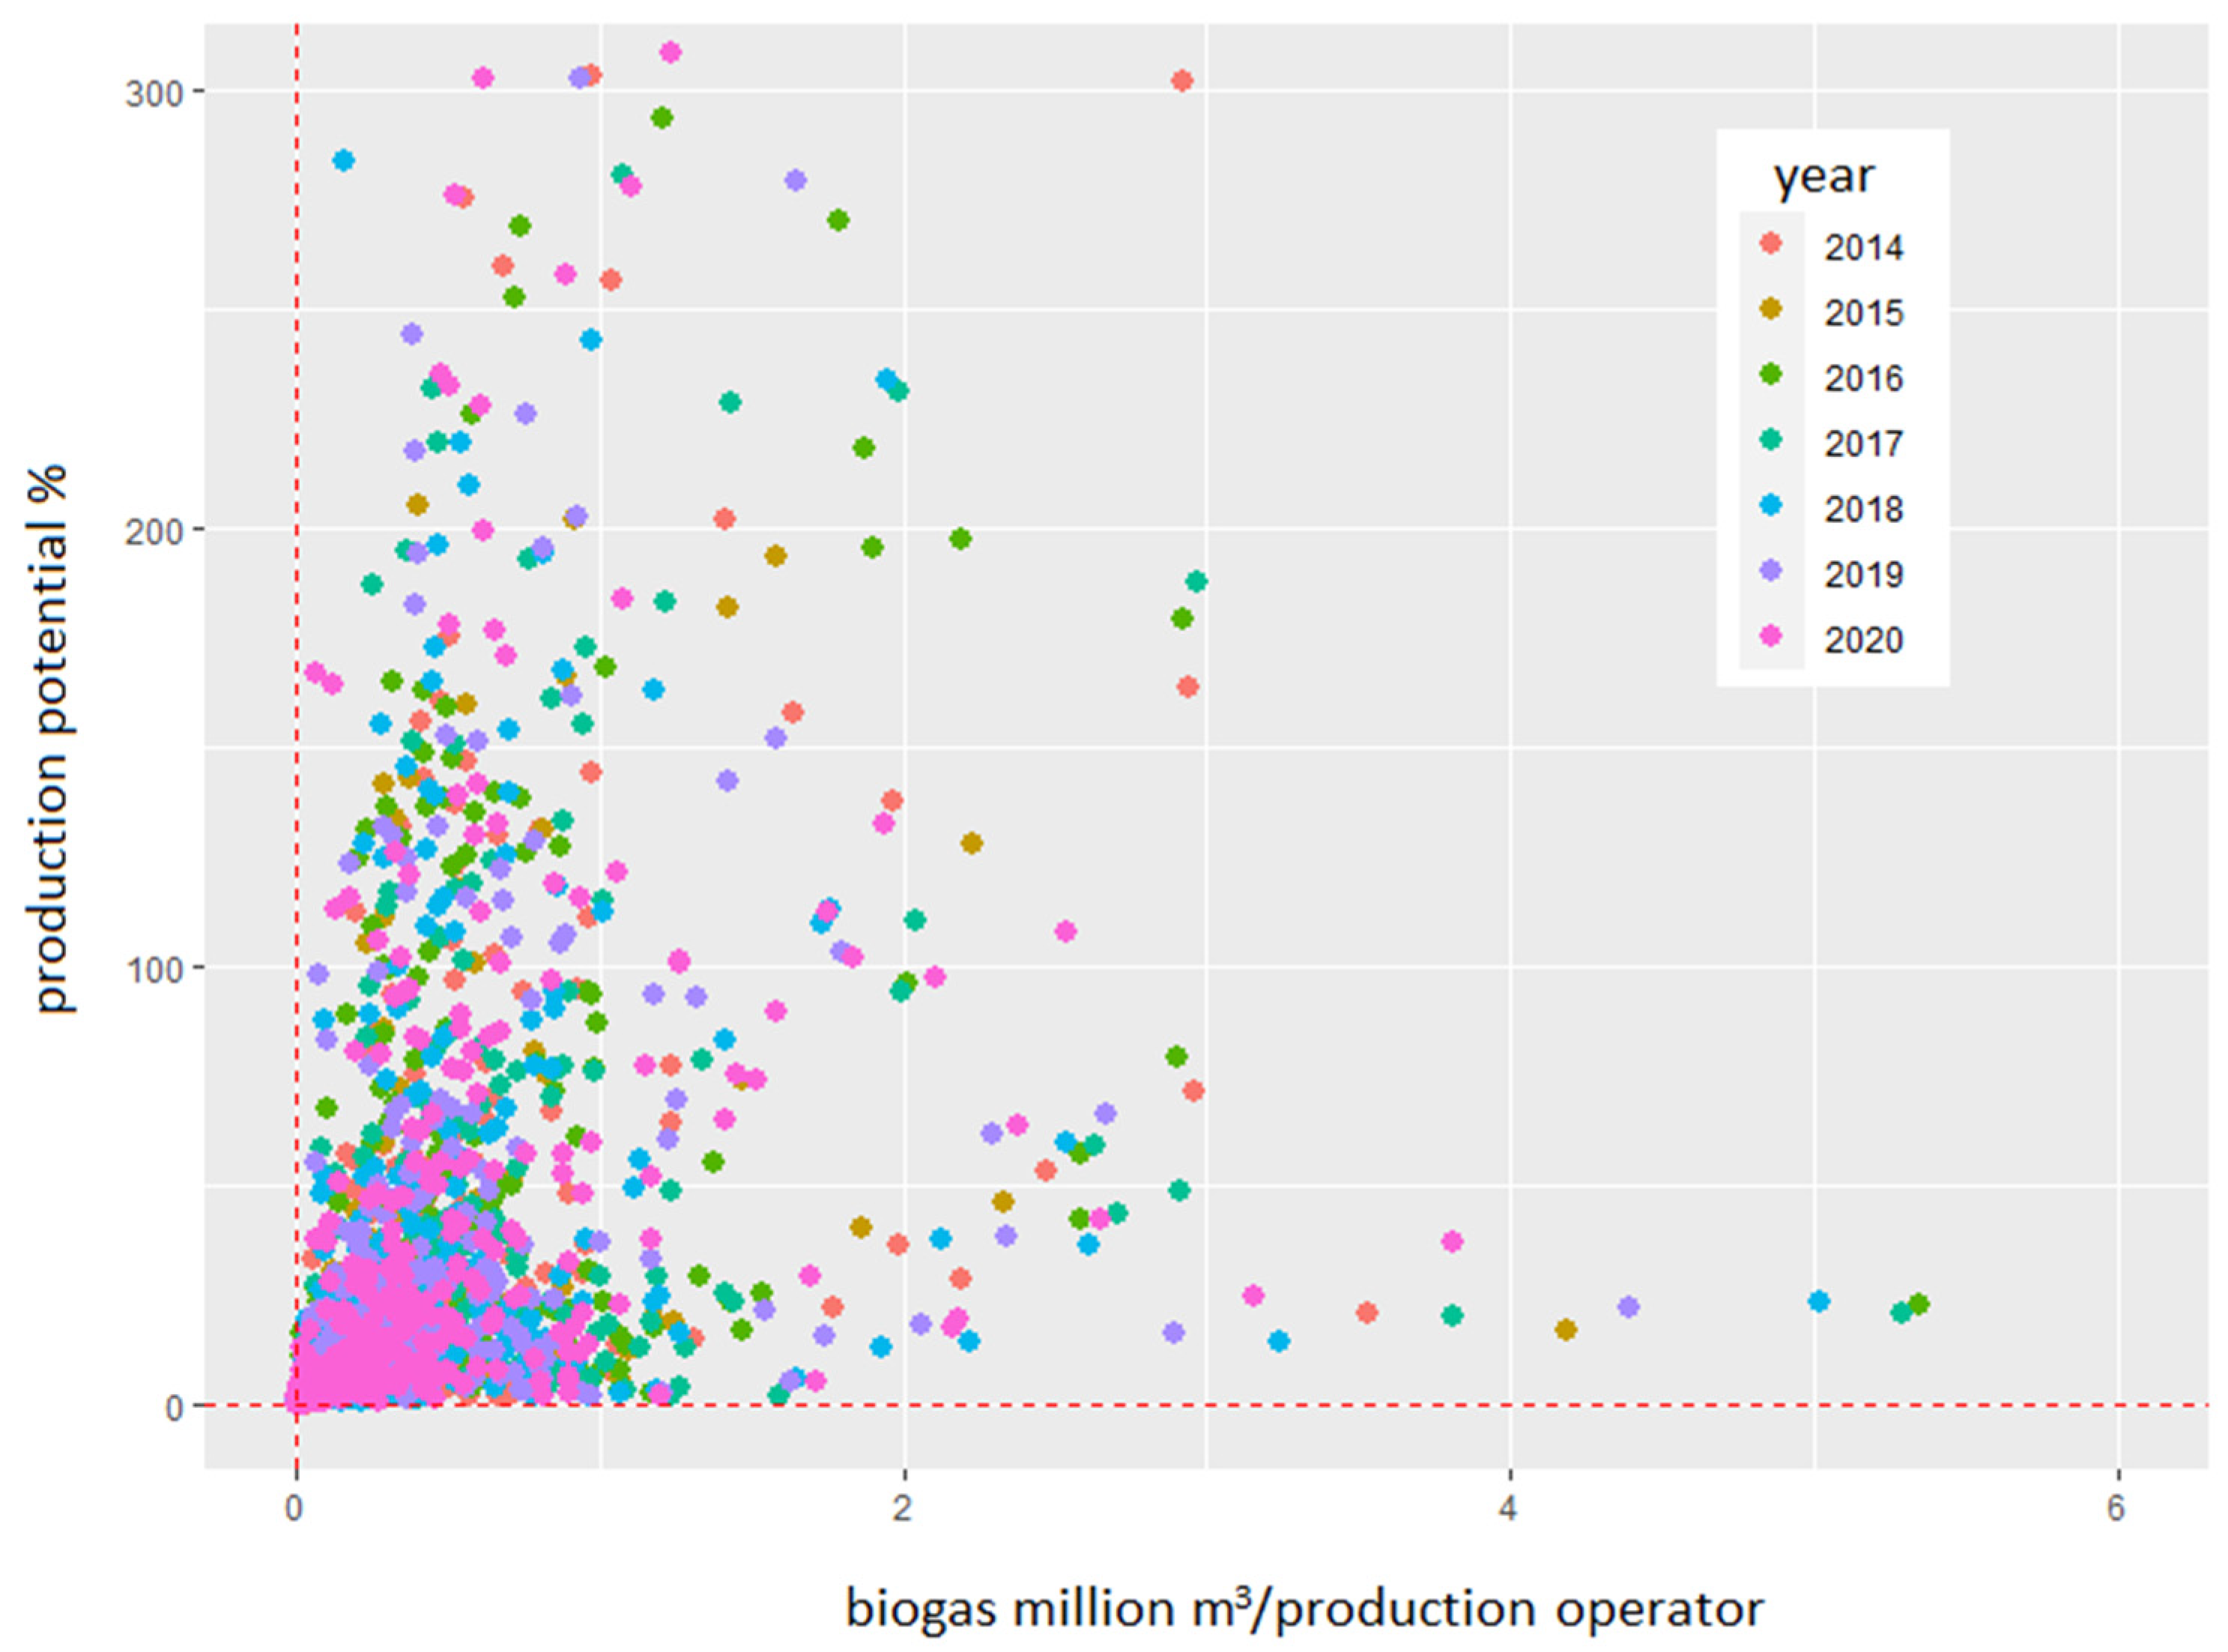
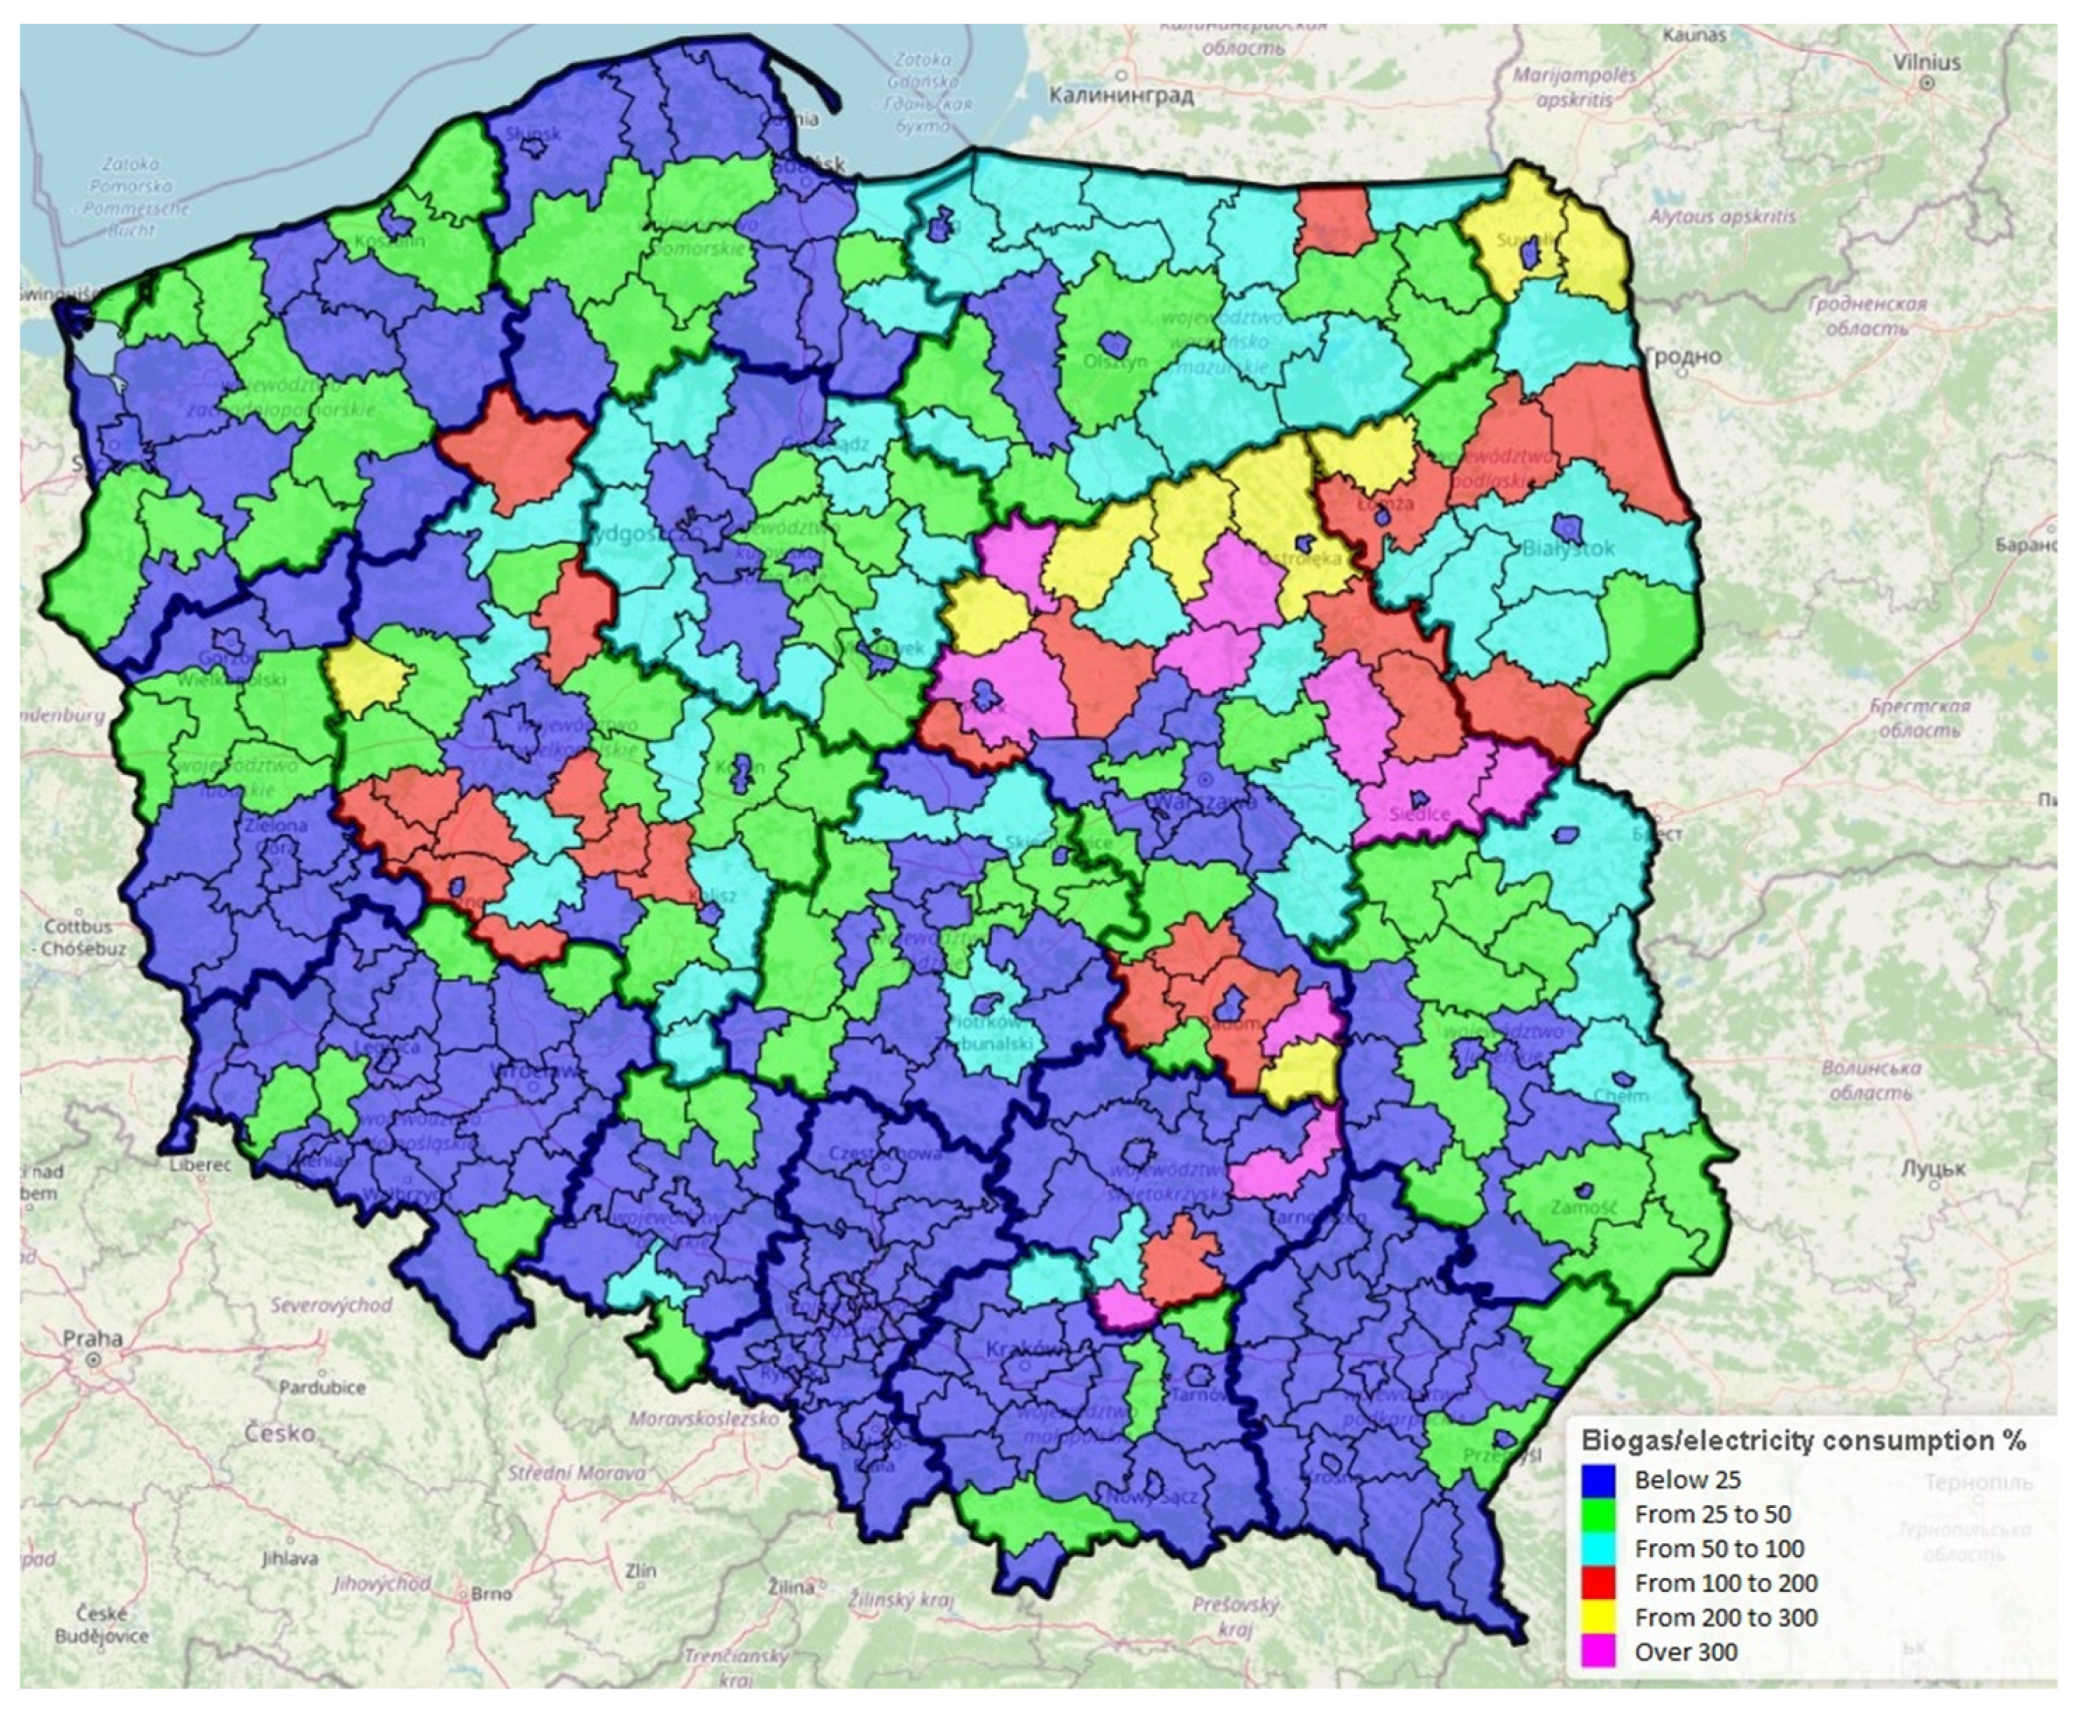
In the study, the authors also wanted to check and show to what extent the energy produced from biogas (derived from their own waste) will cover the energy demand of these operators. This is represented by the production potential, which describes the percentage coverage of the electricity demand produced from biogas relative to the electricity consumption of food business operators generating biodegradable waste. In Figure 4, this indicator is compared with the biogas production potential divided by the number of operators in a given powiat. The coverage of electricity demand from biogas obtainable from their own waste is shown in the table below. Table 1 shows the number of operators that cover their energy demand from their own waste in percentages.
The data collected in Table 1 show that, in each of the years under study, the largest group of powiats are those for which biogas would cover less than 10% of the electricity demand (in the 2014–2020 study period, this is more than 42.5% of the powiats). On the other hand, the total coverage of the electricity demand for food business operators with the possibility of selling the surplus energy would be possible for 13.4% of the powiats (the first row of Table 1). Taking into account another 8.7% from the range of electricity demand coverage from 50% to 100%, we obtained a total group of powiats representing a total of 22.1% for which this type of investment would be most advisable. The relative efficiency of the powiats, calculated using the DEA method, is shown in Figure 5.
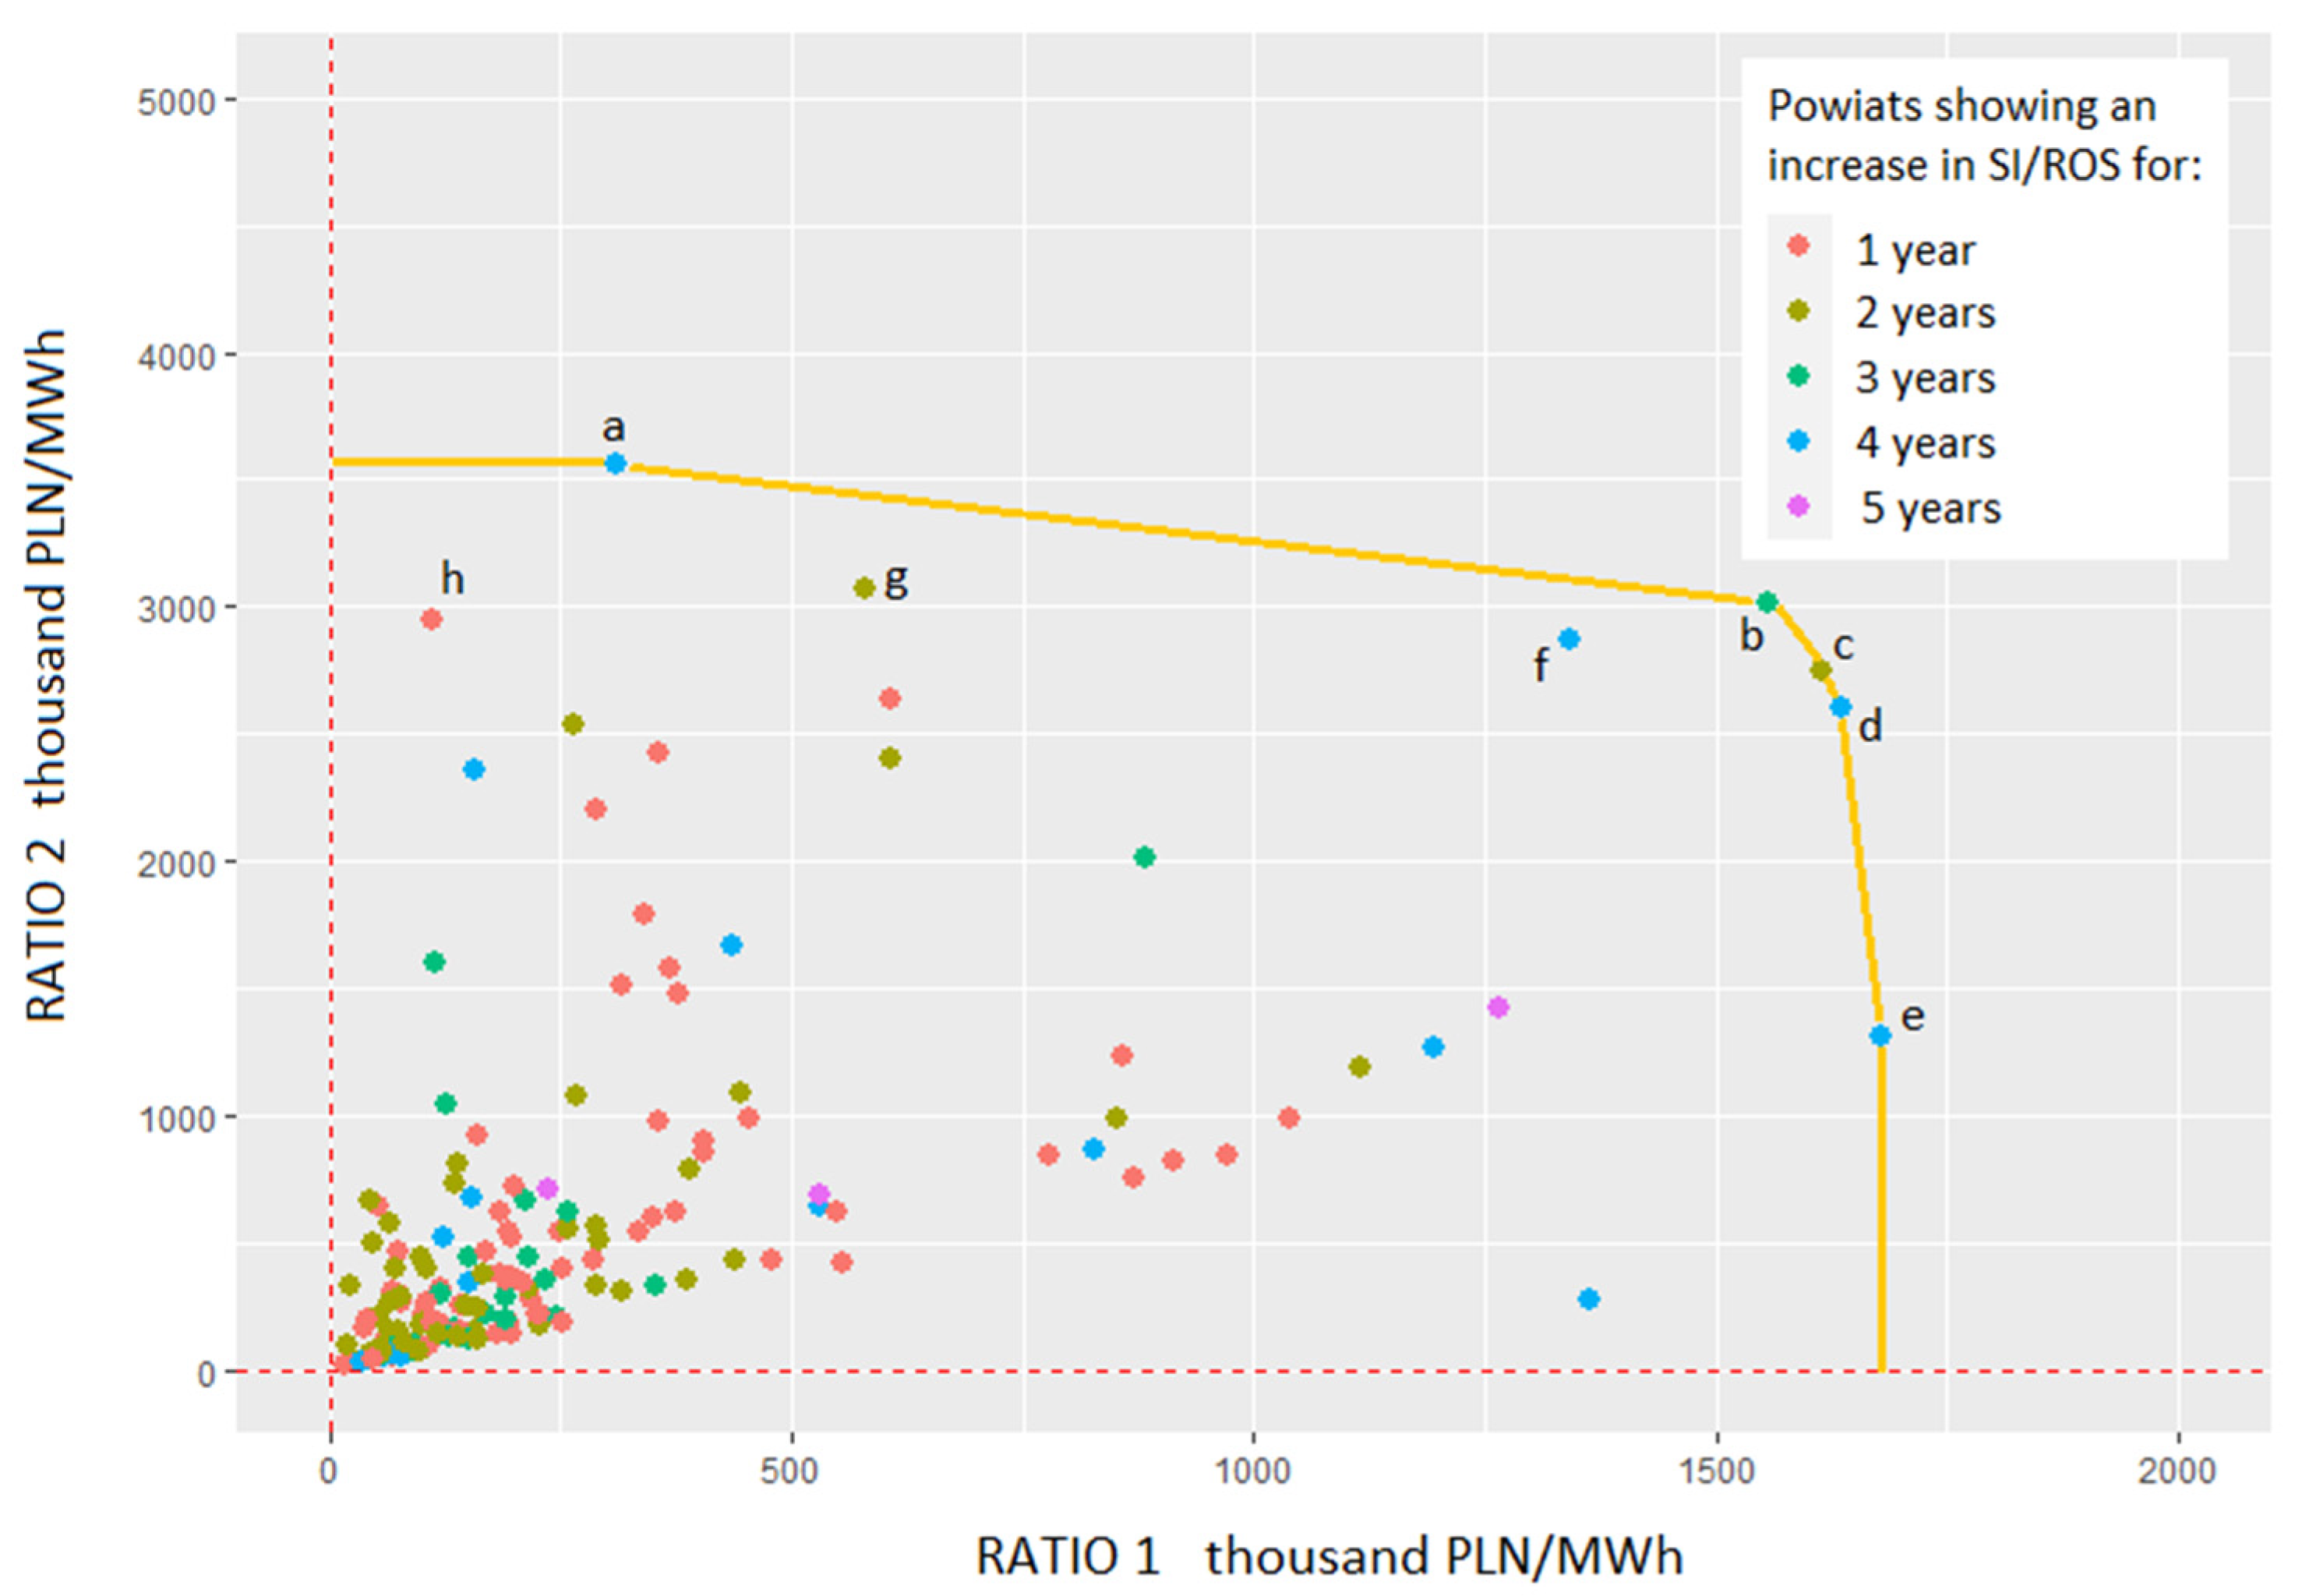
The upper border of relative effectiveness visible in Figure 5 (orange curve) is formed by the urban powiats: the city of Toruń (a), the city of Sopot (b) and the city of Świętochłowice (c). The powiat—the capital city of Warsaw (d), which shows the largest potential of biogas production in the country, reaching 130 million m3 yearly, is also close to the border of effectiveness. Good effectiveness values are also characteristic of such cities as Olsztyn (e), Lublin (f), Katowice (g) and Siedlce (h). The abovementioned group of powiats shows the highest relative effectiveness resulting from a waste sale and the purchase of electricity at a lower price. On the other hand, rural powiats, because of agricultural production, often possessing greater biogas production potential than urban powiats, are gathered mainly near the beginning of the coordinate system (Figure 5). A higher relative effectiveness of urban powiats in relation to rural powiats results from the fact that many large food business operators are located in urban centers. In the case of rural powiats, we do not observe this kind of concentration. Moreover, the operators located there usually stand out with lower sales and income results.
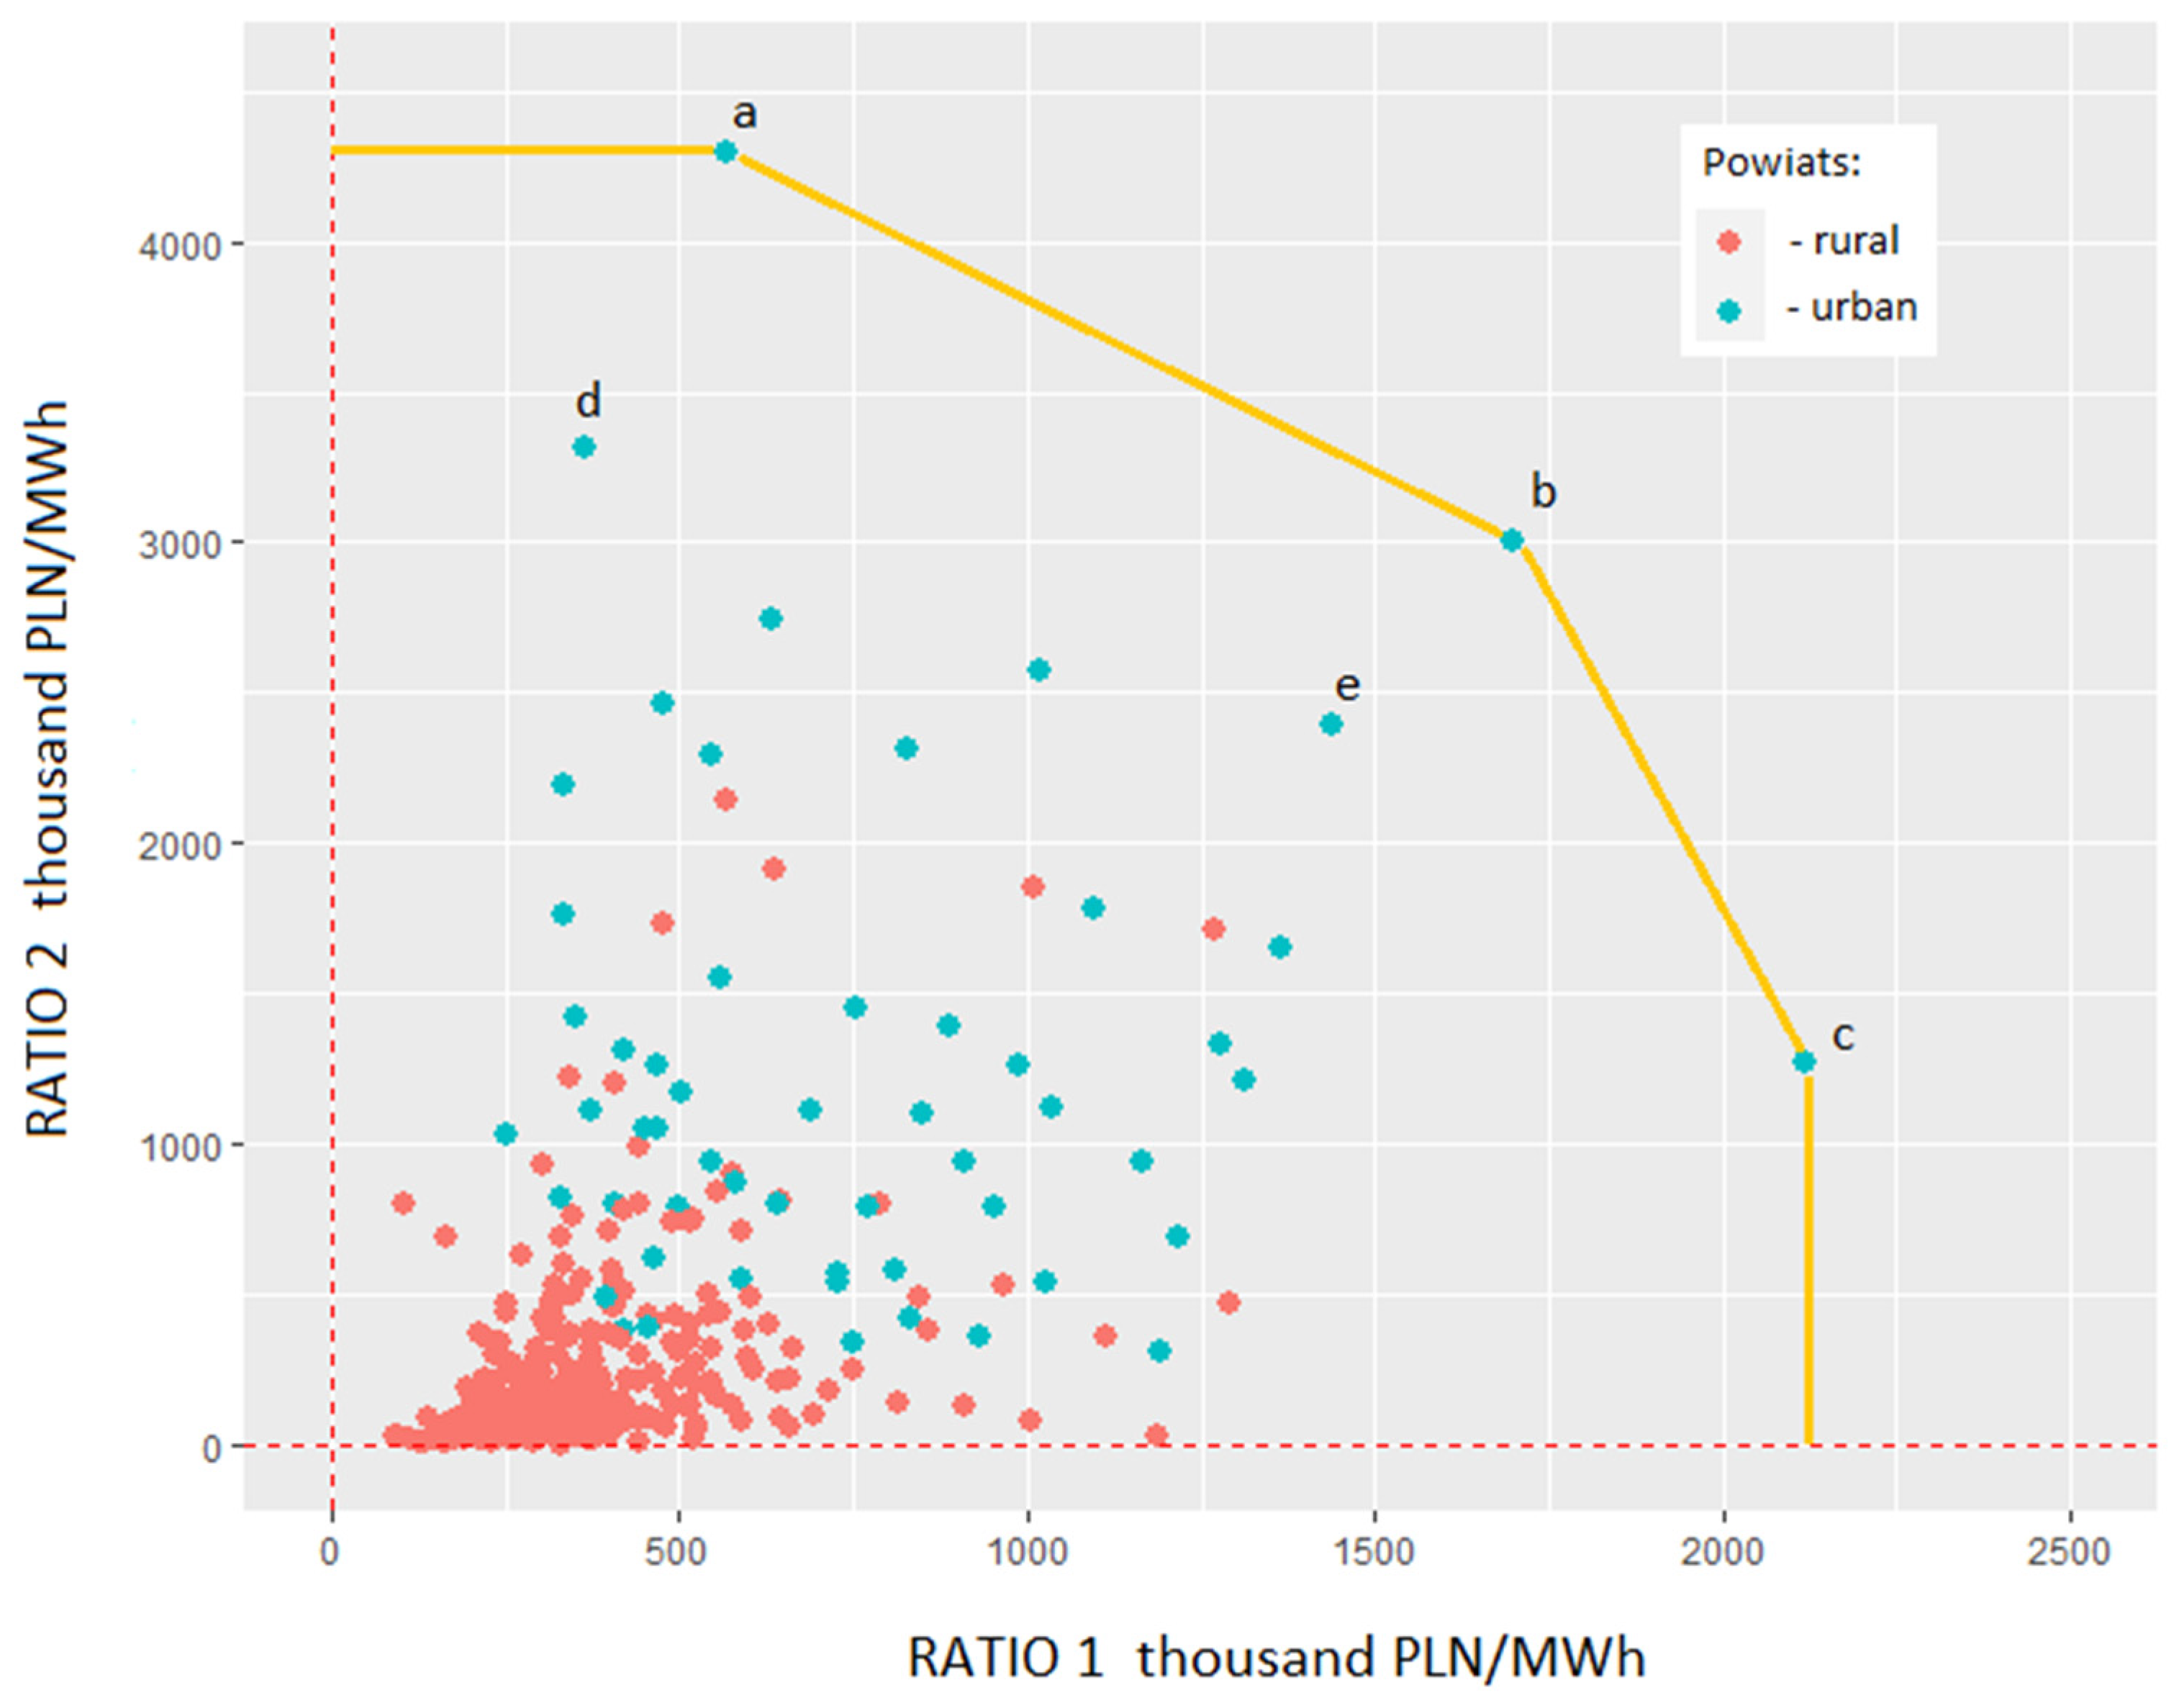
The concentration of operators in cities results from the fact that, in the case of calculating the relative efficiency for all operators in powiats (excluding Section “D”—the power industry), the boundary of relative efficiency is also built by urban powiats: the capital city of Warsaw (a), the city of Bielsko-Biała (b) and the city of Mysłowice (c). Close to the efficiency border, there are also rural powiats: the city of Płock (d) and Lubinski powiat (e) (Figure 6). Therefore, both in the case of a single sector of operators (Section “C”), as well as their larger group (excluding Section “D”), the factor determining the possibility of increasing the relative efficiency is the tendency for industrial operators to cluster in urban centers. This phenomenon is not observed in the case of rural powiats, which, on the one hand, have a large potential of biogas production and, on the other hand, lack larger industrial plants. To confirm this fact, we can cite the research on renewable energy sources conducted by Statistics Poland. Figure 7 shows the number of biogas plants located in cities and rural areas in 2020.
As can be seen in Figure 7, in 2020, most of the biogas plants were located in urban areas (252 out of a total of 306 installations). In the Mazowieckie region, as many as 47 out of 54 biogas plants in operation were located in cities, while, in the Śląskie region, 34 out of 35 biogas plants were urban installations. In the Łódzkie and Lubuskie regions, all the biogas plants in operation were located in urban areas. On the other hand, the great potential of the agricultural regions built mainly on natural fertilizers (e.g., Podlaskie region, with the largest number of cattle per agricultural area in the country) is not reflected in the number of rural biogas plants located there. Moreover, such a tendency concerning the location of biogas plants was maintained throughout the entire period studied. In order to better illustrate this disproportion, the biogas production potential calculated according to the methodology presented in Section 2.1 was compared to the current energy consumption. The results are presented graphically in Figure 8. On a national scale, the production of electricity from biogas can cover more than 11% of electricity consumption. The leader among the regions (NUTS 2) is Podlaskie, where biogas could cover about 53% of the electricity consumption. This is mainly connected with intensive cattle breeding in that region but also with the lack of energy-intensive industries. The following regions also have a high potential of electricity production from biogas: Warmińsko-Mazurskie (27.8%) and Wielkopolskie (21.4%), which is also connected with the intensive agricultural production in these areas. The smallest potential in terms of the biogas energy production is that of the Śląskie region (3.6%), whose biogas production potential is more than double that of the Podlaskie region, but the electricity consumption due to the heavy industry located there is more than nine times greater [23].
The results of the calculations show that, in the case of biogas use for electricity production, only 42 powiats with a developed agricultural economy could achieve energy independence. Most of them were located in Central and Northeastern Poland. In many powiats located in the Mazowieckie and Podlaskie regions, the value of this indicator exceeds 100%.
However, as it was presented before, the benefits for the operators (especially in Section “C”—dealing with food processing and generating biodegradable waste) are much greater in urban centers with a light industry, and the location of biogas plants in these powiats will translate into an increase in the economic indicators of this section of the economy.

4. Conclusions

According to Statistics Poland (GUS), there were 306 biogas plants operating in Poland in 2020, producing a total of approximately 450 million m3 of biogas. More than 44.2% of this biogas was produced in sewage treatment plants, while agricultural biogas accounted for more than 47.2%, with the utilization of food processing waste and process sludge from the agro-food industry in the case of agricultural biogas plants, totaling approximately 14% (approx. 29.6 million m3 biogas). When comparing this value with the potential of food industry waste (~586 million m3 biogas), it is clear that this source is only being used in about 5%. In an era of rising energy prices (in 2014, the cost of 1 MWh for consumers was 39.41 EUR; in 2020, it was 55.53 EUR, and in the first quarter of 2022, the price reached 98.39 EUR) [37], it can be seen that the production of electricity within cooperatives or clusters could provide a remedy for food producers by effectively improving their financial performance.
The electricity coverage ratio for Section “C” (Table 1) shows that there are many powiats where the biogas covers less than 10% of electricity demand. However, the group of powiats for which the coverage of energy consumption exceeds 100% constitutes more than 13.4% of the total examined population. For another 8.7%, the coverage of electricity demand is between 50 and 100%. This gives a total of 22.1% of all the powiats in which this kind of cooperation in the frame of energy clusters would be the most profitable. Therefore, Hypothesis 2 was positively verified.
In the case of selected aspects of the analysis of the financial condition of the operators of Section “C”, it should be noted that only 290 powiats (out of 2285) achieved a negative financial result in 2014–2020. On the other hand, taking into account the savings resulting from biodegradable waste sale by local biogas plants and the purchase of electricity from them at a cost of 10% less results in a reduction of this number to 118 powiats. Considering the impact of biogas potential on the profitability of operators’ sales, it turned out that the proposed “saving scenario” can significantly change the picture of the financial situation of the operators located in these powiats.
The financial analysis carried out using the SI/ROS indicator showed an average increase of more than 2.78-fold over the study period (2014–2020); 185 powiats showed growth above the average in the period from one to five years. This kind of information on the financial health of the food sector should be helpful for the creation of nearly 300 cooperatives or energy clusters nationwide [7]. The proposed savings indicator (SI) makes it possible to identify the group of powiats for which the scenarios of biodegradable waste management will be the most cost-effective. This is also confirmed by the DEA analysis, which shows the dominant role of urban powiats in the effective utilization of biodegradable waste. In order to provide a comprehensive overview of the profitability of waste management and its impact on the development of operators, the investment costs associated with biogas plant construction and development of the transmission network should be considered. Such an analysis should take into account different scenarios for financing such investments (including the possibility of obtaining financing by operators), as well as ways of implementing such investments, e.g., as part of public–private partnerships.

Author Contributions

Conceptualization, M.C.-W., J.S.-R., B.W., K.B., A.D.-O. and D.T.; methodology, M.C.-W., D.T. and J.S.-R.; software, D.T.; validation, D.T., M.C.-W.; formal analysis, M.C.-W., J.S.-R., K.B., A.D.-O., B.W. and D.T.; investigation, M.C.-W., D.T. and J.S.-R.; resources, M.C.-W. and D.T.; data curation, D.T.; writing—original draft preparation, D.T., J.S.-R., K.B., B.W. and A.D.-O.; writing—review and editing, D.T.; visualization, D.T.; supervision, M.C.-W., K.B., A.D.-O., B.W. and J.S.-R.; project administration, M.C.-W., K.B. and B.W.; funding acquisition, M.C.-W., K.B., J.S.-R. and B.W. All authors have read and agreed to the published version of the manuscript.

Funding

This research received no external funding.

Institutional Review Board Statement

Not applicable.

Informed Consent Statement

Not applicable.

Data Availability Statement

Not applicable.

Conflicts of Interest

The authors declare no conflict of interest.

References

  1. Jalali Sepehr, M.; Haeri, A.; Ghousi, R. A cross-country evaluation of energy efficiency from the sustainable development perspective. Int. J. Energy Sect. Manag. 2019, 13, 991–1019. [Google Scholar] [CrossRef]
  2. Damyanova, S.; Beschkov, V. Biogas as a Source of Energy and Chemicals. In Biorefinery Concepts, Energy and Products; Intech Open: London, UK, 2020. [Google Scholar] [CrossRef]
  3. Li, W.; Ma, J.; Qiu, J.; Wang, S. Thermocells-enabled low-grade heat harvesting: Challenge, progress, and prospects. Mater. Energy 2022, 27, 101032. [Google Scholar] [CrossRef]
  4. Kit Leongab, Y.; Changabcd, J. Integrated role of algae in the closed-loop circular economy of anaerobic digestion. Bioresour. Technol. 2022, 360, 127618. [Google Scholar] [CrossRef]
  5. Circular Economy in Practice: A Value Loop for the Biogas, Substrate and Mushrooms Industry. Available online: https://ec.europa.eu/research-and-innovation/en/projects/success-stories/all/circular-economy-practice-value-loop-biogas-substrate-and-mushrooms (accessed on 22 July 2022).
  6. Winquist, E.; Van Galen, M.; Zielonka, S.; Rikkonen, P.; Oudendag, D.; Zhou, L.; Greijdanus, A. Expert Views on the Future Development of Biogas Business Branch in Germany, The Netherlands, and Finland until 2030. Sustainability 2021, 13, 1148. [Google Scholar] [CrossRef]
  7. Serwis Rzeczypospolitej Polskiej. Available online: https://www.gov.pl/web/klimat/polityka-energetyczna-polski-do-2040-r-przyjeta-przez-rade-ministrow (accessed on 24 July 2022).
  8. Igliński, B.; Buczkowski, R.; Iglińska, A.; Cichosz, M.; Piechota, G.; Kujawski, W. Agricultural biogas plants in Poland: Investment process, economical and environmental aspects, biogas potential. Renew. Sustain. Energy Rev. 2012, 16, 4890–4900. [Google Scholar] [CrossRef]
  9. Muradin, M.; Foltynowicz, Z. Potential for Producing Biogas from Agricultural Waste in Rural Plants in Poland. Sustainability 2014, 6, 5065–5074. [Google Scholar] [CrossRef]
  10. Sefeedpari, P.; Pudełko, R.; Jędrejek, A.; Kozak, M.; Borzęcka, M. To What Extent Is Manure Produced, Distributed, and Potentially Available for Bioenergy? A Step toward Stimulating Circular Bio-Economy in Poland. Energies 2020, 13, 6266. [Google Scholar] [CrossRef]
  11. Szyba, M.; Mikulik, J. Energy Production from Biodegradable Waste as an Example of the Circular Economy. Energies 2022, 15, 1269. [Google Scholar] [CrossRef]
  12. Nikiciuk, M. Potencjał ekologiczny i przyrostowy sektora biogazowni rolniczych w województwie podlaskim. Repozytorium Uniw. Białymstoku 2019, 98–117. [Google Scholar] [CrossRef]
  13. Ptak, M.; Skowrońska, A.; Pińkowska, H.; Krzywonos, M. Sugar Beet Pulp in the Context of Developing the Concept of Circular Bioeconomy. Energies 2022, 15, 175. [Google Scholar] [CrossRef]
  14. Klimek, K.; Kapłan, M.; Syrotyuk, S.; Bakach, N.; Kapustin, N.; Konieczny, R.; Dobrzyński, J.; Borek, K.; Anders, D.; Dybek, B.; et al. Investment Model of Agricultural Biogas Plants for Individual Farms in Poland. Energies 2021, 14, 7375. [Google Scholar] [CrossRef]
  15. REPowerEU: A Plan to Rapidly Reduce Dependence on Russian Fossil Fuels and Fast forward the Green Transition. Available online: https://ec.europa.eu/commission/presscorner/detail/en/IP_22_3131 (accessed on 3 August 2022).
  16. Kaltschmitt, M.; Hartmann, H. Biogaserzeugung und-Nutzung Energie Aus Biomass; Springer: Berlin/Heidelberg, Jermany, 2001; pp. 641–694. [Google Scholar] [CrossRef]
  17. Available online: https://www.nrel.gov/docs/legosti/fy97/26041.pdf (accessed on 23 December 2021).
  18. Wellinger, A.; Murphy, J.; Baxter, D. (Eds.) The Biogas Handbook. Science, Production and Applications; Woodhead Publishing Limited: Cambridge, UK, 2013. [Google Scholar]
  19. UlrichStohr, U.W.; Hees, N. Biogas Plants in Animal Husbandry. A Practical Guide; Deutsches Zentrum für Entr. ddungstechnologien–GATE: Eschborn, Germany, 1989. [Google Scholar]
  20. Steffen, R.; Szolar, O.; Braun, R. Feedstocks for Anaerobic Digestion. Vienna: University of Agricultural Sciences; Institute for Agrobiotechnology: Tulln, Austria, 1998. [Google Scholar]
  21. Angelis-Dimakis, A.; Biberacher, M.; Dominguez, J.; Fiorese, G.; Gadocha, S.; Gnansounou, E.; Guariso, G.; Kartalidis, A.; Panichelli, L.; Pinedo, I.; et al. Methods and tools to evaluate the availability of renewable energy sources. Renew. Sustain. Energy Rev. 2011, 15, 1182–1200. [Google Scholar] [CrossRef]
  22. Al Seadi, T. Good Practice in Quality Management of AD Residues from Biogas Production; IEA Bioenergy: Esbjerg, Denmark, 2002. [Google Scholar]
  23. Bank Danych Lokalnych: GUS. Available online: https://bdl.stat.gov.pl/BDL/dane/podgrup/temat (accessed on 23 December 2021).
  24. IEA Bioenergy. Available online: https://task37.ieabioenergy.com/files/daten-redaktion/download/Technical%20Brochures/Wastewater_biogas_grey_web-1.pdf (accessed on 31 January 2022).
  25. Bank Danych Lokalnych: GUS. Available online: https://stat.gov.pl/obszary-tematyczne/roczniki-statystyczne/roczniki-statystyczne/rocznik-statystyczny-rolnictwa-2013,6,7.html (accessed on 18 October 2021).
  26. Bank Danych Lokalnych: GUS. Available online: https://stat.gov.pl/obszary-tematyczne/roczniki-statystyczne/roczniki-statystyczne/rocznik-statystyczny-rolnictwa-2019,6,13.html (accessed on 18 October 2021).
  27. Martinát, S.; Dvořák, P.; Frantál, B.; Klusáček, P.; Kunc, J.; Kulla, M.; Mintálová, T.; Navrátil, J.; Dan van der Horst, D. Spatial Consequences of Biogas Production and Agricultural Changes in the Czech Republic after EU Accession: Mutual Symbiosis, Coexistence or Parasitism? Acta Univ. Palacki. Olomuc.–Geogr. 2013, 44, 75–92. [Google Scholar]
  28. Bharathirajaa, B.; Sudharsanaa, T.; Jayamuthunagaib, J.; Praveenkumarc, R.; Chozhavendhand, S.; Iyyappan, J. Biogas production—A review on composition, fuel properties, feed stock and principles of anaerobic digestion. Renew. Sustain. Energy Rev. 2018, 90, 570–582. [Google Scholar] [CrossRef]
  29. Zepter, J.M.; Engelhardt, J.; Gabderakhmanova, T.; Marinelli, M. Empirical Validation of a Biogas Plant Simulation Model and Analysis of Biogas Upgrading Potentials. Energies 2021, 14, 2424. [Google Scholar] [CrossRef]
  30. Average Sales Price of Electricity on the Competitive Market (Annual and Quarterly)—Prices, Indices—Energy Regulatory Office. Available online: https://www.ure.gov.pl (accessed on 18 October 2021).
  31. Available online: https://metropoliagzm.pl/wp-content/uploads/2022/02/IPA_GZM-Koncepcja-rozwoju-Odnawialnych-Zrodel-Energii-OZE-w-gminach-GZM-jako-jedno-z-narzedzi-osiagniecia-celu-Metropolii-samowystarczalnej-energetycznie.pdf (accessed on 25 July 2022).
  32. Farrell, M.J. The Measurement of Productive Efficiency. J. R. Stat. Soc. Ser. A 1957, 120, 253–290. [Google Scholar] [CrossRef]
  33. Mardani, A.; Zavadskas, E.K.; Streimikiene, D.; Jusoh, A.; Khoshnoudi, M. A comprehensive review of data envelopment analysis (DEA) approach in energy efficiency. Renew. Sustain. Energy Rev. 2017, 70, 1298–1322. [Google Scholar] [CrossRef]
  34. Shabanpour, H.; Yousefi, S.; Saen, R.F. Forecasting efficiency of green suppliers by dynamic data envelopment analysis and artificial neural networks. J. Clean. Prod. 2017, 142, 1098–1107. [Google Scholar] [CrossRef]
  35. Charnes, A.; Cooper, W.W.; Golany, B.; Seiford, L.M.; Stutz, J. Foundations of Data Envelopment. Analysis for Pareto-Koopman’s Efficient Empirical Production Functions. J. Econom. 1985, 30, 91–107. [Google Scholar] [CrossRef]
  36. Charnes, A.; Cooper, W.W.; Rhodes, E. Measuring the efficiency of decision making units. Eur. J. Oper. Res. 1978, 2, 429–444. [Google Scholar] [CrossRef]
  37. Urząd Regulacji Energetyki. Available online: https://www.ure.gov.pl/pl/urzad/informacje-ogolne/aktualnosci/10400,W-pierwszym-kwartale-2022-roku-srednia-cena-sprzedazy-energii-elektrycznej-na-ry.html (accessed on 26 July 2022).
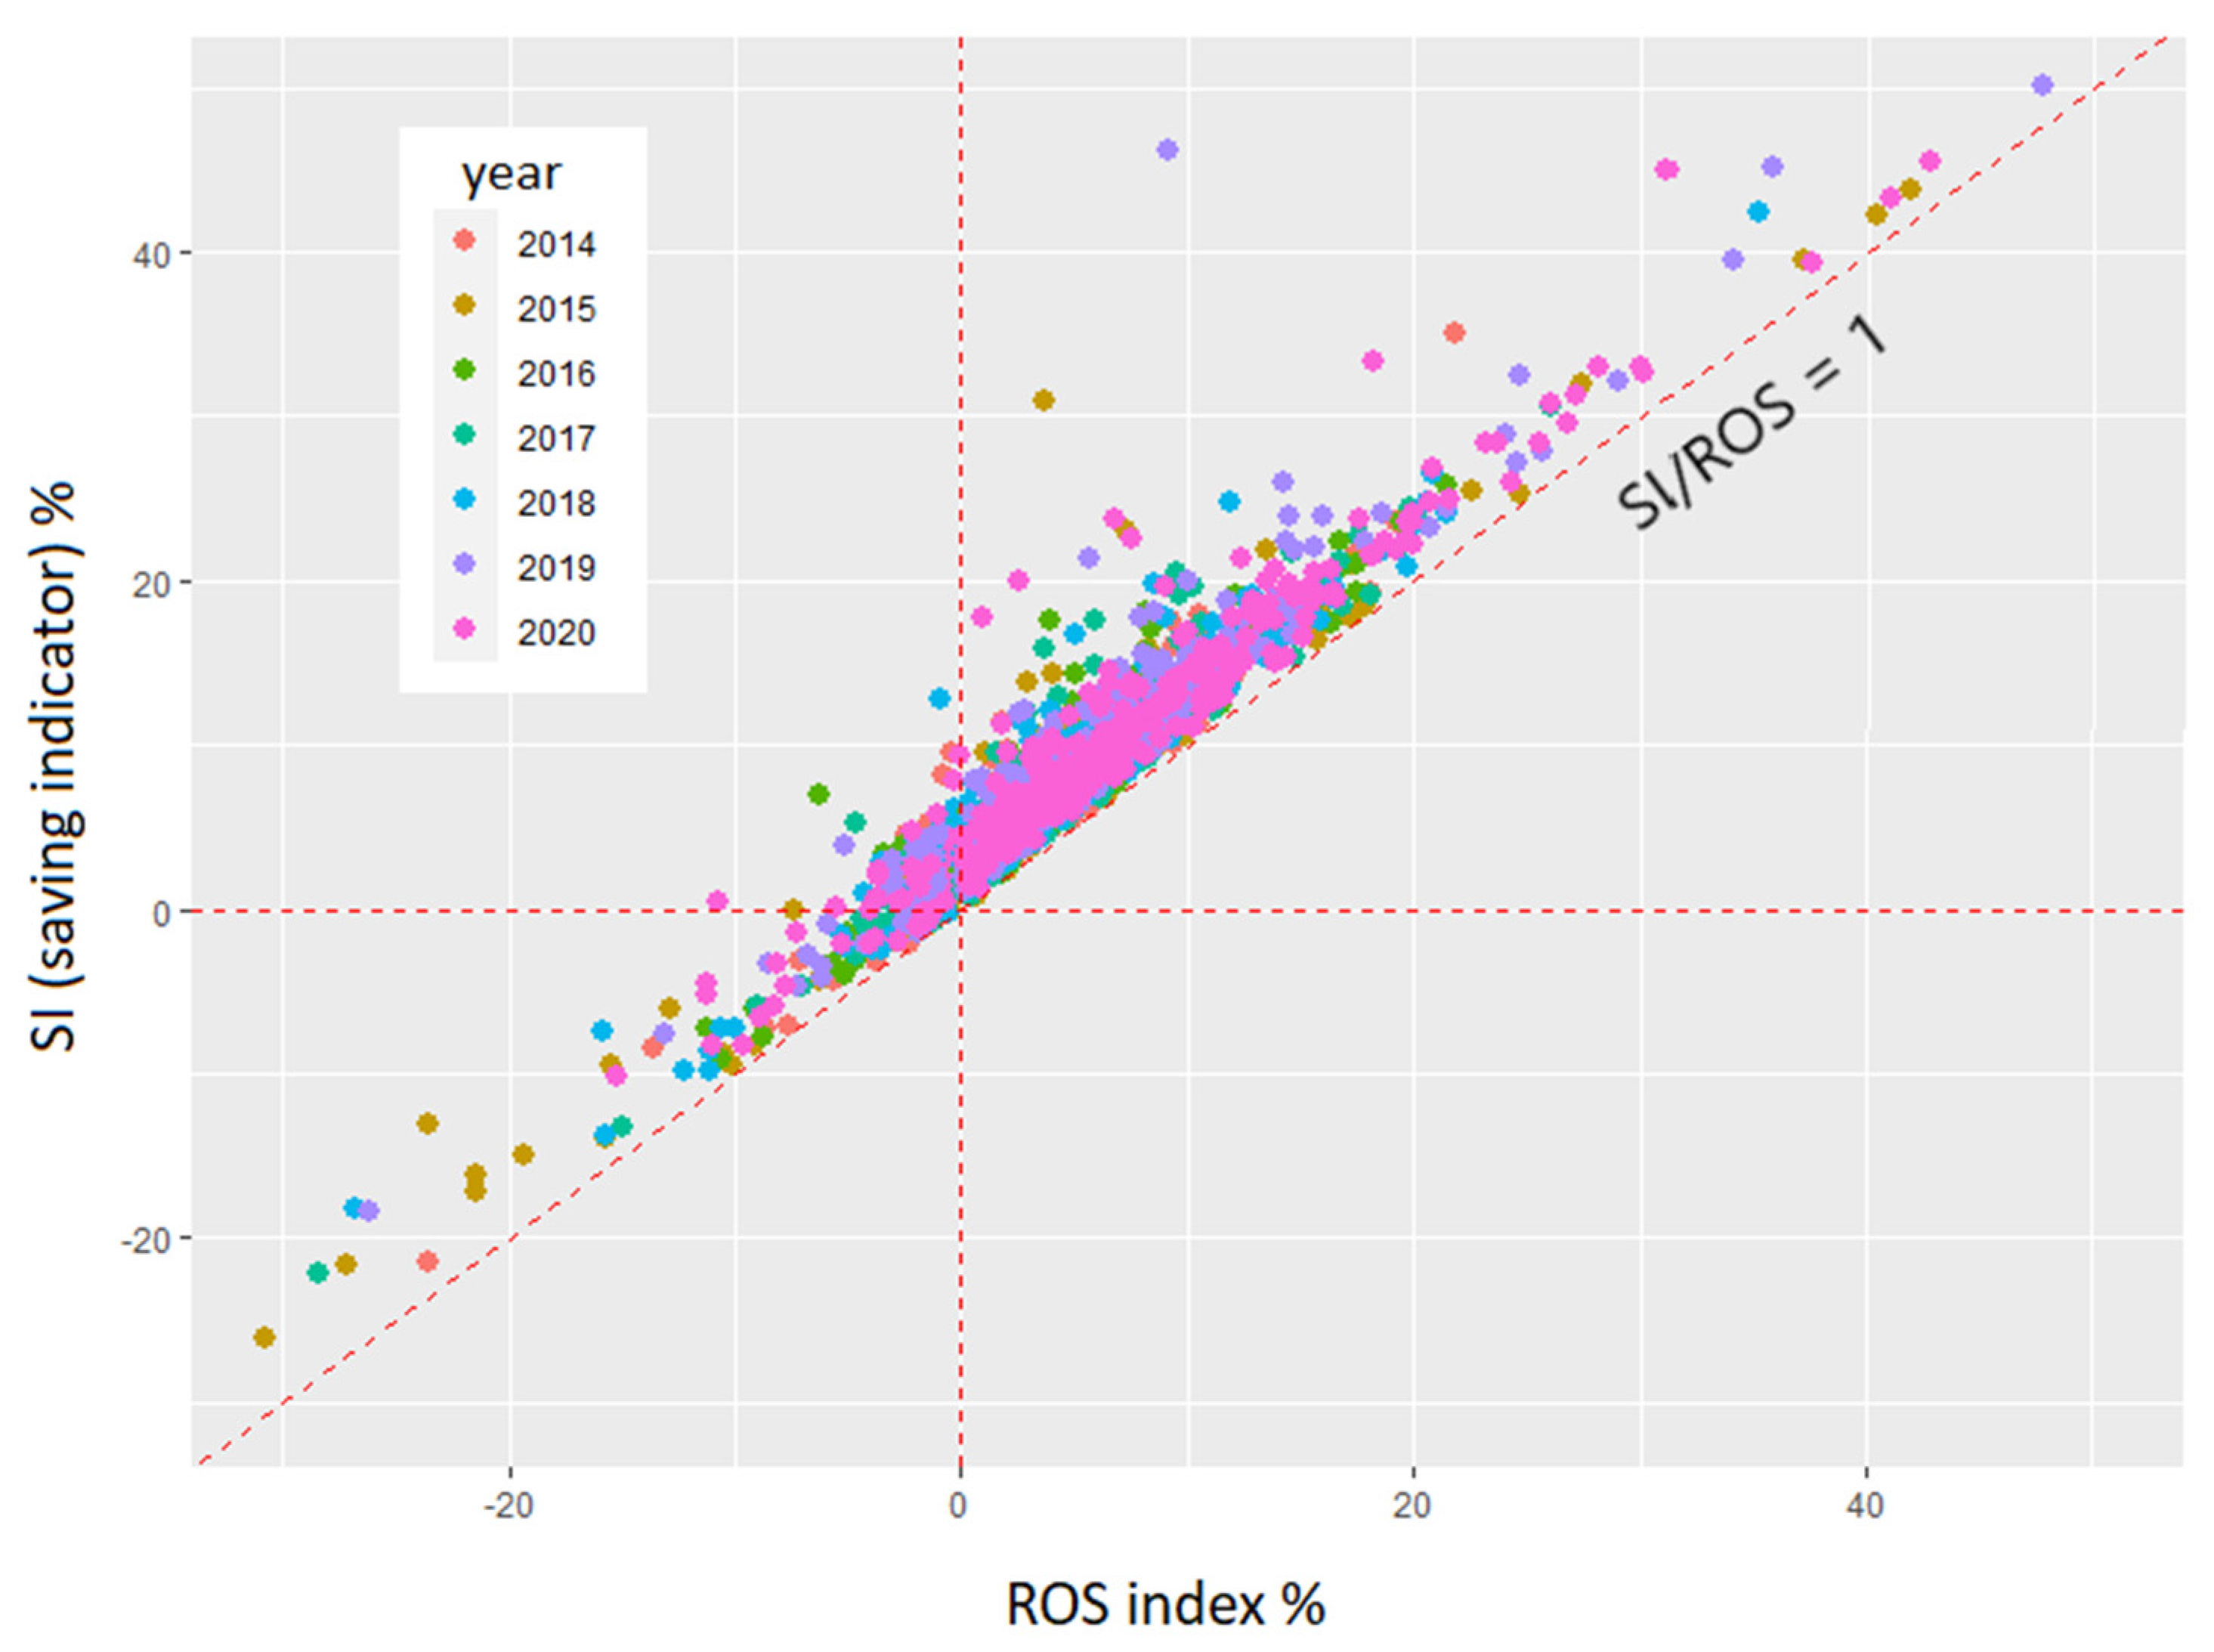
Figure 1. Relationship of the ROS index to SI (powiat level).
Energies 15 05797 g001
Figure 2. Powiats showing more than a 2.78-fold increase in ROS values.
Energies 15 05797 g002
Figure 3. Spatial distribution of powiats (urban powiats indicated by U) showing more than a 2.78-fold increase in the SI/ROS.
Energies 15 05797 g003
Figure 4. Biogas production potential from biodegradable waste according to the number of operators.
Energies 15 05797 g004
Figure 5. Relative efficiency of the powiats for the period 2014–2020 for food business operators.
Energies 15 05797 g005
Figure 6. Relative efficiency of the powiats for the period 2014–2020 for the total operators, excluding the energy sector.
Energies 15 05797 g006
Figure 7. Number of biogas plants compared to regions (NUTS 2), including cattle populations and heat production, in 2020.
Energies 15 05797 g007
Figure 8. Electricity consumption coverage through the potential of biogas electricity generation in 2020.
Energies 15 05797 g008
Table 1. Number of food business operators able to cover the energy consumption based on biogas from their own waste. Source: Own study.
Coverage of Electricity Requirements 20142015 *20162017201820192020total
>100%45204442485256307
50–100%3173433272740199
25–50%43183945424544276
10–25%88358575838481531
<10%16068157160152145130972
* Incomplete data for 2015.
Publisher’s Note: MDPI stays neutral with regard to jurisdictional claims in published maps and institutional affiliations.