Article

Is the Production of Agricultural Biogas Environmentally Friendly? Does the Structure of Consumption of First- and Second-Generation Raw Materials in Latvia and Poland Matter?

1
Institute of Economics and Finance, Warsaw University of Life Sciences—SGGW, 166 Nowoursynowska Str., 02-787 Warsaw, Poland
2
Faculty of Economics and Social Development, Latvia University of Life Sciences and Technologies, 18 Svetes Str., LV-3001 Jelgava, Latvia
3
Institute of Management, Warsaw University of Life Sciences—SGGW, 166 Nowoursynowska Str., 02-787 Warsaw, Poland
*
Author to whom correspondence should be addressed.
Energies 2022, 15(15), 5623; https://doi.org/10.3390/en15155623
Submission received: 11 July 2022 / Revised: 30 July 2022 / Accepted: 31 July 2022 / Published: 3 August 2022
(This article belongs to the Special Issue Energy Crops Production in Central and Eastern Europe)

Abstract

:
The importance of biogas in the energy mix in Poland and Latvia is very low. In Poland, 306 million m3 of biogas is produced annually, and in Latvia, 56 million m3. The share of energy from agricultural biogas in Latvia is 1.6%, and in Poland, only 0.12%. This study analyzed the impact of the structure on CO2 emissions from agricultural biogas production in Latvia and Poland. The emission was determined in accordance with the EU directive. The structure of substrates was dominated by those from the second generation, i.e., manure and food waste. In Latvia, it was 70%, and in Poland, 78%. The manure share was 45% and 24%, respectively. The anaerobic digestion of manure guarantees high GHG savings thanks to the avoided emissions from the traditional storage and management of raw manure as organic fertilizer. The level of emissions from the production of agricultural biogas was calculated for the variant with the use of closed digestate tanks, and it was about 10–11 g CO2/MJ, which is comparable to the emissions from solar photovoltaic sources. When using open tanks, the emission level was twice as high, but it was still many times less than from the Polish or Latvian energy mix. Such a low level of emissions resulted from the high share of manure. The level of emission reduction reached 90% compared to fossil fuels. The use of second-generation feedstock in biogas production provides environmental benefits. Therefore, if wastes are used in biogas generation, and the influence on the local environment and overall GHG emissions is positive, authorities should support such activity.

1. Introduction

Accelerated deployment of renewable energy is key to mitigating climate change and comprehensive renewable energy scenarios suggest significantly increased use of biomass for energy purposes [1,2]. Agriculture and the food industry can play a large part in this development, as they produce significant amounts of biomass not only from dedicated crops but primarily from by-products and waste. The way we manage and obtain energy, food, and materials is potentially a very effective tool for replacing some fossil resources and reducing greenhouse gas (GHG) emissions. An important question is whether agriculture can be used sustainably to obtain energy and materials without jeopardizing other land-use provisioning services such as food and feed production. Several bioenergy scenarios show increased GHG emissions, partly due to their indirect land use change (ILUC) [3]. After almost thirty years of climate change negotiations, global CO2 levels are still rising [4]. The UNFCCC Paris Agreement goals of holding global warming to ‘well-below’ 2 °C and to ‘pursue efforts’ to limit it to 1.5 °C are in stark contrast to the ever-dwindling carbon budget. One should strive to reduce CO2 emissions from the activities carried out, and this is possible, for example, by producing energy from biomass instead of fossil fuels. Biomass has been and is a stable source of energy. The depletion of fossil fuel stocks and the growing world energy demand have increased interest in bioenergy over the past 20 years [5].
Individual EU countries strive to create a specific energy mix, depending on their resources and financing possibilities. Each country should also consider essential aspects such as the affordability, stability, and reliability of the supply and CO2 emissions. Biogas is an effective source of additional energy for populations in dispersed locations [6] and also as a fuel for transport and electricity production [7].
The available research results show that although the production of energy from biomass may complement the current energy production, it cannot be seen as a way to meet the needs, as the production of biomass is too small [8,9]. Nevertheless, the effective use of biomass for energy production, especially biomass from waste and by-products, has benefits in terms of obtaining energy, reducing GHG emissions, increasing energy security [6,10,11], and implementing various sustainable development goals. Bioenergy is a low-carbon option in energy generation compared to fossil fuels [12]. In OECD countries, the share of liquid biofuels is 11% and biogas is 3.8% of the renewable energy supply.

2. Bioenergy in Energy Mix

Bioenergy is used in various forms. The standard traditional use of biomass for energy purposes is the combustion of solid biomass. It still has the largest share in the biomass energy generation structure [13]. Over 66% of the renewable energy in the world is from biofuels and waste and 59% is solid biofuels while liquid biofuels account for 4.9% and biogas for 1.7% [14]. Solid biofuels are from forests, waste, and dedicated crops [15]. It is believed that bioenergy may together account for no more than 5–13% of the total amount of energy consumed, and this may reduce the overall GHG emissions from energy production by 13–20% [16]. Moreover, the production of energy from biomass is more expensive than fossil fuels, and subsidies for its use may lead to carbon leakage [17]. In the production of energy from biomass, the local availability of the raw material and the climatic zone should be considered [5]. There are many concerns that a greater demand for biomass for energy purposes will lead to competition with food and feed production, an increase in food prices, and an increase in emissions related to the taking up of new arable land [18]. It is true that there some analyses have shown that such competition is currently feeble [19,20,21,22], but this may change with increasing demand and prices [23,24].
An essential advantage of them use of some biofuels is that the energy from them can be stored and used for the production of heat and electricity but also as a transport fuel. Additionally, biogas, after it is upgraded to biomethane, can be used in transport instead of gas [25,26], leading to a 50% reduction in emissions [25].
In recent years, investments in the development of energy production from biomass have been relatively small in relation to investments in new capacities installed in PV, wind, and hydro installations [27]. This is due to the significant reduction in the cost of energy generation from PV and wind installations in recent years. The cost of energy from such installations is even two times lower than, for example, that produced in biogas plants [27,28].

3. Biogas as an Energy Source

Biogas is produced during the anaerobic digestion of organic matter. Therefore, the efficiency of biogas production depends on the type of raw material and the dry organic matter content. In biogas generation, waste from food production, manure, plant waste, and specially grown crops, mainly maize, are commonly used.
The development of biogas production mainly resulted from the desire to increase the share of renewable energy in the energy mix. Many countries, mainly from the EU, have introduced special subsidy programs and feed-in tariff systems for biogas plants and purchased energy from biogas [29,30,31]. Exceptionally high support was demonstrated in Germany, where the development of biogas production has been intensively supported since 2004.
Biogas production is largely based on specially cultivated crops, so it can compete with food production. Hence, the use of biogas produced in landfills and wastewater treatment plants [32,33] and from manure and waste from food processing and agriculture [24] is recommended and only then should raw materials from dedicated crops be used. Moreover, the use of waste is cheaper and ensures greater competitiveness of energy production from biogas compared to PV or wind [10]. In Europe, in most countries, the share of waste in the structure of raw material for biogas production is relatively high. In Germany and Italy only, many biogas plants use energy crops only, without the addition of biowaste [34]. In many other countries, e.g., in Poland, Bulgaria, and Latvia, the potential of biogas production is still not used, be it at processing plants or large farms with animal production [10,35,36,37]. The use of manure in biogas plants also makes it possible to maintain intensive livestock production because manure, which contains significant amounts of nitrogen, is sustainably managed [37,38,39]. However, without subsidies and dedicated energy purchase tariffs, it is not always profitable unless heat is consumed [40,41]. The cheapest biogas can be produced in sewage treatment plants and landfills [42]. The production of energy from biogas may also be more competitive when the fees for CO2 emissions [42,43,44] or payments for CO2 capture increase [43,45], which can be implemented in the BECCS system [46,47].

3.1. Advantages and Disadvantages of Biogas Production

The main benefit of biogas production is the production of energy from renewable sources, which can be used in various ways depending on the needs. Biogas is successfully used not only for the production of energy and heat but also after it is upgraded to biomethane as a transport fuel or it can be pumped into the grid [25,27,48,49].
Compared to energy production from fossil fuels, CO2 emissions from biogas are even 70–80% lower [6,12,30]. Another essential benefit is the use of waste biomass from agriculture [50], avoiding CH4 emissions from manure and slurry (the global warming potential for CH4 is 23). This has a more significant GHG reduction effect than just lowering CO2 emissions [32,51,52]. The reduction of GHG emissions through biogas production depends on the type and structure of the feedstocks used. For example, when using food waste or manure, the reduction in GHG emissions is higher than when using maize [28,53,54,55]. For this reason, the energy balance from biogas production is also better than for the production of first-generation biofuels, e.g., ethanol [56].
In the production of biogas, digestate is also produced. The digestate from biogas plants in wastewater treatment plants may contain pollutants, e.g., heavy metals, and its use is limited, but in other cases, the digestate is a valuable organic fertilizer for use in agriculture [57] and it can also be used as a solid biofuel [17]. Due to the necessity of transporting the raw material and digestate, it is advantageous to plan the area of raw material production and use of digestate and use it locally [56,58], as excessive amounts may endanger the environment [59].
Based on the production of biogas on substrates from dedicated crops and an increase in the scale of production, there may be competition for land use between the production of energy crops and food production. Such a situation may occur when energy prices increase, and the number of biogas plants is high [23,60]. There may also be a change in land use to produce energy resources [18]. It is more environmentally and economically effective to produce dedicated energy crops for biogas feedstock than to use biomass from wastelands or biomass for ploughing because this reduces the amount of carbon and other nutrients in the soil [15,61,62]. Another problem is soil erosion associated with the monoculture of maize for biogas production [63].

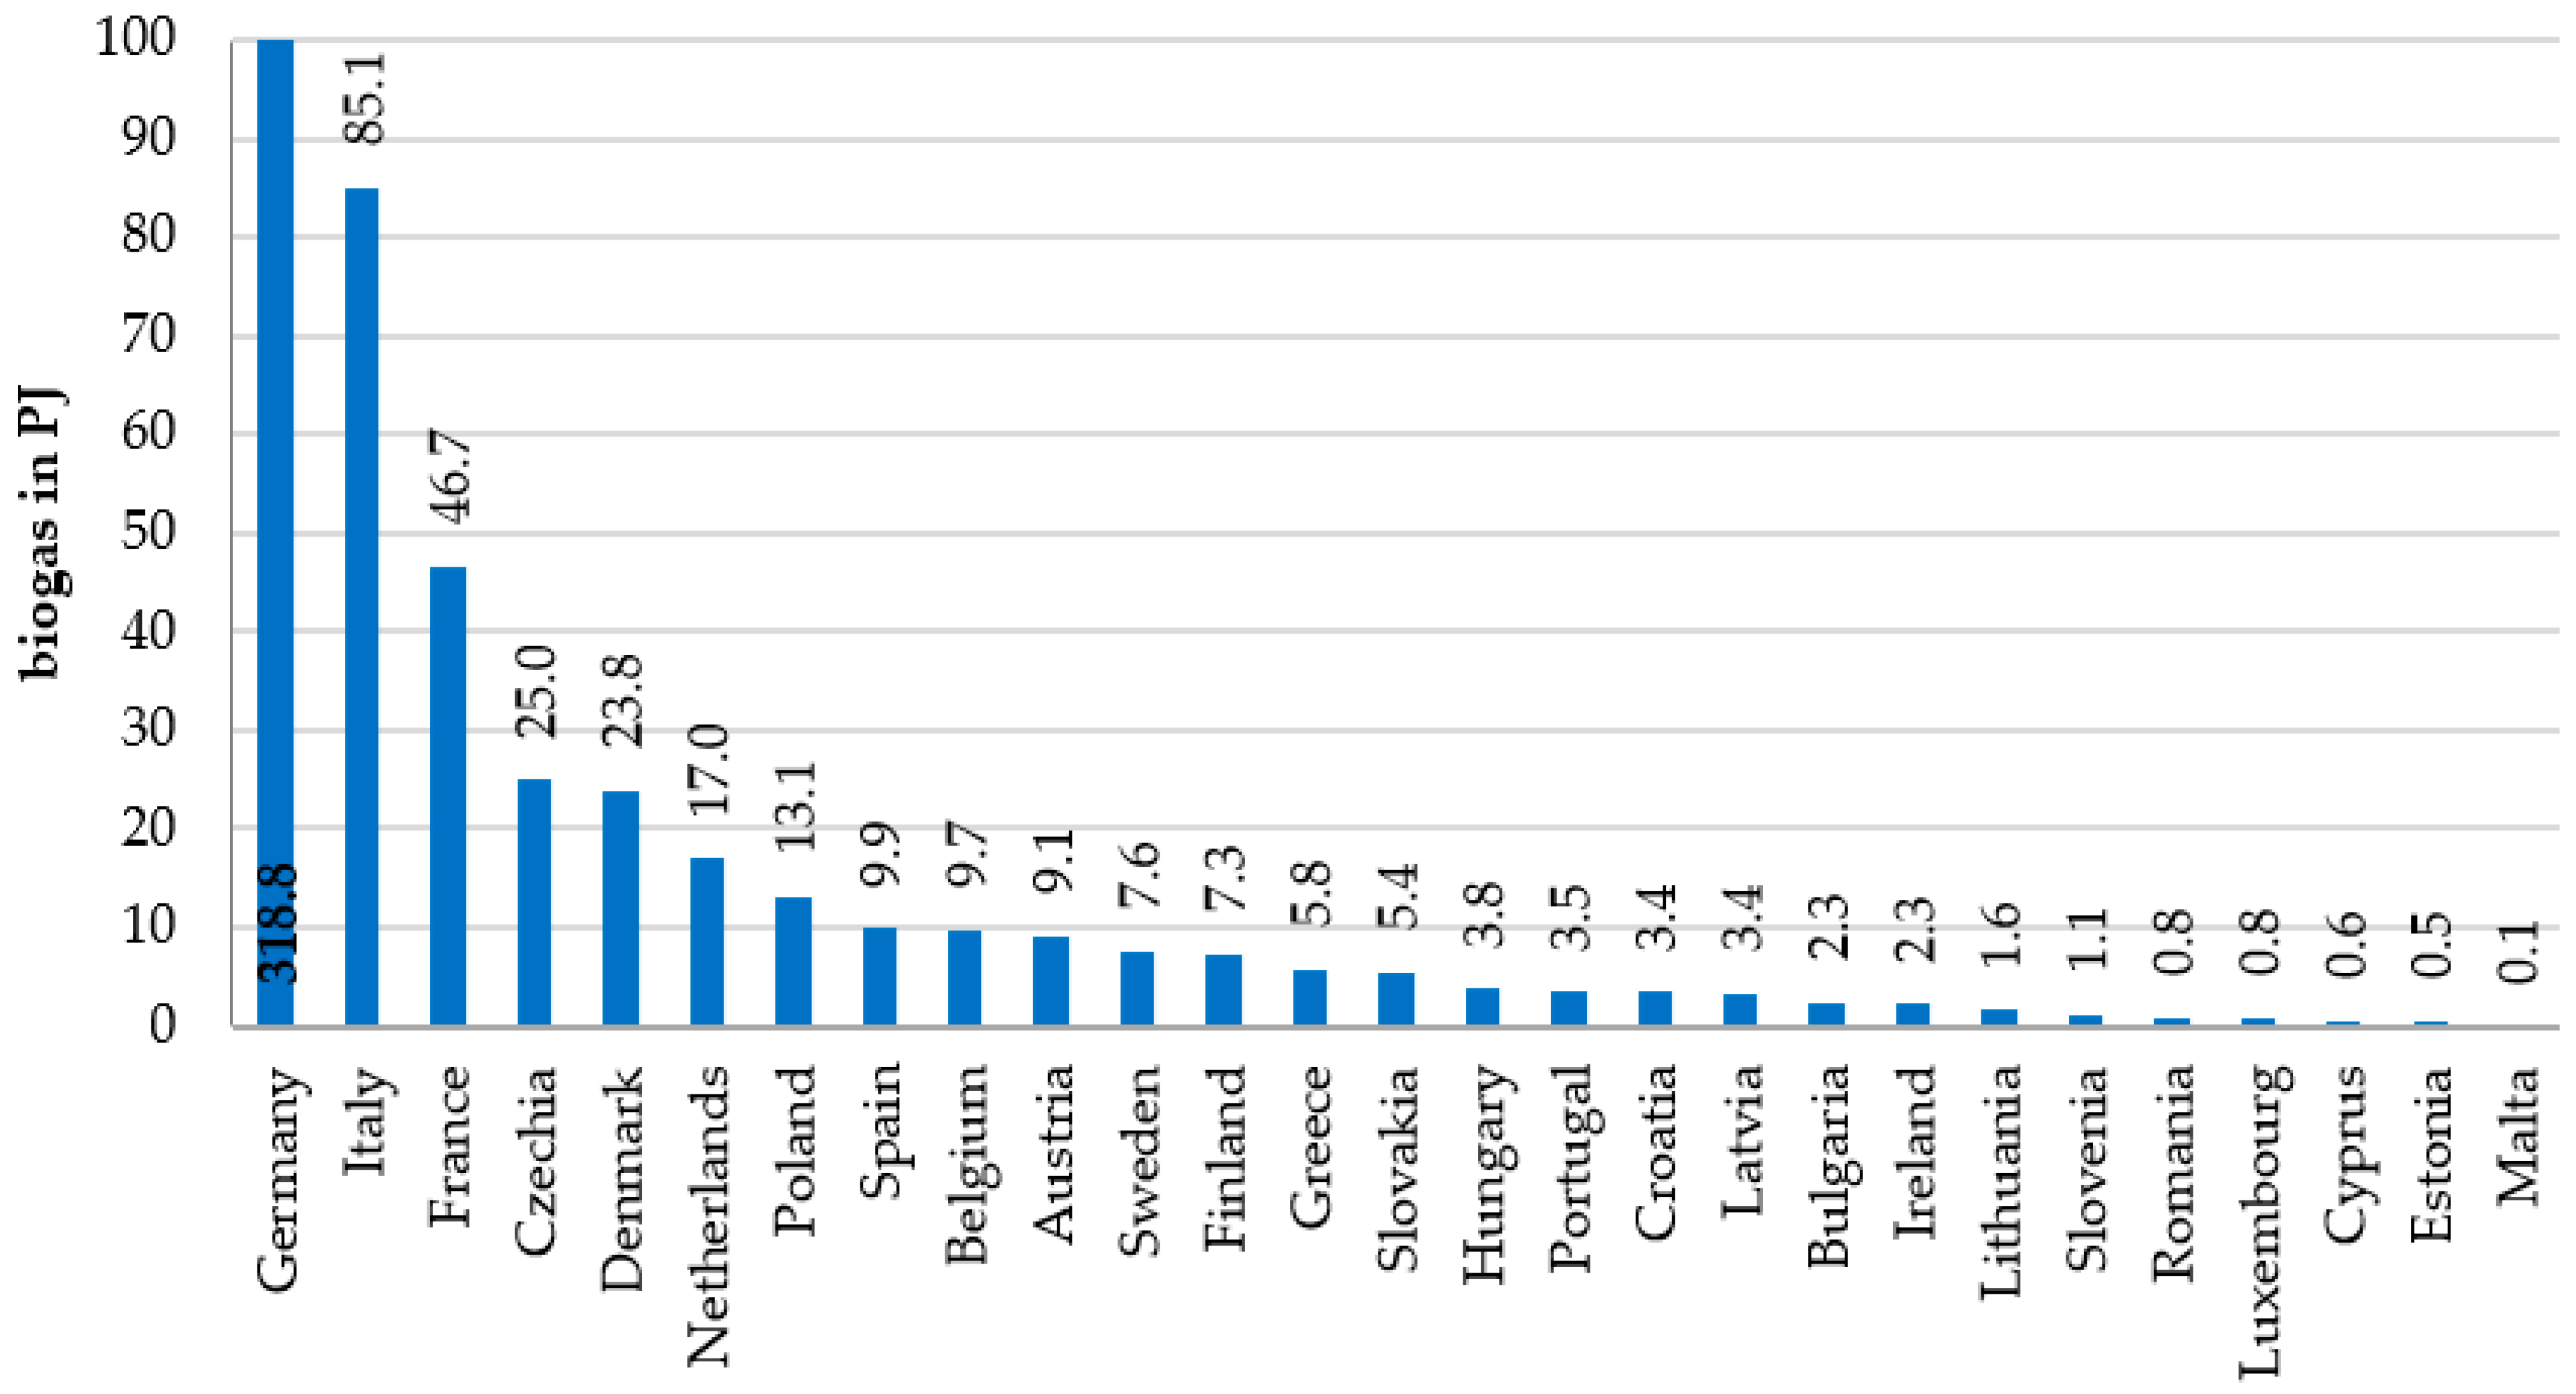
3.2. Production of Energy from Biogas in the European Union

In the European Union countries, the production of energy from biogas is very diverse. In the EU-27, in 2020, there were 18,500 biogas plants and 608 PJ of energy in biogas was generated. In 2011–2020, biogas production in the EU-27 increased by 68% from 363 PJ in 2011. The leader in biogas production is Germany, where as much as 319 PJ was produced, i.e., about 52% of the total amount in the EU. Italy is second and France third (Figure 1).
On average, the share of energy from renewable sources in the years 2017–2019 in the EU-27 was 19%. Bioenergy accounted for 9.3% of the total energy and biogas accounted for about 1% of the total energy. It means that biogas currently has a minimal share in the structure of energy production. The highest percentage of energy from biogas, as much as 2.5%, was observed in Germany, followed by Denmark and Latvia (1.9% each). The importance of biogas production seems to be higher when one considers it from an environmental perspective rather than energy generation.

4. Materials and Methods

This study aimed to determine the importance of first- and second-generation raw materials for the level of CO2 emissions in the production of agricultural biogas in Latvia and Poland. We carried out the following research tasks to achieve this aim: (i) determine the amount of biogas production in agricultural biogas plants; (ii) determine the amount, type, and structure of feedstock used in agricultural biogas plants; (iii) determine the structure and level of CO2 emissions from energy production in agricultural biogas plants; and (iv) determine the level of CO2 savings related to biogas production in agricultural biogas plants.
This analysis covered the period 2011–2019. This is because in the earlier period, in the studied countries, there were no programs to support biogas production and energy reception from the biogas plant to the grid, and there were no reliable biogas production records and data on the consumption of raw materials.
The data used in the work come both from the reports of the relevant authorities regarding the records of the raw material and statistical data collected and published by the statistical authorities of Latvia (Central Statistical Bureau—https://data.stat.gov.lv/pxweb/en/-OSP_PUB/START__NOZ__EN__ENA)/ (accessed on 10 February 2022)), Poland (Statistics Poland—http://swaid.stat.gov.pl/SitePagesDBW/GospodarkaPaliwowoEn.aspx (accessed on 10 February 2022)), and Eurostat (https://ec.europa.eu/eurostat/ (accessed on 17 December 2021)). In addition, we used interactive statistical databases to obtain energy production and consumption data. For Poland, we compiled data on feedstock use based on the annual reports of the National Support Center for Agriculture. Additionally, we used data from the European Biogas Association reports concerning the number and structure of biogas plants.
In determining the amount of emissions from biogas production, this study used the methodology of the Directive (EU) 2018/2001 of the European Parliament and of the Council of 11 December 2018 on the promotion of the use of energy from renewable sources and Annex VI Rules for calculating the greenhouse gas impact of biomass fuels and their fossil fuel comparators [64].
The emissions were calculated as follows:
E = 1 n E n ×   S n ,
where:
  • E = greenhouse gas emissions per MJ biomethane produced from co-digestion of the defined mixture of substrates;
  • En = emissions in g CO2eq/MJ biomethane for the option as provided in Annex VI Part D of Directive (EU) 2018/2001;
  • Sn = share of feedstock n in the energy content:
S n = P n ×   W n 1 n P n ×   W n ,
where:
  • Pn = energy yield (MJ) per kilogram of wet input of feedstock n in MJ biogas/kg (PMaize = 4.16 (MJ) biogas/kg, PManure = 0.50, PBiowaste = 3.41 (MJ) biogas/kg [65]);
  • Wn = weighting factor of substrate n defined as:
W n = I n   1 n I n × ( 1   AM n 1   SM n ) ,
where:
  • In = annual input to the digester of substrate n (ton of fresh matter);
  • AMn = average annual moisture of substrate n (kg water/kg fresh matter);
  • SMn = standard moisture for substrate n in kg water/kg fresh matter (SMMaize = 0.65; SMManure = 0.90; SMBiowaste = 0.76).
This work uses ‘typical’ GHG emission values for non-upgraded biogas calculated at the plant gate and based on MJ of biogas produced. These results do not consider land use emissions, CO2 emissions from biomass combustion, or other indirect effects. Negative values indicate bioenergy pathways that save greenhouse gas emissions compared to the alternative in which biomass is not used to produce energy.
Based on previous research [64,65], we adopted the unit emission in this paper. Production was assumed in the process in which the digestate is stored in closed tanks, which are most often used in the studied countries. The unit emission (En) is −88 g CO2/MJ for manure, 24 g CO2/MJ for maize, and 9 g CO2/MJ for biowaste. One should remember that when the digestate is stored in open tanks, the emission level is approximately twice as high.

5. Results

5.1. Agricultural Biogas Plants and Biogas Production

The production of agricultural biogas in the studied countries has not been strongly developed. After the initial period with support of the purchase prices of energy, no support programs were designed beyond the use of the reference price. This decreased the profitability of the investment. In Latvia, since 2012, entrepreneurs can no longer receive new allowances to sell electricity as part of mandatory purchases nor do they receive a guaranteed fee for the capacity installed in their power plant. In case of overcompensation or use of inappropriate feedstock, further support or mandatory procurement rights may be cancelled [66,67]. Hence, the increase in the number of biogas plants stopped after the commissioning of contracted installations. In Poland, a very slow rise in biogas plants resulted from the economically unfavorable conditions for energy settlement, e.g., low reference energy prices, and the lack of long-term guarantees. At the same time, the already operating producers could benefit from reference prices, albeit low, and from the sale of energy certificates [68,69]. In 2019, there were 96 agricultural biogas plants in Poland (Table 1). In the following years, the number of biogas plants increased to 128 by the end of 2021 [70]. The number of biogas plants in Latvia was lower and amounted to 49; several biogas plants were closed after 2016 due to unprofitability [58].
The importance of biogas in the total energy production in both countries is negligible. In Poland, all biogas accounted for approximately 0.28% of the total energy production in 2017–2019 and agricultural biogas accounted for about 0.12%. In Latvia, biogas energy accounts for 1.93% and agricultural biogas for 1.69% of the energy production. In Poland, in the energy mix, including the structure of renewable energy sources, biogas is of little importance. Despite its many times higher share in Latvia, it is still below 2%. For this reason, activities concerning the development of biogas production are primarily caused by environmental reasons, including the possibility of managing waste from livestock production in regions with intensive agricultural production [58] and food wastes. Initially, the use of fallow land for feedstock production was also considered for the production of bioenergy, including biogas, but it turned out that these were only theoretical calculations of biomass availability [60].
The production of agricultural biogas in Poland in 2017–2019 reached 300 million m3 annually. In Latvia, it was about 170 million m3. The largest production, over 180 million m3, was observed in 2016–2017, then it decreased to 156 million m3. The amount of energy produced was estimated based on biogas production reported by Eurostat. The amount of electricity produced from biogas accounts for 45–50% of the total biogas energy production [70].

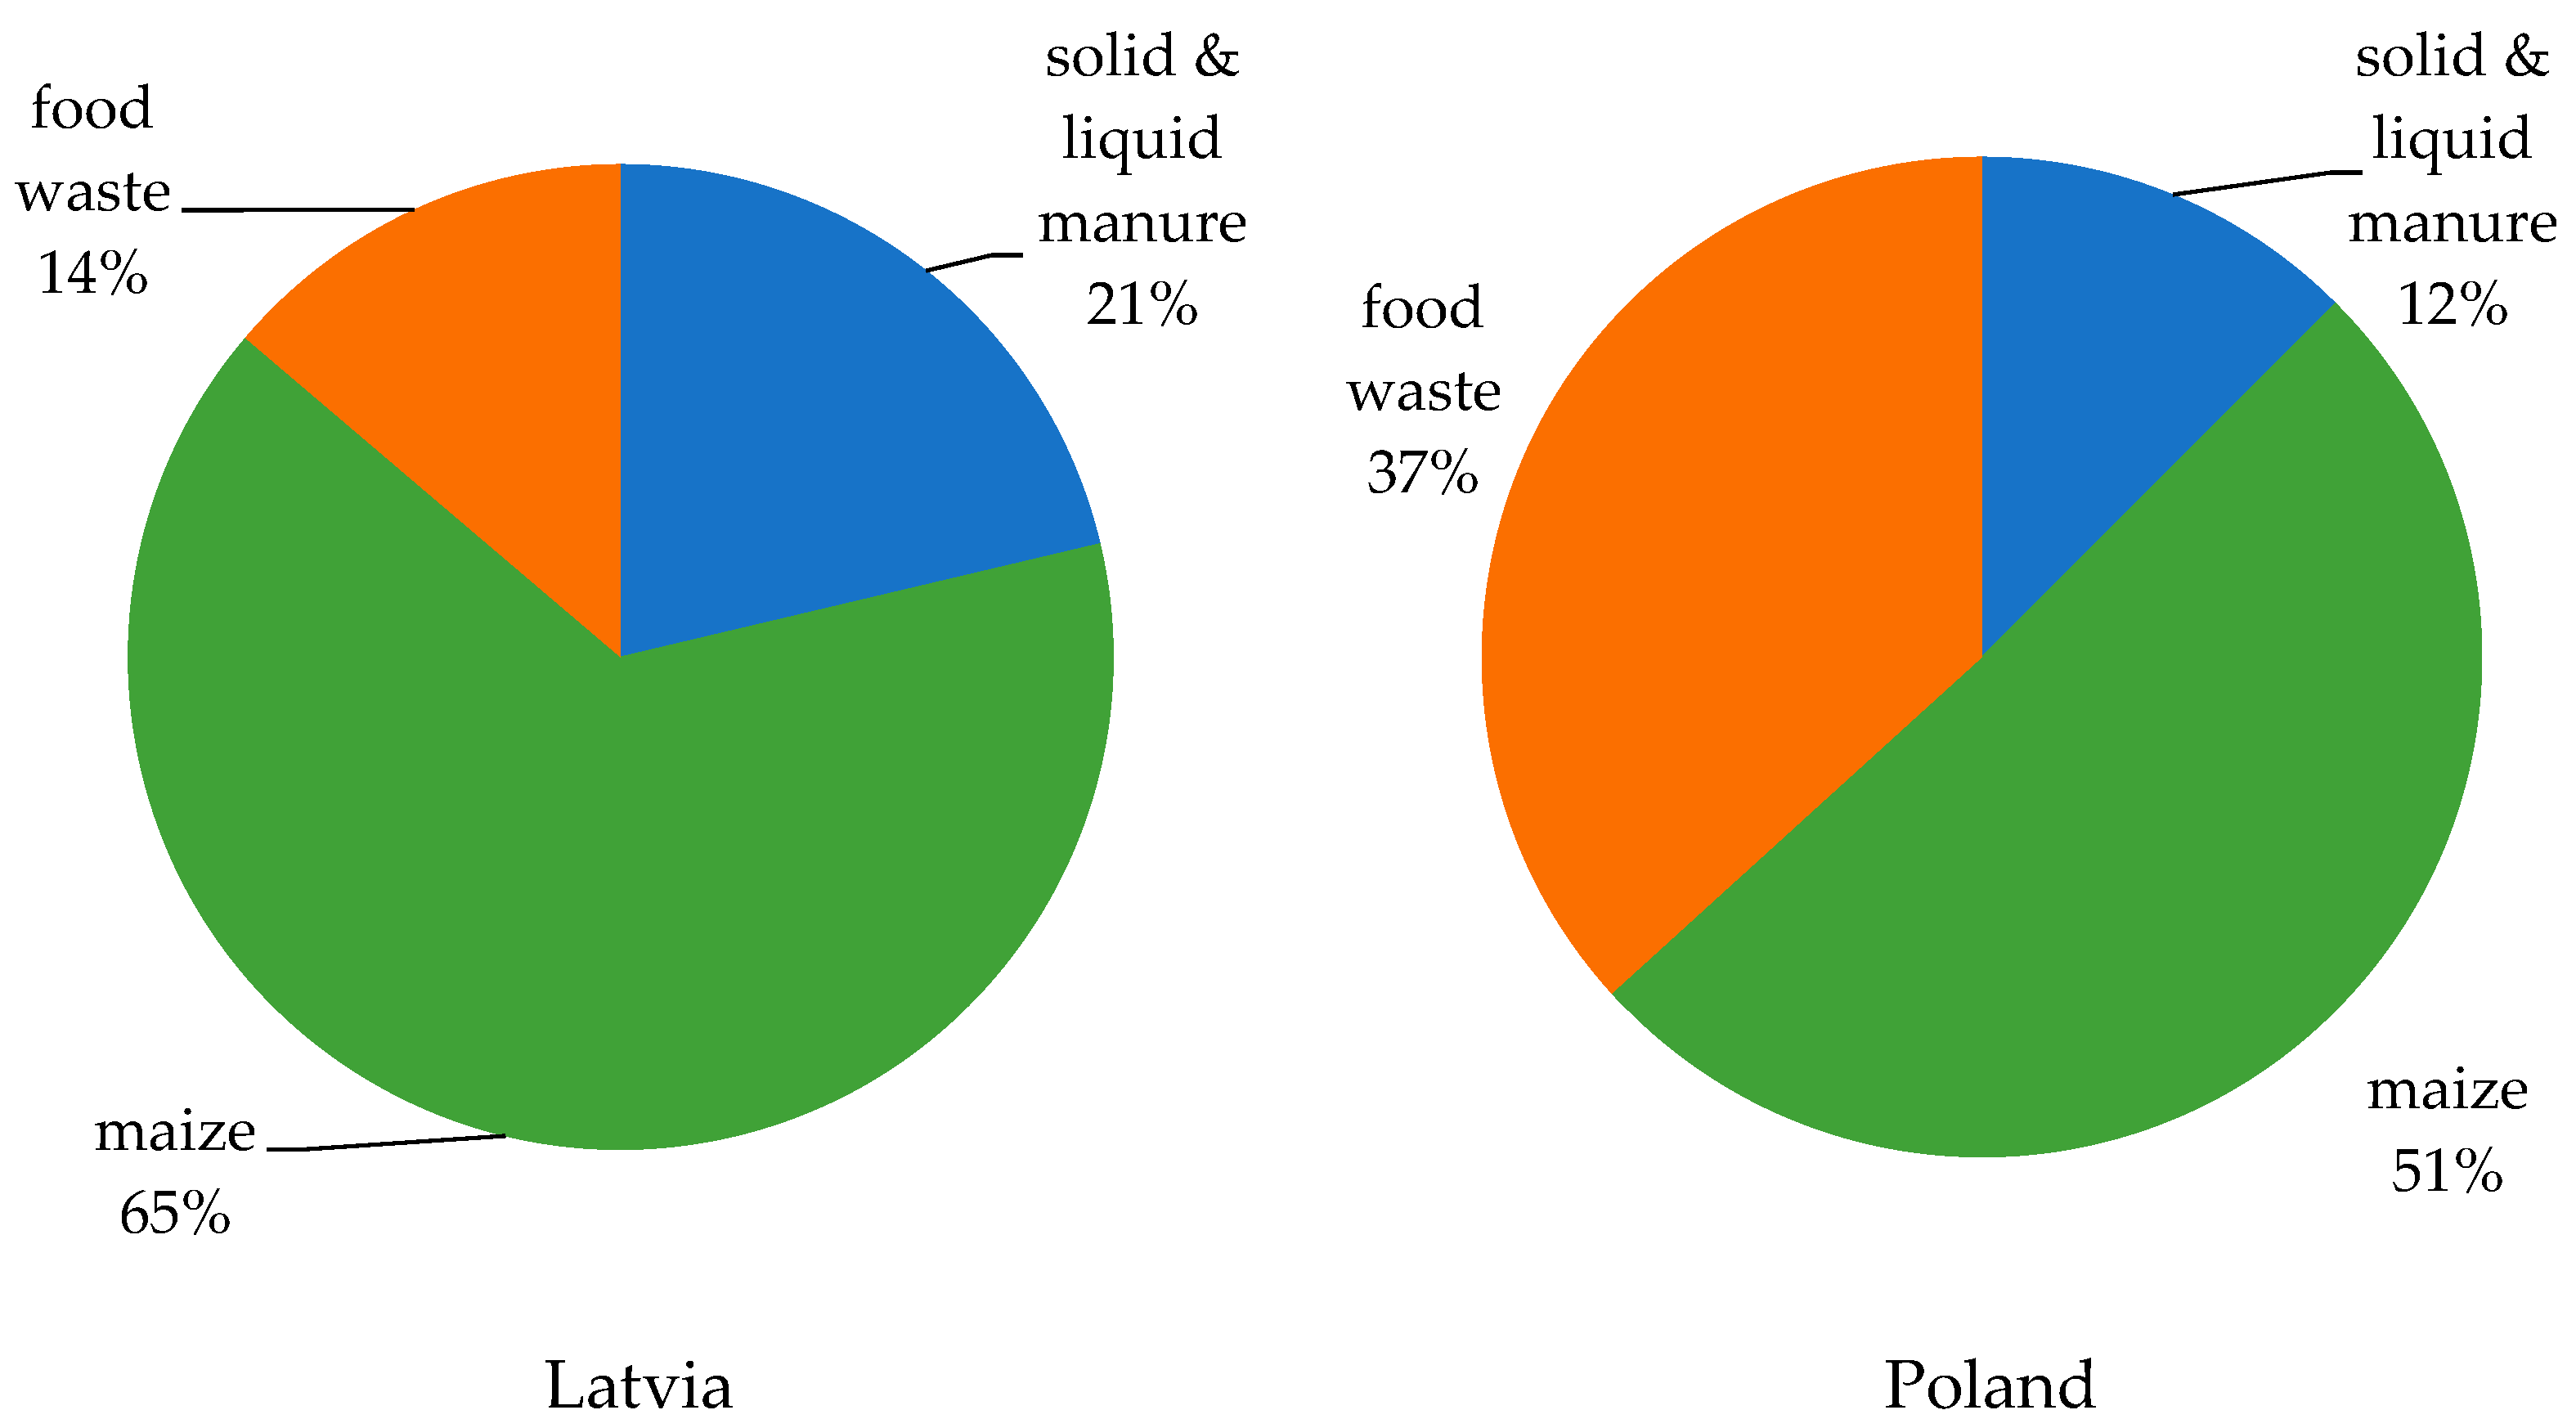
5.2. Feedstock Use in Biogas Plant

With the increase in the number of biogas plants, the consumption of raw materials for biogas production increased. The average growth rate in the consumption of substrates in Latvia was 16.4% in 2011–2019; the fastest growth, at a rate of 20%, was in the use of food waste (Table 2). In total, about 2 million tons of feedstock was used in biogas plants, mainly manure and maize and other green plants. After 2017, there was a decline in biogas production and in the use of raw materials, which resulted from the unprofitable biogas production and the closure of several biogas plants. In Poland, the average growth rate of feedstock consumption was 25%. Up to 4 million tons of substrate was processed in agricultural biogas plants. The waste consumption from food production increased the fastest, at 40% per year. This accounted for over 50% of the input to the biogas plant. The use of food production waste is cost-effective because it is relatively cheap, and when the biogas plants were located, investors often considered access to such wastes. The disadvantage of food waste is the high water and low energy content. About 70% of the wet weight of the feedstock in agricultural biogas plants in Latvia were second-generation raw materials. In Poland, it was 78%, with the most significant amount of waste from the food industry.
Considering the feedstocks used for biogas production in the studied countries, we calculated that the average water content in feedstocks differed from the standard values as follows:
  • For maize—AMMaize = 0.65;
  • For manure—AMManure = 0.92;
  • For food waste—AMBiowaste = 0.90.
These values were used in further calculations.
Figure 2 shows the feedstock structure calculated based on the energy content in raw materials, with the 2015–2019 average. In Latvia, maize had the highest share, as much as 65%, and manure constituted 21%. In Poland, maize also dominated the feedstock structure, but it was 51%, and the share of waste was much higher than in Latvia and amounted to as much as 37%. Waste accounted for approximately 50% of the energy content of the raw material in biogas plants in Poland and 35% in Latvia.

5.3. Emission from Agricultural Biogas Generation

Due to changes in the structure of the raw material used in biogas production in agricultural biogas plants in the following years, the level of CO2 emissions per unit of energy produced also changed. As the share of manure in the structure of the raw material decreased, the emission per 1 MJ of energy from agricultural biogas increased. In Latvia, more manure was used in the feedstock structure and more maize silage. In Poland, food wastes dominated the feedstock structure, but because the share of manure was relatively lower, the total emission per 1 MJ of energy from biogas was slightly higher. In 2015–2019, in Latvia, the emissions calculated according to Formula (1) was about 10.1 g CO2/MJ, and in Poland, 11.6 g CO2/MJ (Table 3). After 2014, the structure of the raw material consumed in agricultural biogas plants stabilized, and the level of emissions did not change significantly. In the first years of the analyzed period, the emission was lower by 1–2 g CO2/MJ, as a higher share of manure in the feedstock structure was observed.
In Table 4, the volume of biogas production from agricultural biogas plants and the structure of energy production by feedstock are presented. The production of energy from a given feedstock depends on its share and the energy efficiency of this raw material. For example, from a kilogram of wet matter of maize, the amount of generated energy is eight times higher than from manure and two to five times higher than from a kilogram of food waste. The structure of energy production is, therefore, dependent on the structure of the feedstock and the biogas yield from the particular feedstock. In Latvia, energy in biogas is predominantly produced from maize and other green plants (71.9%). In Poland, the share of biogas energy from maize and food waste is approximately 50% each. A higher share of waste in the raw material structure is more favorable due to both lower CO2 emissions and raw material prices.

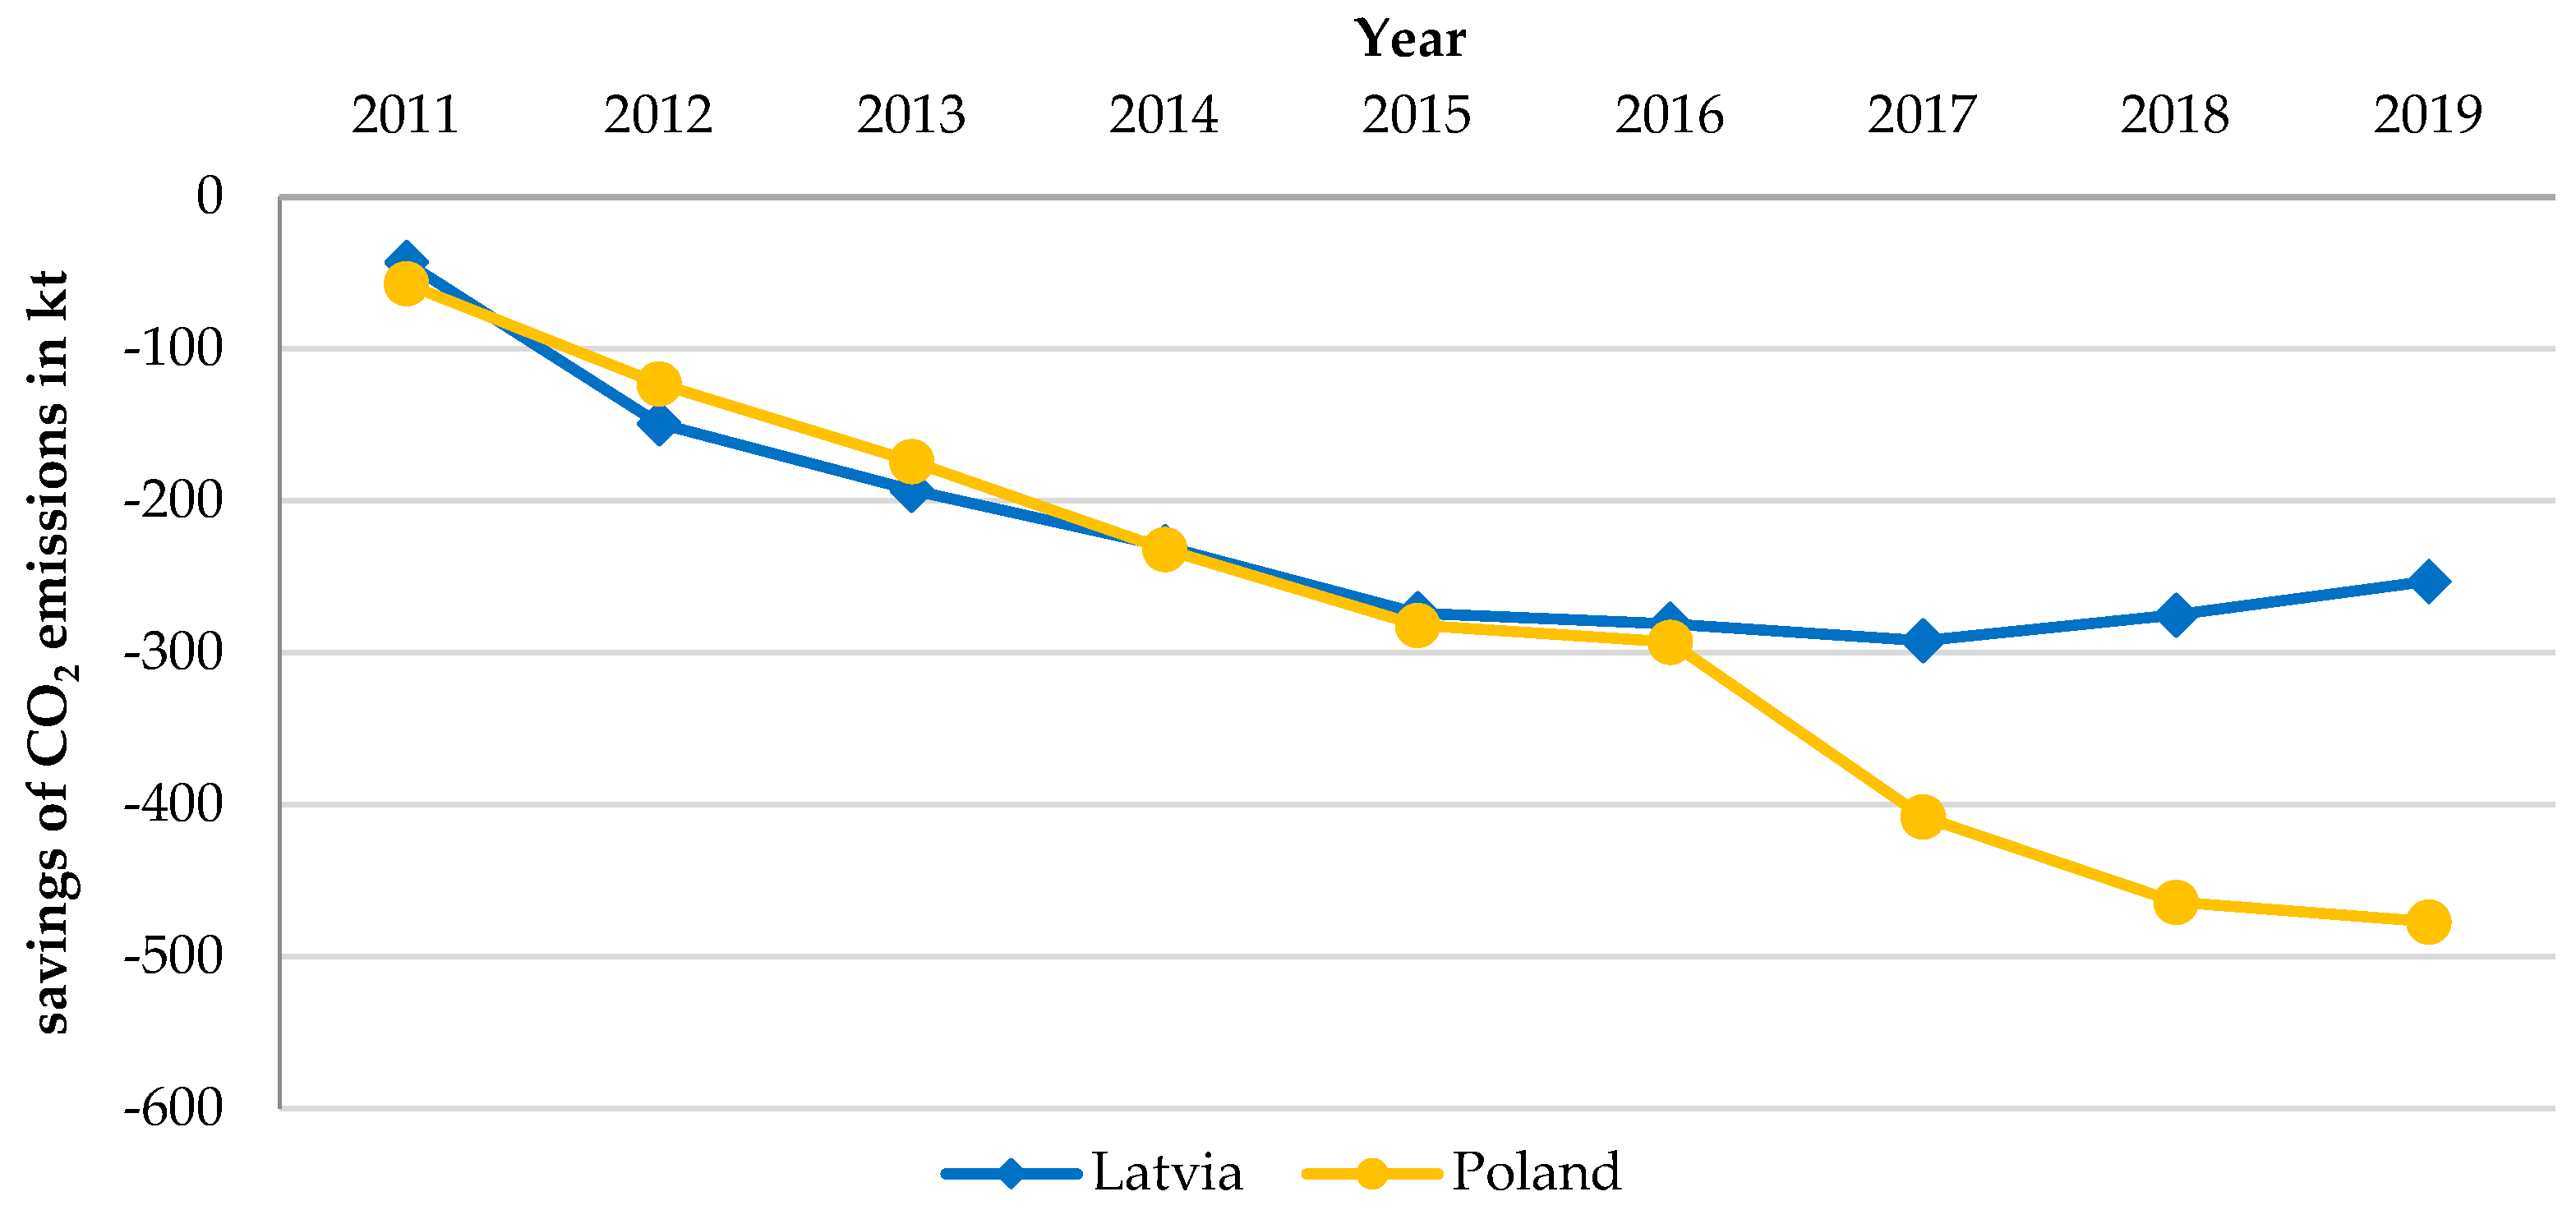
5.4. Level of Savings of GHG Emission

The emission reduction was calculated according to the parameters given in Directive (EU) 2018/2001 of the European Parliament and of the Council of 11 December 2018 on the promotion of the use of energy from renewable sources [64]. The formula used is as follows:
Saving   = E F   E B E B ,
where:
  • EB = total emissions from biomass fuels;
  • EF = total emissions from the fossil fuel comparator.
The fossil fuel comparator EF is 183 g CO2eq/MJ for biomass fuels used for electricity production. The fossil fuel comparator EF is 94 g CO2eq/MJ for biomass fuels used as transport fuels.
The reduction of CO2 emissions in connection with the production of energy from agricultural biogas was about 90% for the case when it is used for fuel in transport and almost 95% for the production of electricity. In Latvia and Poland, most of the agricultural biogas is intended for electricity production, and is less frequently used in the CHP system. Therefore, the obtained reduction level enables an increase in the profitability of biogas production in conditions where CO2 emissions are taxed more [44]. The level of emission savings is shown in Figure 3.
The reduction in CO2 emissions in the variant where biogas is intended for transport purposes was around 90% in Latvia and 86% in Poland. In the variant with electricity production, the emission reduction was as high as 95% in Latvia and 94% in Poland. The large reduction in emissions from agricultural biogas production is mainly a result of the high share of manure and biowastes in the substrate structure. The replacement of manure and biowaste with corn reduces the savings by 8–10 percentage points to around 73%. This means that without the use of waste in biogas production, the environmental effects would be much smaller.
According to the EU methodology, the 2019 reduction in CO2 emissions related to agricultural biogas production was approximately 514,000 tons of CO2 in Latvia and 980,000 tons of CO2 in Poland compared with emissions from electricity production. Concerning energy consumption in transport fuels, it was 473,000 and 250,000 tons of CO2, respectively. For comparison, CO2 emissions from the energy sector in these countries are 6.32 million tons and 282.3 million tons. This means that the reduction in emissions resulting from agricultural biogas production in these countries concerning the total emissions from energy production is 8.15% in Latvia and 0.35% in Poland. It should be noted that Latvia produces almost 40% of its energy from renewable sources while in Poland, it is 14%. Therefore, the production of energy from biogas is equivalent to the energy contained in the 7% of liquid fuels consumed annually in Latvia while for Poland, it is only 0.35%.
Figure 4 shows the emissions savings in thousands of tons of CO2 resulting from the production and consumption of agricultural biogas. We compared the biogas emissions with those from burning enough coal to obtain the same amount of energy as that obtained from biogas. Therefore, this calculation does not consider the premium awarded concerning the use of animal manure. The reduction in CO2 emissions in Latvia was around 270,000 tons in recent years and has not changed. In Poland, the emissions savings increased after 2016 and reached approximately 480,000 tons.

6. Discussion

Biogas is one of the renewable energy sources; therefore, its production is covered by RES development programs in many countries, especially in the EU. It is a source of energy that can be produced in installations of very different sizes, can be stored, and has different consumption directions from electricity and heat production and domestic use to transport fuel [71]. The main reasons for supporting biogas production are environmental aspects, including limiting GHG emissions, managing organic waste [37], providing valuable fertilizer, and creating local jobs [71]. Due to the use of waste in biogas production, it usually does not compete for land resources for food production, as is the case with liquid biofuels [72]. It is recommended to use animal waste and food waste where possible, and feedstock input from specially grown energy crops should be used to obtain the appropriate substrate structure [58,73]. It is a much cheaper and environmentally beneficial solution [74,75]. It is essential to use animal manure, thus avoiding CH4 emissions from these fertilizers [39,57]. It is estimated that only 3% of animal manure is currently used for energy production [71].
With the favorable structure of agriculture and the support of energy prices from RES, the number of installations producing biogas can be very high. An example on a global scale is Germany, where the majority (62%) of European biogas plants operate and half of the biogas generated in EU countries is produced. Currently, development may be slowed down by the fact that the prices of energy from other RES, e.g., onshore and offshore winds and photovoltaics, are already lower than the prices of energy from biomass, so it is necessary to plan the use of locally and easily available and cheap biomass from waste or production [28,76]. Biogas production based only on specially grown crops is usually unprofitable [77] but also less environmentally effective [55].
The importance of agricultural biogas production in the energy mix in Latvia and Poland is minimal. It is only 1.7% and 0.3%, respectively. Other bioenergy sources are much more important, but the potential of the biogas share is estimated to be around 3% of the renewable energy [78]. The low level of development of agricultural biogas production in the analyzed countries resulted from the unprofitability of projects under the conditions of low levels of support and unfavorable tariffs for the produced energy [24,66,68,79,80]. The key to profitability in most countries is appropriate legal regulations [29,81,82] and the limited potential of biomass consumption for bioenergy [8].
From the environmental point of view, the production of agricultural biogas is favorable. Manure and waste from the food industry have a large share in the feedstock structure. In dry matter, the share of second-generation feedstock was over 35% in Latvia and 50% in Poland. In wet matter, the percentage of second-generation feedstock was 70 and 78%, respectively. It means that not only energy production goals but also environmental ones are being pursued in the researched countries. Waste utilization in biogas plants is expected and additionally rewarded financially in many countries [83]. The competition between energy production and food production is lower when the share of waste in the structure of raw materials in biogas plants is higher [18,48,60]. This is in line with the guidelines for bioenergy production to generate high greenhouse gas savings compared to fossil fuels [48]. In the studied countries, energy in biogas was obtained mainly from high-energy plants as feedstock. In Latvia, 72% of the energy in biogas is obtained from the use of maize, and in Poland, it is 50%. The use of maize is recommended due to the need to ensure an appropriate feedstock structure and high energy yields per hectare [61,77], thus avoiding indirect emissions.
The emission reduction level related to biogas energy use from agricultural biogas plants is almost 90%, both in Poland and Latvia. However, different approaches to raw material consumption are implemented. In Latvia, the reduction in emissions results most strongly from the relatively higher share of manure in the structure of the raw material. For the use of manure in biogas production, the emission factors are negative as methane emissions are avoided. This compensates for the higher emissions from the use of maize. As a result, the emission was 10.1 g CO2/MJ of biogas energy. In Poland, the emission was about 11.5 g CO2/MJ of biogas energy, which resulted from the high share of food waste in the structure of the anaerobic digestion feed, with the percentage of manure half as low as in Latvia. The differences in the structure resulted from the different availability of the raw material, but the emission reduction effect is similar.
Altogether, agricultural biogas production contributes only slightly to the reduction in GHG emissions from energy production. This is due to the very low importance of biogas in the energy mix. Nevertheless, such a reduction in emissions cannot be completely ignored. However, a more important aspect seems to be the effective management of waste from animal production and food production, which contributes to the protection of the local environment and recirculates waste in the economy [57,84,85], and locally to better access to electricity, heat, and transport fuels.
An important aspect of further research is to determine both the minimum and the appropriate scale of agricultural biogas production in a single installation to ensure the availability of proper feedstocks and continuity of supply [13,86], and, at the same time, avoid the costs of transporting raw materials and related emissions. Biogas plants should be assessed primarily from the perspective of GHG emissions. The RES support policy may govern the economic efficiency of biogas installations.

7. Conclusions

No single technology or renewable energy source could provide all of the world’s future energy supply. Anaerobic digestion is under-utilized today in comparison to technologies for producing liquid biofuels, such as ethanol or biodiesel. Anaerobic digestion is a versatile technology that can use a wide range of crops, including lignocellulosic material such as grass. However, the debate about the sustainable use of energy crops and their impact on land-use change and food security has led to expectations of a reduction in the share of energy crops used for biogas production. It is, therefore, expected that the use of energy crops for biogas production in the EU will be increasingly limited, with support mainly targeting the use of waste and organic residues.
In Latvia and Poland, agricultural biogas production is relatively insignificant in the energy production structure, even below 1%, because without appropriate subsidies, such production was not profitable. In Poland, it should be allowed that less than three bidders can participate in the biogas energy auction, as is currently required. A condition could be that the reference price is not exceeded. Many auctions are cancelled because there are one or two bidders or there are no bidders [80]. Additionally, consideration should be given to establishing higher purchase prices for energy from biogas plants, where the share of biowaste (second generation feedstock) exceeds certain thresholds, such as 50%, 60%, etc. In Latvia, in addition to these solutions, it would be necessary to return to the contracting of renewable energy from biogas under feed-in tariffs.
Second-generation raw materials were mainly used in the production of agricultural biogas in the studied countries. Their share reached 70% in Latvia and 78% in Poland. The large share of waste in the feedstock structure in biogas plants mainly strengthens the ecological effect of this production. The environmental effect is, therefore, more significant than the economic one and will not change in the future, as other renewable energy sources offer lower production costs. Thus, biogas production should be supported and carried out when organic wastes are available and the impacts on the local environment and GHG emissions are positive. Such a situation occurs in agricultural biogas production in the studied countries.

Author Contributions

Conceptualization, L.W. and K.N.-L.; methodology, L.W. and A.P.; validation, L.W. and K.N.-L.; investigation, T.F., A.W. and K.N.-L.; data curation, L.W., K.N.-L. and T.F.; writing—original draft preparation, L.W., K.N.-L. and A.W.; writing—review and editing, L.W. and A.P.; funding acquisition, T.F. All authors have read and agreed to the published version of the manuscript.

Funding

The APC was funded equally by Institute of Economics and Finance, Warsaw University of Life Sciences—SGGW, 166 Nowoursynowska Str., 02 787 Warszawa, Poland and Ludwik Wicki.

Institutional Review Board Statement

Not applicable.

Informed Consent Statement

Not applicable.

Data Availability Statement

Data sources are indicated in the text. There is no permanent link to data sets, and statistical data are periodically supplemented and updated for subsequent periods.

Acknowledgments

The authors thank Andra Zvirbule from the Latvian University of Life Sciences and Technology for inspiration to start collaborating in research and supporting data access.

Conflicts of Interest

The authors declare no conflict of interest.

References

  1. Bruckner, T.; Bashmakov, I.A.; Mulugetta, Y.; Chum, H.; de la Vega Navarro, A.; Edmonds, J.; Faaij, A.; Fungtammasan, B.; Garg, A.; Hertwich, E.; et al. Energy systems. In Climate Change 2014: Mitigation of Climate Change: Contribution of Working Group III to the Fifth Assessment Report of the Intergovernmental Panel on Climate Change; Edenhofer, O., Pichs-Madruga, R., Sokona, Y., Farahani, E., Kadner, S., Seyboth, K., Adler, A., Baum, I., Brunner, S., Eickemeier, P., et al., Eds.; Cambridge University Press: Cambridge, UK, 2014; pp. 511–597. [Google Scholar]
  2. IPCC. Climate Change 2014: Mitigation of Climate Change: Contribution of Working Group III to the Fifth Assessment Report of the Intergovernmental Panel on Climate Change; Intergovernmental Panel on Climate Change: Cambridge, MA, USA, 2015. [Google Scholar] [CrossRef] [Green Version]
  3. Tonini, D.; Astrup, T. LCA of Biomass-Based Energy Systems: A Case Study for Denmark. Appl. Energy 2012, 99, 234–246. [Google Scholar] [CrossRef] [Green Version]
  4. NOAA. Carbon Dioxide Now More than 50% Higher than Pre-Industrial Levels. Available online: https://www.noaa.gov/news-release/carbon-dioxide-now-more-than-50-higher-than-pre-industrial-levels (accessed on 4 June 2022).
  5. Lee, R.A.; Lavoie, J.-M. From First- to Third-Generation Biofuels: Challenges of Producing a Commodity from a Biomass of Increasing Complexity. Anim. Front. 2013, 3, 6–11. [Google Scholar] [CrossRef]
  6. Dubrovskis, V.; Plume, I. Forecasting of GHG Emissions from Biomass Energy Usage in Latvia. In Proceedings of the Engineering for Rural Development, International Scientific Conference (Latvia), Jelgava, Latvia, 28 May 2009; LLU: Jelgava, Latvia, 2009; pp. 7–13. [Google Scholar]
  7. IEA. World Energy Outlook 2021; International Energy Agency: Paris, France, 2021. [Google Scholar]
  8. Searle, S.; Malins, C. A Reassessment of Global Bioenergy Potential in 2050. GCB Bioenergy 2015, 7, 328–336. [Google Scholar] [CrossRef]
  9. Venturini, G.; Pizarro-Alonso, A.; Münster, M. How to Maximise the Value of Residual Biomass Resources: The Case of Straw in Denmark. Appl. Energy 2019, 250, 369–388. [Google Scholar] [CrossRef]
  10. Muradin, M.; Foltynowicz, Z. Potential for Producing Biogas from Agricultural Waste in Rural Plants in Poland. Sustainability 2014, 6, 5065–5074. [Google Scholar] [CrossRef] [Green Version]
  11. IEA. Outlook for Biogas and Biomethane: Prospects for Organic Growth; International Energy Agency: Paris, France, 2020. [Google Scholar]
  12. IRENA; OECD/IEA; REN21. Renewable Energy Policies in a Time of Transition: Heating and Cooling; IRENA—OECD/IEA—REN21; International Renewable Energy Agency: Abu Dhabi, United Arab Emirates, 2021; ISBN 978-92-9260-289-5. [Google Scholar]
  13. Ślusarz, G.; Gołębiewska, B.; Cierpiał-Wolan, M.; Gołębiewski, J.; Twaróg, D.; Wójcik, S. Regional Diversification of Potential, Production and Efficiency of Use of Biogas and Biomass in Poland. Energies 2021, 14, 742. [Google Scholar] [CrossRef]
  14. IEA. Renewables Information: Overview; International Energy Agency: Paris, France, 2020. [Google Scholar]
  15. Smith, P.; Bustamante, M.; Ahammad, H.; Clark, H.; Dong, H.; Elsiddig, E.A.; Haberl, H.; Harper, R.; House, J.; Jafari, M.; et al. Agriculture, forestry and other land use (AFOLU). In Climate Change 2014: Mitigation of Climate Change; Contribution of Working Group III to the Fifth Assessment Report of the Intergovernmental Panel on Climate Change; Edenhofer, O., Pichs-Madruga, R., Sokona, Y., Farahani, E., Kadner, S., Seyboth, K., Adler, A., Baum, I., Brunner, S., Eickemeier, P., et al., Eds.; Cambridge University Press: Cambridge, UK, 2014; pp. 811–922. [Google Scholar]
  16. Larsen, S.; Bentsen, N.S.; Dalgaard, T.; Jørgensen, U.; Olesen, J.E.; Felby, C. Possibilities for Near-Term Bioenergy Production and GHG-Mitigation through Sustainable Intensification of Agriculture and Forestry in Denmark. Environ. Res. Lett. 2017, 12, 114032. [Google Scholar] [CrossRef]
  17. Rehfeldt, M.; Worrell, E.; Eichhammer, W.; Fleiter, T. A Review of the Emission Reduction Potential of Fuel Switch towards Biomass and Electricity in European Basic Materials Industry until 2030. Renew. Sustain. Energy Rev. 2020, 120, 109672. [Google Scholar] [CrossRef]
  18. Bentivoglio, D.; Rasetti, M. Biofuel Sustainability: Review of Implications for Land Use and Food Price. Ital. Rev. Agric. Econ. 2015, 70, 7–31. [Google Scholar] [CrossRef]
  19. Kristoufek, L.; Janda, K.; Zilberman, D. Correlations between Biofuels and Related Commodities before and during the Food Crisis: A Taxonomy Perspective. Energy Econ. 2012, 34, 1380–1391. [Google Scholar] [CrossRef]
  20. Zilberman, D.; Hochman, G.; Rajagopal, D.; Sexton, S.; Timilsina, G. The Impact of Biofuels on Commodity Food Prices: Assessment of Findings. Am. J. Agric. Econ. 2013, 95, 275–281. [Google Scholar] [CrossRef]
  21. Wicki, L. Food and bioenergy—Evidence from Poland. In Proceedings of the Economic Science for Rural Development: Production and Cooperation in Agriculture, Jelgava, Latvia, 26–27 April 2017; pp. 299–305. [Google Scholar]
  22. Wicki, L. Development of Biofuels Production from Agricultural Raw Materials. In Proceedings of the International Scientific Conference: Rural Development, Kaunas, Lithuania, 23–24 November 2017; pp. 502–508. [Google Scholar] [CrossRef] [Green Version]
  23. Altman, I.; Bergtold, J.; Sanders, D.; Johnson, T. Willingness to Supply Biomass for Bioenergy Production: A Random Parameter Truncated Analysis. Energy Econ. 2015, 47, 1–10. [Google Scholar] [CrossRef]
  24. Bielski, S.; Marks-Bielska, R.; Zielińska-Chmielewska, A.; Romaneckas, K.; Šarauskis, E. Importance of Agriculture in Creating Energy Security—A Case Study of Poland. Energies 2021, 14, 2465. [Google Scholar] [CrossRef]
  25. Lyng, K.-A.; Brekke, A. Environmental Life Cycle Assessment of Biogas as a Fuel for Transport Compared with Alternative Fuels. Energies 2019, 12, 532. [Google Scholar] [CrossRef] [Green Version]
  26. Latvia Cabinet of Ministers. National Energy and Climate Plan of Latvia 2021–2030; Latvia Cabinet of Ministers: Riga, Latvia, 2018. [Google Scholar]
  27. IEA. Renewables 2020: Analysis and Forecast to 2025; International Energy Agency: Paris, France, 2020. [Google Scholar]
  28. Marks, S.; Dach, J.; Fernandez Morales, F.; Mazurkiewicz, J.; Pochwatka, P.; Gierz, Ł. New Trends in Substrates and Biogas Systems in Poland. J. Ecol. Eng. 2020, 21, 19–25. [Google Scholar] [CrossRef]
  29. Vasco-Correa, J.; Khanal, S.; Manandhar, A.; Shah, A. Anaerobic Digestion for Bioenergy Production: Global Status, Environmental and Techno-Economic Implications, and Government Policies. Bioresour. Technol. 2018, 247, 1015–1026. [Google Scholar] [CrossRef] [PubMed]
  30. Szabó, G.; Fazekas, I.; Szabó, S.; Szabó, G.; Buday, T.; Paládi, M.; Kisari, K.; Kerényi, A. The Carbon Footprint of a Biogas Power Plant. Environ. Eng. Manag. J. 2014, 13, 2867–2874. [Google Scholar] [CrossRef]
  31. Ehlers, M.-H. Farmers’ Reasons for Engaging in Bioenergy Utilisation and Their Institutional Context: A Case Study in Germany. In Proceedings of the IAMO Forum 2008, Halle, Germany, 25–27 June 2008; pp. 1–12. [Google Scholar]
  32. Souza, G.M.; Victoria, R.L.; Joly, C.A.; Verdade, L.M. Bioenergy & Sustainability: Bridging the Gaps; Scientific Committee on Problems of the Environment: São Paulo, Brazil, 2015; ISBN 978-2-9545557-0-6. [Google Scholar]
  33. Dubrovskis, V. Biogas from Landfills in Latvia. In Proceedings of the 6th International Conference on Renewable Energy Gas Technology, Malmö, Sweden, 20–21 May 2019; pp. 1–2. [Google Scholar]
  34. Gostomczyk, W. Stan i Perspektywy Rozwoju Rynku Biogazu w UE i Polsce—Ujęcie Ekonomiczne. Zesz. Nauk. SGGW W Warszawie—Probl. Rol. Swiat. 2017, 17, 48–64. [Google Scholar] [CrossRef] [Green Version]
  35. Rozakis, S.; Bartoli, A.; Dach, J.; Jędrejek, A.; Kowalczyk-Juśko, A.; Mamica, Ł.; Pochwatka, P.; Pudelko, R.; Shu, K. Policy Impact on Regional Biogas Using a Modular Modeling Tool. Energies 2021, 14, 3738. [Google Scholar] [CrossRef]
  36. Bencheva, N.; Tepavicharova, M. Opportunities and Attitudes of Farmers to the Production of Biogas and Bio-Based Fertilisers in Bulgaria. Probl. Agric. Econ. 2017, 352, 92–102. [Google Scholar] [CrossRef]
  37. Chodkowska-Miszczuk, J.; Szymańska, D. Agricultural Biogas Plants—A Chance for Diversification of Agriculture in Poland. Renew. Sustain. Energy Rev. 2013, 20, 514–518. [Google Scholar] [CrossRef]
  38. Jørgensen, M.S.; Andersen, B.H. The Controversies Over Bioenergy in Denmark: ‘Bio’ Is Not the Same as ‘Sustainable’. Environ. Eng. Manag. J. 2012, 11, 2101–2119. [Google Scholar] [CrossRef]
  39. Ruģele, K.; Gruškeviča, K.; Rubulis, J.; Kalniņa, I. Risk Assessment of Nutrient Discharges from Biogas Production; Riga Technical University: Riga, Latvia, 2017. [Google Scholar]
  40. Banasik, P.; Białowiec, A.; Czekała, W.; Chomiuk, D.; Dach, J.; Filipiak, I.; Fugol, M.; Kacała, M.; Kowalczyk-Juśko, A.; Kolasiński, M.; et al. Biogaz w Polsce; Biomass Media Group Sp. z o.o.: Poznań, Poland, 2020. [Google Scholar]
  41. IEA. Technology Roadmap: Delivering Sustainable Bioenergy; International Energy Agency: Paris, France, 2017. [Google Scholar]
  42. Gasper, R.; Searchinger, T. The Production and Use of Renewable Natural Gas as a Climate Strategy in the United States; Working Paper; World Resources Institute: Washington, DC, USA, 2018; Available online: https://static1.squarespace.com/static/53a09c47e4b050b5ad5bf4f5/t/5b049d7d03ce646fda48e14f/1527029122737/production-use-renewable-natural-gas-climate-strategy-united-states.pdf (accessed on 12 February 2022).
  43. Li, H.; Tan, Y.; Ditaranto, M.; Yan, J.; Yu, Z. Capturing CO2 from Biogas Plants. Energy Procedia 2017, 114, 6030–6035. [Google Scholar] [CrossRef]
  44. Jensen, I.G.; Skovsgaard, L. The Impact of CO2-Costs on Biogas Usage. Energy 2017, 134, 289–300. [Google Scholar] [CrossRef] [Green Version]
  45. Kim, T.-J.; Lang, A.; Chikukwa, A.; Sheridan, E.; Dahl, P.I.; Leimbrink, M.; Skiborowski, M.; Roubroeks, J. Enzyme Carbonic Anhydrase Accelerated CO2 Absorption in Membrane Contactor. Energy Procedia 2017, 114, 17–24. [Google Scholar] [CrossRef]
  46. Fajardy, M.; Mac Dowell, N. Can BECCS Deliver Sustainable and Resource Efficient Negative Emissions? Energy Environ. Sci. 2017, 10, 1389–1426. [Google Scholar] [CrossRef] [Green Version]
  47. Consoli, C. Bioenergy and Carbon Capture and Storage: 2019 Perspective; Global CCS Institute: Melbourne, Australia, 2019. [Google Scholar]
  48. Scarlat, N.; Dallemand, J.-F.; Fahl, F. Biogas: Developments and Perspectives in Europe. Renew. Energy 2018, 129, 457–472. [Google Scholar] [CrossRef]
  49. Savickis, J.; Zemite, L.; Zeltins, N.; Bode, I.; Jansons, L. Natural Gas and Biomethane in the European Road Transport: The Latvian Perspective. Latv. J. Phys. Tech. Sci. 2020, 57, 57–72. [Google Scholar] [CrossRef]
  50. Pardo, G.; del Prado, A.; Martínez-Mena, M.; Bustamante, M.A.; Martín, J.A.R.; Álvaro-Fuentes, J.; Moral, R. Orchard and Horticulture Systems in Spanish Mediterranean Coastal Areas: Is There a Real Possibility to Contribute to C Sequestration? Agric. Ecosyst. Environ. 2017, 238, 153–167. [Google Scholar] [CrossRef] [Green Version]
  51. Alvarez, R.A.; Zavala-Araiza, D.; Lyon, D.R.; Allen, D.T.; Barkley, Z.R.; Brandt, A.R.; Davis, K.J.; Herndon, S.C.; Jacob, D.J.; Karion, A.; et al. Assessment of Methane Emissions from the U.S. Oil and Gas Supply Chain. Science 2018, 361, 186–188. [Google Scholar] [CrossRef] [PubMed]
  52. Sulewski, P.; Majewski, E.; Was, A. Supporting Sustainable Agriculture: The Potential to Reduce GHG Emissions—The Case of Agricultural Biogas Production in Poland. Rocz. Ochr. Sr. 2018, 20, 662–680. [Google Scholar]
  53. Berdechowski, K. Assessment of the Key Factors Affecting GHG Emissions in the Life Cycle of Biomethane. Nafta-Gaz 2020, 76, 630–636. [Google Scholar] [CrossRef]
  54. Kampman, B.; Leguijt, C.; Scholten, T.; Tallat-Kelpsaite, J.; Brückmann, R.; Maroulis, G.; Lesschen, J.P.; Meesters, K.; Sikirica, N.; Elbersen, B. Optimal Use of Biogas from Waste Streams. An Assessment of the Potential of Biogas from Digestion in the EU beyond 2020; Directorate-General for Energy, European Commission: Brussel, Belgium, 2016. [Google Scholar]
  55. Agostini, A.; Battini, F.; Giuntoli, J.; Tabaglio, V.; Padella, M.; Baxter, D.; Marelli, L.; Amaducci, S. Environmentally Sustainable Biogas? The Key Role of Manure Co-Digestion with Energy Crops. Energies 2015, 8, 5234–5265. [Google Scholar] [CrossRef]
  56. Murphy, J.; Braun, R.; Weiland, P.; Wellinger, A. Biogas from Crop Digestion; IEA Bioenergy: Paris, France, 2011. [Google Scholar]
  57. Kalnina, I.; Rugele, K.; Rubulis, J. Digestate Management Practices in Latvia from Nitrogen Perspective. Energy Procedia 2018, 147, 368–373. [Google Scholar] [CrossRef]
  58. Latvian State Environmental Services. Nutrient Management at Biogas Plants in Latvia; Latvian State Environmental Services: Riga, Latvia, 2021.
  59. Pubule, J.; Blumberga, D. Impact Assessment of Biogas Projects in Latvia. Int. J. Sustain. Dev. Plan. 2014, 9, 251–262. [Google Scholar] [CrossRef] [Green Version]
  60. Melece, L.; Lakovskis, P. Land use changes and bioenergy in Latvia. In Proceedings of the Economic Science for Rural Development: Production and Cooperation in Agriculture, Jelgava, Latvia, 26–27 April 2017; pp. 180–188. [Google Scholar]
  61. Lask, J.; Martínez Guajardo, A.; Weik, J.; Cossel, M.; Lewandowski, I.; Wagner, M. Comparative Environmental and Economic Life Cycle Assessment of Biogas Production from Perennial Wild Plant Mixtures and Maize (Zea mays L.) in Southwest Germany. GCB Bioenergy 2020, 12, 571–585. [Google Scholar] [CrossRef]
  62. Menandro, L.M.S.; Cantarella, H.; Franco, H.C.J.; Kölln, O.T.; Pimenta, M.T.B.; Sanches, G.M.; Rabelo, S.C.; Carvalho, J.L.N. Comprehensive Assessment of Sugarcane Straw: Implications for Biomass and Bioenergy Production. Biofuels Bioprod. Biorefining 2017, 11, 488–504. [Google Scholar] [CrossRef]
  63. Novák, P.; Mašek, J.; Hůla, J.; Beneš, L.; Kumhálová, J. Soil tillage focusing on the reduction of water erosion of soil in the cultivation of selected field crops. In Proceedings of the 7th International Scientific Conference Rural Development 2015, Kaunas, Lithuania, 19 November 2015; Aleksandras Stulginskis University: Dotnuva, Lithuania, 2015. [Google Scholar]
  64. European Parliament. The European Parliament and of the Council Directive (EU) 2018/2001 of the European Parliament and of the Council of 11 December 2018 on the Promotion of the Use of Energy from Renewable Sources; Official Journal of the European Union; European Parliament: Strasbourg, France, 2018. [Google Scholar]
  65. Giuntoli, J.; Agostini, A.; Edwards, R.; Marelli, L. Solid and Gaseous Bioenergy Pathways: Input Values and GHG Emissions: Calculated According to the Methodology Set in COM(2010) 11 and SWD(2014) 259; Version 1a; European Commission: Luxembourgh, 2015. [Google Scholar]
  66. Ministry of Economics, Republic of Latvia. Vitenbergs: The Government Takes the Next Step in the Arrangement of the MPC System and Further Reinforces Supervision of Mandatory Procurement Power Plants. Available online: https://www.em.gov.lv/en/article/vitenbergs-government-takes-next-step-arrangement-mpc-system-and-further-reinforces-supervision-mandatory-procurement-power-plants (accessed on 20 April 2022).
  67. Ministry of Economics, Republic of Latvia. In the 10 Months of This Year, State Aid Was Cancelled for 16 MPC Power Plants, Allowing the State to Save Around 24 Million EUR. Available online: https://www.em.gov.lv/en/article/10-months-year-state-aid-was-cancelled-16-mpc-power-plants-allowing-state-save-around-24-million-eur (accessed on 20 April 2020).
  68. NIK. Bariery Rozwoju Odnawialnych Źródeł Energii; Najwyższa Izba Kontroli: Warsaw, Poland, 2021.
  69. Gostomczyk, W. The Auction System as a New Way to Promote Renewable Energy. Zesz. Nauk. SGGW W Warszawie—Probl. Rol. Swiat. 2018, 18, 113–133. [Google Scholar] [CrossRef] [Green Version]
  70. KOWR. Dane Dotyczące Działalności Wytwórców Biogazu Rolniczego w Latach 2011–2021. Available online: https://bip.kowr.gov.pl/informacje-publiczne/odnawialne-zrodla-energii/biogaz-rolniczy/dane-dotyczace-dzialalnosci-wytworcow-biogazu-rolniczego-w-latach-2011-2021 (accessed on 20 April 2022).
  71. Jain, S.; Newman, D.; Nzihou, A.; Dekker, H.; le Feuvre, P.; Richter, H.; Gobe, F.; Morton, C.; Thompson, R. Global Potential of Biogas; The World Biogas Association: London, UK, 2019. [Google Scholar]
  72. Wicki, L. Changes in Land Use for Production of Energy Crops in Poland. Rocz. Nauk. Ekon. Rol. I Rozw. Obsz. Wiej. 2017, 104, 37–47. [Google Scholar] [CrossRef]
  73. Szempliński, W.; Parzonka, A.; Sałek, T. Yield and Energy Efficiency of Biomass Production of Some Species of Plants Grown for Biogas. Acta Sci. Pol. Agric. 2014, 13, 67–80. [Google Scholar]
  74. Gostomczyk, W. Agricultural Biogas Market in Poland and the Raw Material Used in 2011–2014. Zesz. Nauk. SGGW W Warszawie—Probl. Rol. Swiat. 2015, 15, 30–39. [Google Scholar]
  75. Błażejowska, M.; Gostomczyk, W. Warunki Tworzenia i Stan Rozwoju Spółdzielni i Klastrów Energetycznych w Polsce Na Tle Doświadczeń Niemieckich. Zesz. Nauk. SGGW W Warszawie—Probl. Rol. Swiat. 2018, 18, 20–32. [Google Scholar] [CrossRef] [Green Version]
  76. IRENA. Renewable Power Generation Costs in 2020; IRENA: Abu Dhabi, United Arab Emirates, 2021. [Google Scholar]
  77. Kowalczyk-Juśko, A. Biogazownie Szansą Dla Rolnictwa i Środowiska; Grzybek, A., Ed.; Fundacja na Rzecz Rozwoju Polskiego Rolnictwa: Warszawa, Poland, 2016. [Google Scholar]
  78. IRENA. Global Bioenergy. Supply and Demand Projections; A Working Paper for REmap 2030; International Renewable Energy Agency: Abu Dhabi, United Arab Emirates, 2014. [Google Scholar]
  79. Bahrs, E.; Angenendt, E. Status Quo and Perspectives of Biogas Production for Energy and Material Utilization. GCB Bioenergy 2019, 11, 9–20. [Google Scholar] [CrossRef]
  80. Instytut Energetyki Odnawialnej. Podsumowanie Aukcji OZE w 2021 Roku. Available online: https://www.ieo.pl/pl/aktualnosci/1547-podsumowanie-aukcji-oze-w-2021-roku (accessed on 27 July 2022).
  81. Doronin, A.; Polishchuk, O.; Rybchak, V. Potential of Renewable Sources in Ukraine. Tur. I Rozw. Reg. 2021, 15, 25–31. [Google Scholar] [CrossRef]
  82. Trypolska, G.; Kyryziuk, S.; Krupin, V.; Wąs, A.; Podolets, R. Economic Feasibility of Agricultural Biogas Production by Farms in Ukraine. Energies 2021, 15, 87. [Google Scholar] [CrossRef]
  83. Bórawski, P.; Guth, M.; Bełdycka-Bórawska, A.; Jankowski, K.J.; Parzonko, A.; Dunn, J.W. Investments in Polish Agriculture: How Production Factors Shape Conditions for Environmental Protection? Sustainability 2020, 12, 8160. [Google Scholar] [CrossRef]
  84. Świechowski, K.; Hnat, M.; Stępień, P.; Stegenta-Dąbrowska, S.; Kugler, S.; Koziel, J.A.; Białowiec, A. Waste to Energy: Solid Fuel Production from Biogas Plant Digestate and Sewage Sludge by Torrefaction-Process Kinetics, Fuel Properties, and Energy Balance. Energies 2020, 13, 3161. [Google Scholar] [CrossRef]
  85. Koryś, K.A.; Latawiec, A.E.; Grotkiewicz, K.; Kuboń, M. The Review of Biomass Potential for Agricultural Biogas Production in Poland. Sustainability 2019, 11, 6515. [Google Scholar] [CrossRef] [Green Version]
  86. Zaborowska, M.; Bernat, K.; Jankowski, D. Wykorzystanie Odpadów z Przemysłu Rolno-Spożywczego Do Współfermentacji z Osadami Ściekowymi. In Współczesne Problemy Ochrony Środowiska i Energetyki 2019; Pikoń, K., Bogacka, M., Eds.; Silesian University of Technology (PolSL): Gliwice, Poland, 2020; Volume 2019, pp. 15–22. [Google Scholar]
Figure 1. Biogas production in 2020 in EU countries, in PJ. Based on data from Eurostat (NRG_CB_RW__custom_1620088).
Energies 15 05623 g001
Figure 2. Structure of feedstock used in agricultural biogas plants in Latvia and Poland in dry matter—Sn (average for 2015–2019).
Energies 15 05623 g002
Figure 3. Savings in CO2 emissions in energy production in agricultural biogas plants in Latvia and Poland, 2011–2019.
Energies 15 05623 g003
Figure 4. Reduction in CO2 resulting from emissions from energy production in agricultural biogas plants in Latvia and Poland compared to emissions from the production of the same amount of energy from hard coal combustion, 2011–2019.
Energies 15 05623 g004
Table 1. Number of agricultural biogas plants, agricultural biogas production, and energy production in agricultural biogas in Latvia and Poland.
YearInformation about Agricultural Biogas Production
Number of PlantsBiogas Production in Million m3Energy Produced in Biogas in TJ
LatviaPolandLatviaPolandLatviaPoland
201115826.236.6497634
2012361691.173.217311463
20134928119.5112.422702084
20145342141.5174.326882825
20155458170.5206.232393413
20165578175.2250.233283504
20175094182.3291.734634921
20185096170.7303.632435585
20194996156.3306.429705693
Table 2. Feedstock use in agricultural biogas plants in Latvia and Poland in 2011–2019.
YearFeedstock Use in kt of Wet Matter (In)
LatviaPoland
ManureCorn SilageFood WasteTotalManureCorn SilageFood WasteFatty WasteTotal
2011158.596.861.1316.5277.6129.062.50.3469.4
2012555.7336.2212.61104.4372.7282.8258.92.7917.1
2013675.2446.3278.81400.3486.4402.8673.510.91573.5
2014841.9524.3330.21696.4622.9638.5854.87.02123.2
2015912.2633.4426.31971.8658.9654.91168.22.82484.8
2016911.0649.1452.62012.8886.8748.11583.55.83224.1
2017920.6669.0501.32091.0911.0885.21992.87.93796.9
2018904.7617.9483.72006.3865.5847.12275.112.64000.3
2019843.2559.1460.11862.5838.1731.82366.321.23957.5
Share 145.2%31.5%23.4%100.0%23.8%22.1%53.7%0.3%100.0%
CAGR 214.7%16.4%20.0%16.4%14.3%19.9%39.7%35.0%25.2%
1 Average in 2015–2019, 2 growth rate in the period 2011–2019, based on the exponential growth rate.
Table 3. Emission per 1 MJ of agricultural biogas energy.
YearEmission from Particular Feedstocks in g CO2 per 1 MJ Energy from Agricultural Biogas (En × Sn)
LatviaPoland
ManureCorn SilageFood WasteTotalManureCorn SilageFood WasteFatty WasteTotal
2011−10.117.51.48.8−13.217.41.10.05.3
2012−10.217.51.48.7−7.616.41.90.210.8
2013−9.417.71.49.7−5.813.62.90.411.1
2014−9.917.51.49.0−5.215.22.60.212.7
2015−8.917.51.510.1−5.014.03.20.112.3
2016−8.617.51.610.4−5.412.93.50.111.1
2017−8.417.31.710.6−4.612.73.70.111.9
2018−8.817.01.710.0−4.211.74.00.211.7
2019−8.916.81.89.7−4.210.54.30.310.9
Table 4. Total energy generation in biogas in agricultural biogas plants.
YearBiogas Energy Production in Agricultural Biogas Plant in TJ, Broken down by Type of Substrate
LatviaPoland
ManureCorn SilageFood WasteTotalManureCorn SilageFood WasteFatty WasteTotal
201157.0362.078.1497.095.2459.976.22.8634.0
2012200.11259.0271.91731.0126.5998.2312.126.11463.0
2013243.01670.6356.42270.0137.41183.4675.987.32084.0
2014303.11962.7422.22688.0167.61786.7817.153.62825.0
2015327.82367.1544.13239.0192.21986.91210.423.43413.0
2016327.12423.7577.23328.0215.01885.91363.539.73504.0
2017330.12494.8638.53463.4257.32600.51999.663.54921.0
2018324.22302.9615.63242.8266.82715.92491.4110.55584.7
2019302.02082.6585.42970.0273.32482.02741.1196.75693.2
Share 19.9%71.9%18.2%100.0%5.2%50.5%42.4%1.9%100.0%
1 Share of a particular feedstock in the average structure of energy in biogas in 2015–2019.
Publisher’s Note: MDPI stays neutral with regard to jurisdictional claims in published maps and institutional affiliations.

