Article

Influence of Height–Diameter Ratio on Rock Compressive Failure Characteristics and Damage Evolution Law

1
State Key Laboratory of Deep Coal Mine Mining Response and Disaster Prevention and Control, Anhui University of Science and Technology, Huainan 232000, China
2
School of Mining Engineering, Anhui University of Science and Technology, Huainan 232000, China
3
Post-Doctoral Research Station, Huaibei Mining Corporation Limited, Huaibei 235000, China
*
Authors to whom correspondence should be addressed.
Energies 2022, 15(15), 5557; https://doi.org/10.3390/en15155557
Submission received: 1 June 2022 / Revised: 3 July 2022 / Accepted: 27 July 2022 / Published: 30 July 2022

Abstract

:
In underground projects such as mining and tunneling, the presence of coal rock columns plays a certain supporting role, and the instability of coal rock columns is often related to their size and shape of presence. Therefore, in order to investigate the compressive damage characteristics and damage evolution law of rocks of different sizes, uniaxial compression tests were conducted on sandstones with different height−diameter ratios to explore the mechanical properties and damage characteristics of sandstones with different height−diameter ratios, analyze the connection between acoustic emission ringing count rate, accumulated energy, peak frequency, and b-value changes and height–diameter ratio, and analyze the evolution law of sandstones during damage based on damage variables, and draw the following conclusions. As the height-to-diameter ratio increases, the less affected by the end effect, the rock strength shows a nonlinear decreasing trend, and the decreasing trend becomes slow. The acoustic emission ringing count rate evolved from intermittent to continuous occurrence, showing multiple peaks as the test proceeded. The accumulated energy rises sharply before rupturing after several steps from stable development. As the height-to-diameter ratio increases, the acoustic emission signal before rupture rises more intensively, and the damage is more concentrated. The overall level of the b-value shows an increasing trend, the proportion of acoustic emission high-frequency signal gradually increases, and the development of tiny cracks inside the rock more intensively. Therefore, the sudden change of acoustic emission signal can be used as a precursor of rock damage. The rock damage curve has smaller values in the stable damage phase. With the increase in the height-to-diameter ratio, the non-stable damage stage damage showed a trend of decreasing and then increasing and reached the minimum at L/D = 2.0.

1. Introduction

In mining and tunnels, coal and rock pillars have a supporting role, and the instability of coal and rock pillars is often related to their existing height, width, and shape. After the roadway is excavated and unloaded, the external confining pressure of the surrounding rock decreases, and the unit body approximates a uniaxial compression state. Since rock is a non-uniform, discontinuous, and nonlinear natural geological material, there are differences in the propagation law of internal cracks in rock blocks of different sizes. This leads to different mechanical properties of rock blocks during macroscopic instability because the rock damage is affected by the size effect when it is damaged [1,2,3]. The application of acoustic emission technology can study the characteristics of crack development in the process of rock fracture and analyze the influence of rock size changes on the crack evolution law. This paper will take sandstone as an example to study rock’s mechanical properties and damage evolution law under different height–diameter ratio conditions.
In recent years, many experts and scholars have studied the small size effect using various experimental means and monitoring methods. Yang et al. [4,5] conducted uniaxial compression tests on marble samples with the same diameter and different lengths. They observed the influence of the height–diameter ratio on the uniaxial compressive strength and failure form of the rock samples, and the rock deformation peak was compared before and after the peak. Komurlu [6] conducted uniaxial compression tests with different loading paths on rock specimens with the same aspect ratio but different sizes. The experimental results show that the stress–strain relationship and deformation characteristics of the specimens change with the size of the specimen and the loading rate. Shi et al. [7] studied the uniaxial compression test of fine sandstone samples with diameters ranging from 25 to 75 mm, focused on analyzing the strength characteristics of the samples and the acoustic emission characteristics before the peak, and corrected the impact energy index correction factor for different sizes. Yilmaz et al. [8] investigated the effect of the height–diameter ratio on the unconfined compressive strength of plastic clay by conducting experiments on plastic clays with different height–diameter ratios. Zhao et al. [9] found that the elastic energy evolution of sandstones with different height–diameter ratios obeys the linear energy storage law during the uniaxial compression test. Liang et al. [10] made statistics on the distribution of visible joints to connect the intact rock mass and the jointed rock mass. Tuncay et al. [11,12] analyzed the effect of rock size on uniaxial compressive strength by studying different rock samples with height-to-diameter ratios ranging from 1 to 2.5:1 and further deduced the formulae for converting uniaxial compressive strength of rocks with different height-to-diameter ratios into standard values and explored the optimal range of height-to-diameter ratios for uniaxial compressive strength of rocks with different lithologies. Zhu et al. [13] coupled the modified GM (1,1) model of grey prediction with the gray-hopping process theory according to the rock uniaxial compression test results. They established the nonlinear relationship between rock uniaxial compressive strength and sample aspect ratio under three states. Darlington et al. [14] found that the relationship between strength and size of rocks depends not only on the type of rock but also on factors such as the boundary conditions to which the specimen is subjected. Liu et al. [15,16] studied the rockburst characteristics of surrounding rock structures and revealed the spatiotemporal evolution law of rockburst by combining acoustic emission ringing counts, accumulated energy, and spatial positioning parameters. Wen et al. [17] used the acoustic emission system to monitor the coal and rock mass damage evolution during the dynamic and static combined cyclic loading test. Established the corresponding relationship between the stress–strain curve and the acoustic emission signal and divided the evolution process of the failure energy of the sample into stages. Wang et al. [18] conducted numerical simulations of uniaxial compression creep for rock samples of different sizes and analyzed rocks’ long-term strength and size effects. Liang et al. [19] used the variable frequency dynamic loading rock mechanics experimental system to conduct medium and low strain rate loading experiments on granite of four lengths. The study showed that the rock fracture degree is more severe with the increase in the strain rate. Tatiana et al. [20] conducted uniaxial compression tests on four different types of rocks, limestone, granitic amphibolite, sandstone, and andesite, under different height–diameter ratio conditions, and the results showed that the uniaxial compressive strength of the rocks decreased with increasing height–diameter ratio, and only some of the andesites showed the opposite property. Jiang et al. [21] carried out uniaxial compression acoustic emission tests on coal samples with a strong impact tendency of different sizes. They studied the dynamic evolution law of acoustic emission parameters in the process of deformation and failure. Hong et al. [22] conducted SHPB tests on sandstone and limestone samples of different sizes. They found that under the same strain rate, the dynamic strength of rock increases with the increase in sample size, which is opposite to the size effect under static load conditions. Meng et al. [23] conducted uniaxial compression tests at six strain rate levels to analyze the effect of dimensional strain rate on the mechanical properties of rock samples, such as peak strength, elastic modulus, peak strain, and damage morphology and analyzed the changing pattern of acoustic emission signals during the damage of the specimens. QI et al. [24] studied the influence of dynamic and static size effects on rock mass strength. Pankov et al. [25] determined the secondary scale effect as the basis for quasi-plastic salt-bearing rocks based on compression experiments with different types of silicate and rock salt specimens, giving the relationship between fundamental rock properties and mechanical indices of prismatic samples. Based on the discrete element PFC2D software, Li et al. [26] established a uniaxial compression model in a two-dimensional state to reveal the influence of clay mineral content on the mechanical parameters of mudstone. To sum up, many achievements have been made in experimental and theoretical studies on the effect of the small size of rocks. However, due to the significant difference in physical and mechanical properties of various rocks, different types of rocks have different sensitivity to the effect of small size. In order to further investigate the effect of dimensional changes of coal rock columns on the stability of underground engineering, it is necessary to conduct relevant tests on rocks of different sizes to ensure the safe and efficient conduct of underground engineering activities.
The author uses the WAW-2000 servo universal testing machine and Soft Island DS5 acoustic emission system to conduct rock failure and instability tests under different height–diameter ratios. Through four sets of tests with height–diameter ratios of 1.6, 1.8, 2.0, and 2.2, the failure morphology and mechanical characteristics of rock samples with different height–diameter ratios were analyzed. The evolution law of acoustic emission ringing count rate, accumulated energy count, peak frequency, and b value is discussed. The changing trend of damage in rock deformation and failure is studied based on the damage variable.

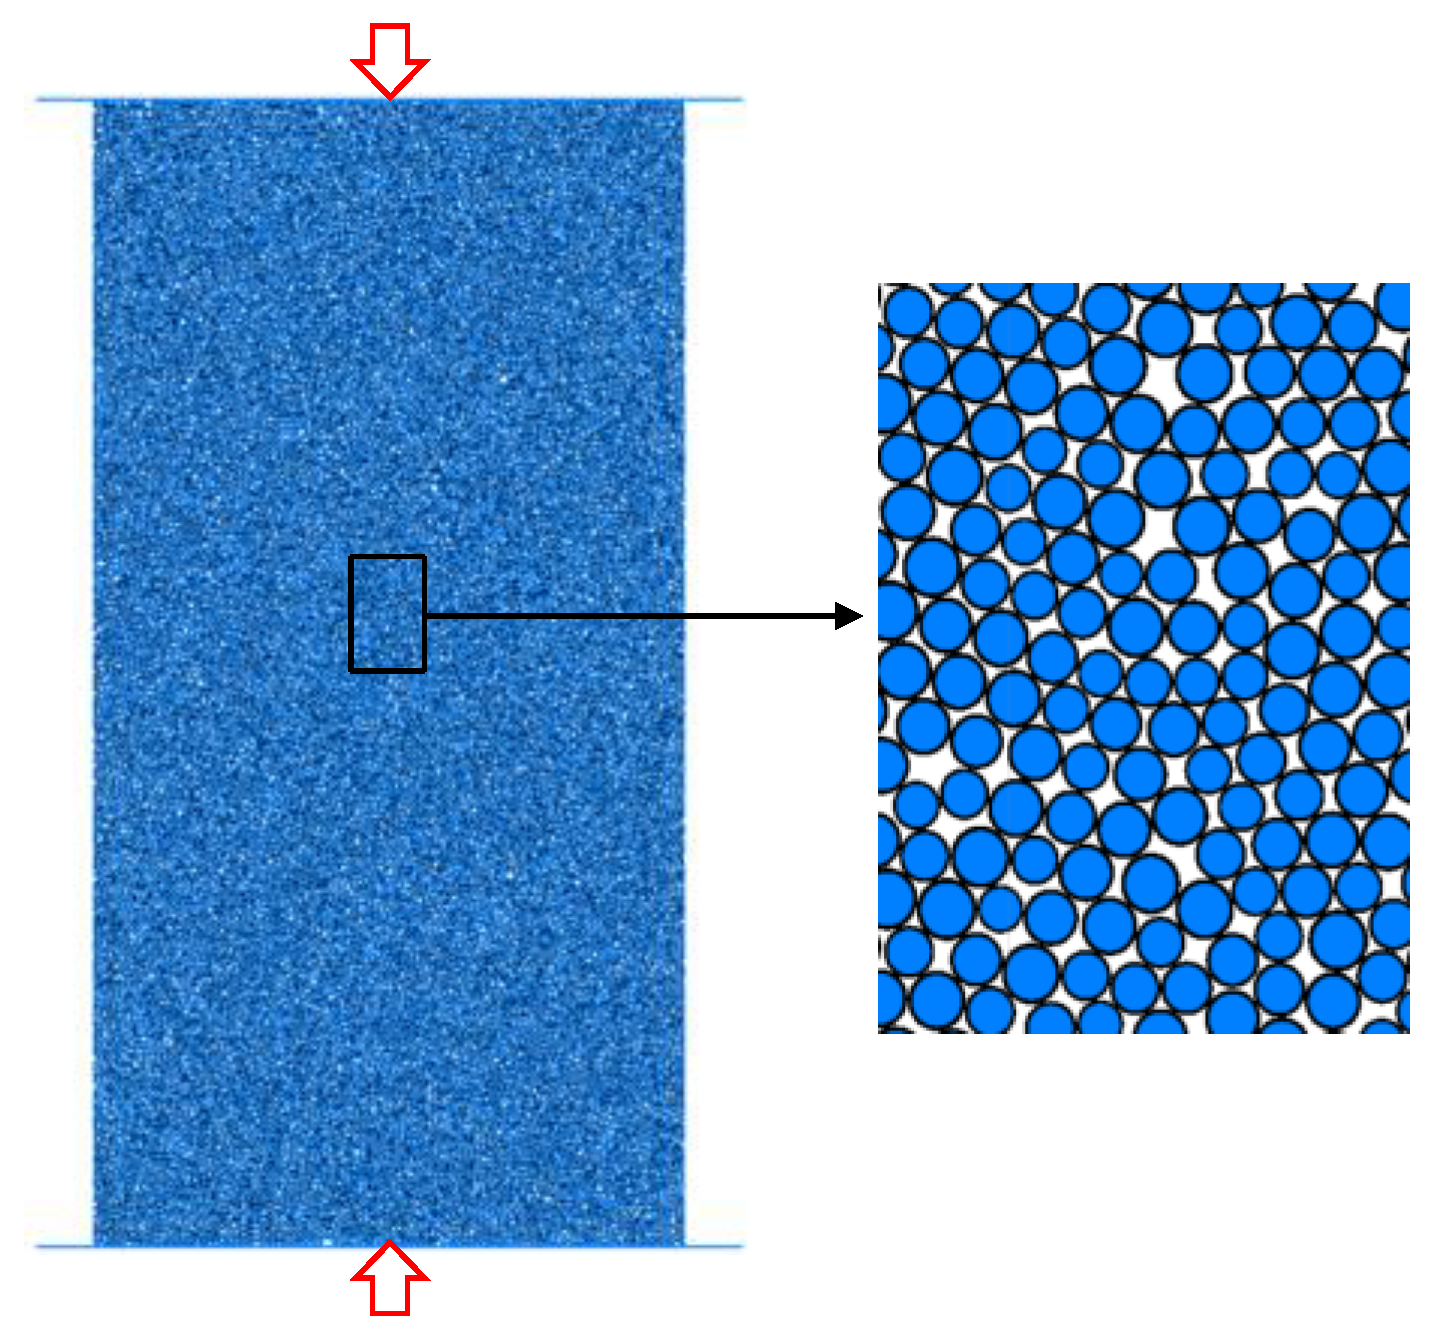
2. Test Materials and Test Methods

The test took sandstone as the research object, and the original rock was taken from a mine in Liaoning. In order to reduce the test error, the samples were taken from the same original rock and processed into sandstone samples with a diameter of 50 mm, a height of 80 mm, 90 mm, 100 mm, and 110 mm. Since the height–diameter ratio test has high requirements on the size of the sample, it is necessary to ensure that the flatness error of the end face is not more than 0.05 mm, and the diameter deviation of the two ends of the sample is not more than 0.3 mm. After the sample is processed, it should be dried naturally for a week.
The test adopts the WAW-2000 servo universal testing machine, consisting of three parts: loading, test, and control. The acoustic emission monitoring system adopts the Soft Island DS5 acoustic emission system. The acoustic emission sensor adopts an acoustic emission amplifier, signal filter, and amplifier gain is 40 dB. The frequency range is 5 kHz~1500 kHz, the sampling frequency is 2500 kHz, and the parameter interval is 200 μs. The sensor’s acoustic emission signal is further processed into acoustic emission parameters by the acoustic emission instrument after pre-amplification and the main amplifier. Before the test, the acoustic emission automatic calibration system is used to conduct a lead-breaking test on the sample to obtain the acoustic emission wave velocity and install the acoustic emission probe. To reduce the influence of end-face friction on the test, apply lubricant to the contact position between the loading head of the testing machine and the sample. The test loading system and acoustic emission system are shown in Figure 1.
The test was divided into four groups. The height-to-diameter ratio (from now on, expressed as L/D) was 1.6, 1.8, 2.0, and 2.2. Each group of three rock samples, loading test process using stress control, axial pressure preload of 1 kN, loading speed of 1 kN/s until the sample damage.

3. Analysis of Test Results

3.1. Mechanical Characteristics of Sandstones with Different Height-to-Diameter Ratios

To investigate the effect of the height-to-diameter ratio on rocks’ mechanical properties. Using the stress–strain curves of sandstone at different height-to-diameter ratios to explore the influence of changing height-to-diameter ratios on rock strength, deformation, and fracture patterns. The uniaxial compressive stress–strain curves of sandstone with different height-to-diameter ratios are shown in Figure 2.
As can be seen from Figure 2 that in the uniaxial compression test of sandstones with different height-to-diameter ratios, the change trends of the stress−strain curves are the same. They all experienced the microcrack compaction stage, the elastic deformation stage, the stable crack development stage, and the crack uneven development stage. After reaching the peak strength, the stress drop occurs, the sample is damaged, and the bearing capacity is lost. The failure of the sandstone sample shows a vital brittleness feature. With the increase in the height−diameter ratio, the ultimate failure strength of the sample gradually decreased, indicating that the strength of the rock is related to the change in the height−diameter ratios. The mechanical parameters of rock samples with different height−diameter ratios are shown in Table 1.
As can be seen from the stress–strain curve, when the height–diameter ratio is small, the damage form of the rock is mainly manifested as sudden damage, and the stress appears as an obvious stress turning point after reaching the peak strength. The main reason is that the test loading method for force loading, when the main rupture surface of the specimen through, the strength of the specimen reduced, the test machine in order to balance the force of sudden loading caused by the sudden destruction of the specimen. Taking A1.6-1 as an example, the stress of the specimen suddenly dropped after reaching the peak strength, the sample lost its bearing capacity, and the overall failure occurred.
With the increase in the height–diameter ratio, rock deformation, and failure gradually transition from sudden failure to stable failure. After reaching the peak stress, the low-strength part of the sample yields and weakens. Although the overall bearing capacity of the sample is reduced, it is not entirely lost. At this time, due to the high-strength part inside the specimen, the overall stability of the specimen is maintained. With the further expansion of the crack, the strength of the specimen drops rapidly, and the overall instability fails. Take sample B1.8-2 as an example; after the sample reaches the peak strength, the stress decreases steadily before changing sharply. A small transitional phase appears after the curve drops after the peak. The reason is that the sample still has a specific bearing capacity after the first significant rupture, and the specimen destabilizes and ruptures in the process of stress gradual adjustment.

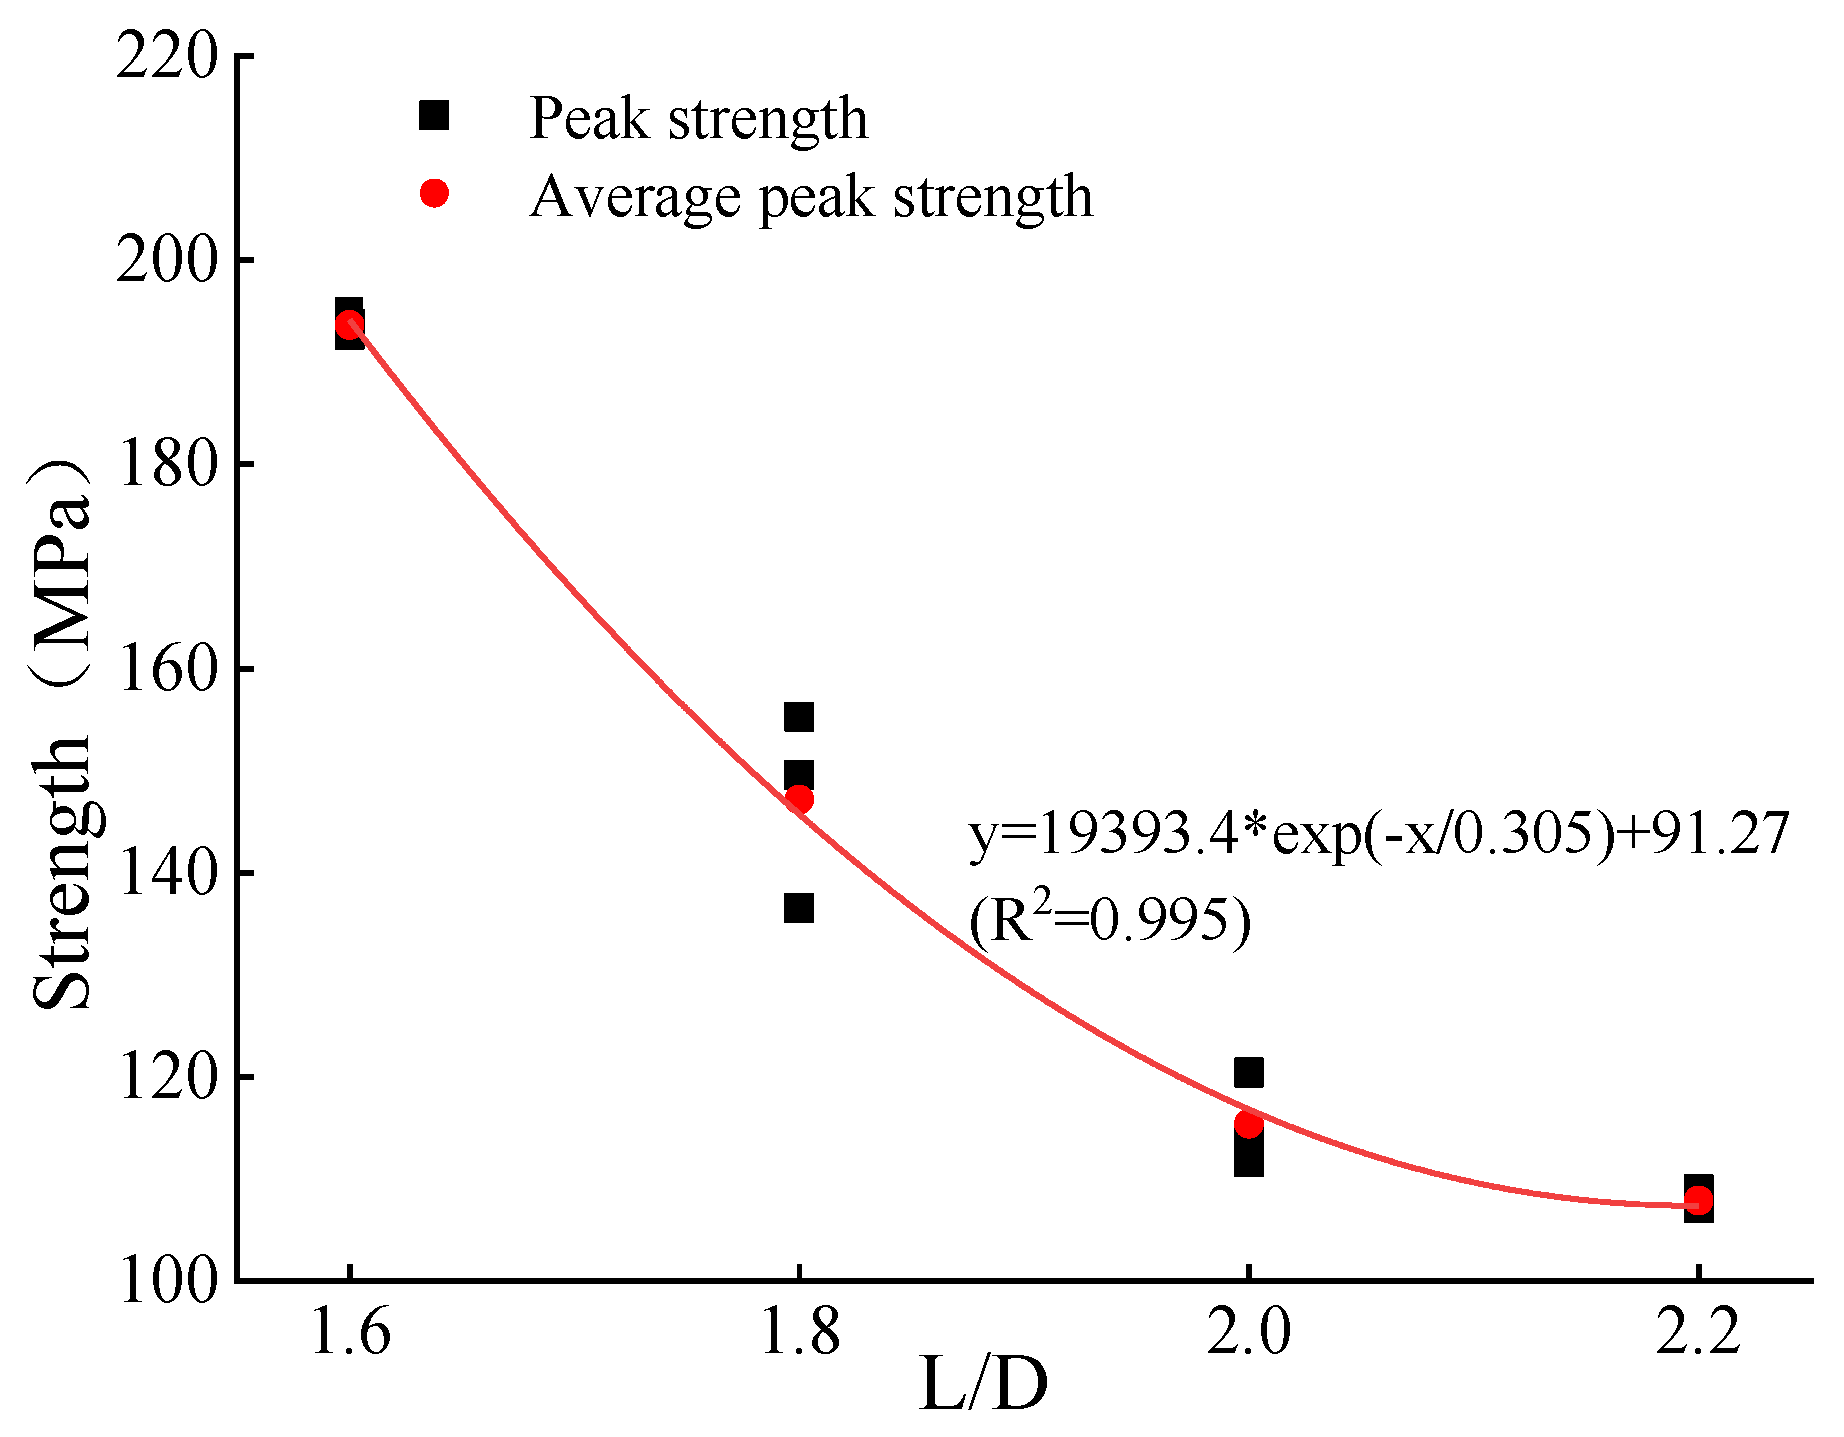
3.1.1. Influence of Height–Diameter Ratio Change on Sandstone Strength

Rock strength and failure criteria based on classical elastic-plastic theory have always been the basis for judging engineering failure or damage. The samples taken from the same rock mass have different height–diameter ratios, and the strengths will also be different. Engineering calculations will cause errors due to inaccurate parameter selection, influencing the accurate evaluation of engineering design and safety. There are certain restrictions. Therefore, it is urgent to analyze the variation law of peak strength of rock samples of different sizes. Many studies have shown that in laboratory tests, the size effect causes the difference in rock strength under different height–diameter ratios, which is related to the number of primary fractures in the sample and affected by the end-face friction effect [23,27,28]. Figure 3a,b, respectively, show the influence of the end face friction effect and the distribution of primary defects on the rock strength.
The end friction effect refers to the material near the end face of a cylindrical rock specimen being laterally constrained by the frictional force between the sample and the indenter of the testing machine under uniaxial compression, thus limiting the lateral deformation of the rock sample. Li et al. [29] found by UDEC numerical simulation that the end-face friction effect would inhibit the development and expansion of microscopic cracks, which transformed the damage form of brittle specimens and made the strength of sandstone significantly stronger. Peng et al. [30] found that the stress distribution and microcrack extension in the specimens were more uniform with increasing height-to-diameter ratio by compression tests on rocks with different height-to-diameter ratios. Chen [31] et al. found that end-face friction affects the distribution of stress and strain fields inside the rock, thus affecting the way the rock is damaged.
As can be seen from Figure 2 and Table 1, when the height–diameter ratio is small, the overall stress–strain curve of the sample is relatively smooth, and the difference in elastic modulus is slight, indicating that the specimen is relatively stable during the loading process. The specimen is less affected by primary internal defects. For example, when L/D = 1.6, the stress–strain curves of the specimens are relatively smooth, the slopes are roughly equal, and the dispersion of elastic modulus is small. As the height–diameter ratio increases, the stress–strain curve of the sample gradually fluctuates in a small range with the increase in the axial stress during the loading process, and the elastic modulus also fluctuate significantly in value. It can be seen that when the sample size increases, the proportion of microcracks inside the sample increases, making the specimen more discrete. The closure of the cracks during the loading process causes the stress–strain curve to fluctuate and the elastic modulus to differ.
Figure 4 shows the variation law of the peak strength and the average peak strength of the sample under different L/D. The average peak strength is the average value of each group of three rock samples. By analyzing the variation law of the average peak strength, as can be seen, the peak strength of the sample gradually decreases with the increase in L/D. When L/D = 1.6, the average strength is 193.65 MPa, and when L/D = 2.0, the average strength decreases to 115.36 MPa. This is because the rock material is an aggregate of mineral particles with heterogeneous characteristics, so the larger the size of the rock, the more micropores it contains, and the lower the peak strength. However, Yang et al. [4] and Liu et al. [32] pointed out that it is not only the native microfractures in the rocks that cause their strength reduction. Maybe it is because the non-uniform distribution of stresses inside the rocks is caused by the frictional effect of the indenter end of the testing machine under uniform loading, which may also affect the strength of the rocks. Through curve fitting, the relationship between the peak strength of the sample and the height–diameter ratio is obtained as follows:
y = 19393.4 * exp ( x / 0.305 ) + 91.27   ( R 2 = 0.995 )
where the variable x denotes the height-to-diameter ratio, the dependent variable y denotes the peak intensity of the rock at different height-to-diameter ratios, and R2 denotes the degree of the curve fit.
The analysis shows that the peak strength of the sample has a nonlinear relationship with the height–diameter ratio. With the increase in the height–diameter ratio, the decreasing rate of the rock peak strength gradually slows down, indicating that the sandstone has an apparent size effect. However, this is different from the conclusion of Liu et al. [32]. They analyzed the strength of yellow sandstone with the increase in the height–diameter ratio under the small size effect and the linear decline trend of the strength. The main reasons are analyzed. At the beginning of this paper, lubrication measures were taken at the end of the test machine to reduce the end friction effect between the test machine and the specimen. However, there was still some friction during the test, making the stress distribution inside the specimen affected by friction when the height–diameter was relatively small (L/D < 2.0). Thus, its peak load was higher. When the height and diameter are relatively large (L/D ≥ 2.0), the end friction constrains the deformation in the middle of the specimen less. Increasing the height-to-diameter ratio can hardly change the stress distribution in the middle part of the specimen to a large extent. At this time, the effect of the height–diameter ratio on the specimen’s interior is mainly due to the increase in the number of primary defects in the material. The effect on the peak strength gradually becomes smaller. Furthermore, for the standard sample L/D = 2, the average uniaxial compressive strength obtained in the actual test process is 115.36 MPa, and the peak strength obtained by correction according to the fitting curve is 118.72 MPa. The accuracy is increased by 2.3%.

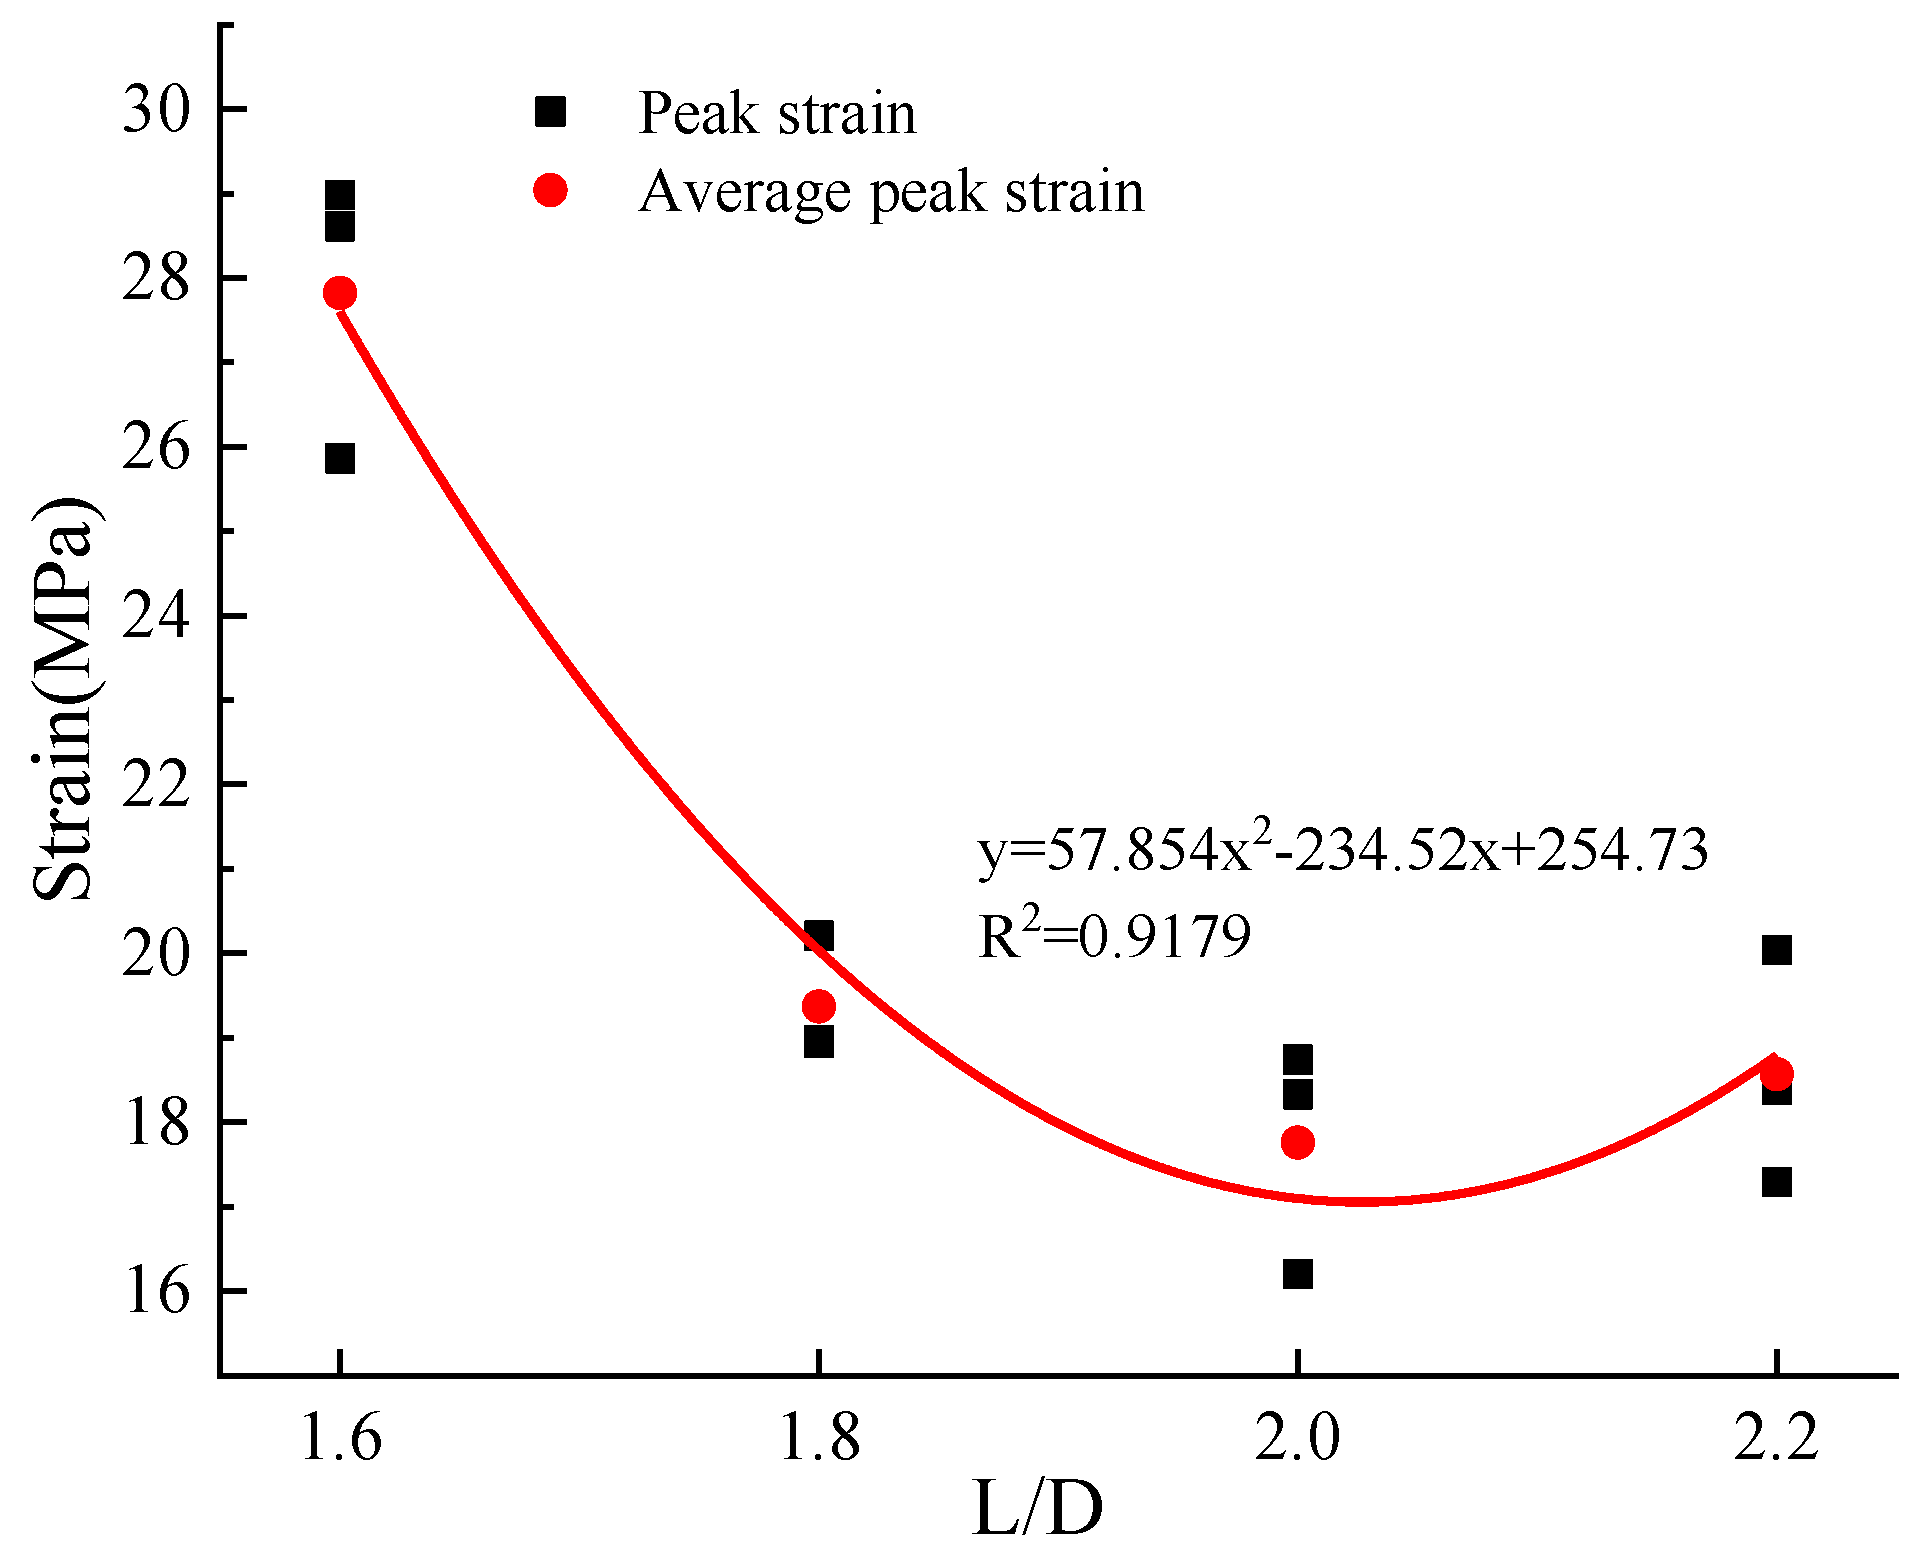
3.1.2. Influence of Height–Diameter Ratio Change on Sandstone Deformation

There are considerable differences in the environment where the rocks are located. Different rocks, stress states, stress conditions, and temperature conditions may cause different deformation of rocks. In the tunnel excavation and roadway boring, rocks are damaged and destroyed under the action of external forces. The size of their deformation and the law of change will impact the stability analysis of the surrounding rock, so the study of rock deformation characteristics under different height-to-diameter ratios can provide a theoretical basis for the control of the surrounding rock to a certain extent.
Accordingly, the study of the law of axial strain at peak stress in sandstone under different height-to-diameter ratio conditions was carried out, and the relationship curves between peak axial strain and the height-to-diameter ratio of rock samples showing in Figure 5.
As shown in Figure 5, the variation law of peak strain and average peak strain of samples under different height–diameter ratio conditions, where the average peak strain is the average of the peak strains of each group of three rock samples. By analyzing the variation law of the average peak strain, as can be seen, with the increase in the height–diameter ratio of the rock sample, the peak strain corresponding to the peak stress of each group of rock samples gradually decreases. When L/D < 2.0, the peak strain of the rock sample gradually decreases, but the decreasing rate gradually decreases, and it tends to be stable around L/D = 2.0. When L/D > 2.0, the peak strain of the rock sample has an upward trend, indicating that when the height–diameter ratio of the rock sample exceeds a certain level, the influence range of the lateral restraint between the test machine indenter and the rock sample decreases. At this time, the specimen is subjected to external load when the axial stress gradually increases. The strain not only depends on the degree of penetration of tiny fractures inside the rock but also depends on the increase in the number of primary defects due to the increase in the size of the specimen itself.

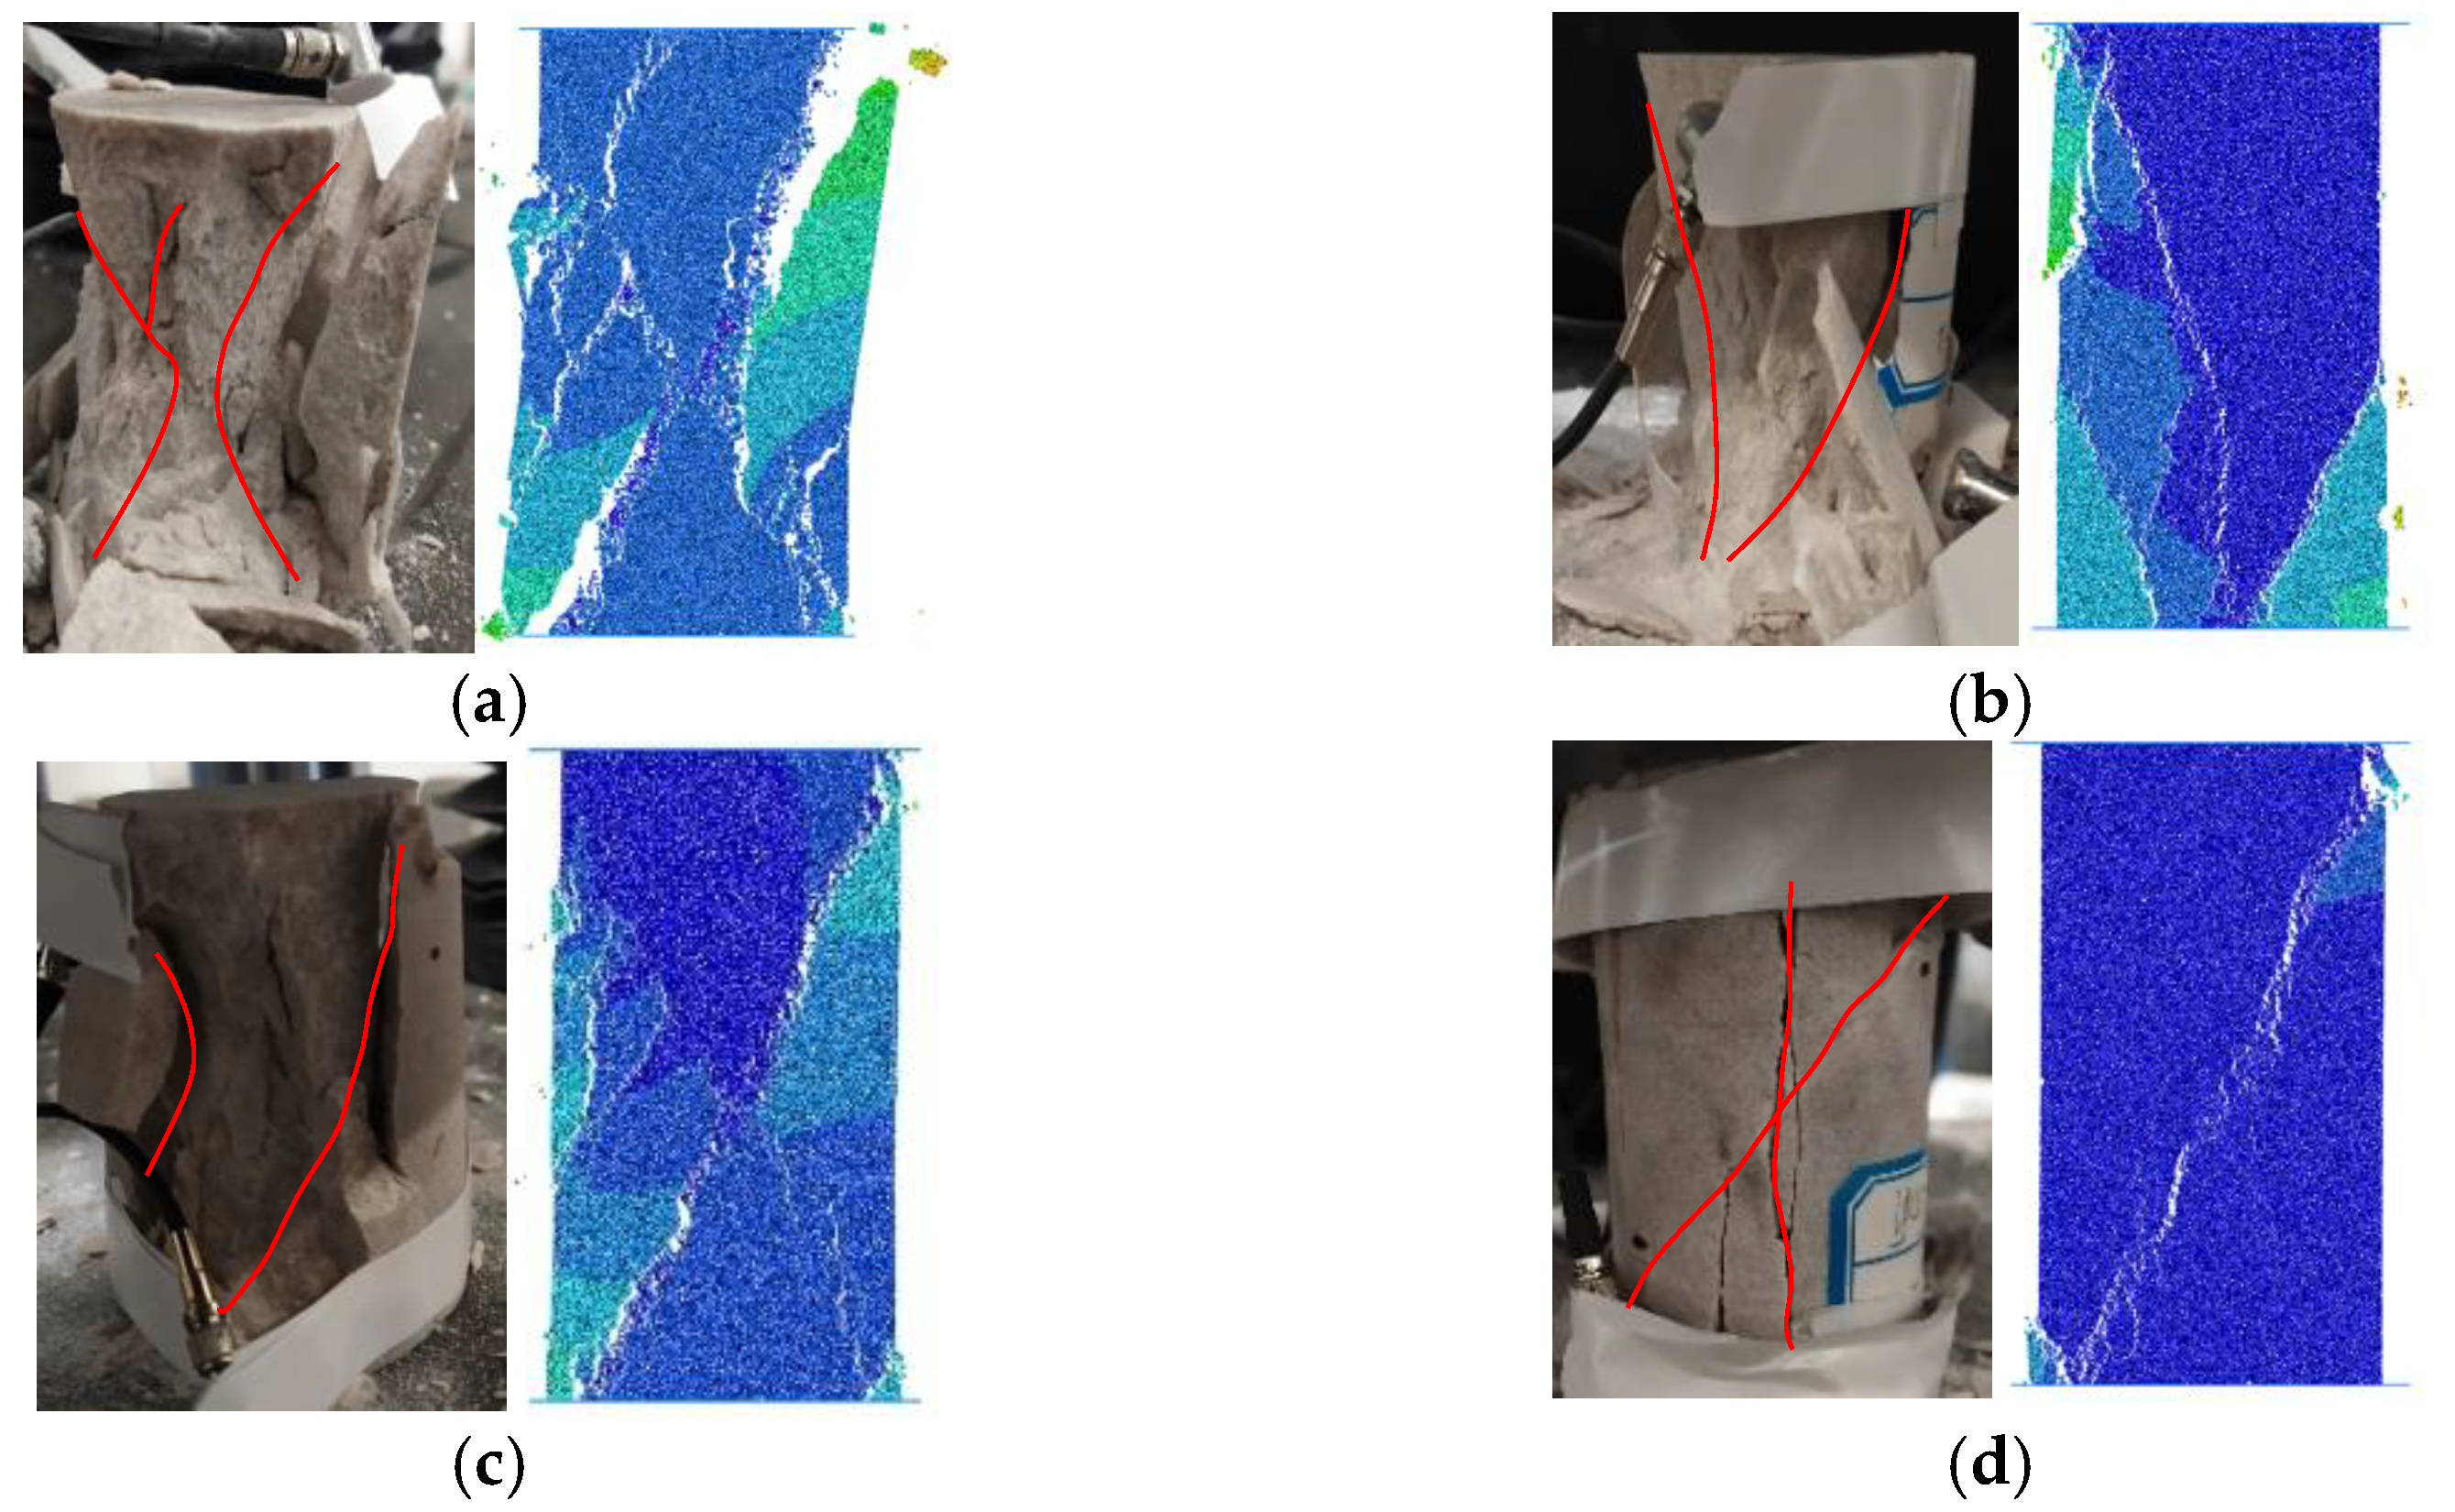
3.1.3. Influence of Height–Diameter Ratio Change on Sandstone Fracture Morphology

The rock itself is a discontinuous, non-homogeneous, and nonlinear mineral aggregate with complex composition, so the failure form of the rock is also complex and changeable [33].
Using PFC2D software to simulate the uniaxial compression tests of rocks with different height-to-diameter ratios to investigate the relationship between the damage morphology and internal crack expansion patterns under uniaxial compression and the height-to-diameter ratio. The simulation takes the parallel bond model as the contact principal structure model, the Moore–Coulomb criterion as the mechanical basis, the spherical particles as the model unit, the mechanical parameters obtained from the actual uniaxial compression test as the basis, and the wall command to construct the model boundary and its force environment, and the relatively slow movement of the upper and lower walls to realize the axial loading and unloading function. The models are divided into four groups with dimensions of 50 × 80 mm, 50 × 90 mm, 50 × 100 mm, and 50 × 110 mm, respectively, and the loaded models are shown in Figure 6. The model combines the characteristics of sandstone and actual test data, continuously adjusts the model parameters through the “trial and error method” (see Table 2), and simulates the uniaxial compression test results of sandstone with different height–diameter ratios as shown in Figure 7.
Figure 7 is a comparison diagram of the rock failure form obtained by the discrete element model test and the actual failure situation, and the analysis is carried out accordingly. With the increase in the height–diameter ratio, the failure range of the sample gradually decreased, and the failure mode transitioned from conical failure to oblique shear failure. By analyzing the failure mode of the main crack, it can be found that when the height–diameter ratio is small (L/D < 2.0), the failure mode of the specimen is mainly a conical failure. When L/D = 1.6, the damage to the sample is the most serious. The broken block is small in size in the local rupture range, and it is in the form of powder, and the phenomenon of particle ejection occurs. It shows that when the height–diameter ratio is small, the energy accumulated in the rock cannot be released in time in small cracks, resulting in the rapid release of energy in the final failure and impact damage. When L/D = 1.8, the damage on one side of the sample is more serious, the damage range is that the inner fragments peel off and off, and there is a trend of development of the oblique shear failure. The other half of the sample is relatively intact and still has a specific residual bearing capacity. Compared with the L/D = 1.6 specimens, the damage range is reduced. Although the L/D = 2.0 sample has a significant damage range, there is no evident particle ejection phenomenon. The rock blocks in the damage range are relatively uniform, with obvious oblique shear cracks. When the height–diameter ratio is large (L/D > 2.0), the sample is a shear-splitting failure, the damage range is small, the rock remains intact, and there are only two large cracks that penetrate each other. However, the simulation found that it is difficult for the sandstone sample to have longitudinal splitting cracks in the case of L/D = 2.2. The analysis suggests that this is related to the internal structure of the sandstone itself, where the sample itself has large primary fractures in the axial direction, and longitudinal splitting-type cracks are produced by tension during loading. The test and simulation results show that no matter how the height–diameter ratio of the rock changes, the failure mode is not a simple oblique shear failure or split failure. Instead, it is the result of the combined effect of two damage modes, indicating that the form of rock damage is highly complex. It is not only related to its size but also the distribution of internal primary cracks and other factors.

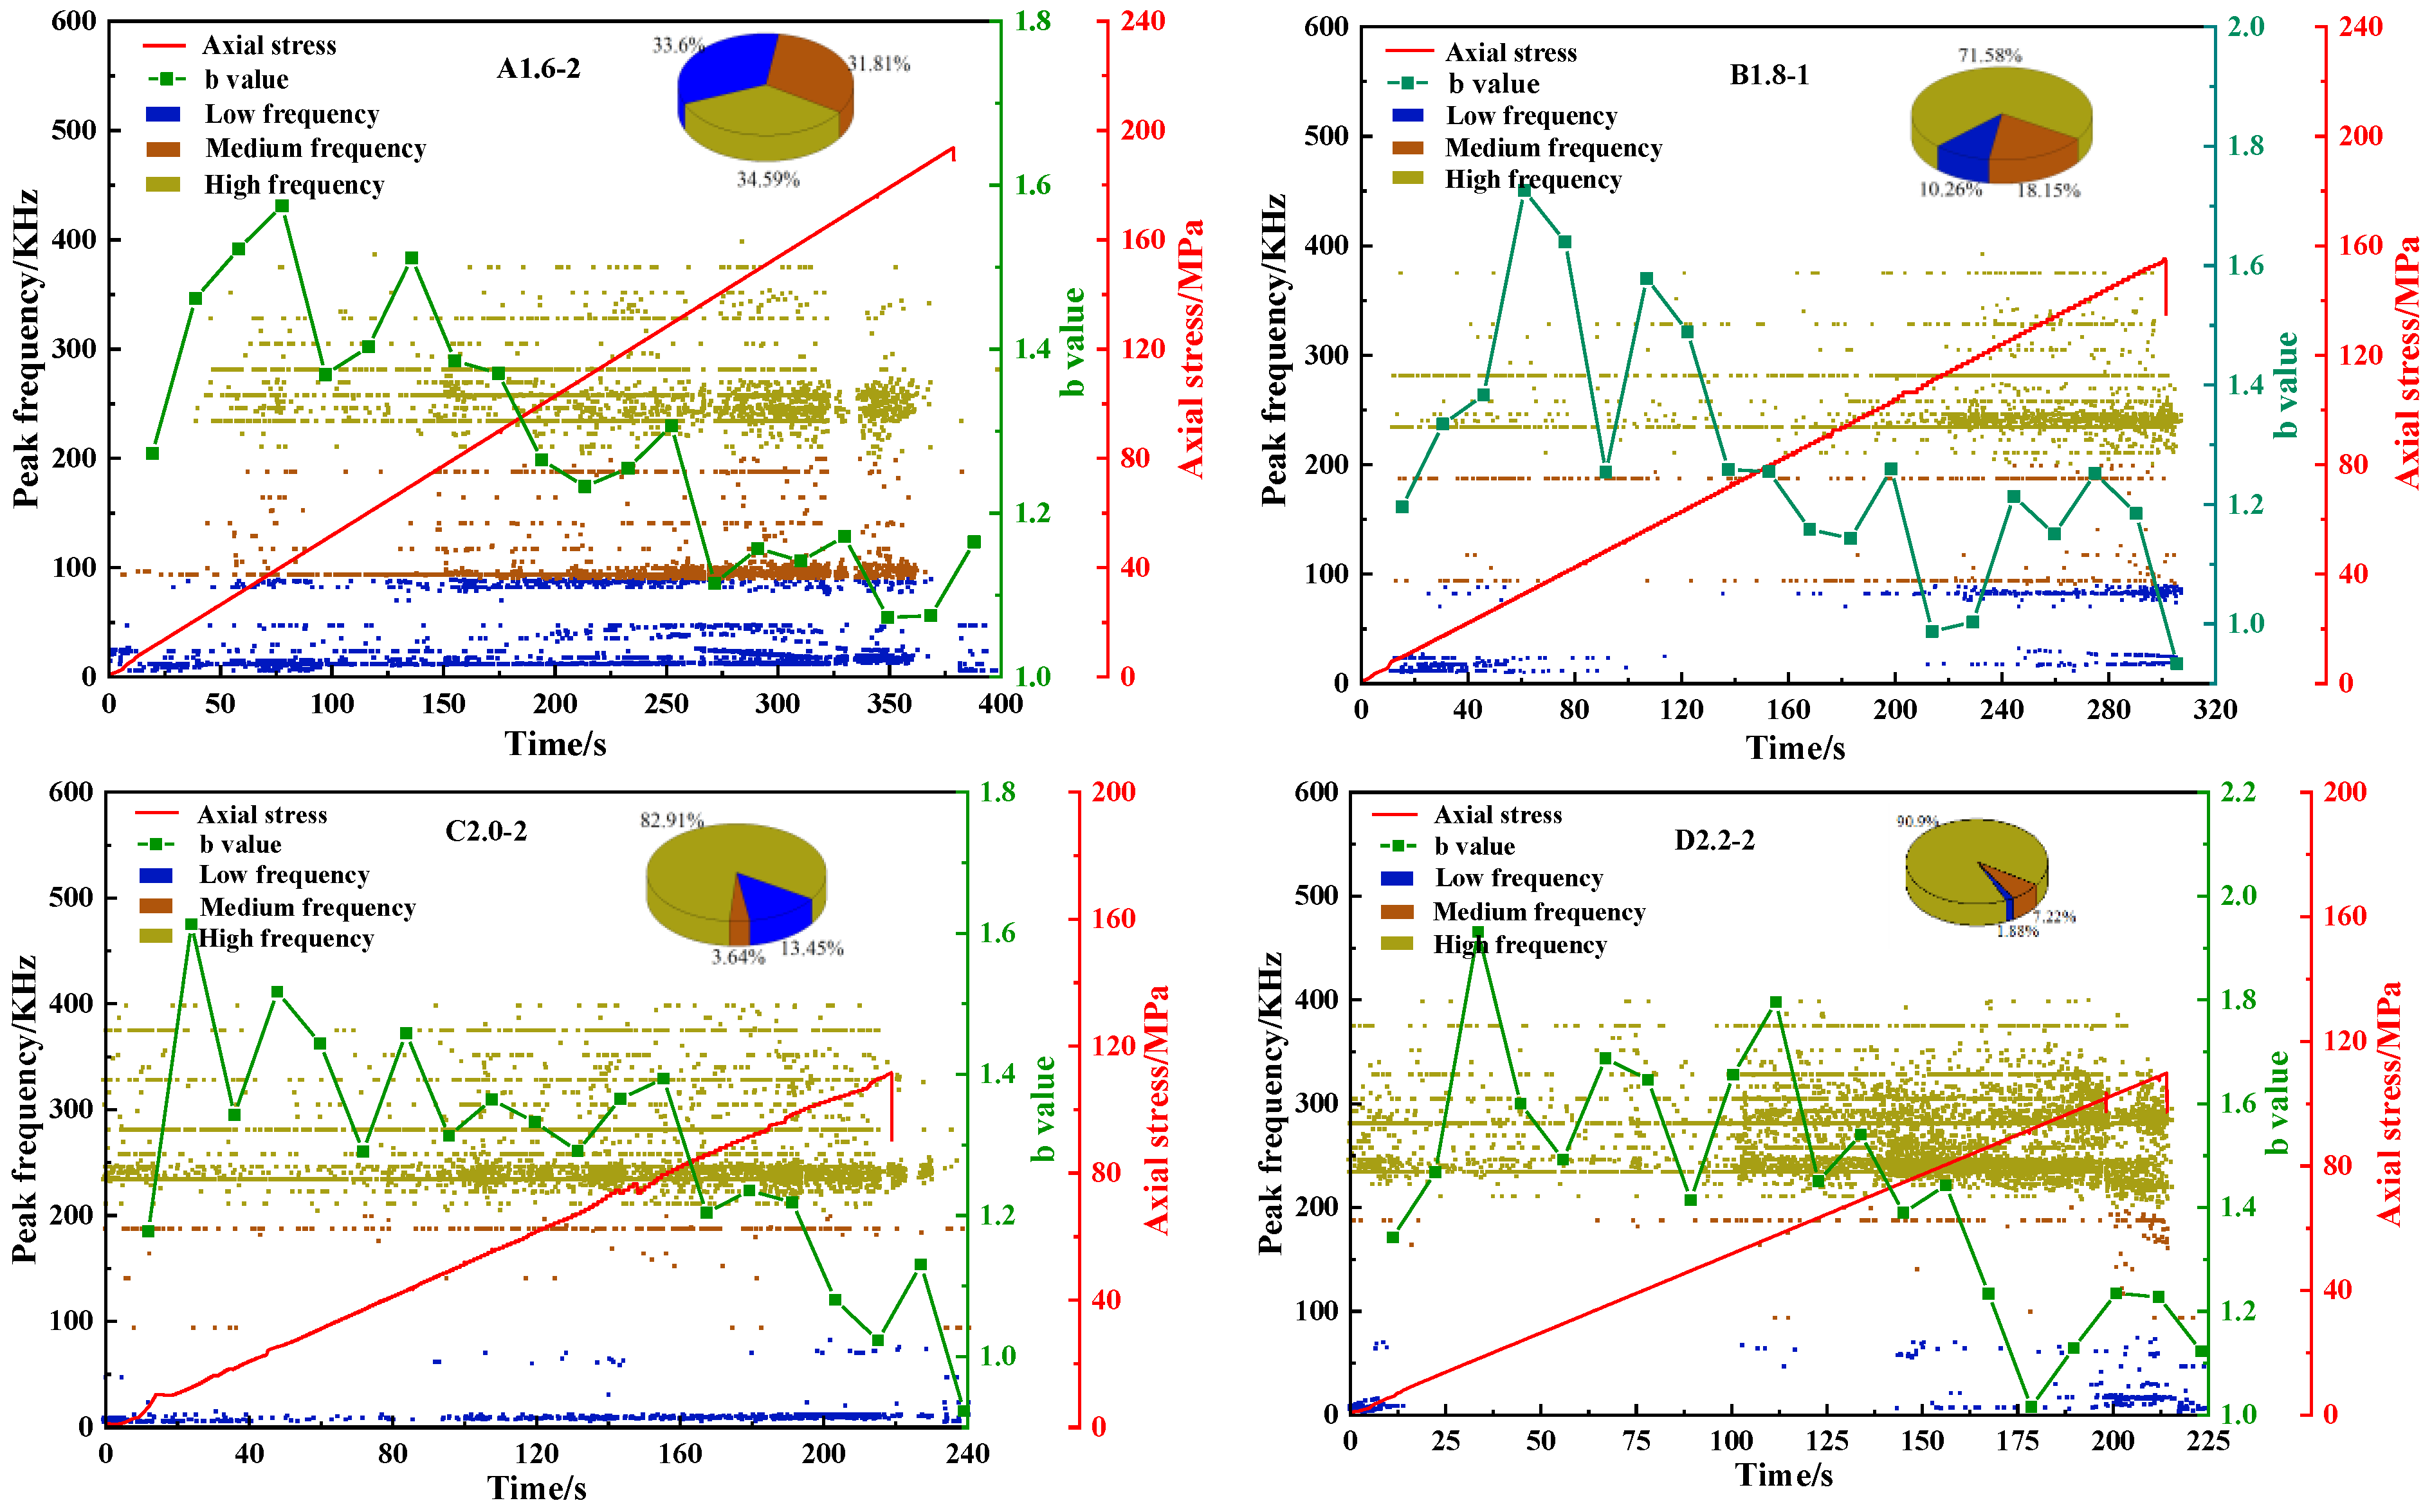
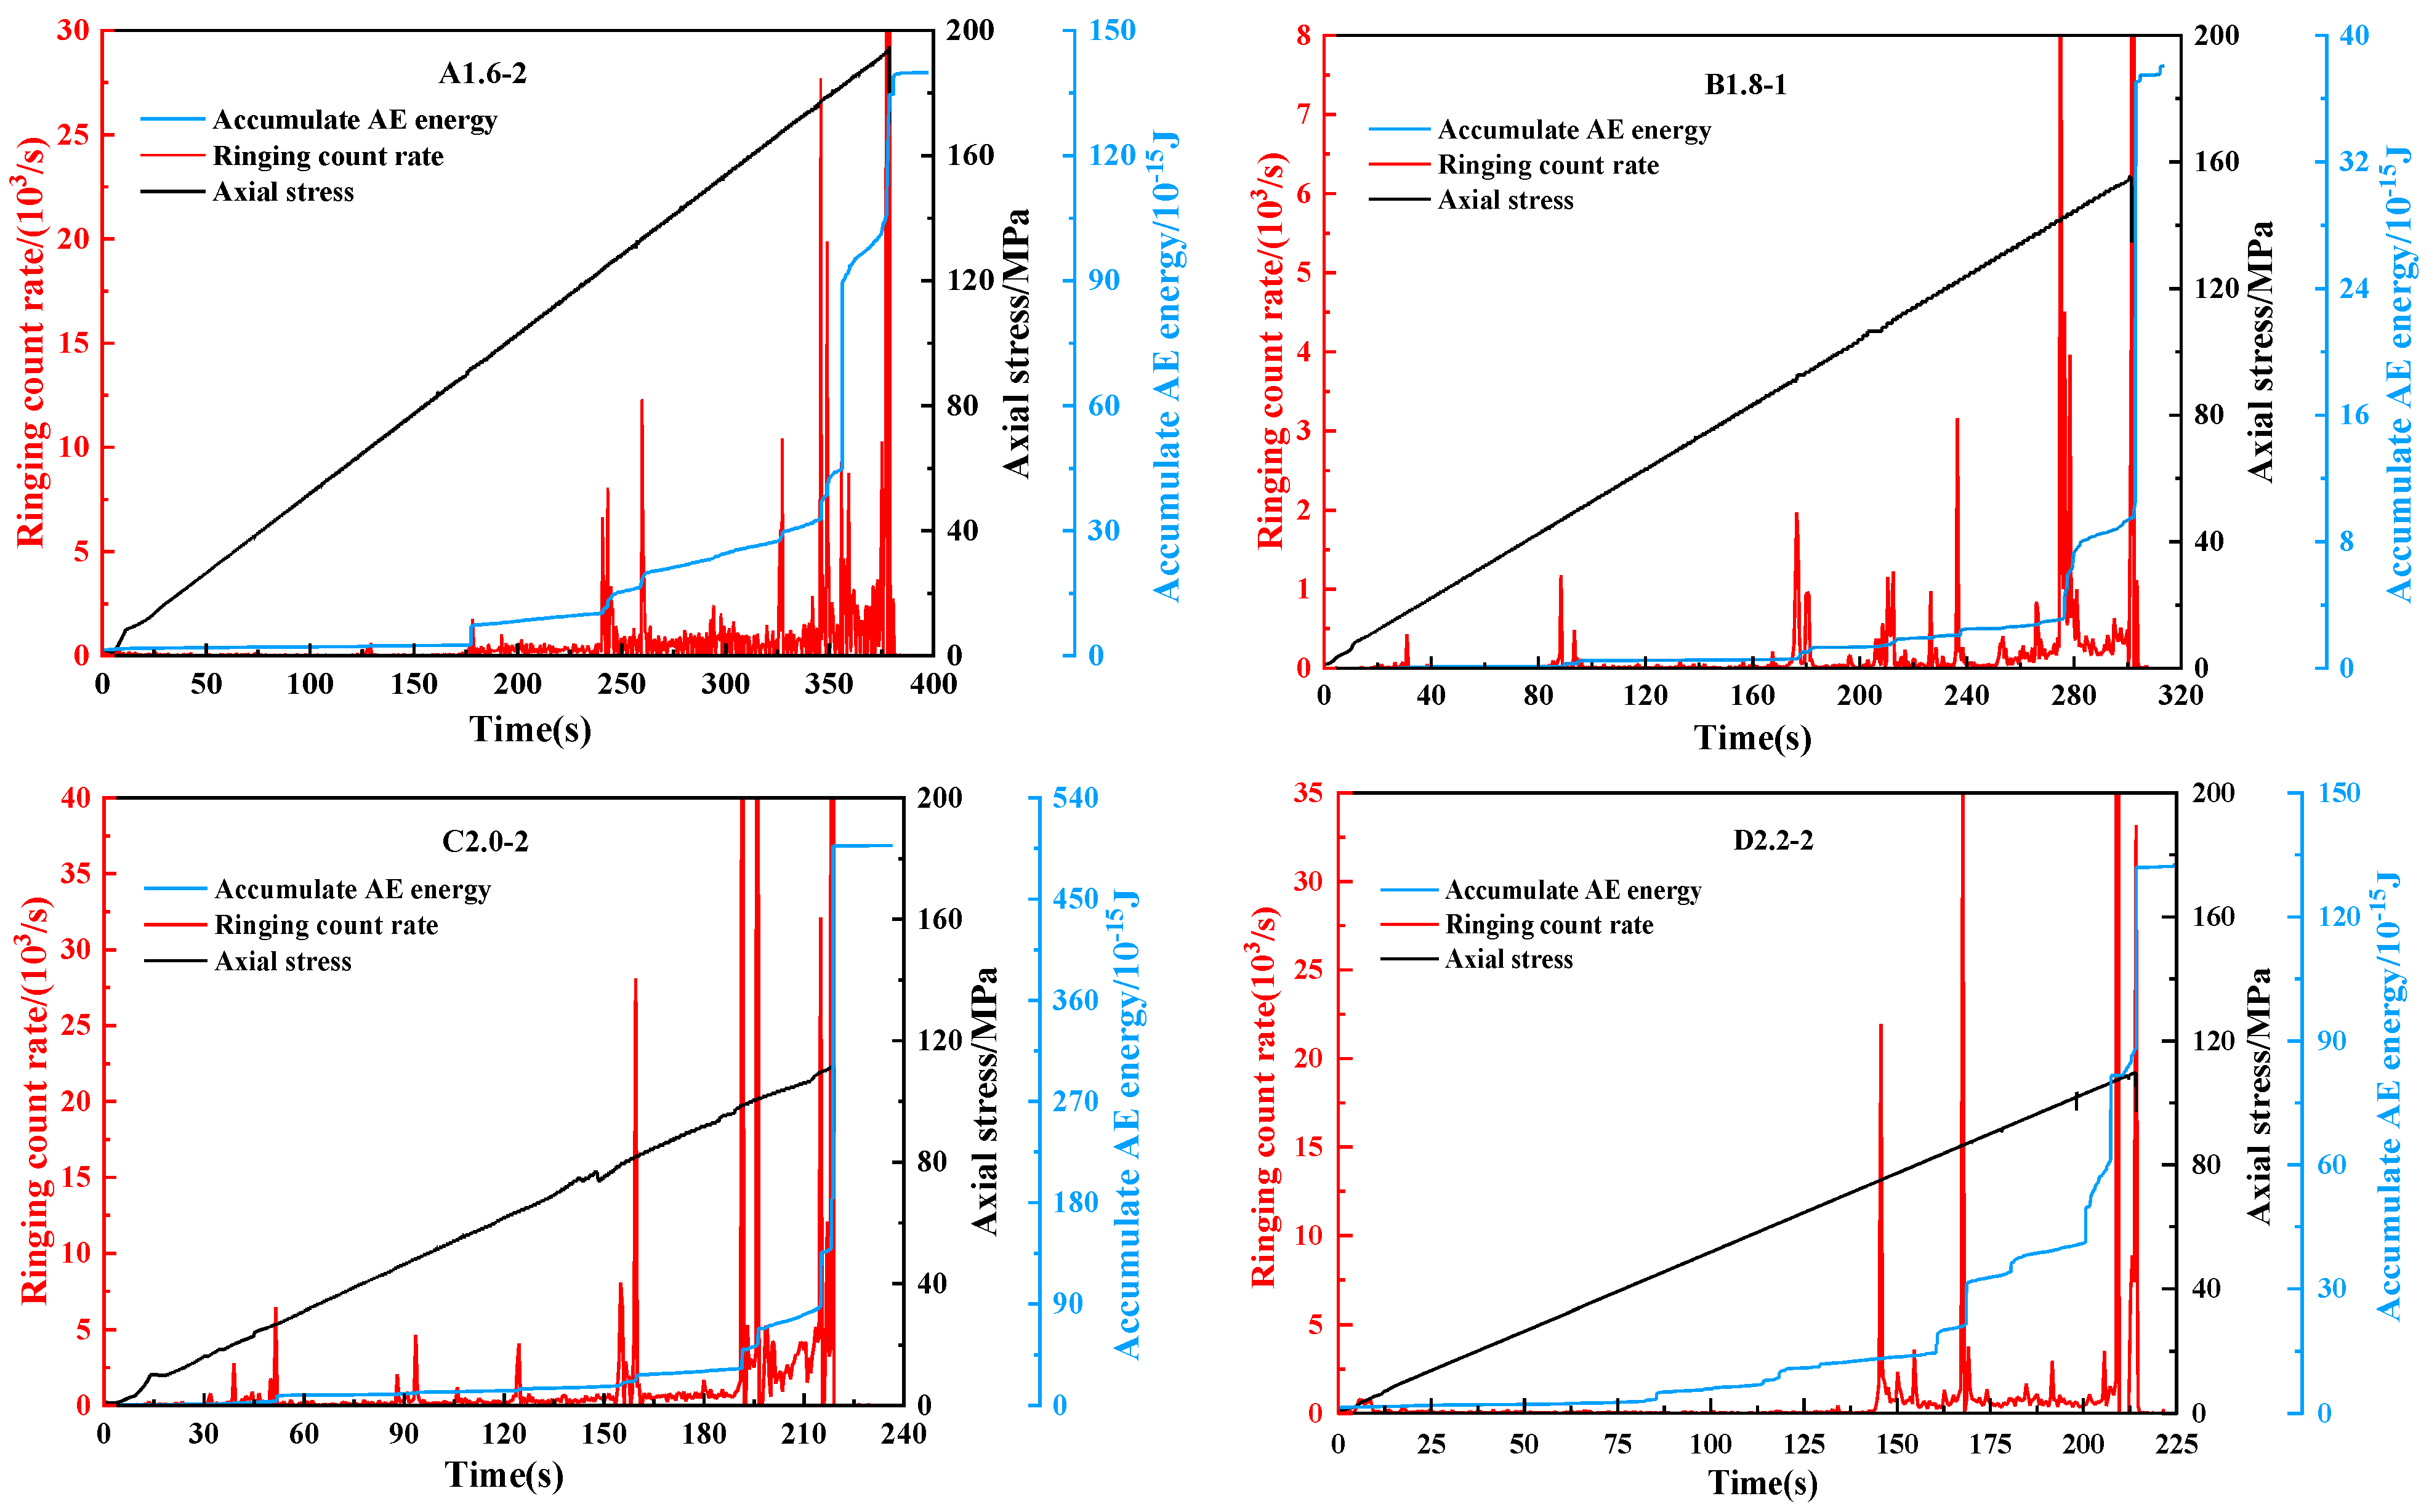
3.2. Acoustic Emission Evolution Law of Rock Samples with Different Height–Diameter Ratios

Acoustic emission is an elastic wave released by developing and expanding rock fissures. The acoustic emission system can store and analyze the acoustic emission signal of mass rock rupture during the test process to study the damage evolution law of rocks with different height–diameter ratios during the rupture process. In this paper, the time-domain characteristics of acoustic emission are studied. The variation trend of ringing count rate, accumulated energy, peak frequency, and b value, which are more sensitive to rock damage, is analyzed. Since the acoustic emission signal is very short in the post-peak phase, the changes in the pre-peak phase are analyzed, taking each group of samples with prominent acoustic emission characteristics as an example.
Figure 8 shows the ringing count-rate–axial stress-accumulated energy–time curves of rock samples under different height–diameter ratios. As can be seen from the figure that the acoustic emission characteristics of rocks with different height–diameter ratios are roughly similar, and a small amount of acoustic emission occurs in the compaction stage of micro-cracks in the early loading stage. However, due to the slight stress, the activities in the sample are mainly the development and closure of micro-cracks. At this time, the energy generated by the test machine’s work on the rock sample is partially dissipated by the development of fractures, so the acoustic emission ringing count rate and accumulated energy are kept at a relatively low state. The specimen gradually transitions from the micro-crack compaction stage to the elastic stage as the load increases. At this time, the rock is in a recoverable elastic deformation stage. In this stage, although the external load on the specimen continued to increase, it was still unable to generate new larger cracks in the rock sample. Therefore, in this stage, although the acoustic emission activity has increased compared with the compaction stage, it is intermittent and fluctuating, and it is in a relatively stable state. The load increases, the rock sample enters the plastic stage, and the internal micro-cracks expand and further penetrate, resulting in irreversible plastic deformation. The volume strain of the rock sample continues to increase under the action of external force, resulting in the phenomenon of lateral expansion. At this time, part of the work performed by the testing machine on the rock sample is absorbed by the expansion and penetration of the cracks inside the sample, and the other part is consumed during the crack expansion. During the plastic phase, the acoustic emission signal starts to become active, and the ringing count rate and accumulated energy increase with the increase in the axial stress. During the continuous loading process, the interaction of cracks began to intensify, and the micro-cracks inside the rock sample aggregated and penetrated to form macro-cracks. When the peak load reached, the macro-cracks in the rock sample suddenly penetrated and lost the bearing capacity. At this time, most of the energy generated by the testing machine working on the rock sample dissipates when the rock sample is damaged, and the acoustic emission activity is abnormal with a robust acoustic emission signal. The ringing counting rate and accumulated energy increase rapidly and reach a steep rise at the stress peak.
A1.6-2 When the sample load reaches about 46% of the peak stress, the ringing count rate begins to appear continuously and gradually increases, showing a multi-peak change, until the acoustic emission ringing count rate increases before the sample is destroyed. The stress drop of the specimen is accompanied by a steep rise in the count rate and accumulated energy. The acoustic emission count rates of B1.8-1 and C2.0-2 samples also experienced three steep rises but recovered relatively calmly. The ringing count rates gradually increased before the rupture, and then a sudden sharp rise accompanied by the test piece is broken. There was no apparent acoustic emission signal in the early stage of the D2.2-2 sample. When the stress reached about 67% of the peak load, the acoustic emission signal showed a significant jump, there was a slight rise intermittently between the two peaks, and there were two more full sharp rises in succession before the rupture. Therefore, the sudden change of acoustic emission ringing count rate and accumulated energy can be used as the precursor of rock sample damage to judge whether the rock sample is about to be damaged.
The steep rise in the cumulative ringing count rate indicates a crack penetration in the sample or a local release of energy due to a small rupture. However, after the stress reaches equilibrium, the energy accumulates again. The ringing count rate appears in smaller magnitudes. The crack continues to develop and expand, and after the local damage affects the overall equilibrium of the sample, the sample is destabilized and damaged. This is more similar to Gong et al. [34]. They studied that the surrounding rock mass is progressively affected by the local energy release occurring damage to the overall damage. As the height-to-diameter ratio increases, the acoustic emission signal magnitude increases when the specimen is damaged than when the extended fracture develops. At smaller sizes (L/D = 1.6), before the damage of the specimen, the acoustic emission signal is dense, and the energy is gradually released, leading to the destabilization of the specimen. At larger sizes (L/D = 2.2), the rising phase of acoustic emission signal before specimen damage is very short, and the specimen is suddenly destabilized. Combined with the previous study, the height and diameter are higher than the smaller specimen load-bearing capacity. It can be seen that the stress balance adjustment ability of the specimen with a small height-to-diameter ratio is greater than that of the specimen with a sizeable height-to-diameter ratio. The larger the height-to-diameter ratio, the poorer the bearing capacity of the specimen, and when the external load exceeds the bearing capacity of the specimen, the damage is very concentrated.
During the loading process, the acoustic emission waveform signal and b value change with the rock’s crack propagation, reflecting the propagation law of cracks of different scales in the rock [35,36]. Perform a fast Fourier (FFT) transformation on the original acoustic emission signal to obtain a two-dimensional spectrogram of axial stress and peak frequency during the loading process of the sample. The frequency corresponding to the largest amplitude in the two-dimensional spectrogram is the acoustic emission peak frequency [37]. The change law of the rock damage evolution process can be obtained by analyzing the peak frequency and b value changes in the test process. The increase in the b value and the accumulation of high-frequency acoustic emission signals indicate that the rock samples are mainly developed by small-scale fissure closure [38]. The decrease in the b value and the accumulation of low-frequency acoustic emission signals indicate that the rock samples are mainly extended and connected by large-scale fractures. The internal fractures of the rock sample with a small b-value change expand gradually. A sizeable b-value change means a sudden expansion of the rock sample.
Select the samples with pronounced peak acoustic emission frequencies in each group of tests for research. The making of the peak frequency-b value–axial stress–time curves of rock samples with different height–diameter ratios are shown in Figure 9. The analysis focuses on the distribution pattern and trend of acoustic emission b-value and the peak frequency distribution of the signal in the range of 0~500 kHz during the loading process of the specimen (0~90 kHz for low frequency, 90~200 kHz for medium frequency, 200~500 kHz for high frequency), thus to provide a basis for the evolution of rock rupture under different height-to-diameter ratios.
The sandstone rock mass is dense. At the initial loading stage, due to the end face friction effect, the internal microstructure of the rock mass is stable. Rocks with different height-to-diameter ratios have low-frequency acoustic emission signals, and the b value fluctuates in a low-level range. When the height–diameter ratio is minor, low frequency in the initial pressure-density stage dominates the acoustic emission signal. A slight increase in the b-value indicates that at this time, the specimen is mainly a stable development and closure of tiny cracks inside the specimen, with a stable increase in stress and no larger cracks. As the load increases, the proportion of medium and high-frequency acoustic emission signals gradually increases, and the b-value decreases substantially for a long time in the fluctuation. It means that the specimen has already entered the unstable damage stage from the stable damage stage, and the small cracks inside the specimen begin to develop rapidly. When the specimen is about to reach the load limit, there is a sharp increase in the number of both high-frequency signals and low-frequency signals of acoustic emission. The b-value appears to be slightly elevated in the crack extension and then decreases until the specimen is damaged. It shows that the large-scale crack stress is relatively concentrated in the late stage of loading, and a large number of tiny cracks are derived around it. The specimen will be destabilized and damaged when the nascent small cracks are continuously damaged and penetrate the large cracks.
When the height–diameter is relatively large, the number of microcracks contained inside the sample also increases, so at the beginning of the loading, there are more medium and high-frequency acoustic emission signals due to microcrack closure. The b value also increased significantly and fluctuated and decreased in the higher value range, which continued until the specimen entered the unstable damage stage. The high-frequency signal increases gradually, and the crack penetration occurs inside the specimen. As the stress increases, many high-frequency acoustic emission signals are generated after the stress exceeds the rock damage strength. The b-value appears to be slightly elevated after a continuous significant decrease. The cracks inside the rock sample expand sharply and destabilize after losing load-bearing capacity. It can be seen from Figure 9 that with the increase in the height–diameter ratio, the acoustic emission b value gradually increases in value during the whole process from initial loading to buckling failure of the specimen. The percentage of high-frequency signals gradually increases from 34.59% to 90.90%. The low-frequency acoustic emission signal decreases from 33.60% to 1.88%, which indicates that with the increase in the rock size, the proportion of internal microcrack development and expansion when the sample is loaded and damaged gradually. It also further indicates that the larger the height-to-diameter ratio, the more the number of fractures contained in the rock.

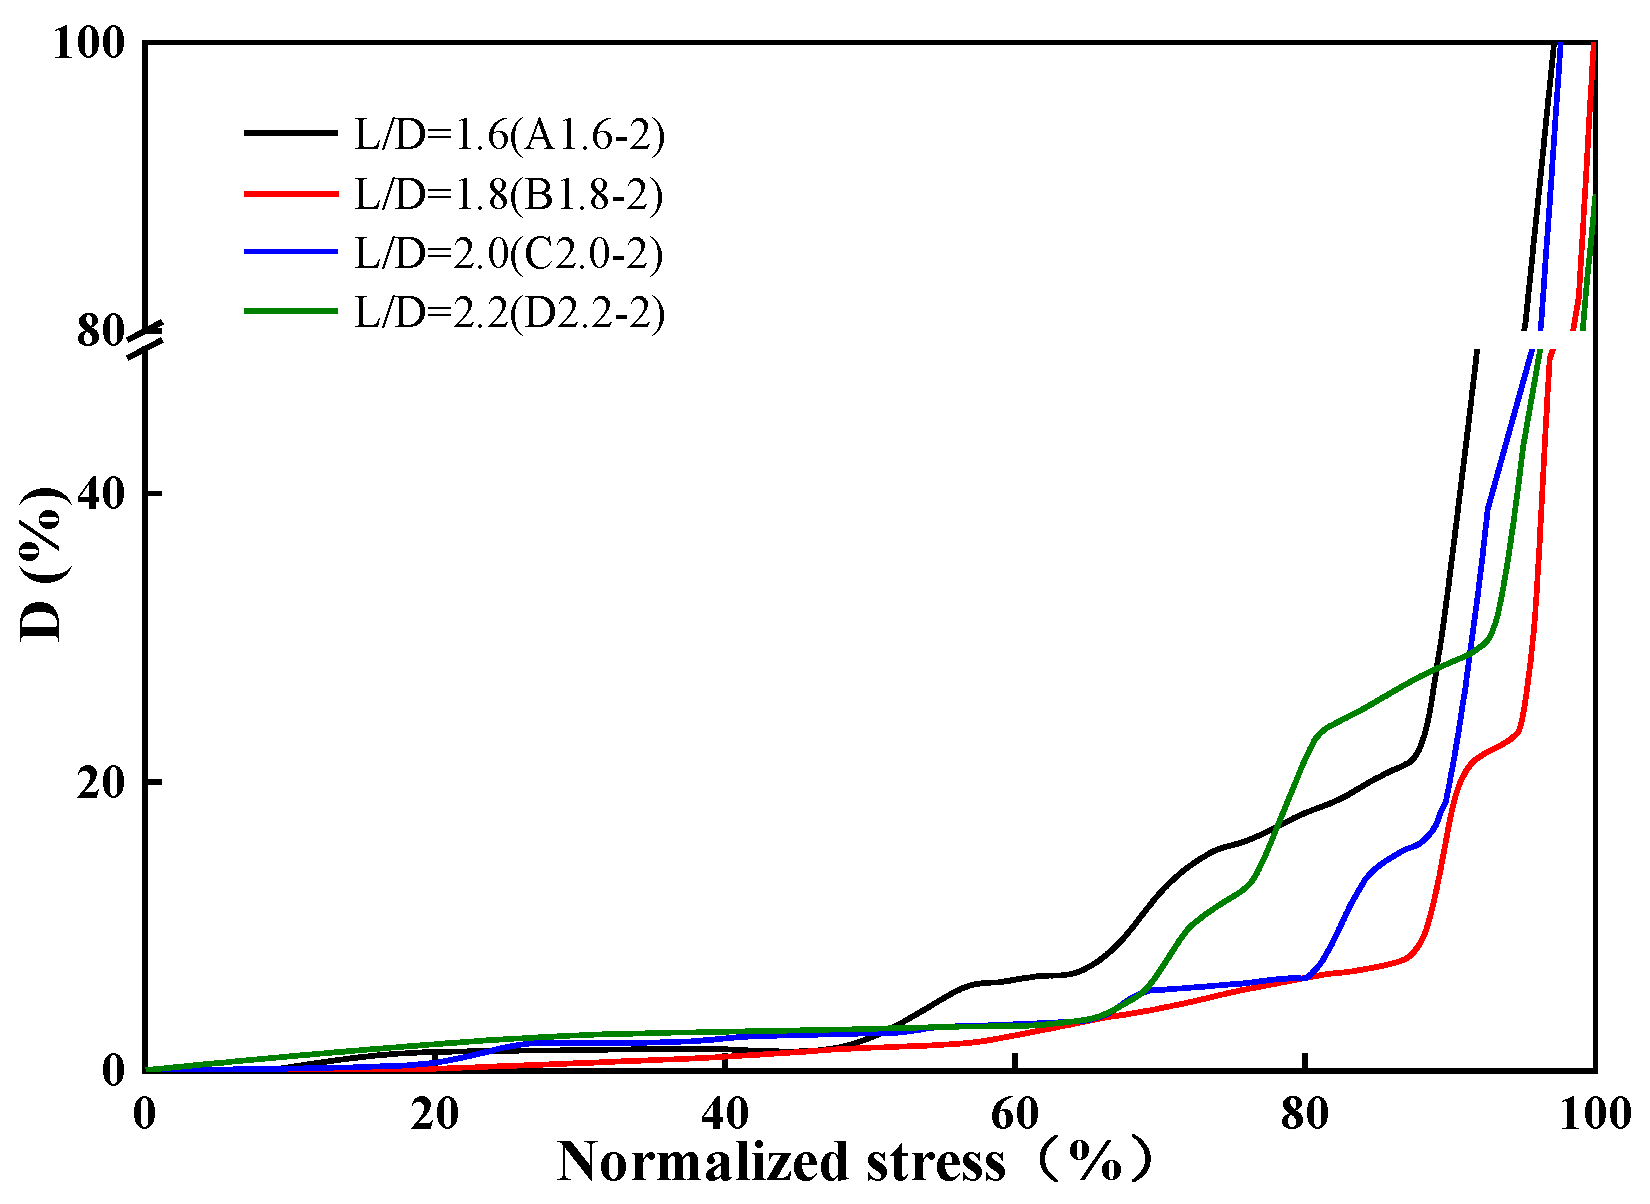
3.3. Analysis of Damage Evolution in Sandstones with Different Height-to-Diameter Ratios

Jiang et al. [21] applied acoustic emission technology to study the damage process of rock materials and considered that the cumulative acoustic emission energy, as an essential indicator of acoustic emission intensity, is one of the more suitable acoustic emission parameters to characterize rock damage.
Because the peeling of the rock skin and the expansion of the internal micro-cracks will cause damage to the rock material during the test, resulting in changes in the acoustic emission energy. Therefore, this paper defines the damage variable as D = n/N, where n is the accumulated acoustic emission energy from the test to a particular moment, and N is the accumulated acoustic emission energy generated after the rock destruction, to study the damage evolution law of the rock during the loading process. In order to more clearly analyze the damage characteristics of different L/D, the stress is “normalized,” as shown in Figure 10.
The damage curve starts to increase slowly with a slight slope, and as the load increases, the slope increases, and the damage intensifies, showing a stepwise growth. The accumulation and release of energy accompany this process, and before the final damage, the damage curve rises with a more significant slope to the sample damage. The damage curve was divided into three stages according to the trend of the slope change of the energy curve, stage one for stable damage, stage two for unstable damage, and stage three for aggravated damage. Energy changes represented by these three stages correspond to the rock stress–strain curves, respectively. It can be seen from Figure 11 that the stable damage stage (compacting stage and elastic stage) has little influence on the sample, mainly due to the accumulation of energy. The unstable damage stage (plastic stage) is between 20% and 30%. At this stage, the sample is accompanied by stress adjustment, and energy concentration occurs again after the energy is released. The severe damage stage (destruction stage) has a more significant impact on the damage of the specimen, reaching more than 70%. This is mainly manifested by the sudden release of the stored energy in the early stage of the specimen, indicating that once the specimen enters the severe damage stage, the damage is relatively concentrated.
The damage of samples with different height–diameter ratios has specific differences. The stable damage stage is mainly the development and expansion of internal cracks, and the damage value is small. After entering the unstable damage stage, mainly crack penetration, the damage gradually increased. During the unstable damage phase, the load of L/D = 1.6 specimens reached 48% of the peak load, L/D = 1.8 specimens reached 55% of the peak load, and L/D = 2.0 specimens reached 64% of the peak load, and L/D = 2.2 specimen reached 68% of the peak load. With the increase in the height to diameter ratio, the non-stable damage requires an increase in the proportion of stress. The damage variable shows a trend of the first decline and then rise, the lowest in the standard specimen L/D = 2, the damage value of 14.9%, exacerbating the damage phase damage shows a trend of first increase and then decrease.

4. Discussion

In this paper, the effect of the height–diameter ratio on the compressive damage characteristics and mechanical properties of rocks is investigated based on uniaxial compression tests under different height–diameter ratio conditions. The energy changes during rock destruction were analyzed with the help of an acoustic emission system. Analysis of the evolution pattern of the sandstone damage process based on damage variables. It is found that with the increase in the height-to-diameter ratio, the rock is increasingly affected by the internal primary defects, and the rock strength shows a nonlinear decreasing trend, and the decreasing trend becomes slower, while the peak strain of the rock shows a trend of gradually decreasing and then increasing, and is more stable around L/D = 2. Before the destruction of the rock, the acoustic emission signal will change abruptly due to the development of internal crack penetration, and with the increase in height–diameter ratio, the acoustic emission signal rises more intensively before rupture, and the destruction is more concentrated.
To ensure the proper conduct of extraction activities and construction advancement. Scholars at home and abroad have found that the instability of coal rock columns is not only related to their strength and the influence of mining disturbance but also to the size and shape of the coal rock column itself [39,40]. Therefore, reasonable determination of the size of coal rock pillars left in some underground engineering activities such as mining and tunneling is a pressing challenge. The content and results studied in this paper can provide some experimental support for retaining coal rock columns of different sizes. The sudden change of acoustic emission signal can also predict whether the coal rock column is destabilized, thus ensuring safe and efficient underground engineering activities.

5. Conclusions

Carry out uniaxial compression tests have been carried out on sandstone under different height–diameter ratios. Investigate the influence of the height–diameter ratio on compressive failure characteristics and damage evolution law of sandstone. By analyzing the relationship between acoustic emission ringing count rate, accumulated energy, peak frequency, b-value changes, and height–diameter ratio, further using damage variables to study the evolution law of the sandstone failure, we can draw the following conclusions.
(1)
With the increase in the height–diameter ratio, the rock strength shows a nonlinear downward trend. The smaller the height–diameter ratio, the greater the influence of the end face effect, so the higher the strength. However, beyond a certain height–diameter ratio, the influence range of the end face effect becomes smaller, and the decreasing trend of the peak strength becomes slower due to the influence of the primary defects in the test piece.
(2)
With the increase in the height–diameter ratio, the peak strain of the specimen shows a trend of decreasing first and then increasing, and it is relatively stable near L/D = 2, indicating that with the increase in rock size, the deformation is not only related to the end face friction effect, but also related to the number of primary cracks in the rock is related.
(3)
The smaller the height–diameter ratio is, the more serious the rock damage is. As the height–diameter ratio increases, the damage form gradually transitions from conical to oblique shear failure.
(4)
With the increase in the height–diameter ratio, the rising phase of the acoustic emission signal is short before the fracture, and the destruction is more concentrated. The accumulated energy increased steadily in the early stage. After entering the unstable damage stage, the internal crack of the specimen develops and penetrates with the dissipation of energy, and the accumulated energy increases sharply during the instability failure. Therefore, the occurrence of rock damage can be predicted through the mutation of acoustic emission signals.
(5)
With the increase in the height–diameter ratio, the overall level of acoustic emission b value showed an upward trend, the proportion of high-frequency signals gradually increased, the proportion of low-frequency signals gradually decreased, and the tiny cracks in the rock developed more densely.
(6)
The value of the rock damage curve is small in the stable damage stage. With the increase in the height–diameter ratio, the damage in the unstable damage stage shows a trend of first decreasing and then increasing. When L/D = 2, it reaches the minimum value, and the value in the severe damage stage is higher as a whole, which has the greatest impact on the damage of the specimen, and the damage is relatively concentrated.

Author Contributions

Conceptualization, G.Z. and M.Q.; methodology, S.Z. and C.L.; software, M.Q. and X.W.; validation, X.C. and Z.L.; data curation, W.X. and C.L.; writing-original draft preparation, M.Q.; writing-review and editing, G.Z. All authors have read and agreed to the published version of the manuscript.

Funding

The study was funded by the Graduate Scientific Research Project of Anhui Province Universities (YJS20210388), National Natural Science Foundation of China (Nos. 51974009,52004005,52004006), Anhui Province Science and Technology Major Project (202203a07020011), Anhui Province “Provincial Special Expenditure Plan” Leading Talent Project (T000508), Anhui Academic and Technical Leaders Scientific Research Activity Fund (2021), The University Synergy Innovation Program of Anhui Province GXXT-2021-075, Huaibei City Science and Technology Major Program (No. Z2020005), China Postdoctoral Science Foundation (2021M691185), Postdoctoral Science Foundation of Anhui Province (No. 2021B513), School introduction talent fund (13200013).

Institutional Review Board Statement

Not applicable.

Informed Consent Statement

Not applicable.

Data Availability Statement

Data to support the findings of this study are available from the first author upon request.

Acknowledgments

The authors of this paper would like to express their gratitude for the Graduate Scientific Research Project of Anhui Province Universities (YJS20210388),National Natural Science Foundation of China (No. 51974009,52004005,52004006), Anhui Province Science and Technology Major Project (202203a07020011), Anhui Province “Provincial Special Expenditure Plan” Leading Talent Project (T000508), Anhui Academic and Technical Leaders Scientific Research Activity Fund (2021), The University Synergy Innovation Program of Anhui Province GXXT-2021-075, Huaibei City Science and Technology Major Program (No. Z2020005), China Postdoctoral Science Foundation (2021M691185), Postdoctoral Science Foundation of Anhui Province (No. 2021B513), School introduction talent fund (13200013).

Conflicts of Interest

The authors declare that there is no conflict of interest regarding the publication of this paper.

References

  1. Li, X.; Huai, Z.; Li, X.B.; Gong, F.Q. Fracture patterns induced by deep underground excavation based on a crack propagation model. J. China Coal Soc. 2019, 44, 1378–1390. [Google Scholar]
  2. Yan, P.; Lu, W.B.; Chen, M.; Zhou, C.B. Effect of initial geo-stress dynamic unloading during tunnel excavation. Chin. J. Geotech. Eng. 2009, 31, 1888–1894. [Google Scholar]
  3. You, M.Q.; Zou, Y.F. Discussion on heterogeneity of rock material and size effect on specimen strength. Chin. J. Rock Mech. Eng. 2000, 19, 391–395. [Google Scholar]
  4. Yang, S.Q.; Su, C.D.; Xu, W.Y. Experimental and theoretical study on size effect of rock materials. Eng. Mech. 2005, 22, 112–118. [Google Scholar] [CrossRef]
  5. Yang, S.Q.; Xu, W.Y.; Su, C.D. Study on statistical damage constitutive model of rock considering scale effect. Chin. J. Rock Mech. Eng. 2005, 24, 4484–4490. [Google Scholar]
  6. Komurlu, E. Loading rate conditions and specimen size effect on strength and deformability of rock materials under uniaxial compression. Int. J. Geo Eng. 2018, 9, 17. [Google Scholar] [CrossRef]
  7. Shi, Y.K.; Ma, Y.H.; Yin, Y.C. Research on size effect affected to seam bump-prone test results. Coal Sci. Technol. 2014, 42, 23–26. [Google Scholar]
  8. Yilmaz, Y.; Eun, J.; Panahi, S.S.; Mousavi, M.S. Effects of height-to-diameter ratio (H/D) for specimens with various water contents on unconfined compressive strength of a clayey soil. Eng. Geol. 2019, 257, 105136. [Google Scholar] [CrossRef]
  9. Zhao, G.M.; Liu, Z.X.; Meng, X.R.; Zhang, R.F.; Kao, S.M.; Qi, M.J. Energy accumulation and dissipation test and analysis method of height-diameter ratio sandstone. J. China Coal Soc. 2022, 47, 1110–1121. [Google Scholar]
  10. Ling, Z.Z.; Zhang, Y.B.; Tang, S.B.; Li, L.C.; Tang, C.A. Size effect of rock messes and associated representative element properties. Chin. J. Rock Mech. Eng. 2013, 32, 1157–1166. [Google Scholar]
  11. Tuncay, E.; Hasancebi, N. The effect of length to diameter ratio test specimens on the uniaxial compressive strength of rock. Bull. Eng. Geol. Environ. 2009, 68, 491–497. [Google Scholar] [CrossRef]
  12. Tuncay, E.; Özcan, N.T.; Kalender, A. An approach to predict the length-to-diameter ratio of a rock core specimen for uniaxial compression tests. Bull. Eng. Geol. Environ. 2019, 78, 5467–5482. [Google Scholar] [CrossRef]
  13. Zhu, Z.D.; Zhang., A.J.; Xing, F.D.; Xu, W.Y. Experimental study on correlation between compressive strength of rocks and sample size. J. Hohai Univ. Sci. Technol. 2004, 32, 42–45. [Google Scholar]
  14. Darlington, W.J.; Ranjith, P.G.; Choi, S.K. The effect of specimen size on strength and other properties in laboratory testing of rock and rock-like cementitious brittle materials. Rock Mech. Rock Eng. 2011, 44, 513–529. [Google Scholar] [CrossRef]
  15. Liu, C.Y.; Zhao, G.M.; Xu, W.S.; Meng, X.R.; Huang, S.J.; Zhou, J.; Wang, Y.K. Experimental investigation on failure process and Spatio-temporal evolution of rockburst in granite with a prefabricated circular hole. J. Cent. South Univ. 2020, 27, 2930–2944. [Google Scholar] [CrossRef]
  16. Liu, C.Y.; Zhao, G.M.; XU, W.S.; Meng, X.R. Experimental study on rockburst and its spatio-temporal evolution criterion in high stress roadway. J. China Coal Soc. 2020, 45, 998–1008. [Google Scholar]
  17. Wen, Z.J.; Huang, J.; Jiang, Y.J.; Zuo, Y.J.; Zhu, Z.W.; Xiao, P. Development and experiment of a coupled static-dynamic cyclic loading test system. J. Cent. South Univ. Sci. Technol. 2021, 52, 2817–2827. [Google Scholar]
  18. Wang, Q.Y.; Zhu, W.C.; Liu, H.L.; Niu, L.L.; Li, R.F. Size effect of long-term strength of sandstone under uniaxial compression. Rock Soil Mech. 2016, 37, 981–990. [Google Scholar]
  19. Ling, C.Y.; Li, X.; Zhang, H.; Li, S.D.; Hao, J.M.; Ma, C.F. Research on size effect of uniaxial compression properties of granite under medium and low strain rates. Chin. J. Rock Mech. Eng. 2013, 32, 528–536. [Google Scholar]
  20. Tatiana, D.; Martin, B.; Petra, D.; Renáta, A. Influence of specimen size and shape on the uniaxial compressive strength values of selected Western Carpathians rocks. Environ. Earth Sci. 2022, 81, 247. [Google Scholar]
  21. Jiang, J.J.; Deng, Z.G.; Ouyang, Z.H.; Zhang, N.B.; Wang, Y.; Zhang, G.H. Study on Precursory Characteristics of Acoustic Emission of Instable Failure Coal Body with Different Sizes. Saf. Coal Mines 2017, 48, 37–40. [Google Scholar]
  22. Hong, L.; Li, X.B.; Ma, C.D.; Yin, S.B.; Ye, Z.Y.; Liao, G.Y. Study on size effect of rock dynamic strength and strain rate sensitivity. Chin. J. Rock Mech. Eng. 2008, 27, 526–533. [Google Scholar]
  23. Meng, Q.B.; Han, L.J.; Pu., H.; Li, H.; Wen, S.Y.; Li, H. Experimental study on the effect of size effect and strain rate on rock mechanical properties. J. China Univ. Min. Technol. 2016, 45, 233–243. [Google Scholar]
  24. Qi, C.Z.; Wang, M.Y.; Bai, J.P.; Li, K.R. Mechanism underlying dynamic size effect on rock mass strength. Int. J. Impact Eng. 2014, 68, 1–7. [Google Scholar] [CrossRef]
  25. Pankov, I.; Asanov, V.; Beltyukov, N. Mechanism of Scale Effect in Saliferous Rock under Compression. Procedia Eng. 2017, 191, 918–924. [Google Scholar] [CrossRef]
  26. Li, G.C.; Sun, C.L.; He, J.T.; Sun, Y.T.; Dong, Y.X.; Zhao, H.S. Macro and meso scalesimulation study of the strength-weakening property of soft mudstone affected by water. J. China Univ. Min. Technol. 2019, 48, 935–942. [Google Scholar]
  27. Liu, B.S.; Zhang, J.S.; Du, Q.Z.; Tu, J.F. Size effect in rock shear strength. Chin. J. Rock Mech. Eng. 1998, 17, 611–614. [Google Scholar]
  28. Sun, C.; Liu, F.; Jiang, M.J.; Chen, H. Discrete element numerical simulation of size effect and end restraint of rock compressive strength. Chin. J. Rock Mech. Eng. 2014, 33 (Suppl. S2), 3421–3428. [Google Scholar]
  29. Li, S.L.; Liu, G.J.; Jia, R.F.; Xue, F.; Wang, K.Y. Study on friction effect and damage evolution of end face in uniaxial compression test. J. Min. Strat. Control Eng. 2021, 3, 99–108. [Google Scholar]
  30. Peng, J.; Wong, L.N.Y.; The, C.I. A re-examination of slenderness ratio effect on rock strength Insights from DEM grain-based modelling. Eng. Geol. 2018, 246, 245–254. [Google Scholar] [CrossRef]
  31. Chen, J.C.; Chemenda, A.I. Numerical simulation of true 3D rock tests with classical and new three invariant constitutive models focusing on the end effects. Arab. J. Sci. Eng. 2020, 45, 9367–9378. [Google Scholar] [CrossRef]
  32. Liu, G.; Xiao, F.K.; Qin, T. Rock mechanics characteristics and acoustic emission rule under small-size effect. Chin. J. Rock Mech. Eng. 2018, 37 (Suppl. S2), 3905–3917. [Google Scholar]
  33. You, M.Q.; Hua, A.Z. Damage in the form of rock specimens under uniaxial compression and the carrying of reduce. Chin. J. Rock Mech. Eng. 1998, 17, 292–296. [Google Scholar]
  34. Gong, F.Q.; Luo, Y.; Li, X.B.; Si, X.F.; Tao, M. Experimental simulation investigation on rockburst induced by spalling failure in deep circular tunnels. Tunn. Undergr. Space Technol. 2018, 81, 413–427. [Google Scholar] [CrossRef]
  35. Miao, J.L.; He, M.C.; Li, D.J.; Zeng, F.J.; Zhang, Q. Acoustic emission characteristics of granite under strain rockburst test and its macro-fracture mechanism. Chin. J. Rock Mech. Eng. 2009, 28, 1593–1603. [Google Scholar]
  36. Dong, L.J.; Zhang, Y.H.; Sun, D.Y.; Chen, Y.C.; Tang, Z. Stage characteristics of acoustic emission and identification of unstable crack state for granite fractures. Chin. J. Rock Mech. Eng. 2022, 41, 120–131. [Google Scholar]
  37. Jia, X.N. Experimental Study on Acoustic Emission Eigen Frequency Spectrum Features of Strain Bursts. Ph.D. Thesis, China University of Mining and Technology, Beijing, China, 2013. [Google Scholar]
  38. Cai, M.; Kaiser, P.K.; Morioka, H.; Minami, M.; Maejima, T.; Tasaka, Y.; Kurose, H. FLAC/PFC coupled numerical simulation of AE in large-scale underground excavations. Int. J. Rock Mech. Min. Sci. 2007, 44, 550–564. [Google Scholar] [CrossRef]
  39. Martin, C.D.; Maybee, W.G. The strength of hard-rock pillars. Int. J. Rock Mech. Min. Sci. 2000, 37, 1239–1246. [Google Scholar] [CrossRef]
  40. Qi, H.G.; Yu, J.H. Rationality and comprehensive unloading technology of deep high stress section coal pillars. J. China Coal Soc. 2018, 43, 3257–3264. [Google Scholar]
Figure 1. Schematic diagram of the loading of the test machine and the acoustic emission system.
Energies 15 05557 g001
Figure 2. The rock sample stress−strain curve of different ratios of height-to-diameter.
Energies 15 05557 g002
Figure 3. Influencing factors of rock size effect. (a) End-face friction effect (b) Distribution of primary defects in rock.
Energies 15 05557 g003
Figure 4. The peak strength of rock samples with different ratios of height−to−diameter.
Energies 15 05557 g004
Figure 5. Peak strain of rock samples with different ratios of height−to−diameter.
Energies 15 05557 g005
Figure 6. PFC2D model and loading diagram.
Energies 15 05557 g006
Figure 7. Failure forms of sandstone with different height-to-diameter ratios. (a) L/D = 1.6 (b) L/D = 1.8 (c) L/D = 2.0 (d) L/D = 2.2.
Energies 15 05557 g007
Figure 8. Ringing count rate-axial stress-cumulative energy-time curve of rock samples with with different height−diameter ratios.
Energies 15 05557 g008
Figure 9. Peak frequency-b value-axial stress-time curve of rock samples with different height−diameter ratios.
Energies 15 05557 g009
Figure 10. Damage evolution curves of samples with different height to diameter ratios.
Energies 15 05557 g010
Figure 11. Analysis of damage stages of samples with different height-to-diameter ratios.
Energies 15 05557 g011
Table 1. Mechanical parameter of rock samples of different ratios of height to diameter.
Sample NumberSample Diameter × Height (mm × mm)Sample Cross-Sectional Area (mm2)Peak Strength (MPa)Peak Strain (104 m)Elastic Modulus (GPa)
A1.6-150.26 × 80.881983.97193.3828.6114.82
A1.6-250.28 × 81.051985.55194.8925.8614.54
A1.6-350.39 × 79.581994.24192.6728.9813.14
B1.8-150.25 × 90.771983.18155.2618.9415.27
B1.8-250.32 × 89.651988.71136.5318.9716.13
B1.8-350.11 × 91.181972.14149.5620.2115.40
C2.0-150.20 × 99.881979.23120.3918.3315.74
C2.0-250.15 × 100.971975.29111.6616.2013.73
C2.0-350.30 × 99.581987.13114.0218.7413.11
D2.2-150.07 × 111.321968.99107.4920.0410.80
D2.2-250.15 × 109.641975.29108.9317.2914.67
D2.2-350.16 × 112.121976.08107.1218.3812.81
Table 2. Basic mesoscopic parameters of PFC numerical simulation.
Mesoscopic ParametersTake Value
Particle radius (mm)0.23~0.299
Damping ratio0.7
Porosity0.15
Particle density (kg·m−3)2661
Particle Contact Modulus (GPa)1 × 10⁹
Bonded internal friction angle (°)45
Friction coefficient between particles0.5
Normal contact stiffness (MPa)85.217
Tangential Contact Stiffness (MPa)71.014
Normal to Tangential Stiffness Ratio1.2
Publisher’s Note: MDPI stays neutral with regard to jurisdictional claims in published maps and institutional affiliations.

