
Decomposition and Decoupling Analysis of Carbon Emissions in Xinjiang Energy Base, China

 ,
,
Abstract
:1. Introduction
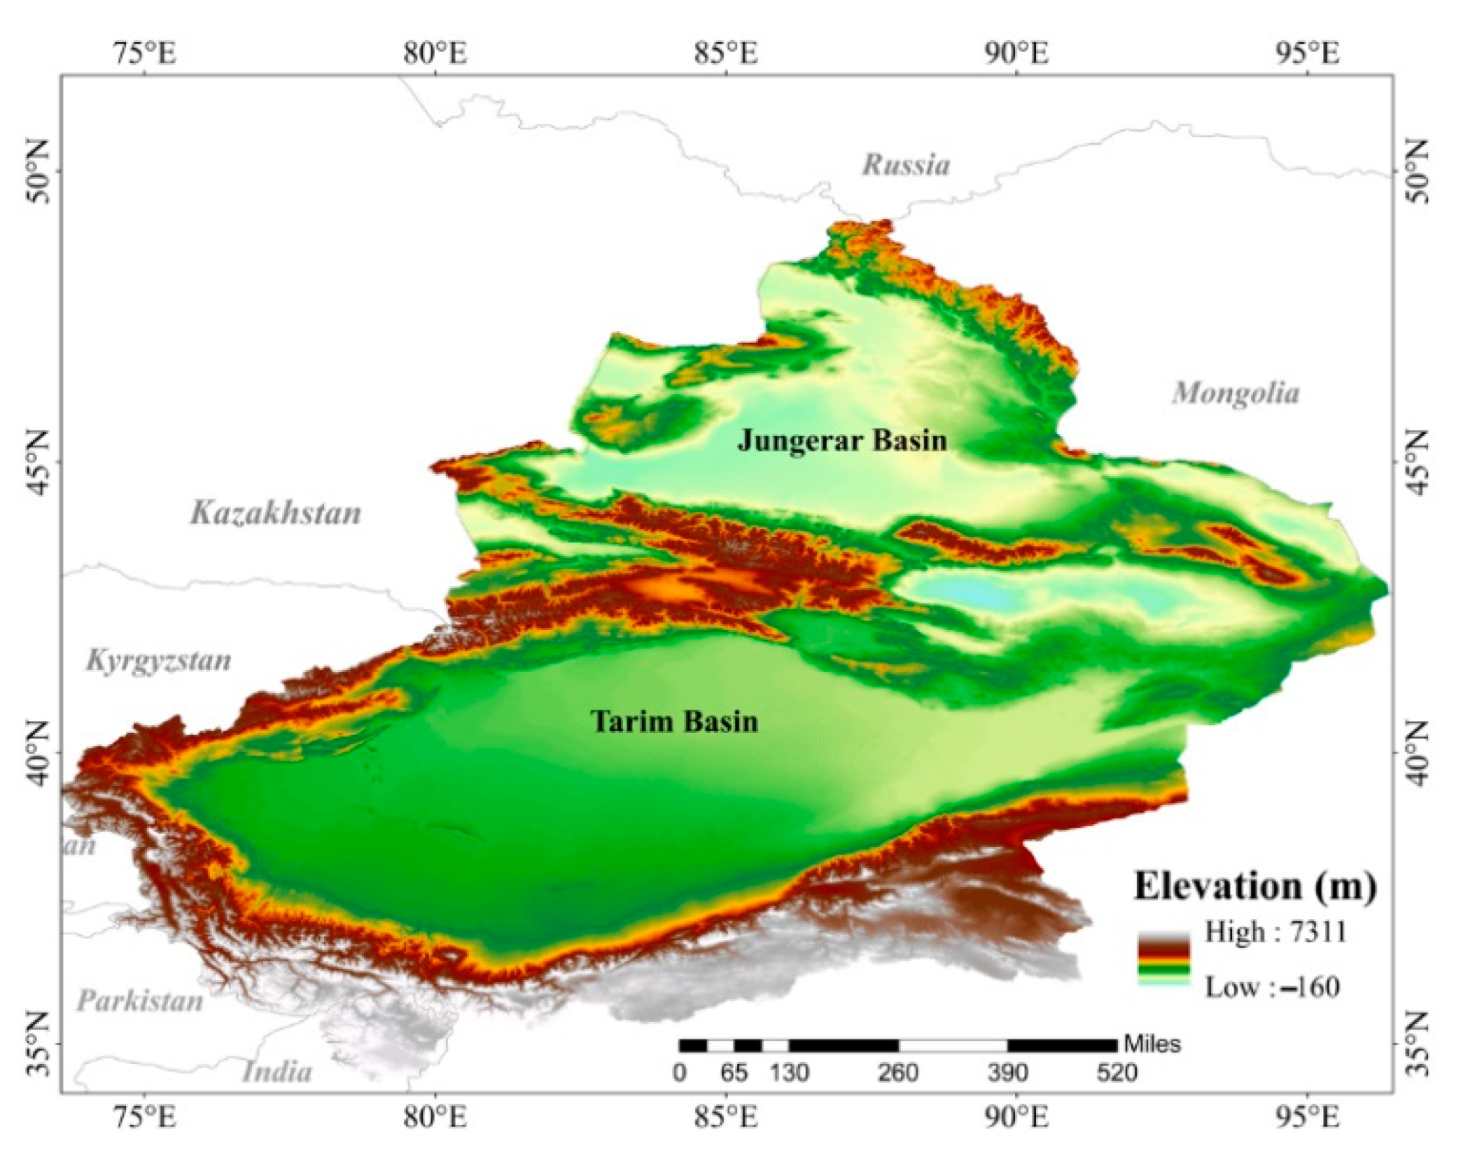
2. Study Area
3. Methodology and Data
3.1. Calculation of Carbon Emissions
3.2. Kaya Identity
3.3. Logarithmic Mean Divisia Index (LMDI)
3.4. Decoupling Model
3.5. Data Description
4. Results and Discussion
4.1. Change of Carbon Emissions in Xinjiang
4.2. Decomposition Analysis
4.3. Decoupling Analysis
4.3.1. Decoupling State
4.3.2. Decomposition of Decoupling
4.3.3. Decoupling State on Sectors
5. Conclusions and Policy Recommendations
5.1. Conclusions
- (1)
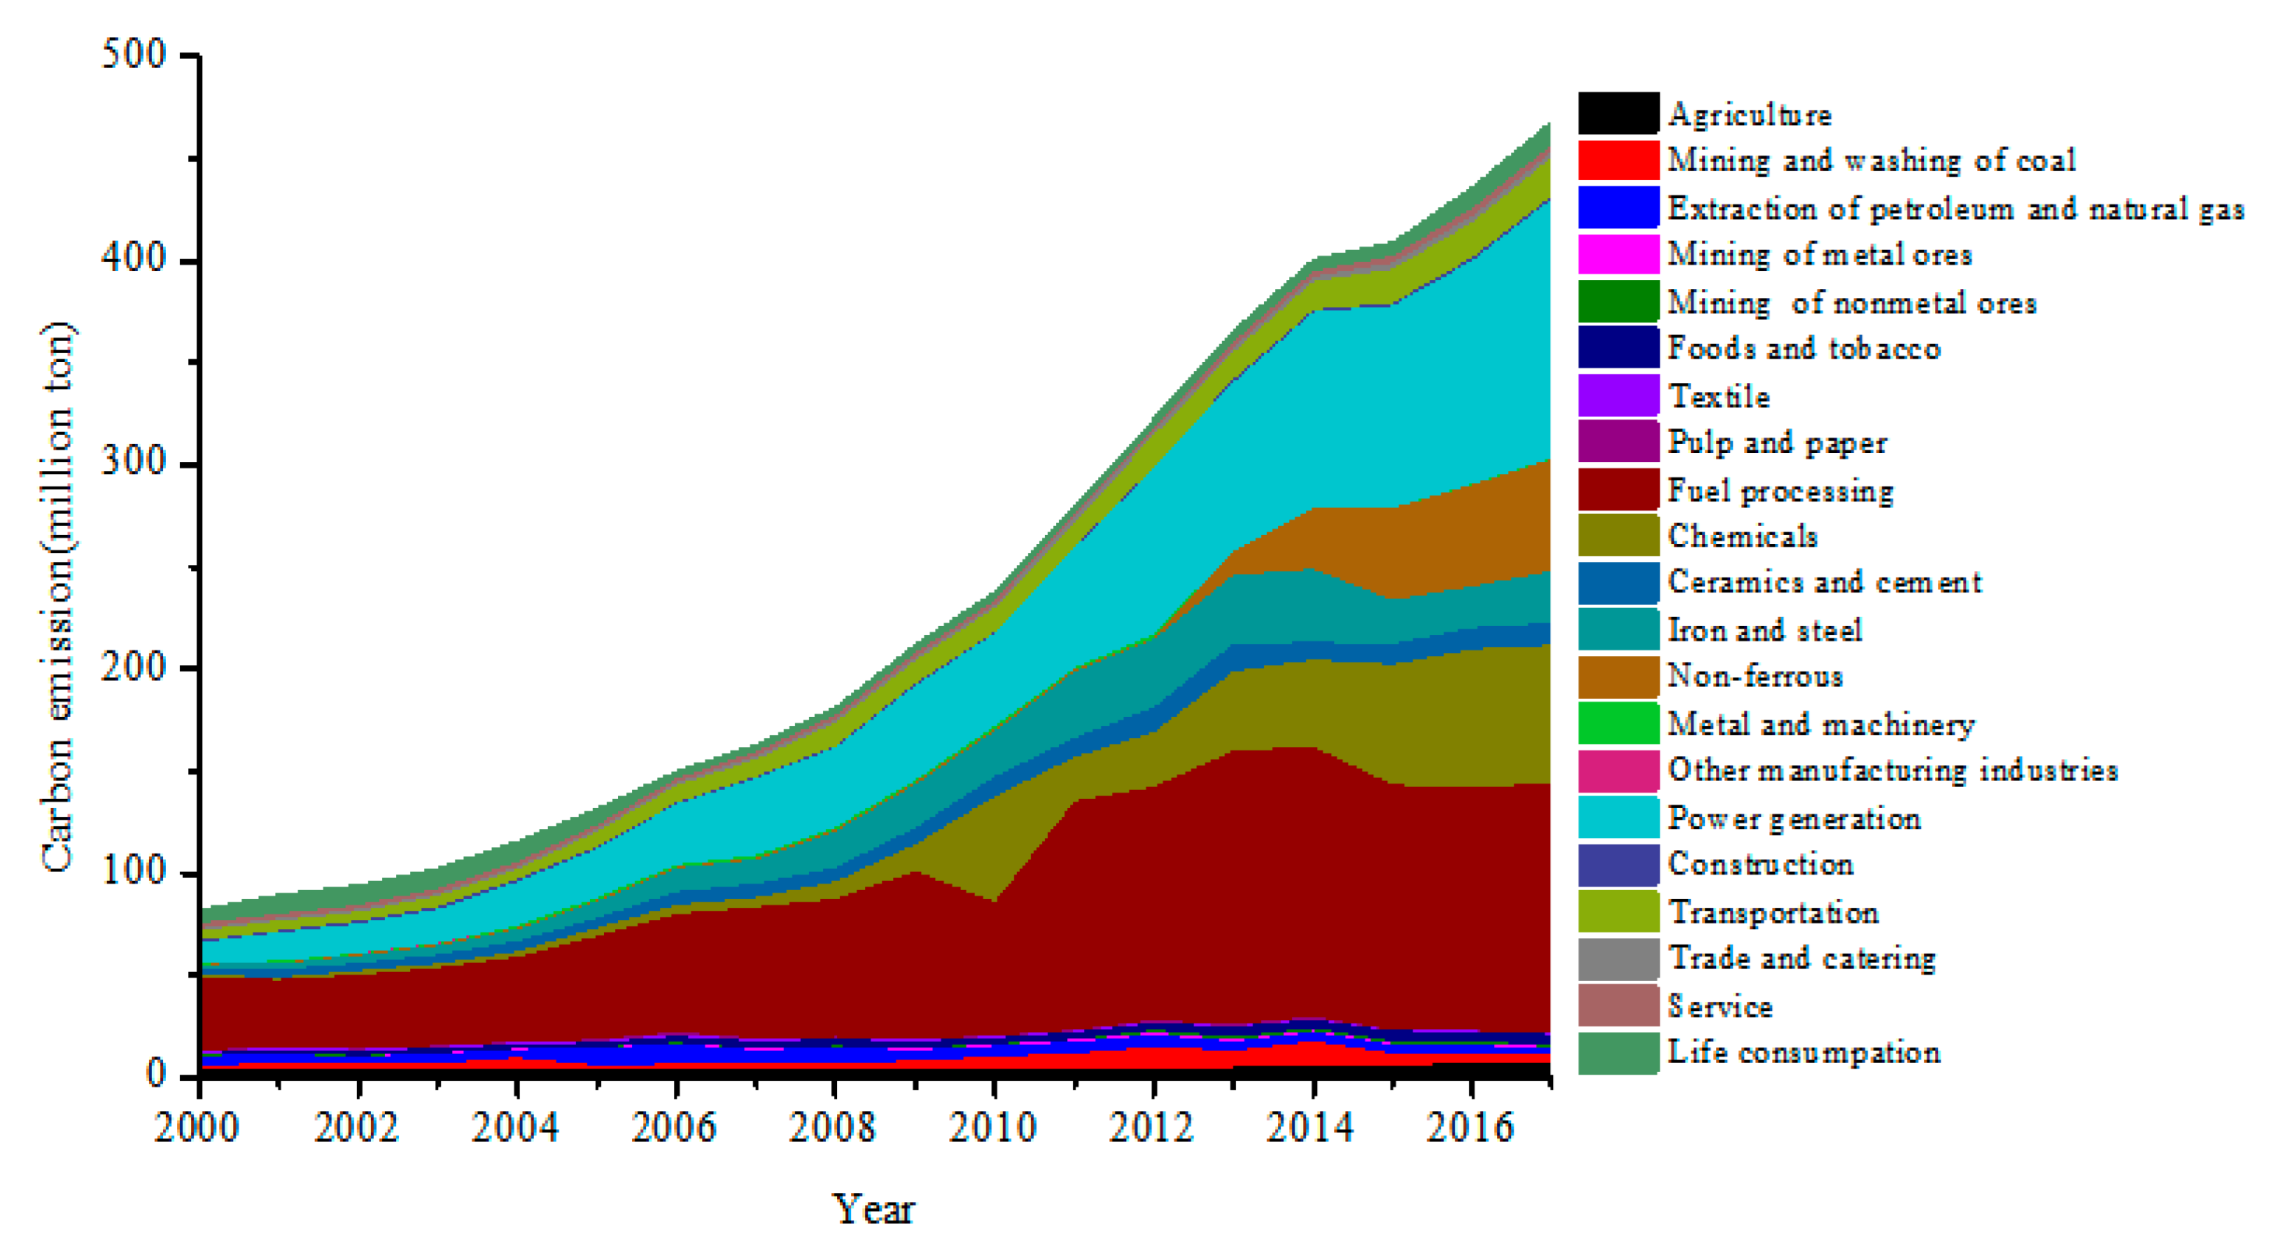
- Carbon emissions from Xinjiang increased from 93.34 Mt in 2000 to 468.12 Mt in 2017, with an increase of four times and an average annual growth rate of 10.68%. Energy-intensive industries are the key body of carbon emissions in Xinjiang. Fuel processing, power generation, chemicals, non-ferrous, iron and steel, ceramics, and cement accounted for 89.51% of total carbon emissions in 2017.
- (2)
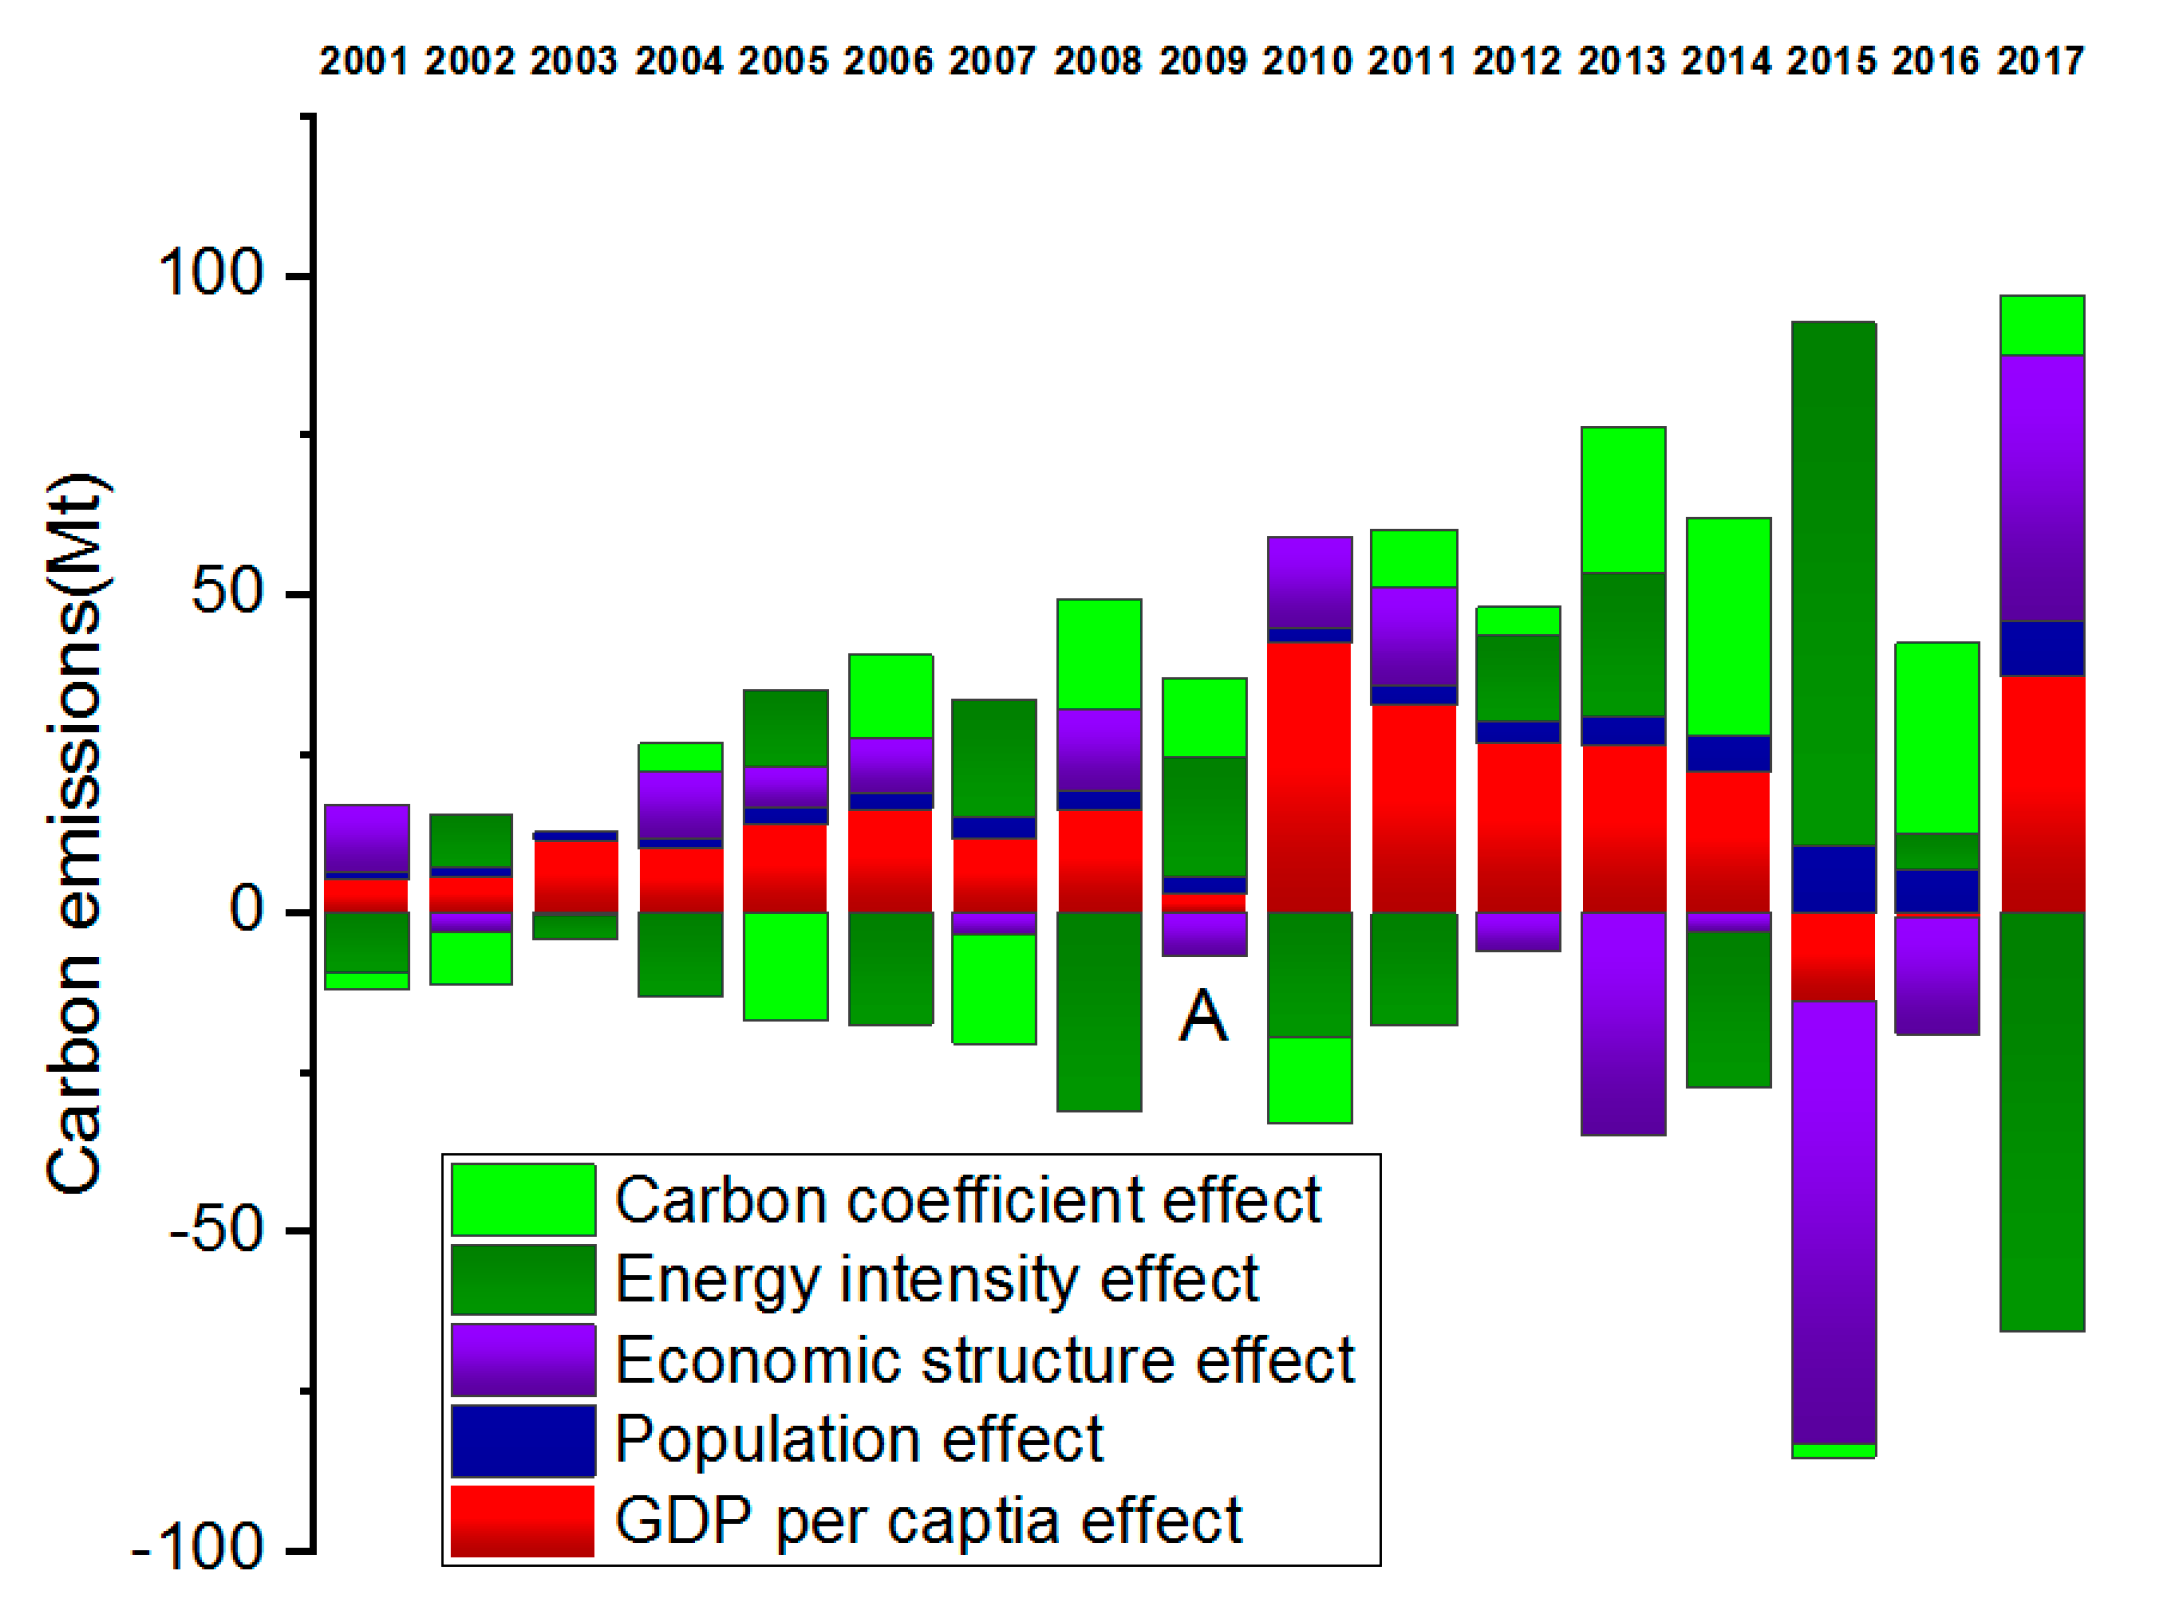
- GDP per capita effect was the key factor in the increase in carbon emissions. Population effect and economic structure effect were also the drivers of the carbon emissions increase. The energy intensity effect proved the major inhibiting factor for carbon emissions increase. The carbon coefficient effect was also another inhibiting factor for carbon emissions, but its effect was relatively weak.
- (3)
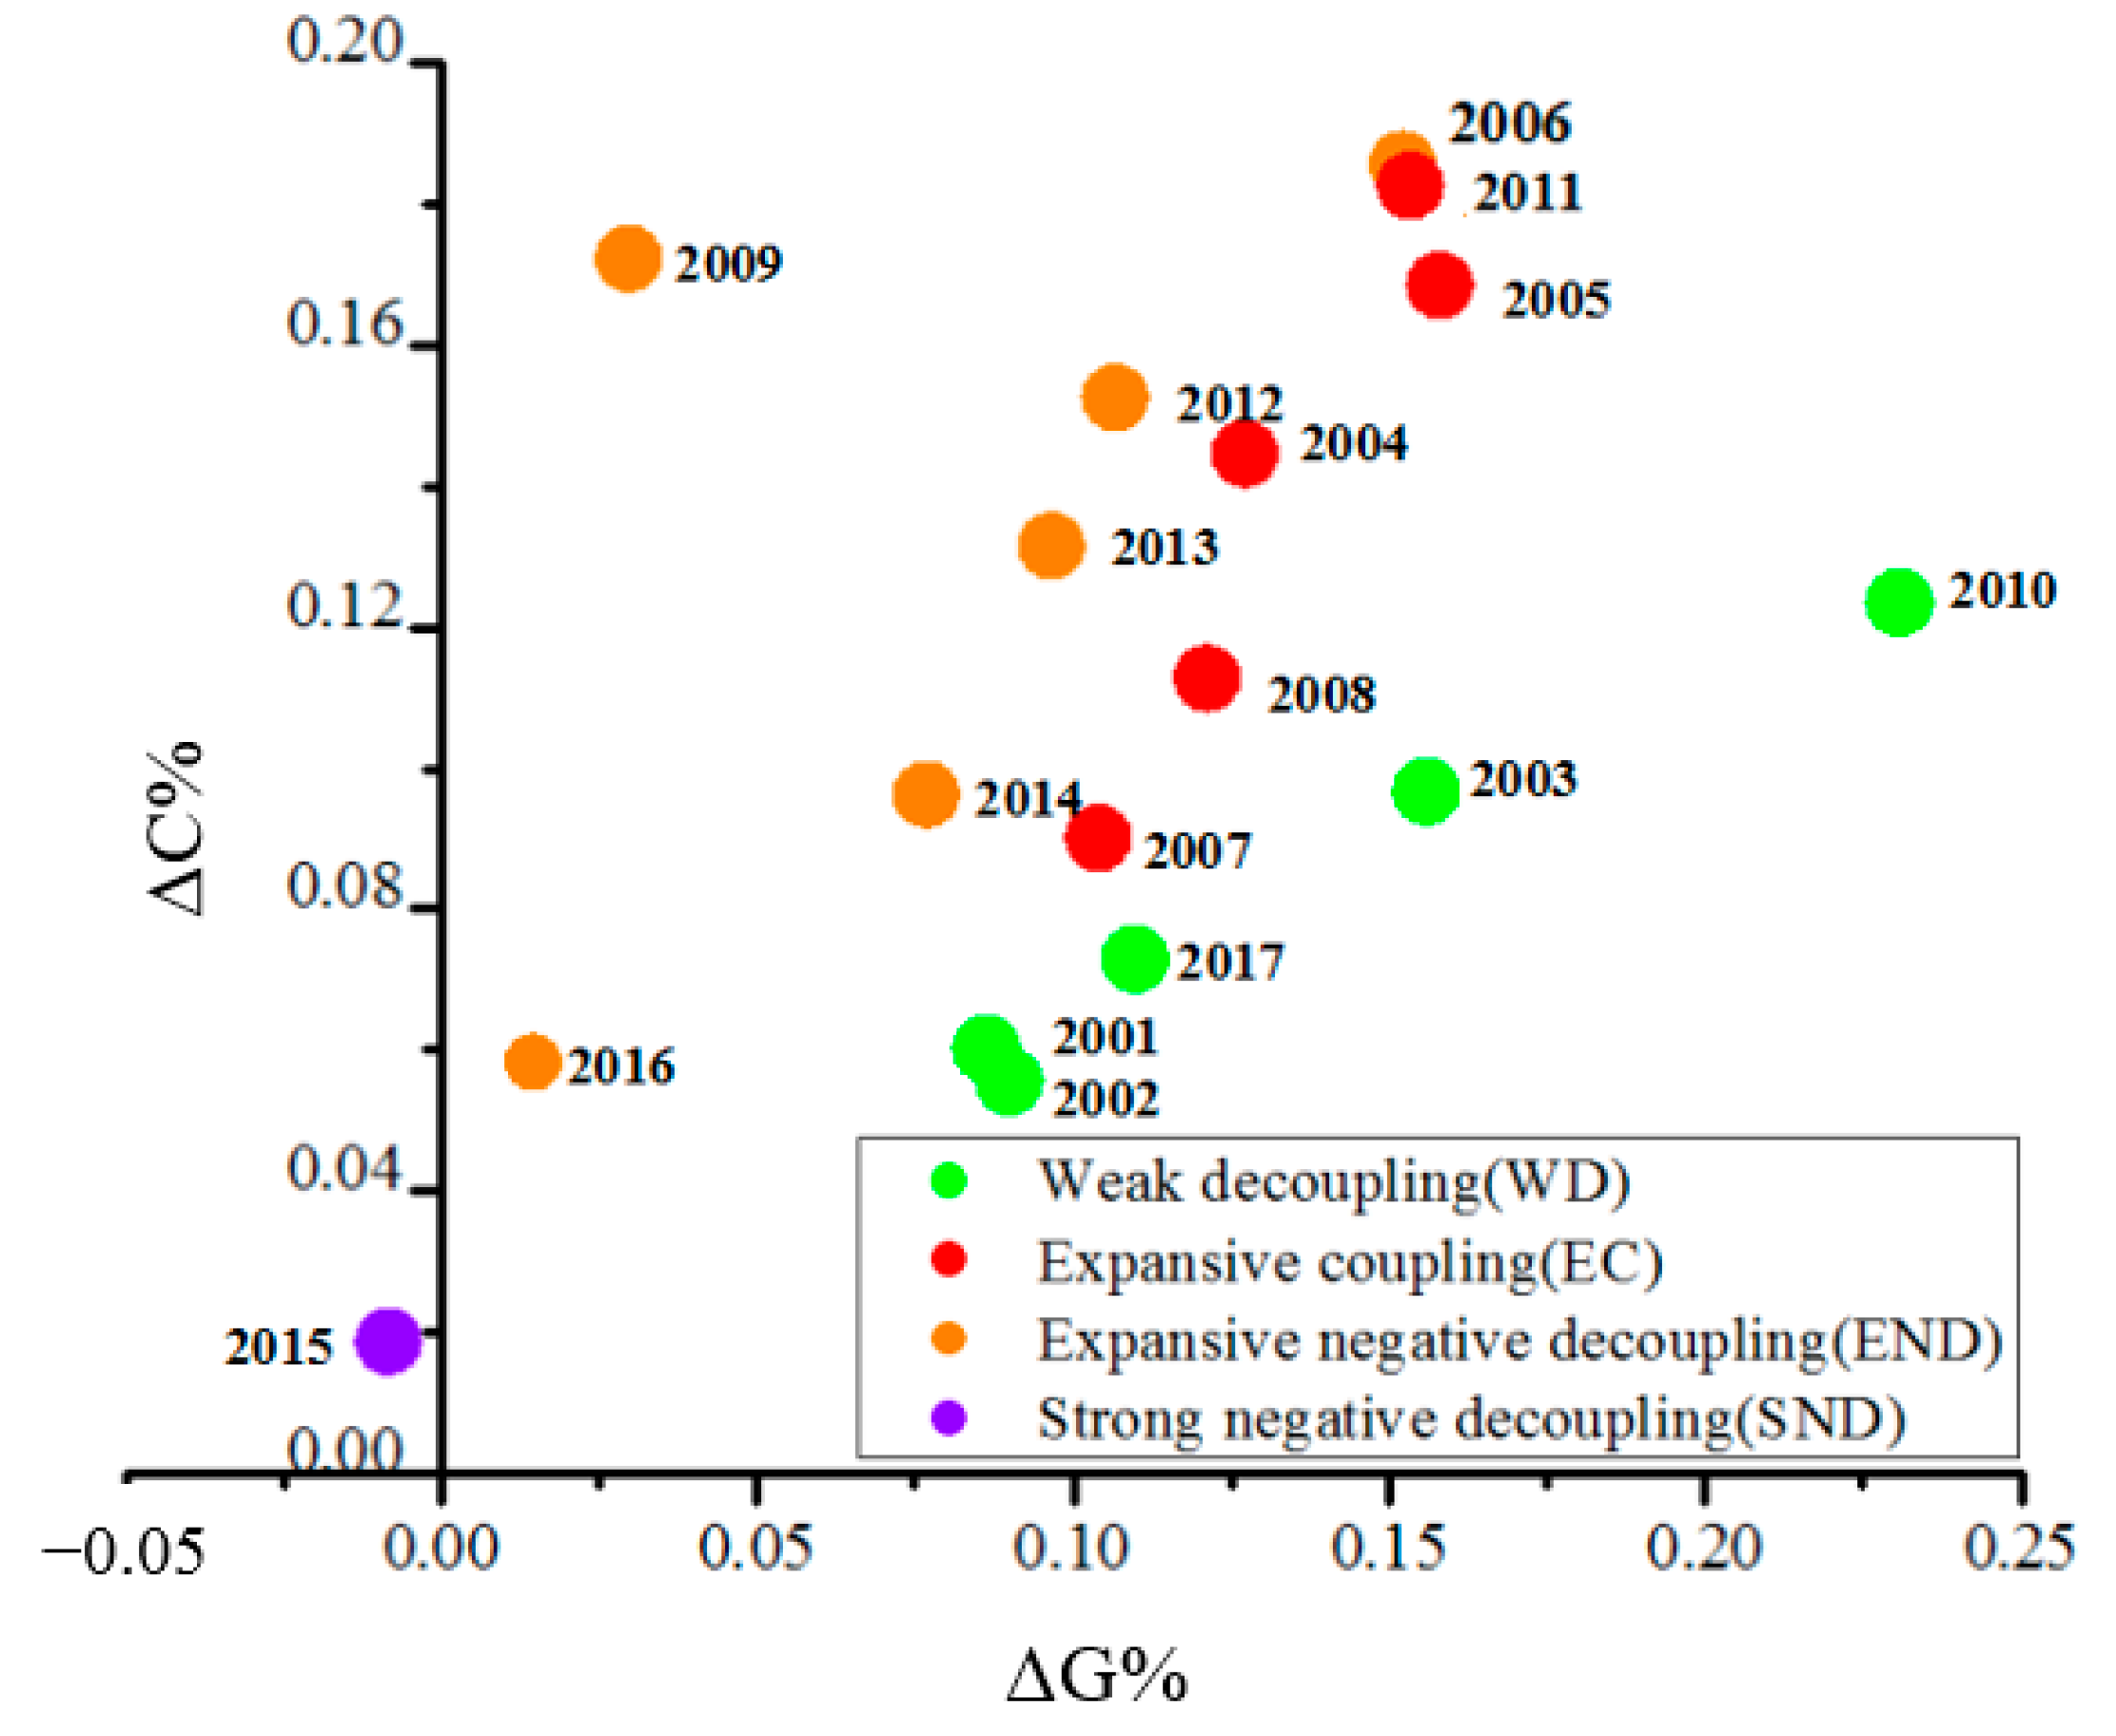
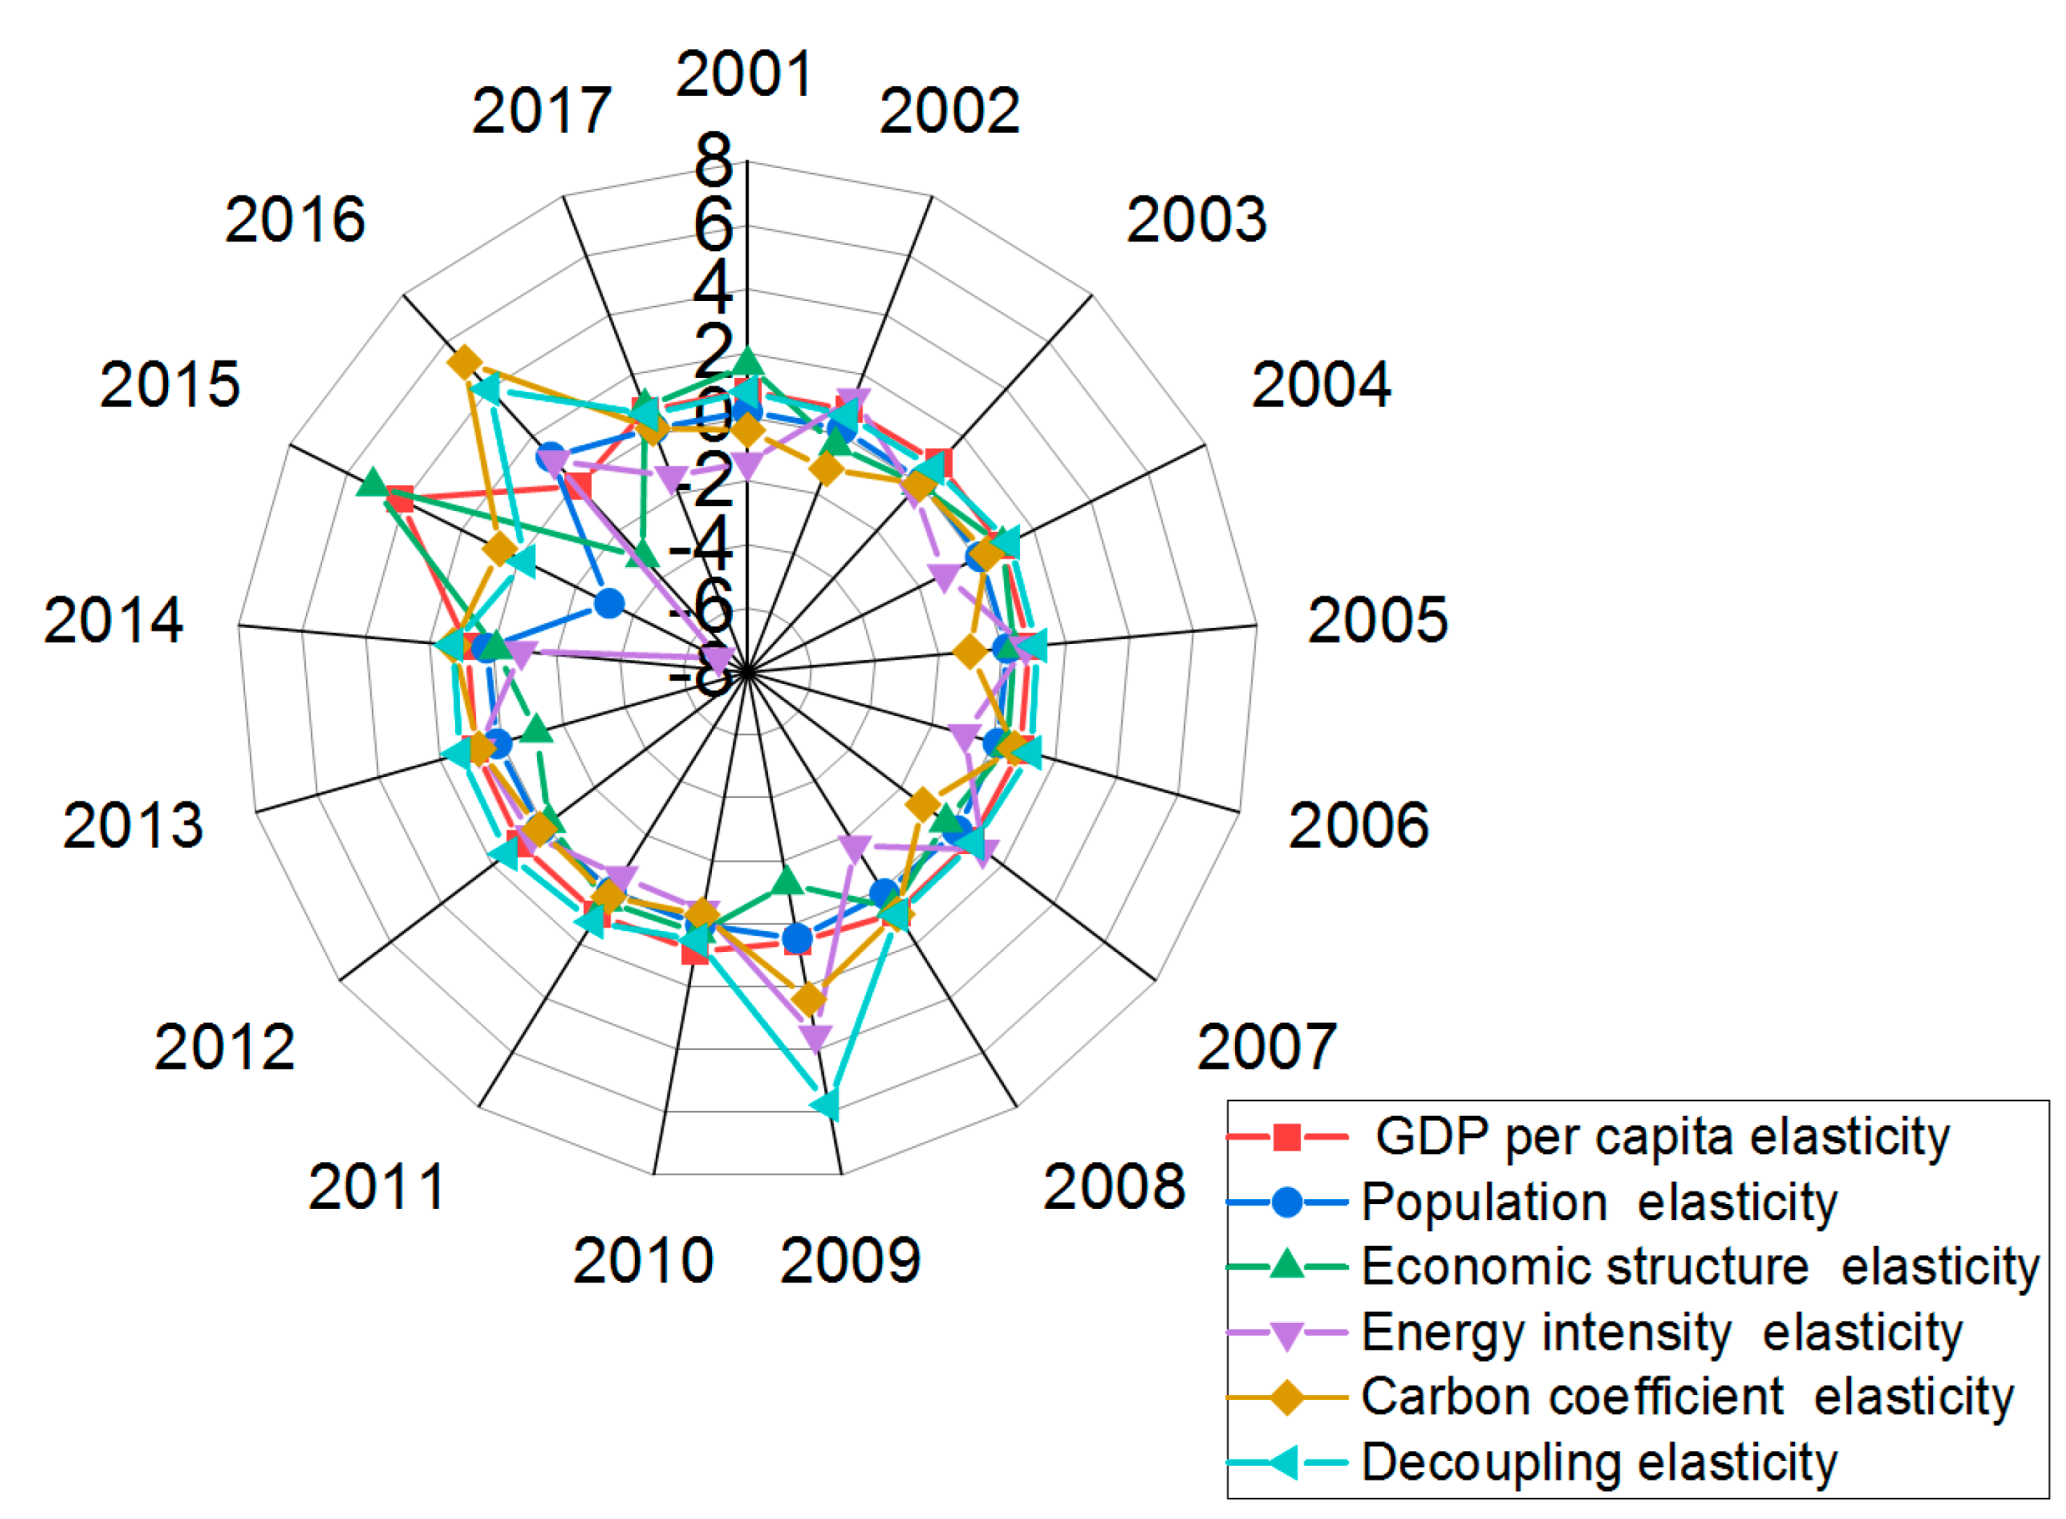
- WD, EC, END, and SND occurred in Xinjiang during 2001–2017. GDP per capita elasticity had a major inhibitory effect on the decoupling of carbon emissions. Population elasticity and economic structure elasticity were mainly WD. Energy intensity elasticity was the most important factor in the decoupling in Xinjiang. Most industries have not reached the ideal decoupling state in Xinjiang. Energy-intensive industries mainly showed states of END and EC.
5.2. Policy Recommendations
- (1)
- Adjust the industrial structure. Xinjiang need to change the mode of industrial growth and speed up the process of “new industrialization”. The internal structure of energy-intensive industries should be optimized and adjusted in combination with the existing industrial, encourage the development of renewable energy, power generation, modern chemical manufacturing, equipment manufacturing, new materials, and reduce the energy related carbon emissions in the industrial sector.
- (2)
- Optimize the energy structure. The energy consumption structure dominated by coal is an important reason for the continuous growth of carbon emissions in Xinjiang. In addition to increasing the consumption proportion of oil and natural gas, Xinjiang should also expand renewable energy at the same time to adjust the energy utilization structure. The development and distribution of wind and solar energy should be comprehensively planned to increase their use.
- (3)
- Promote energy conservation and emission reduction. The energy efficiency of key industries in Xinjiang is significantly lower than the national average, reflecting the great potential of energy conservation and emission reduction in Xinjiang. Energy-intensive industries should be committed to technological innovation and upgrading in key industries. It is also effective to eliminate backward enterprises or introduce clean technology to improve energy efficiency.
Author Contributions
Funding
Institutional Review Board Statement
Informed Consent Statement
Data Availability Statement
Conflicts of Interest
References
- IPCC. Climate Change 2013: The Physical Science Basis; Cambridge University Press: Cambridge, MA, USA; New York, NY, USA, 2013. [Google Scholar]
- IPCC. Climate Change 2021: The Physical Science Basis; Cambridge University Press: Cambridge, MA, USA; New York, NY, USA, 2021. [Google Scholar]
- Shuai, C.; Shen, L.; Jiao, L.; Wu, Y.; Tan, Y. Identifying key impact factors on carbon emission: Evidences from panel and time-series data of 125 countries from 1990 to 2011. Appl. Energy 2017, 187, 310–325. [Google Scholar] [CrossRef]
- Gasbarro, F.; Iraldo, F.; Daddi, T. The drivers of multinational enterprises’ climate change strategies: A quantitative study on climate-related risks and opportunities. J. Clean. Prod. 2017, 160, 8–26. [Google Scholar] [CrossRef]
- Wu, H.; Liang, H.; Roy, K.; Harrison, E.; Fang, Z.; De Silva, K.; Collins, N.; Lim, J.B.P. Analyzing the Climate Change Potential of Residential Steel Buildings in New Zealand and Their Alignment in Meeting the 2050 Paris Agreement Targets. Buildings 2022, 12, 290. [Google Scholar] [CrossRef]
- Qin, J.; Tao, H.; Zhan, M.; Munir, Q.; Brindha, K.; Mu, G. Scenario Analysis of Carbon Emissions in the Energy Base, Xinjiang Autonomous Region, China. Sustainability 2019, 11, 4220. [Google Scholar] [CrossRef] [Green Version]
- Liu, D.; Xiao, B. Can China achieve its carbon emission peaking? A scenario analysis based on STIRPAT and system dynamics model. Ecol. Indic. 2018, 93, 647–657. [Google Scholar] [CrossRef]
- Liu, Z.; Guan, D.; Wei, W.; Davis, S.J.; Ciais, P.; Bai, J.; Peng, S.; Zhang, Q.; Hubacek, K.; Marland, G. Reduced carbon emission estimates from fossil fuel combustion and cement production in China. Nature 2015, 524, 335. [Google Scholar] [CrossRef] [Green Version]
- Shan, Y.; Guan, D.; Liu, J.; Mi, Z.; Liu, Z.; Liu, J.; Schroeder, H.; Cai, B.; Chen, Y.; Shao, S. Methodology and applications of city level CO2 emission accounts in China. J. Clean. Prod. 2017, 161, 1215–1225. [Google Scholar] [CrossRef] [Green Version]
- Liu, X.; Li, S. A comparison analysis of the decoupling carbon emissions from economic growth in three industries of Heilongjiang province in China. Environ. Sci. Pollut. R. 2021, 28, 65200–65215. [Google Scholar] [CrossRef]
- Zhang, X.; Zhao, Y.; Wang, C.; Wang, F.; Qiu, F. Decoupling effect and sectoral attribution analysis of industrial energy-related carbon emissions in Xinjiang, China. Ecol. Indic. 2018, 97, 1–9. [Google Scholar] [CrossRef]
- Ahmad, N.; Du, L.; Lu, J.; Wang, J.; Li, H.; Hashmi, M. Modelling the CO2 emissions and economic growth in Croatia: Is there any environmental Kuznets curve? Energy 2017, 123, 164–172. [Google Scholar] [CrossRef]
- Wu, R.; Dong, J.; Zhou, L.; Zhang, L. Regional Distribution of Carbon Intensity and its Driving Factors in China: An Empirical Study Based on Provincial Data. Pol. J. Environ. Stud. 2018, 27, 1331–1341. [Google Scholar] [CrossRef]
- Zhang, P.; He, J.; Hong, X.; Zhang, W.; Qin, C.; Pang, B.; Li, Y.; Liu, Y. Regional-Level Carbon Emissions Modelling and Scenario Analysis: A STIRPAT Case Study in Henan Province, China. Sustainability 2017, 9, 2342. [Google Scholar] [CrossRef] [Green Version]
- Tapio, P. Towards a theory of decoupling: Degrees of decoupling in the EU and the case of road traffic in Finland between 1970 and 2001. Transp. Policy 2005, 12, 137–151. [Google Scholar] [CrossRef] [Green Version]
- Chen, J.; Wang, P.; Cui, L.; Huang, S.; Song, M. Decomposition and decoupling analysis of CO2 emissions in OECD. Appl. Energy 2018, 231, 937–950. [Google Scholar] [CrossRef]
- Wang, Q.; Jiang, R. Is china’s economic growth decoupled from carbon emissions? J. Clean. Prod. 2019, 225, 1194–1208. [Google Scholar] [CrossRef]
- Wang, F.; Xu, H. Decoupling elasticity of carbon emissions and economic growth of transportation industry in Zhejiang province and its influencing factors. J. Environ. Prot. Ecol. 2021, 22, 750–759. [Google Scholar]
- Wang, Y.; Xie, T.; Yang, S. Carbon emission and its decoupling research of transportation in Jiangsu Province. J. Clean. Prod. 2017, 142, 907–914. [Google Scholar] [CrossRef]
- Jin, B.; Han, Y. Influencing factors and decoupling analysis of carbon emissions in China’s manufacturing industry. Environ. Sci. Pollut. R. 2021, 28, 64719–64738. [Google Scholar] [CrossRef] [PubMed]
- Wu, Y.; Chau, K.; Lu, W.; Shen, L.; Shuai, C.; Chen, J. Decoupling relationship between economic output and carbon emission in the Chinese construction industry. Environ. Impact Assess. 2018, 71, 60–69. [Google Scholar] [CrossRef]
- Luo, Y.; Long, X.; Wu, C.; Zhang, J. Decoupling CO2 emissions from economic growth in agricultural sector across 30 Chinese provinces from 1997 to 2014. J. Clean. Prod. 2017, 159, 220–228. [Google Scholar] [CrossRef]
- Zhang, M.; Wang, W. Decouple indicators on the CO2 emission-economic growth linkage: The Jiangsu Province case. Ecol. Indic. 2013, 32, 239–244. [Google Scholar] [CrossRef]
- Zhao, X.; Zhang, X.; Li, N.; Shao, S.; Geng, Y. Decoupling economic growth from carbon dioxide emissions in China: A sectoral factor decomposition analysis. J. Clean. Prod. 2017, 142, 350–356. [Google Scholar] [CrossRef]
- Miao, W.; Chao, F. Using an extended logarithmic mean Divisia index approach to assess the roles of economic factors on industrial CO2 emissions of China. Energy Econ. 2018, 76, 101–114. [Google Scholar]
- Li, K.; Lin, B. The improvement gap in energy intensity: Analysis of China′s thirty provincial regions using the improved DEA (data envelopment analysis) model. Energy 2015, 84, 589–599. [Google Scholar] [CrossRef]
- Wang, C.J.; Fei, W. Examining the driving factors of energy related carbon emissions using the extended STIRPAT model based on IPAT identity in Xinjiang. Renew. Sustain. Energy Rev. 2017, 67, 51–61. [Google Scholar] [CrossRef]
- Guo, B.; Geng, Y.; Dong, H.; Liu, Y. Energy-related greenhouse gas emission features in China’s energy supply region: The case of Xinjiang. Renew. Sustain. Energy Rev. 2016, 54, 15–24. [Google Scholar] [CrossRef]
- Qin, J.; Tao, H.; Cheng, C.; Brindha, K.; Zhan, M.; Ding, J.; Mu, G. Analysis of Factors Influencing Carbon Emissions in the Energy Base, Xinjiang Autonomous Region, China. Sustainability 2020, 12, 1089. [Google Scholar] [CrossRef] [Green Version]
- Shan, Y.; Liu, J.; Liu, Z.; Xu, X.; Shao, S.; Wang, P.; Guan, D. New provincial CO2 emission inventories in China based on apparent energy consumption data and updated emission factors. Appl. Energy 2016, 184, 742–750. [Google Scholar] [CrossRef] [Green Version]
- Huo, J.; Yang, D.; Zhang, W.; Wang, F.; Wang, G.; Fu, Q. Analysis of influencing factors of CO2 emissions in Xinjiang under the context of different policies. Environ. Sci. Policy 2015, 45, 20–29. [Google Scholar] [CrossRef]
- Wang, C.; Wang, F. Structural Decomposition Analysis of Carbon Emissions and Policy Recommendations for Energy Sustainability in Xinjiang. Sustainability 2015, 7, 7548–7567. [Google Scholar] [CrossRef] [Green Version]
- Xia, F.; Zhang, X.; Cai, T.; Wu, S.; Zhao, D. Identification of key industries of industrial sector with energy-related CO2 emissions and analysis of their potential for energy conservation and emission reduction in Xinjiang, China. Sci. Total Environ. 2020, 708, 134587. [Google Scholar] [CrossRef] [PubMed]
- Wang, C.; Wang, F.; Zhang, X.; Zhang, H. Influencing mechanism of energy-related carbon emissions in Xinjiang based on IO-SDA model. J. Geogr. Sci. 2016, 71, 1105–1118. [Google Scholar]
- Wang, H.K.; Zhang, Y.X.; Lu, X.; Nielsen, C.P.; Bi, J. Understanding China’s carbon dioxide emissions from both production and consumption perspectives. Renew. Sustain. Energ. Rev. 2015, 52, 189–200. [Google Scholar] [CrossRef]
- Yang, Z.; Liu, Y. Does population have a larger impact on carbon dioxide emissions than income? Evidence from a cross-regional panel analysis in China. Appl. Energy 2016, 180, 800–809. [Google Scholar]
- IPCC. IPCC Guidelines for National Greenhouse Gas Inventories; Institute for Global Environmental Strategies Press: Kanagawa, Japan, 2006. [Google Scholar]
- Xinjiang Bureau of Statistics. Xinjiang Statistical Yearbook; Peking Info. Press: Beijing, China, 1991–2017. (In Chinese)


| GDP Per Captia Effect | Population Effect | Economic Structure Effect | Energy Intensity Effect | Carbon Coefficient Effect | |
|---|---|---|---|---|---|
| 2000–2005 | 46.63 | 7.83 | 24.25 | −5.10 | −23.78 |
| 2005–2010 | 90.01 | 13.53 | 25.57 | −30.79 | 12.11 |
| 2010–2017 | 130.35 | 42.16 | −74.13 | 15.80 | 108.17 |
| Year | ΔC% | ΔG% | D | Decoupling State |
|---|---|---|---|---|
| 2001 | 0.06 | 0.09 | 0.70 | WD |
| 2002 | 0.06 | 0.09 | 0.62 | WD |
| 2003 | 0.10 | 0.16 | 0.62 | WD |
| 2004 | 0.14 | 0.13 | 1.14 | EC |
| 2005 | 0.17 | 0.16 | 1.07 | EC |
| 2006 | 0.19 | 0.15 | 1.22 | END |
| 2007 | 0.09 | 0.10 | 0.87 | EC |
| 2008 | 0.11 | 0.12 | 0.93 | EC |
| 2009 | 0.17 | 0.03 | 5.81 | END |
| 2010 | 0.12 | 0.23 | 0.54 | WD |
| 2011 | 0.18 | 0.15 | 1.19 | EC |
| 2012 | 0.15 | 0.11 | 1.43 | END |
| 2013 | 0.13 | 0.10 | 1.36 | END |
| 2014 | 0.10 | 0.08 | 1.25 | END |
| 2015 | 0.02 | −0.01 | −2.25 | SND |
| 2016 | 0.06 | 0.01 | 4.01 | END |
| 2017 | 0.07 | 0.11 | 0.66 | WD |
 | 2001 | 2002 | 2003 | 2004 | 2005 | 2006 | 2007 | 2008 | 2009 | 2010 | 2011 | 2012 | 2013 | 2014 | 2015 | 2016 | 2017 |
|---|---|---|---|---|---|---|---|---|---|---|---|---|---|---|---|---|---|
| Agriculture | RD | WD | SD | WD | EC | END | SD | WD | WD | SD | SND | WD | END | END | SND | END | SD |
| Mining and washing of coal | END | WD | EC | END | RD | WD | END | WD | WD | END | EC | END | RD | END | RD | RD | SD |
| Extraction of petroleum and natural gas | SND | RD | EC | SD | END | WD | RD | END | WND | SD | WD | SND | RD | RC | WND | WND | SD |
| Mining of metal ores | EC | EC | WD | SND | EC | WD | SND | END | SD | WD | END | WD | SND | WND | WND | RC | SND |
| Mining of nonmetal ores | RD | SD | SD | RD | SND | EC | SND | SD | SND | SD | WD | SND | SD | SD | WND | WND | WD |
| Foods and tobacco | END | END | SD | SD | RD | END | WD | SD | WD | SD | END | SD | END | SD | END | SND | SND |
| Textile | SND | SD | SND | SD | SD | END | SD | WND | SND | SD | END | SND | RD | SD | END | SD | EC |
| Pulp and paper | EC | SND | WD | END | SND | END | SD | RD | RD | WD | SND | WD | SND | END | SD | WD | SND |
| Fuel processing | SD | SND | WD | WD | WD | WD | SND | WD | SND | SD | END | SND | SND | WND | WND | WND | WD |
| Chemicals | SD | END | WD | EC | END | WD | WD | END | END | END | SD | END | END | END | SND | END | SD |
| Ceramics and cement | END | WD | WD | SND | RC | END | WD | WD | EC | WD | SD | END | END | SD | SND | WD | WD |
| Iron and steel | WD | WD | END | WD | END | END | WD | EC | SND | WD | END | END | WND | SND | RC | RD | WD |
| Non-ferrous | SND | END | SD | RD | END | WD | WD | RD | SND | WD | SD | SD | END | END | END | END | WD |
| Metal and machinery | EC | SD | WND | END | SND | END | WD | SD | WD | EC | SD | END | SD | RD | SND | WND | END |
| Other manufacturing industries | END | RD | WD | SD | END | WD | WD | SD | SD | END | SND | SND | END | SD | SD | SND | SND |
| Power generation | END | WD | END | EC | WD | EC | END | WD | END | SD | EC | END | WD | WD | SND | SND | WD |
| Construction | SD | WD | EC | WD | SD | WD | SD | WD | WD | SD | EC | WD | END | WD | WD | WD | WD |
| Transportation | SND | SD | SND | SD | SND | END | END | END | SD | END | WD | WD | SD | WD | END | EC | WD |
| Trade and catering | SD | WD | EC | WD | WND | END | WD | WD | WD | WD | SD | WD | EC | RD | SND | WD | SD |
| Service | SD | WD | EC | SD | SD | WD | SD | SD | SD | WD | WD | SD | EC | WD | END | END | SD |
Publisher’s Note: MDPI stays neutral with regard to jurisdictional claims in published maps and institutional affiliations. |
© 2022 by the authors. Licensee MDPI, Basel, Switzerland. This article is an open access article distributed under the terms and conditions of the Creative Commons Attribution (CC BY) license (https://creativecommons.org/licenses/by/4.0/).
Share and Cite
Qin, J.; Gao, L.; Tu, W.; He, J.; Tang, J.; Ma, S.; Zhao, X.; Zhu, X.; Brindha, K.; Tao, H. Decomposition and Decoupling Analysis of Carbon Emissions in Xinjiang Energy Base, China. Energies 2022, 15, 5526. https://doi.org/10.3390/en15155526
Qin J, Gao L, Tu W, He J, Tang J, Ma S, Zhao X, Zhu X, Brindha K, Tao H. Decomposition and Decoupling Analysis of Carbon Emissions in Xinjiang Energy Base, China. Energies. 2022; 15(15):5526. https://doi.org/10.3390/en15155526
Chicago/Turabian StyleQin, Jiancheng, Lei Gao, Weihu Tu, Jing He, Jingzhe Tang, Shuying Ma, Xiaoyang Zhao, Xingzhe Zhu, Karthikeyan Brindha, and Hui Tao. 2022. "Decomposition and Decoupling Analysis of Carbon Emissions in Xinjiang Energy Base, China" Energies 15, no. 15: 5526. https://doi.org/10.3390/en15155526
APA StyleQin, J., Gao, L., Tu, W., He, J., Tang, J., Ma, S., Zhao, X., Zhu, X., Brindha, K., & Tao, H. (2022). Decomposition and Decoupling Analysis of Carbon Emissions in Xinjiang Energy Base, China. Energies, 15(15), 5526. https://doi.org/10.3390/en15155526